 Saied Pirasteh1
 Abdul Samad2
 Rizwan Ahmad2*†
 L. N. Thakural3Haris Hasan Khan2Pankaj Chauhan4†Arina Khan5Mohammed Zaid Qamar2
- 1Institute of Artificial Intelligence, Shaoxing University, Shaoxing, Zhejiang Province, China
- 2Interdisciplinary Department of Remote Sensing and GIS Applications, Faculty of Science, Aligarh Muslim University, Aligarh, India
- 3Surface Water Hydrology Division, National Institute of Hydrology, Roorkee, India
- 4Department of Glaciology and Environmental Geology, Wadia Institute of Himalayan Geology, Dehradun, India
- 5Department of Geological Sciences, Columbian College of Arts and Sciences, George Washington University, Washington, DC, United States
Demarcation of the groundwater recharge prospective zones can be the foremost step in facilitating groundwater recharge in any terrain, as most nations have a major concern about unreasonable use of groundwater and declining the water table. To identify groundwater recharge zones in Haridwar district of Uttarakhand state in India, this study employs the integration of remote sensing data along with the Geographical Information System (GIS) and the Analytical Hierarchy Process (AHP) technique by incorporating remote sensing data acquired from different sources. Soil texture, slope, drainage density, land use/land cover (LULC), lithology, geomorphology, lineament density, topographic wetness index (TWI), and rainfall were analysed, and weights were assigned using the AHP technique to assess their impact on groundwater recharge. The study region has been divided into five possible groundwater recharge zones by using weighted overlay analysis: very high (0.82%), high (37.03%), moderate (40.22%), low (17.91%), and very low (4.02%). The verified groundwater recharge potential map for the study region has been validated with 30 existing bore wells. The efficacy of the method was confirmed by an Area Under Curve (AUC) calculated to be 71.08% with the evidence obtained, and the Receiver Operating Characteristic (ROC) curve is plotted. The findings facilitate the sustainable management of groundwater and the application of artificial recharge techniques in Haridwar.
1 Introduction
Groundwater, i.e., the water stored beneath the Earth’s surface in aquifers composed of gravel, sand, sandstone, or limestone, is crucial for maintaining global water resources (Earle, 2019). The aquifers are the saturated zone where water is stored, with its depth ranging from shallow to deep levels (Figure 1). Groundwater levels vary because of variability in precipitation that recharges the aquifers and the extraction of water by humans. The availability and accessibility of groundwater are vital in countries like India, where millions of people face water scarcity. India, with a population representing 17% of the world’s total, has access to only 4% of the global water resources. India is the world’s greatest consumer of groundwater, using around 230 cubic kilometres annually (The World Bank, 2024). However, the country has limited water resources. As most of the country’s population relies on groundwater for drinking and other uses, there is an increasing pressure on this limited share of groundwater reserves. Moreover, overexploitation is swiftly exhausting aquifers, putting water security and agricultural sustainability at risk. The total annual extractable groundwater of the country has been estimated at 397.62 BCM after considering the natural discharge, and the total annual groundwater extraction for all uses has been estimated at 244.92 BCM. The agriculture sector is the predominant consumer of groundwater. About 89% of total annual groundwater extraction, i.e., 217.61 BCM, is for irrigation use. Remaining around 27.3 BCM is for domestic and industrial use. The ratio of annual groundwater extraction to total annual extractable groundwater stated in percentage terms is called the stage of groundwater extraction. The overall stage of groundwater extraction in the country is 61.6% (Central Groundwater Board, 2021).
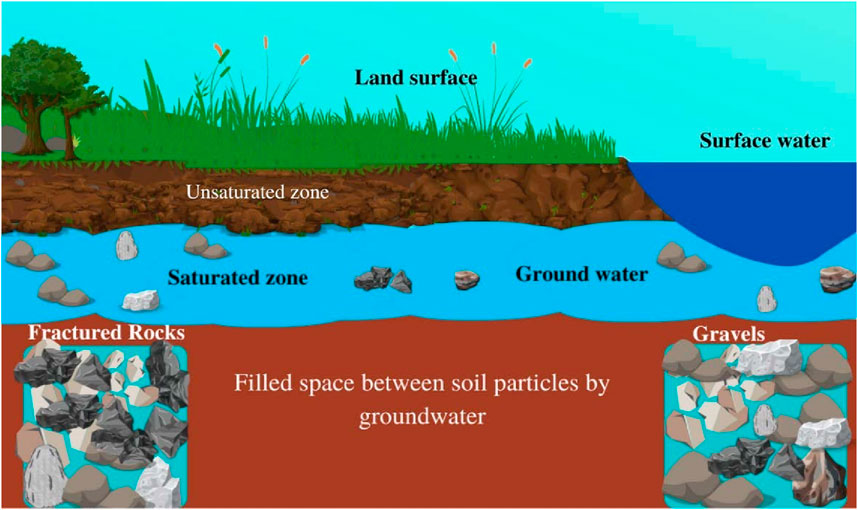
Figure 1. Visual representation of ground water and related terms.
India’s hydrogeological environments, critical for groundwater potential, are key to understanding the nation’s water resources. Peninsular India’s hard-rock aquifers dominate the central region, comprising around 65% of the total aquifer area (Mukherjee et al., 2015). These formations, though vast, exhibit limited recharge capacity due to low permeability, leading to significant water level declines. The alluvial aquifers of the Indo-Gangetic Plains, crucial for freshwater supply, face risks of irreversible depletion from overexploitation and slow replenishment rates (The World Bank, 2010).
The Himalayan regions, marked by metamorphosis and deformation phases, exhibit diverse groundwater characteristics, influenced by topography. Uttarakhand, lying in the middle and lower Himalayan region, has water resources of mainly glacial and riverine origin. Groundwater is limited and largely inaccessible due to mountainous topography. Geological formations of Northern Uttarakhand, known for their perpetual snow cover and Himalayan rivers such as the Yamuna and Ganga, range from the Archean to the Quaternary eras. Most of the state is hilly, although Haridwar, Udham Singh Nagar, and Dehradun stand out (State of Uttarakhand, Department of Horticulture and Food Processing and Japan International Cooperation Agency Nippon KOEI CO., LTD., 2022). Uttarakhand’s groundwater dynamics reflect this diversity. According to CGWB data, the state has a nearly 2.27 billion cubic meter annual reserve of replenishable groundwater, and net annual groundwater availability is 2.10 billion cubic meters Moreover, the state groundwater development stage is 66% (Central Ground Water Board, 2016).
The main tributaries of the Ganga River, including the Ban Ganga, Ratmau Rao, and Solani, as well as intermittent streams, drain the Haridwar district (Central Ground Water Board, 2016). The district is partially irrigated by a 300- kilometre network of canals, but Bhagwanpur Block is mostly dependent on groundwater because it is situated outside the canal command area, which causes notable drops in water levels (Irrigation Research Institute, Roorkee, 2017). The Bhagwanpur block, which has 225 state government and 32,930 private tube wells, is heavily exploited for groundwater for a variety of uses, especially in the centre and southern areas (Central Ground Water Board Annual Report, 2009). As of March 2004, Haridwar’s groundwater development stage was 96.40%, indicating critical conditions according to the Rainfall Infiltration Factor (RIF) method, which evaluates groundwater resources. Hydrogeological investigations conducted in Haridwar show constant water levels, apart from Bhagwanpur, where an alarming fall is noted (Central Ground Water Board, 2016). Groundwater depletion is made worse by fast industrial and urban growth, and overexploitation affects both the quantity and quality of groundwater.
Remotely sensed satellite imagery and an advanced geographic information system together help map groundwater and identify potential groundwater reserves, providing a cost-effective alternative to traditional ground surveys (Derdour et al., 2022). These technologies change the study of groundwater by allowing for rapid evaluation and control of water resources. Unequal distribution of groundwater resources in Haridwar coupled with diverse topography, resulted in limited access to groundwater. Moreover, urbanization and industrialization in recent years have resulted in an increasing demand for groundwater. Integration of remote sensing and GIS with advanced weightage methods, such as the Analytical Hierarchy Process (AHP), helps find appropriate locations for groundwater recharge, particularly in places where data is lacking (Kamaraj et al., 2023).
The present study incorporates this approach to identify and map groundwater recharge potential zones in Haridwar District in Uttarakhand, India.
2 Study area
The research area covers the Haridwar district, situated in the southwest of Uttarakhand, spanning from 77°43′ to 78°22′ East longitude and 29°35′ to 30°40′ North latitude (Figure 2). The area covers a total of 2,360 square kilometres and consists of 622 settlements, which are divided into three tehsils and six development blocks. The Ganges River originates from the Gangotri Glaciers and passes through the Himalayas before reaching the plains of Haridwar. Additional notable rivers include the Solani, as well as intermittent tributaries such as the MohandRoa and ChillawalRoa. The drainage pattern in the watershed is diverse, with numerous streams characterized by wide, flat channels that are filled with gravel and pebbles (Godsey and Kirchner, 2014). Haridwar has three distinct seasons: summer, monsoon, and winter. The annual average rainfall is 1,174.3 mm, with 84% of it coming during the monsoon season (Aquifer Mapping and Groundwater Management Plan, Central Ground Water Board, 2016), July and August are the months with the highest amount of precipitation, but rainfall starts to decrease by early October.
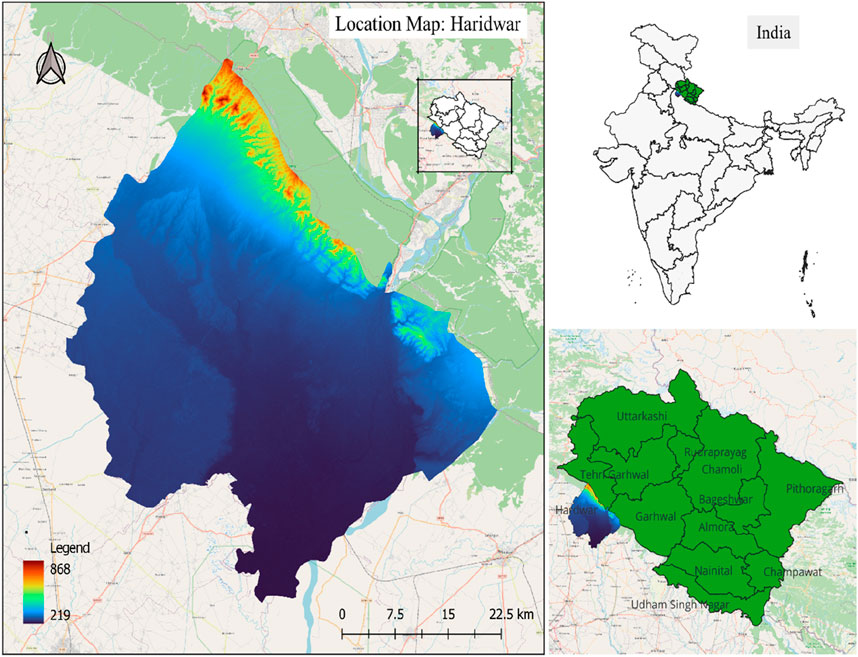
Figure 2. Location map of study area.
Located at the foothill of the Himalayas, Haridwar depicts a unique transition between rugged mountain and plain agricultural land use. Agricultural land use occupies nearly 83.7% of the total area of the district. Over 87% of the total agricultural lands are irrigated, indicating extensive use of groundwater for agricultural practices.
3 Datasets
Remote Sensing and its applications have become an important component to study the earth and its environment in many dimensions. Spatial and modelled datasets have been used in this research to identify groundwater recharge potential zones for Haridwar district of Uttarakhand state in India. The datasets have been collected from various sources to derive the thematic layers. The list of these datasets and their sources is mentioned in Table 1.
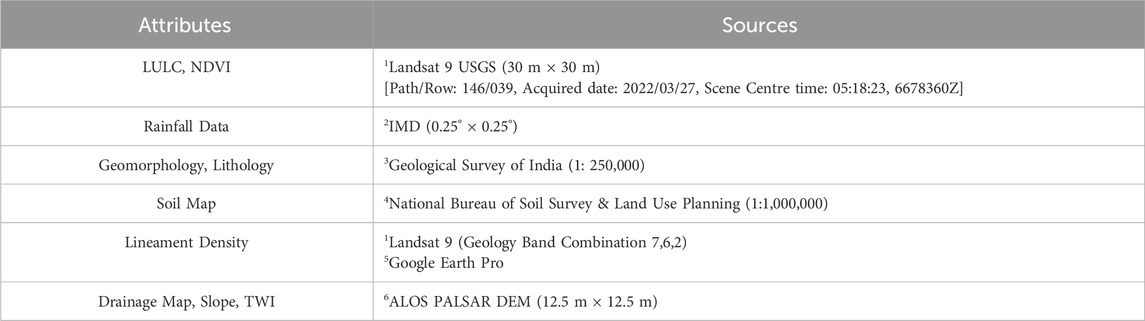
Table 1. Detailed sources of database.
3.1 Satellite data
Landsat 9 OLI/TIRS C2 L2 datasets, which comes with 30-m spatial resolutions, have been used for creating LULC, NDVI, and Lineaments that obtained from the USGS earth explorer website. The Landsat system has Thermal Infrared Sensor 2 (TIRS-2) and Operational Land Imager 2 (OLI-2) instruments, which offers imaging in 11 bands (Table 2). While TIRS-2 collects thermal infrared radiation from the Earth’s surface, OLI-2 takes pictures in the visible, near-infrared, and shortwave infrared spectrums. Up to 750 scenes can be captured every day by Landsat 9 also processes data into the Landsat Collection 2 framework. It adds about 1,500 new scenes per day, together with Landsat 8, to the USGS Landsat archive. In addition to covering the entire planet, Landsat 9 additionally enhances the quality and coverage of earlier satellites by extending its reach into nearshore coastal zones.
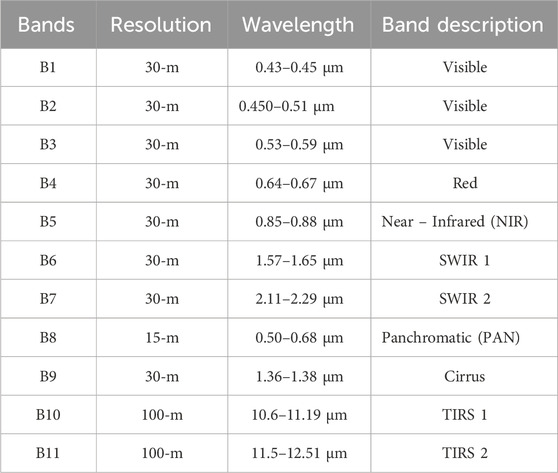
Table 2. Description of multispectral bands of Landsat 9.
3.2 Rainfall data
India Meteorological Department (IMD) provides daily High Spatial Resolution data millimeter-scale gridded rainfall readings at 0.25 × 0.25°. The 135 × 129 grid starts at 6.5N, 66.5 E. Annual data files have 365 or 366 records, depending on leap or non-leap years.
3.3 Geomorphology and lithological data
Bhukosh is a commercial geoscience portal with spatial and geophysical data repositories. The Geological Survey of India’s geoscientific data is available in its “Virtual Museum” with 3D exhibitions of rocks, minerals, and fossils.
3.4 Soil data
Indian Council of Agriculture Research (ICAR)’s National Bureau of Soil Survey & Land Use Planning (NBSS and LUP) studies, terrains, correlates, classifies, maps, and interprets soil resources.
3.5 Digital elevation model
The study uses digital elevation model (DEM) for elevation and slope analysis using ALOS PALSAR RTC product. The DEMs were orthometric heights with the EGM96 vertical datum. These were converted to ellipsoid heights using the ASF Map Ready tool named geoid adjust. The pixel reference varied from the centre (pixel as point) to a corner (pixel as area). The terrain-corrected products are generated using the GAMMA software, which uses pixels as area and adjusts DEM coordinates as needed. When more than one DEM was available, the one with the highest resolution was used for processing. For processing to proceed, complete DEM coverage from a single DEM source was necessary.
The data from various sources mentioned in Table 1 has been downloaded and processed, these multi-parametric data sets comprising satellite data, conventional maps (including topographical maps) and field data were utilized to delineate GWPZ for the study area. The LULC, NDVI, and Lineaments were identified using multispectral Landsat 9, satellite imageries. The images were visually interpreted with image interpretation characteristics such as size, shape, tone, texture, pattern and association for delineating the lineaments. ArcMap Arc toolbox was used for the generation of Slope, TWI, Lineaments, Drainage density from Alos Palsar DEM. Alos Palsar data was downloaded from the Alaska Facility website ASF Home | Alaska Satellite Facility to generate the Digital Elevation Model (DEM). The geomorphology map was downloaded from the Bhukosh Geological Survey of India (GSI). The National Bureau of Soil Survey and Land Use Planning (NBSS and LUP) website https://nbsslup.icar.gov.in/ provided the soil map, which was clipped in ArcGIS platform to obtain the digital soil map. Drainage network of the study area was obtained from ALOS PALSAR DEM and validated using the Survey of India (SOI) topographical map and digitized in a GIS environment. Moreover, also updated using high-resolution Landsat 9 satellite image.
4 Methodology
The study was carried out employing various geospatial techniques, including digitization, rectification, interpolation, supervised classification, and weightage overlay analysis (Figure 3). The detailed methods are discussed below.
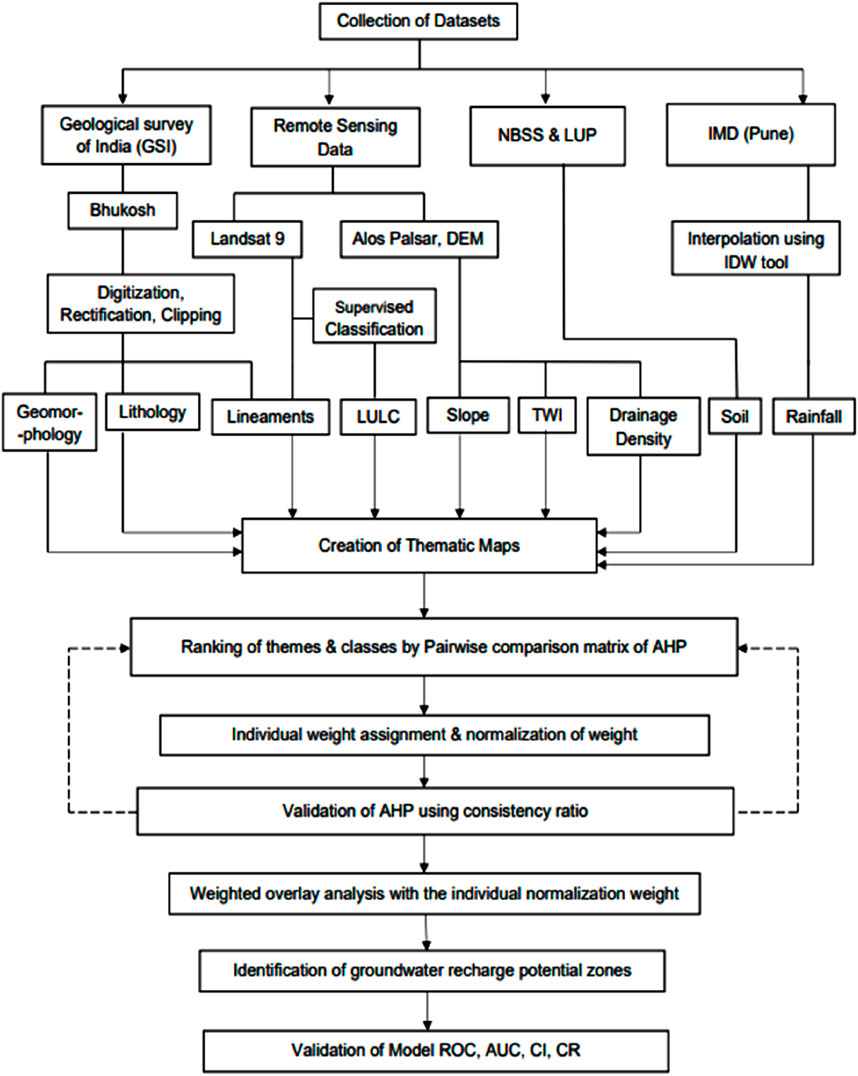
Figure 3. Flow diagram depicts overall methodology adopted for the study.
4.1 Generation of thematic maps
The thematic layers used in this study include LULC, lithology, geomorphology, soil, lineament, slope, topographic wetness index, rainfall, and drainage density. Landsat 9 images were used to create LULC maps employing supervised classification. ALOS PALSAR DEM was used to create slope, TWI, drainage density, and Lineaments maps. Geomorphology and soil maps were extracted from the Bhukosh Geological Survey of India (GSI) and NBSS and LUP websites, respectively. Maps showing the distribution of rainfall were processed using the Inverse Distance Weighted (IDW) interpolation method. Nine thematic layers were converted to raster format and subjected to ArcMap and Google Earth Pro analysis. The weighted overlay analysis tool in ArcMap was used to draw the boundaries of the groundwater potential zones.
4.2 Analytical Hierarchy process
The utilization of GIS and AHP was employed to enhance the identification of groundwater potential zones. Thematic maps were assigned weights using Saaty’s AHP approach, which is based on expert judgment. Pairwise comparisons were performed to rank factors, ensuring the dependability of decision-making while considering evaluation uncertainty. The AHP returns the likelihood of uncertainty in assessments through the primary Eigen value and the consistency index (Saaty, 2008). Indicator of consistency (CI), as the following equation provides a measure of consistency.
Where, λmax is the significant eigen value of the pairwise comparison matrix, and ‘n’ represents the number of classes. To regulate the consistency analysis and evaluation of scale, Consistency ratio (CR) defined as the measure between pairwise comparison matrix consistency (Saaty, 1980) has been computed.
In Table 3, Ratio Index (RI) values for various criteria are presented. Consistency values should be below 0.1 (Saaty, 1980; Malczewski, 1999) otherwise weights should be revised. The pairwise thematic layer comparison matrix shows consistent evaluations with Consistency Ratio (CR) values within acceptable ranges.
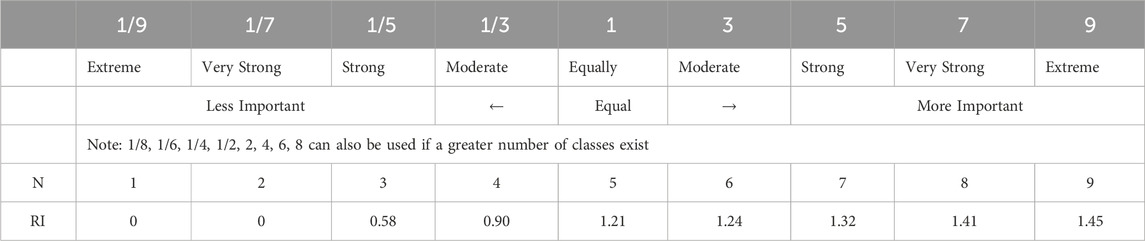
Table 3. Rating scale of Saaty’s analytical hierarchical process and Saaty’s ratio index for different N number of values.
Ranks were allocated to each independent parameter of each thematic layer, and weights were allocated based on the influence of the various parameters. The weights and rankings were determined based on the previous literature sources.
Based on the relative potential contribution, ranks and weights are assigned to each parameter and its associated classes (Table 4). This is performed using the researcher’s expertise, insights into recent literature, geographic location, and other local distinctive characteristics (Geomorphology, LULC, slope, lineament density, soil, drainage density, TWI).
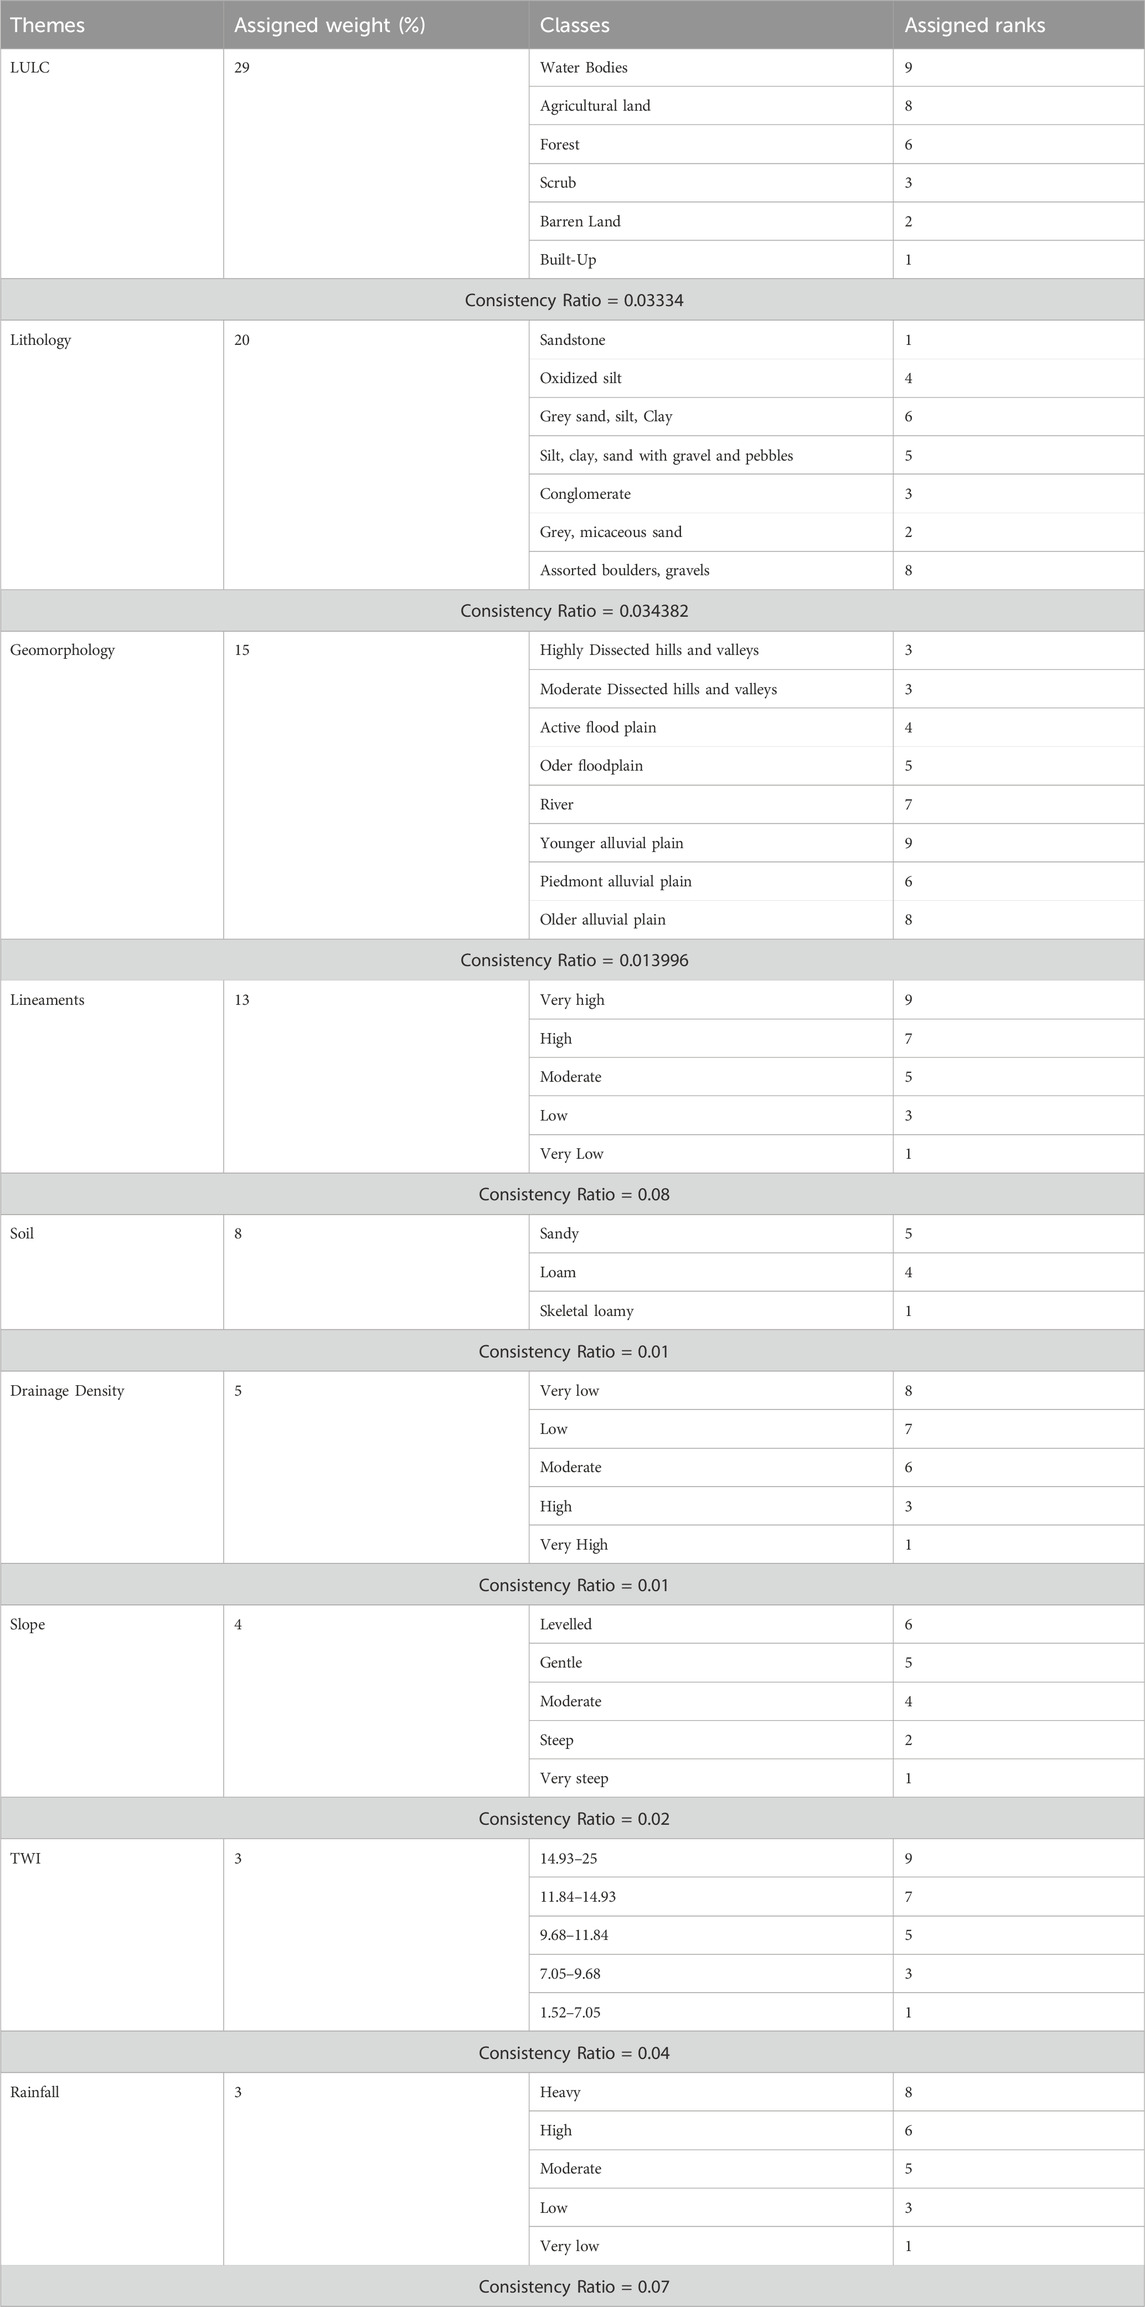
Table 4. Weights and ranking for different criteria.
5 Results and Discussions
5.1 Land use/land cover
LULC controls the volume, timing, and quantity of recharge. It also influences runoff and evapotranspiration (Guzhaa et al., 2018). Areas classified as agricultural plantation is observed are “extremely good” potential zones for groundwater (Khodaei and Nassery, 2013; Suganthi et al., 2013). Similarly, areas with scrubland, and urban and rural areas are “very poor” to “poor” prospects for groundwater occurrence, due to the rapid growth of built-up area. Supplementary Table S1 depicts the details of land use classes and their ranking and the LULC map of study area is shown in Figure 4.
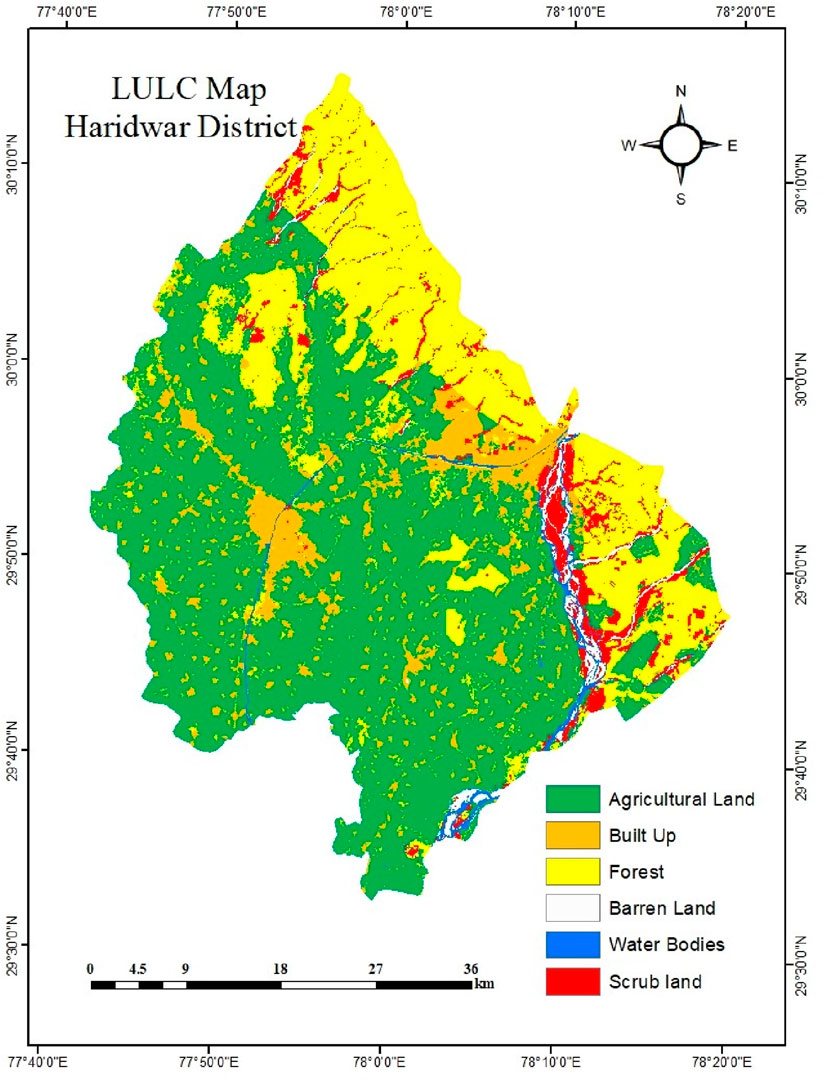
Figure 4. Land use/land cover map of the study area.
5.2 Lithology
Groundwater availability and occurrence are heavily influenced by lithology. The kind of lithology present influences groundwater recharge because it impacts percolation (Shaban et al., 2006; El-Baz, 1992). Water storage is determined by the kind and porosity of the rock formation. The study region is reported to contain a complete stratigraphic record of rocks ranging in age from Archean to Recent for geological significance (Ganju and Khar, 1984; Middlemiss, 1909; Middlemiss, 1910; Wadia, 1975). Based on their importance in groundwater recharge, the different lithology in the study area is ranked in Supplementary Table S2. The spatial distribution of these lithology classes is shown in Figure 5.
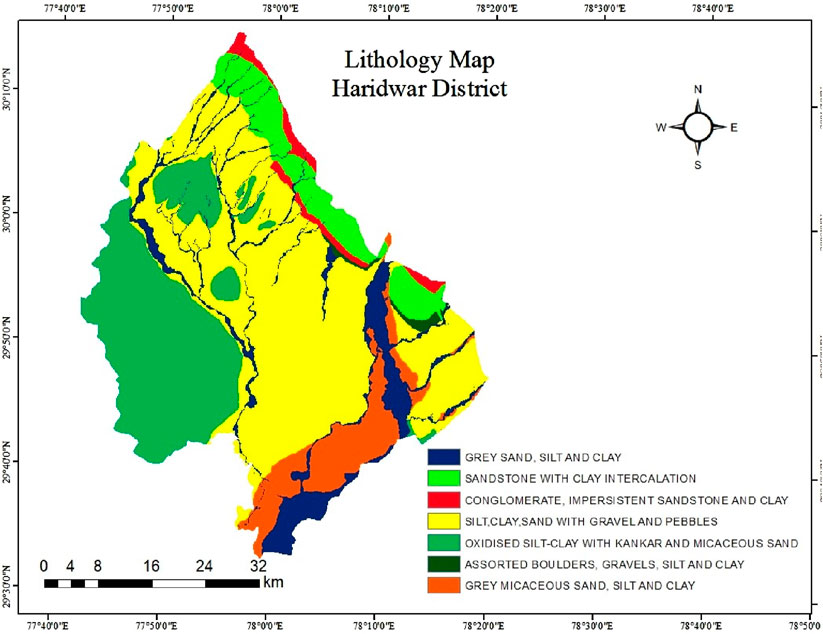
Figure 5. Lithology map of the study area.
5.3 Geomorphology
Geomorphology defines the geometry and topography of a place and is important in groundwater availability and distribution (Karanth, 1987). It is a key trait used to locate potential groundwater locations (Arulbalaji et al., 2019). Supplementary Table S3 showcases the detailed geomorphology of the study area, and their ranking based in importance. Figure 6 shows the spatial distribution of individual geomorphic classes.
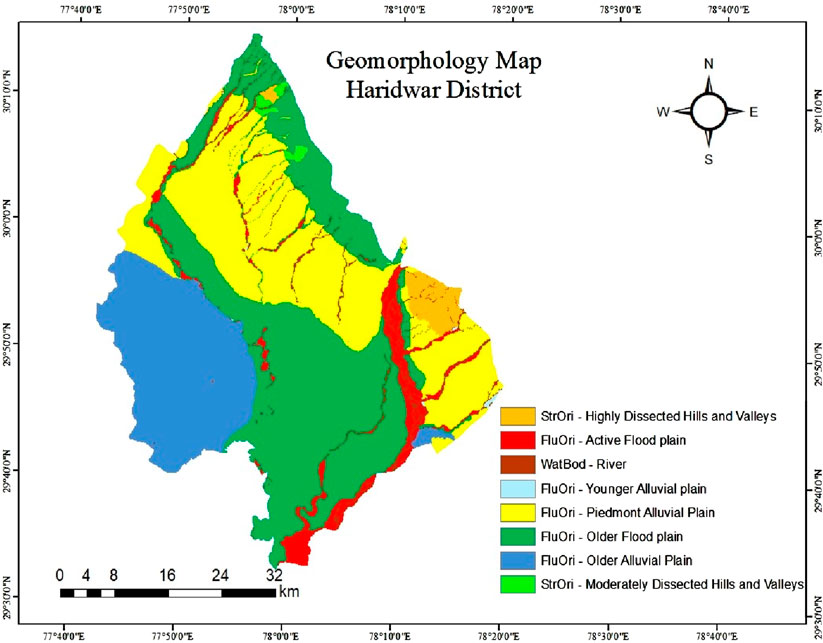
Figure 6. Geomorphology map of the study area.
5.4 Lineament density
Lineaments are linear or curved earth surface characteristics such as faults, joints, folds, dikes, crustal cracks, and so on. Lineaments are extremely important in recharging underground groundwater in hard rock terrains, and groundwater potential stays quite high closer to lineaments (Srivastava and Bhattacharya, 2006). Faulting and fracture areas/regions that increase porosity and permeability are important indications of groundwater (Das et al., 2017). Geospatial investigations are carried out with the goal of determining lineament length, thickness, and orientation. Supplementary Table S4 categorizes the lineament density in Haridwar and ranks them according to their importance. Figure 7 shows the spatial distribution of each lineament density classes.
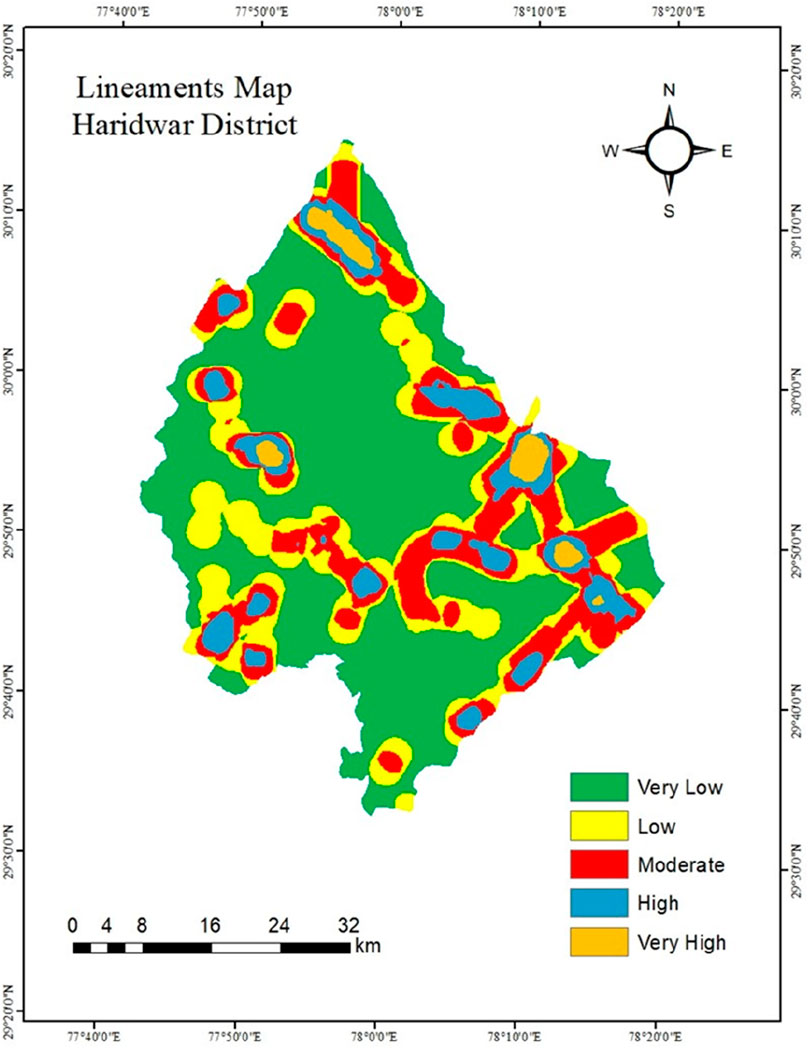
Figure 7. Lineament density map of the study area.
Digital geologic maps with a virtual globe interface, such as Google Earth, are a newer medium for presenting geologic data and interpretations. Google Earth models are more intuitive than traditional paper maps for visualizing 3-D geological structures. Google Earth displays satellite photographs of the earth’s surface with variable resolution, allowing us to see things with perspective while looking perpendicularly down or at an oblique angle. Geological lineaments are the points where discontinuity planes meet an observation surface. Lineament identification is critical in all phases of an underground project, including inquiry and construction. Lineaments shown in Google Earth pictures are accurate predictors of geologic structure. Google Earth pictures approach is the most effective tool for identifying lineaments in conjunction with ground truth and toposheet for collecting of spatial information and is highly valuable in identification and mapping of an area’s lineaments (Rana et al., 2016).
5.5 Soil
Soil is another essential component that influences the occurrence and distribution of groundwater, as well as its involvement in water infiltration, and hence influences groundwater recharge (Das et al., 2017; Ibrahim-Bathis and Ahmed, 2016). In determining infiltration rates, soil texture and hydraulic parameters are critical. Soil texture is an important criterion for evaluating the physical qualities of soil and is closely related to the structure, porosity, adhesion, and consistency of soil properties. Sandy soils are assigned a greater weight and rank than other soils due to their high infiltration capacity and minimal potential runoff. Similarly, fine-grained soils are assigned lower weights because fine texture inhibits water infiltration and percolation owing to reduced permeability, whereas coarse-grained soils have better infiltration and percolation capabilities due to higher permeability and are thus allocated larger weights. The soil of Haridwar district ranges from sandy to loamy skeletal (Supplementary Table S5). Figure 8 shows the spatial distribution of soils in Haridwar.
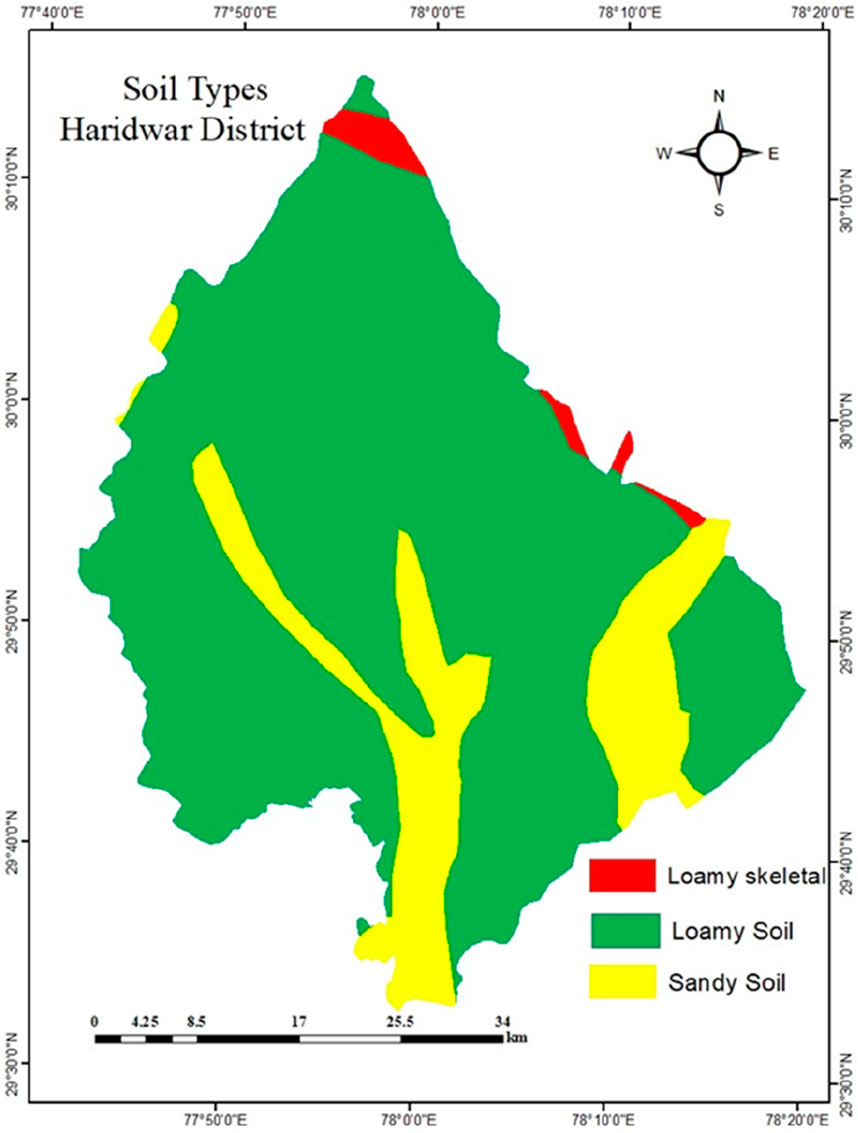
Figure 8. Soil map of the study area.
5.6 Drainage density
The drainage density is a significant metric of the landform components’ linear size and an illustration of channel spacing closeness (Horton, 1932). The assessment of drainage density is a useful numerical indication for landscape segmentation and runoff potential (Chorley, 1969). Drainage density is the result of interacting elements that govern surface runoff; it influences drainage basin sediment generation (Ozdemir and Bird, 2009). The lower drainage density suggests permeable soil, great plant cover, and lesser relief, whereas the higher density indicates the reverse (Harlin and Wijeyawickrema, 1985). Supplementary Table S6 shows the derived details of drainage density in Haridwar and assigned ranks. Figure 9 depicts the spatial distribution of drainage density in the study area.
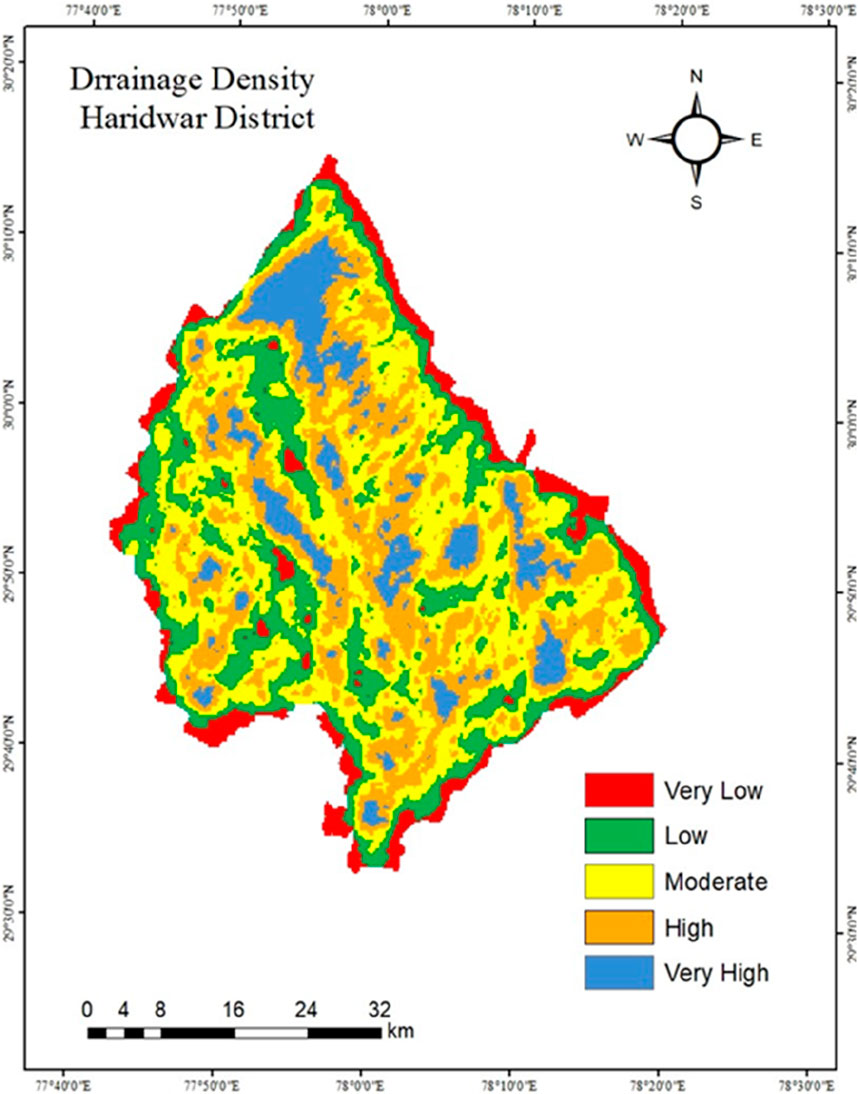
Figure 9. Drainage density map of the study area.
5.7 Slope
The slope is a major groundwater recharge regulating element, particularly in mountainous watersheds (Magesh et al., 2011a). The steep slopes will cause rapid runoff, increased soil erosion, and limited groundwater recharge (Magesh et al., 2011a; Magesh et al., 2011b). Flat and gentle slope locations have higher weights/ranks) and have been classed as “good” for groundwater potential because flat topography allows for increased infiltration and recharging. Moderate slopes are considered ideal for groundwater potential because of their slightly undulating terrain, which allows for maximal percolation or partial runoff (Nityananda et al., 2015). The “steep” class regions have a high surface runoff with enhanced soil erosion but little soil infiltration, making them ideal for the construction of dams and groundwater infiltration ponds for water harvesting. The slope is a significant characteristic that directly affects the balance between terrain reaction to runoff and infiltration. High runoff output reduces soil penetration on higher slope locations and controls aquifer formation significantly (Gebre et al., 2015). Supplementary Table S7 lists the area and ranks of the slope in Haridwar district and Figure 10 shows their spatial distribution.
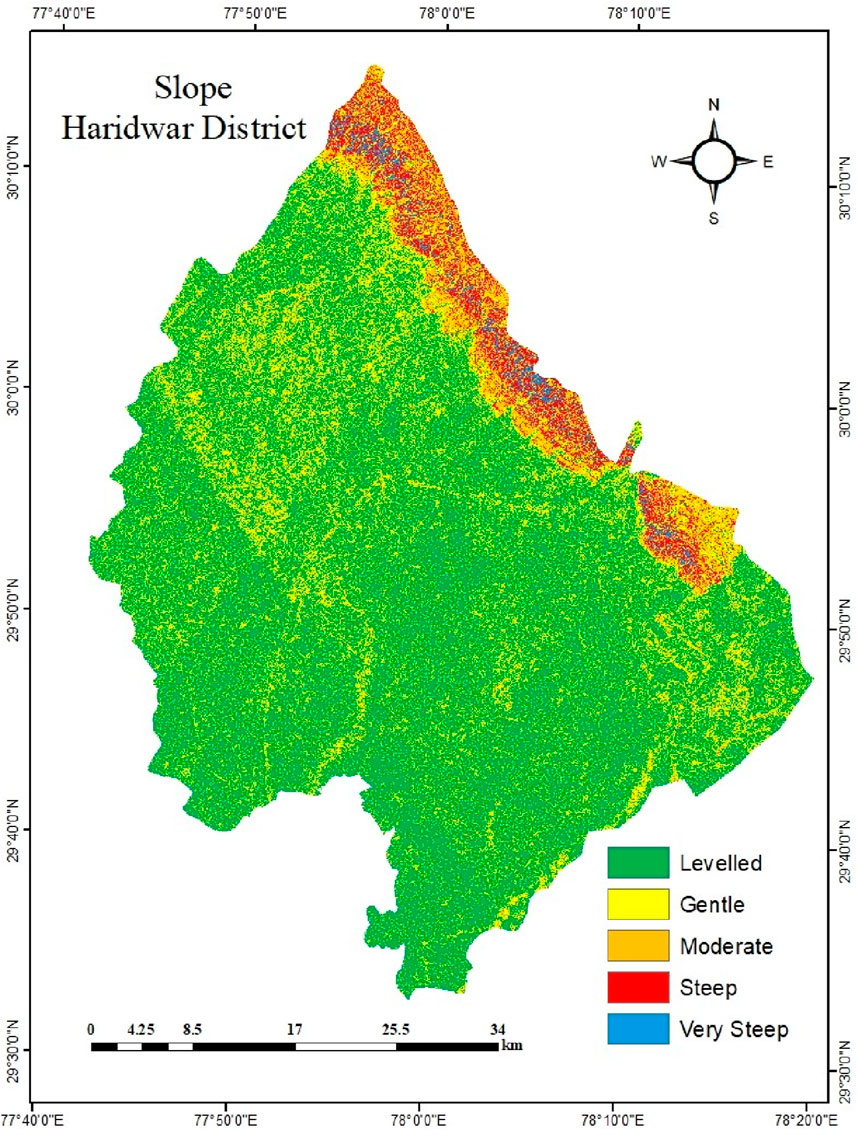
Figure 10. Slope map of the study area.
5.8 Topographic wetness index
The Topographic Wetness Index (TWI), which measures the potential for groundwater infiltration related to topographic factors, it is typically used to calculate topographic control on hydrological processes (Mokarram and Sathyamoorthy, 2015). The area and rank based on importance of TWI are shown in Supplementary Table S8. Figure 11 shows the spatial distribution of the TWI in the study area.
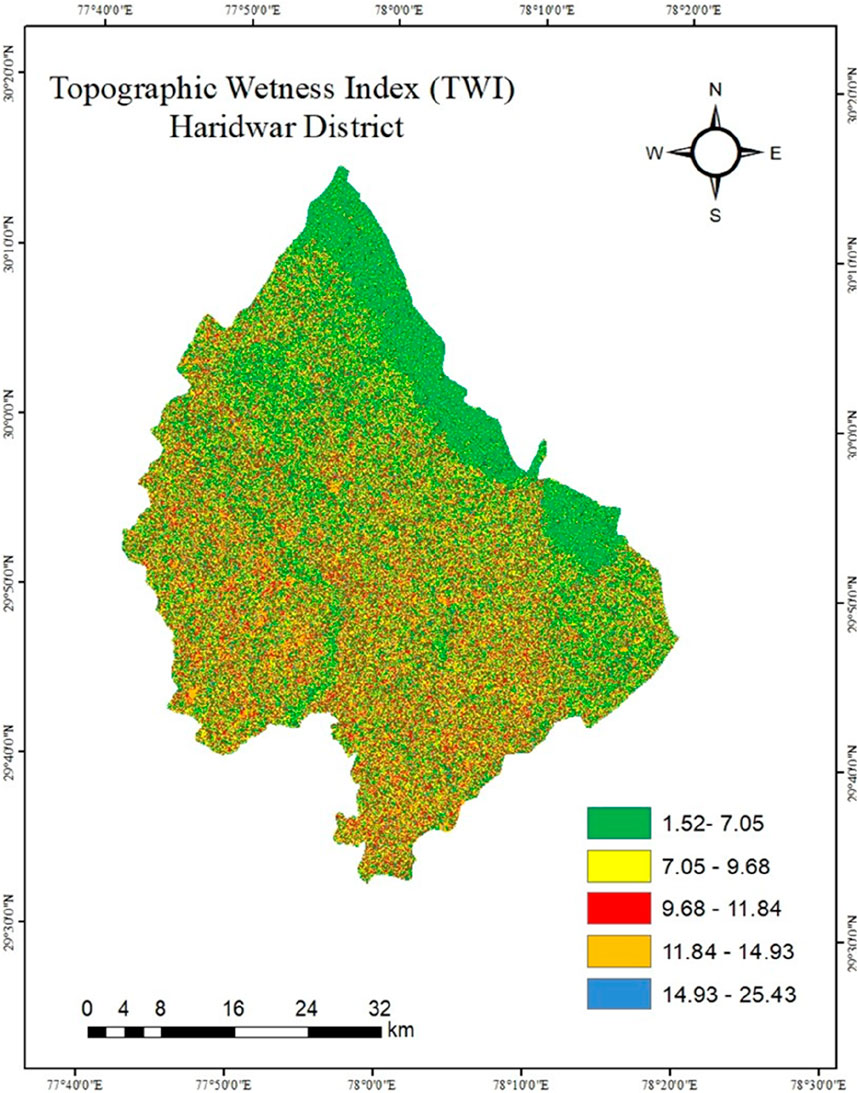
Figure 11. TWI map of the study area.
5.9 Rainfall
Rainfall plays crucial role in determining a region’s groundwater recharge. The spatial-temporal distribution of precipitation has a significant impact on the hydrological and hydrogeological processes of an area (Shia et al., 2016). Precipitation data (2011–2020) has been used for computing annual average for each station and generating the rainfall map of the study area using IDW interpolation technique. The details of the rainfall and assigned ranks is given in Supplementary Table S9, whereas Figure 12 shows their spatial distribution.
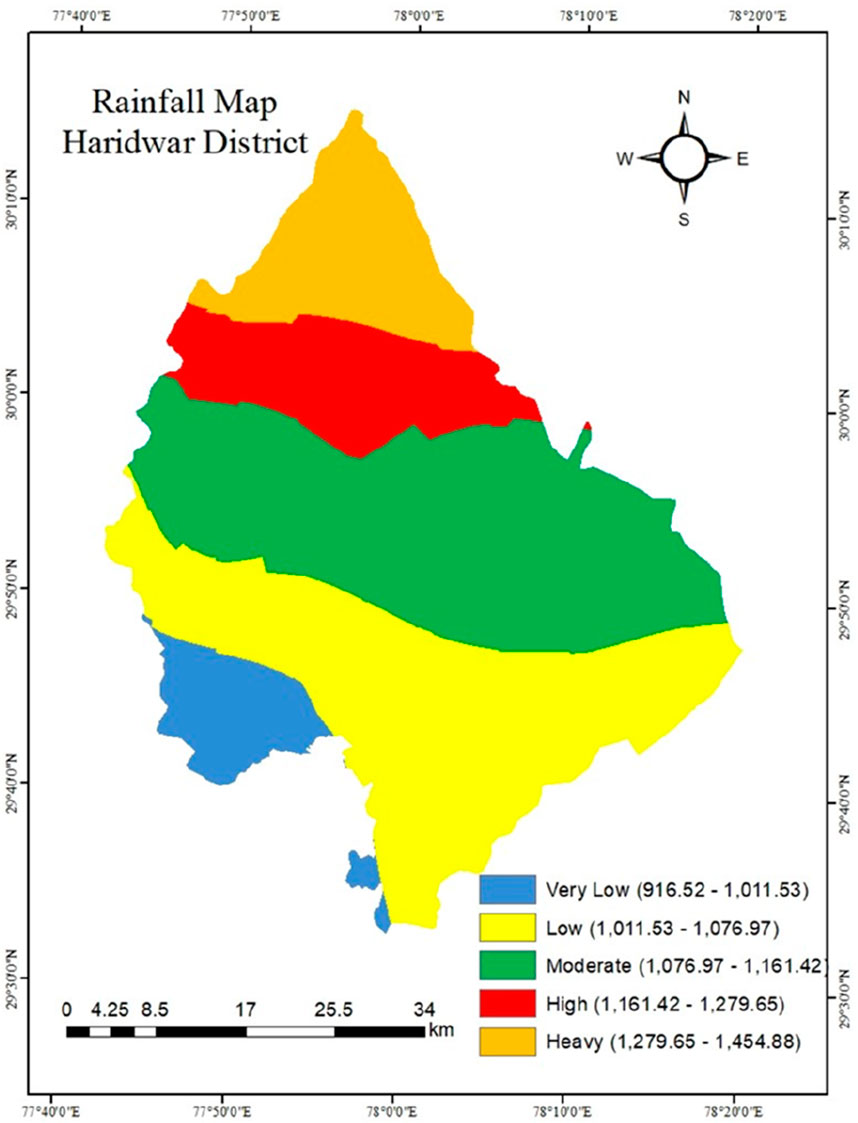
Figure 12. Rainfall map of the study area.
5.10 Delineation of potential groundwater recharge zones
The weighted overlay technique in GIS was used to integrate normalized weights of each thematic layer and its classes to identify potential groundwater recharge zones. The result of AHP analysis was used to assign weightage to each input layers while executing weightage overlay. Five recharge potential categories are listed in Table 5 and shown in the Figure 13. To incorporating and analysed the all parameters, upon bore-wells locations, the final groundwater recharge potential zone map was prepared and illustrated in Figure 14.
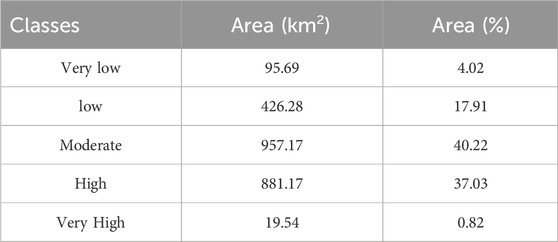
Table 5. Results Showing Groundwater recharge potential zones in the study area.
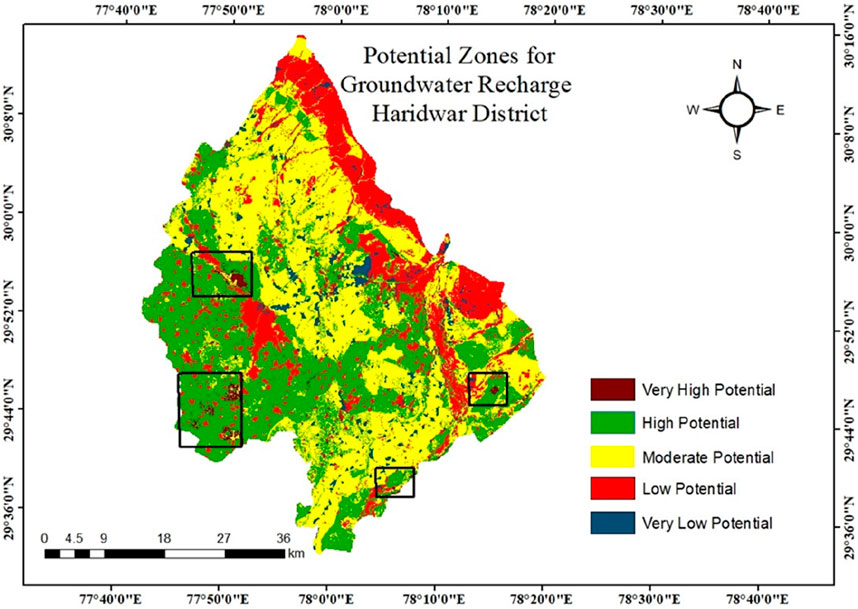
Figure 13. Map showing Groundwater recharge potential zones in the study area.
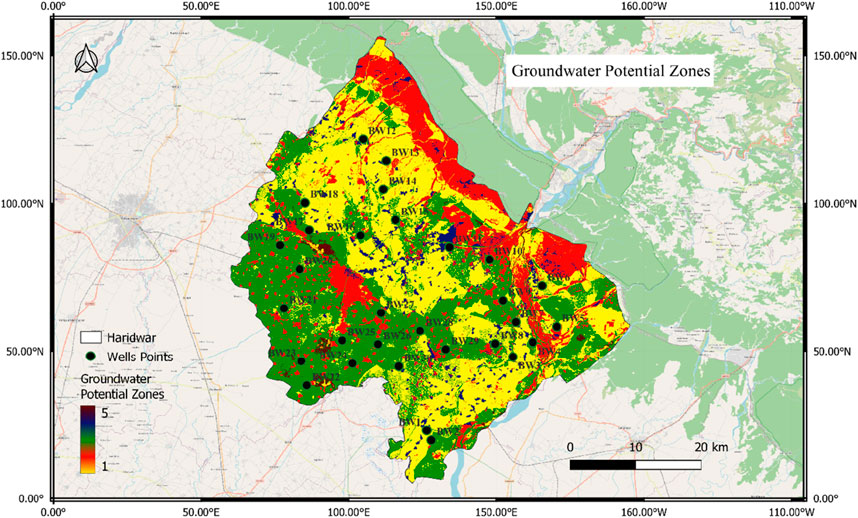
Figure 14. Depiction of borewell locations upon groundwater recharge potential zonation map.
The hydro geomorphological setting of the region reveals that excellent groundwater potential regions are present in the alluvial plain of the study area, having flat topography, lower slope, high porosity and permeability and, high infiltration capacity. Agriculture lands also show a strong influence on holding groundwater capacity, and there are good potential regions in the vicinity of these fields, in the study area.
6 Validation of groundwater recharge potential zones
Any suitability assessment must be cross-checked with actual ground-truth information to maintain the reliability of the results (Chaudhary et al., 2022; Rahmati et al., 2015; Saha, 2017). The delineated groundwater potential zone map was validated using secondary data and well-discharge statistics collected during the field survey (Wijesinghe et al., 2023). The receiver operating characteristic (ROC) curve is the most generally used strategy that illustrates the correlation between false positive values (Y-axis) and false negative values (X-axis) as used in the investigation also (Figure 15). The ROC is a graphical representation of all possible threshold values by plotting the false-positive (Y-axis) and false-negative (X-axis) values (Chaudhary et al., 2022; Pramanik et al., 2021). The Area Under Curve (AUC) in ROC curve analysis indicates prediction accuracy by describing systems’ ability to anticipate the absence and presence of predefined “events” (Chaudhary et al., 2022; Pramanik et al., 2021).
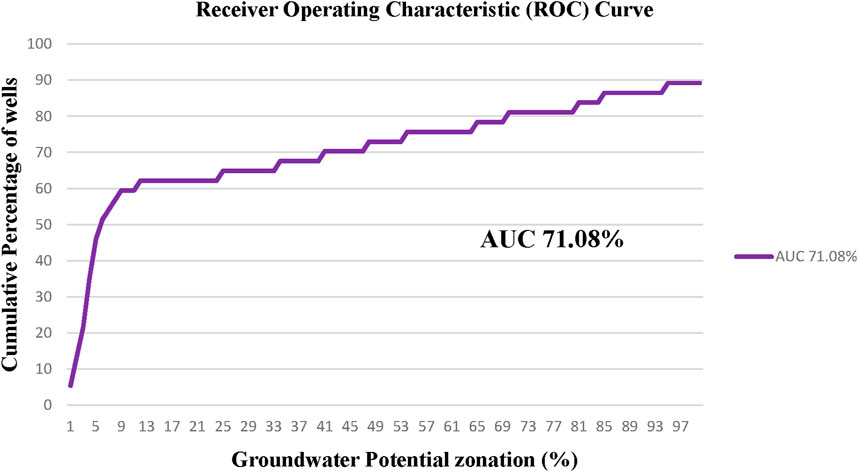
Figure 15. Receiver operating characteristic (ROC) curve of the model validation.
In the present study, the obtained result has been validated using bore well data (Table 6) and the ROC method. The five-class composite groundwater recharge potential map was created in GIS. This required weighting causal factors using the AHP approach and compiling them using the weighted overlay method. The model was verified using filed survey data from 30 borewells (Figure 16). The AUC/ROC statistical approach validated the model’s accuracy, with an AUC of 71.08% showing moderate to high groundwater recharge zone predictability utilizing the AHP method (Figure 15). Further, the potential zonation map obtained was further validated with 30 bore wells. Out of which 6 falls over very high potential zone and 21 over high potential zone. Two out of 30 wells fall under the category of moderate groundwater potential zone and only one well does not satisfy with the results and fall under low potential zone (Figure 15) The groundwater potential zones of Very High, High and Moderate obtained for the study area coincides with the ground bore - well data.
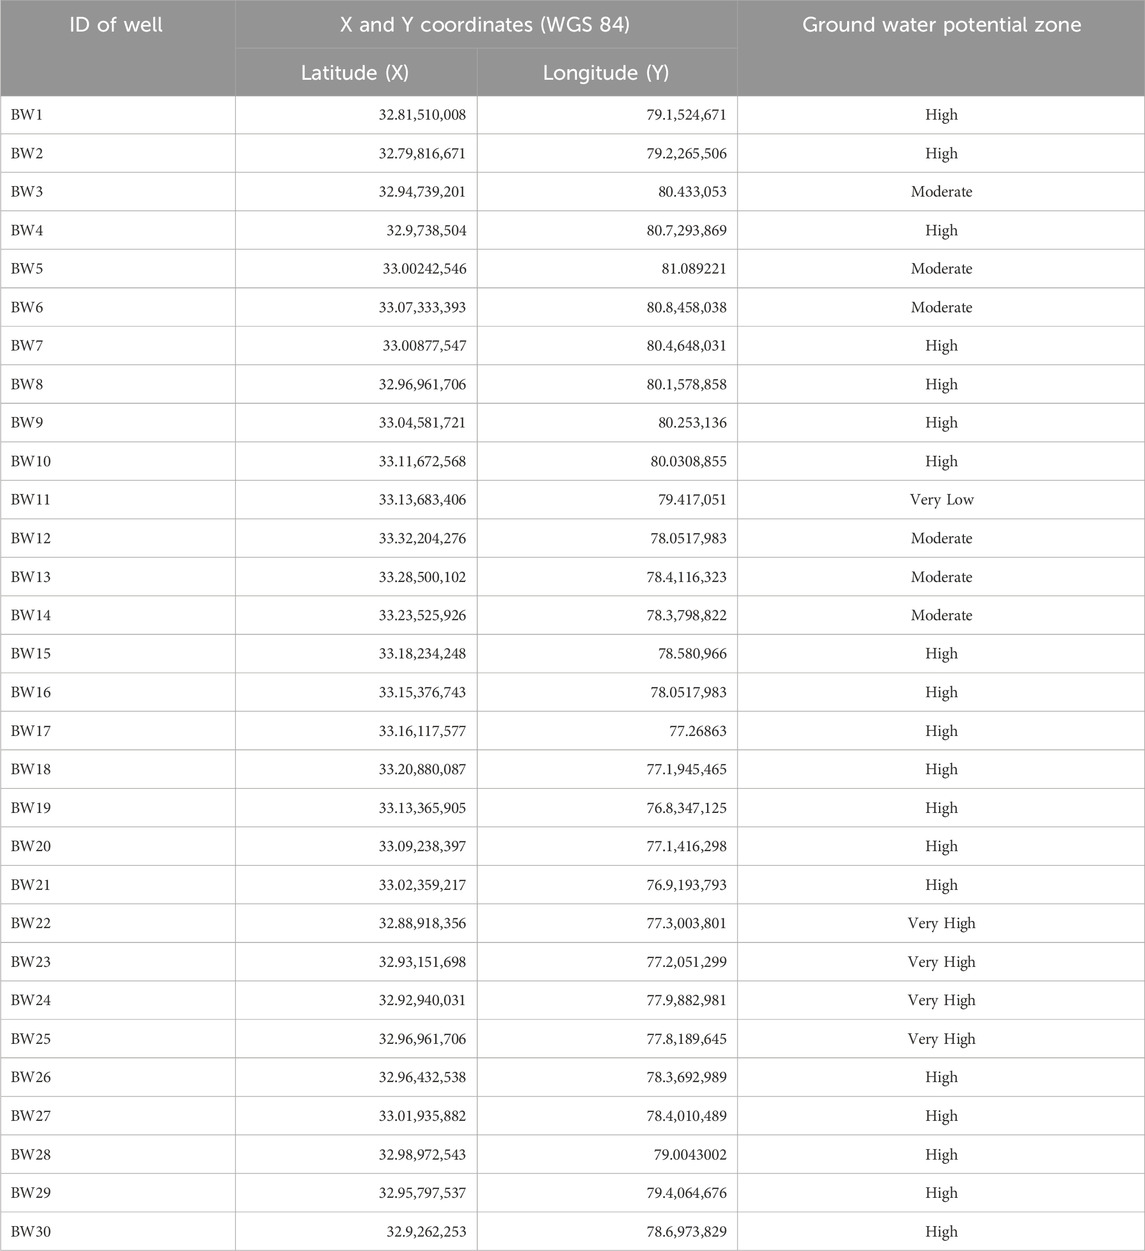
Table 6. The data of verified sample wells in the Haridwar district of India.
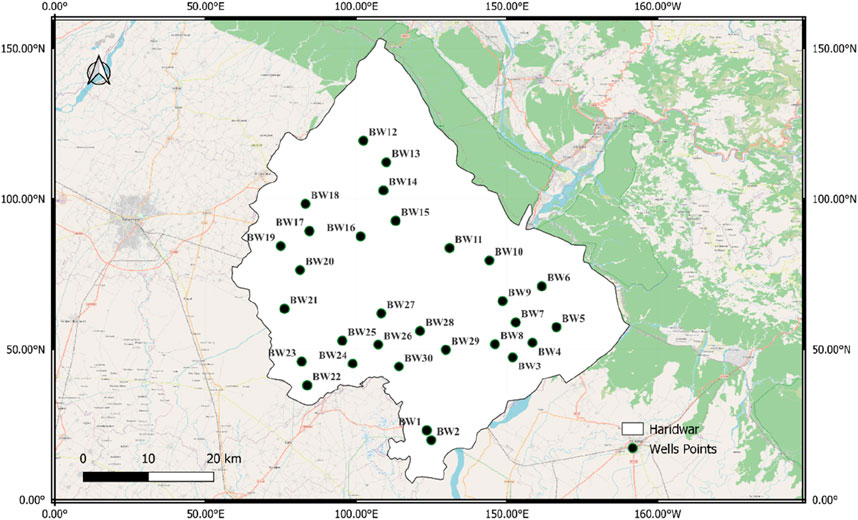
Figure 16. Distribution of sample locations for validation.
7 Conclusion
Remote Sensing and GIS using the Analytical Hierarchy Process (AHP) can effectively identify groundwater recharge zones. Various data sources, including Landsat 9, ALOS PALSAR DEM, topographic maps, Bhukosh (Geological Survey of India), IMD rainfall, and NBSS and LUP soil data, were used to create nine thematic layers.
For Haridwar’s groundwater recharge potential zonation, the AHP approach assigned precise weights to each thematic stratum and class. The resulting map classifies locations into five categories: extremely high, high, moderate, low, and very low potential for groundwater recharge. The most promising areas were identified as level alluvial plains, sandy soils, and thick lineaments. Validation of the model yielded an AUC of 71.08%, demonstrating strong accuracy for the groundwater recharge potential map. The findings can assist water planners and regulators in conserving water, replenishing groundwater, and increasing water availability.
Seasonal surface water storage or changes in irrigation practices could regulate water use, especially in low-recharge areas. In high-recharge zones, controlling trash disposal is crucial to avoid contamination. The study provides valuable insights for engineers and water managers to construct recharge structures and promote sustainable groundwater use practices.
Data availability statement
The original contributions presented in the study are included in the article/Supplementary Material, further inquiries can be directed to the corresponding author.
Author contributions
SP: Writing–review and editing. AS: Data curation, Investigation, Validation, Writing–original draft. RA: Visualization, Writing–review and editing. LT: Methodology, Resources, Supervision, Writing–review and editing. HK: Formal Analysis, Software, Supervision, Writing–review and editing. PC: Visualization, Writing–review and editing. AK: Visualization, Software, Validation, Writing–review and editing. MQ: Visualization, Software, Writing–review and editing.
Funding
The author(s) declare that no financial support was received for the research, authorship, and/or publication of this article.
Conflict of interest
The authors declare that the research was conducted in the absence of any commercial or financial relationships that could be construed as a potential conflict of interest.
Publisher’s note
All claims expressed in this article are solely those of the authors and do not necessarily represent those of their affiliated organizations, or those of the publisher, the editors and the reviewers. Any product that may be evaluated in this article, or claim that may be made by its manufacturer, is not guaranteed or endorsed by the publisher.
Supplementary material
The Supplementary Material for this article can be found online at: https://www.frontiersin.org/articles/10.3389/fenvs.2025.1421918/full#supplementary-material
Footnotes
1https://earthexplorer.usgs.gov/
5https://www.google.com/intl/en_in/earth/versions/
6https://asf.alaska.edu/data-sets/derived-data-sets/alos-palsar-rtc/alos-palsar-radiometric-terrain-correction/
References
Arulbalaji, P., Padmalal, D., and Sreelash, K. (2019). GIS and AHP techniques-based delineation of groundwater potential zones: a case study from Southern Western Ghats India. Sci. Rep. 9, 2082. doi:10.1038/s41598-019-38567-x
Central Ground Water Board (2016). AQUIFER mapping and ground water management plan: haridwar district, Uttarakhand. Available at: https://www.cgwb.gov.in/sites/default/files/2022-11/haridwar_compressed.pdf.
Central Groundwater Board (2021). Ground water year book India 2021-22. CGWB Publications and Media Warehouse. Available at: https://www.cgwb.gov.in/old_website/GW-Year-Book.html.MinistryofJalShakti.
Central groundwater board annual report (2009). Govt. Of India, CENTRAL GROUND WATER BOARD ministry of water resources, river development and Ganga rejuvenation. Available at: https://www.cgwb.gov.in/old_website/District_Profile/Uttarakhand/Hardwar.pdf.
Chaudhary, S., Kumar, A., Pramanik, M., and Negi, M. S. (2022). Land evaluation and sustainable development of ecotourism in the Garhwal Himalayan region using geospatial technology and analytical hierarchy process. Environ. Dev. Sustain. 24 (2), 2225–2266. doi:10.1007/s10668-021-01528-4
Das, S., Gupta, A., and Ghosh, S. (2017). Exploring groundwater potential zones using MIF technique in semi-arid region: a case study of Hingoli district, Maharashtra. Maharashtra. Spat. Inf. Resour. 25 (6), 749–756. doi:10.1007/s41324-017-0144-0
Derdour, A., Benkaddour, Y., and Bendahou, B. (2022). Application of remote sensing and GIS to assess groundwater potential in the transboundary watershed of the Chott-El-Gharbi (Algerian Moroccan border). Appl. Water Sci. 12, 136. doi:10.1007/s13201-022-01663-x
Earle, S. (2019). “Physical geology,” in Physical geology. 2nd ed. (Press books Enterprise Network), 457. Available at: https://opentextbc.ca/physicalgeology2ed/.
El-Baz, F. (1992). Research project. Groundwater potential of the sinai peninsula, Egypt. Available at: http://www.bu.edu/remotesensing/research/completed/Egypt-groundwater.
Ganju, J. L., and Khar, B. M. (1984). Tectonic and hydrocarbon prospects of Kashmir Valley possible exploration tasks. Petroleum Asian J., 206–216.
Gebre, T., Kibru, T., Samuale, T., and Taye, G. (2015). Analysis of watershed attributes for water resources management using GIS: the case of Chelekot micro-watershed, Tigray, Ethiopia. J. Geogr. Inf. Syst. 7 (2), 13. (Article ID: 55674).
Godsey, S. E., and Kirchner, J. W. (2014). Dynamic, discontinuous stream networks: hydrologically driven variations in active drainage density, flowing channels and stream order. Hydrol. Process. 28, 5791–5803. doi:10.1002/hyp.10310
Guzha, A. C., Rufino, M. C., Okoth, S., Jacobs, S., and Nobrega, R. L. B. (2018). Impacts of land use and land cover change on surface runoff, discharge and low flows: evidence from East Africa. J. Hydrology Regional Stud. 15, 49–67. doi:10.1016/j.ejrh.2017.11.005
Harlin, J. M., and Wijeyawickrema, C. (1985). Irrigation and groundwater depletion in Caddo county, Oklahoma. JAWRA J. Am. Water Resour. Assoc. 21 (1), 15–22. doi:10.1111/j.1752-1688.1985.tb05346.x
Ibrahim-Bathis, K., and Ahmed, S. A. (2016). Geospatial technology for delineating groundwater potential zones in Doddahalla watershed of Chitradurga district, India. Egypt. J. Remote Sens. Space Sci. 19 (2), 223–234. doi:10.1016/j.ejrs.2016.06.002
Irrigation Research Institute, Roorkee (2017). State specific action plan for water sector Uttarakhand. Available at: https://nwm.gov.in/sites/default/files/Report_Draft-SSAP_Uttarakhand.pdf.
Kamaraj, P., Jothimani, M., Panda, B., and Sabarathinam, C. (2023). Mapping of groundwater potential zones by integrating remote sensing, geophysics, GIS, and AHP in a hard rock terrain. Urban Clim. 51, 101610. doi:10.1016/j.uclim.2023.101610
Karanth, K. R. (1987). Ground water assessment, development and management. New Delhi: Tata McGraw-Hill publishing company Limited.
Khodaei, K., and Nassery, H. R. (2013). Groundwater exploration using remote sensing and geographic information systems in a semi-arid area (Southwest of Urmieh, Northwest of Iran). Arabian J. Geosciences 6 (4), 1229–1240. doi:10.1007/s12517-011-0414-4
Magesh, N. S., Chandrasekar, N., and Soundranayagam, J. P. (2011a). Morphometric evaluation of papanasam and manimuthar watersheds, parts of western ghats, tirunelveli district, Tamil nadu, India: a gis approach. Environ. Earth Sci. 64, 373–381. doi:10.1007/s12665-010-0860-4
Magesh, N. S., Chandrasekar, N., and Vetha Roy, D. (2011b). Spatial analysis of trace element contamination in sediments of Tamiraparani estuary,southeast coast of India. Estuarine. Coast. Shelf Sci. 92, 618–662.
Middlemiss, C. S. (1909). Gondwanas and related marine sedimentary systems of Kashmir. Geol. Surv. India 37, 286–327.
Middlemiss, C. S. (1910). A revision of the Silurian-Trias sequence in Kashmir. Geol. Surv. India 40, 206–260.
Mokarram, M., and Sathyamoorthy, D. (2015). Morphometric analysis of hydrological behavior of north fars watershed, Iran. Eur. J. Geogr. 6 (4), 88–106.
Mukherjee, A., Saha, D., Harvey, C. F., Taylor, R. G., Ahmed, K. M., and Bhanja, S. N. (2015). Groundwater systems of the Indian sub-continent. J. Hydrology Regional Stud. 4, 1–14. doi:10.1016/j.ejrh.2015.03.005
Nityananda, S., Khan, A., Chatterjee, S., and Das, A. (2015). Hydrologic delineation of ground water potential zones using geospatial technique for Keleghai river basin, India. Model. Earth Syst. Environ. 1, 25. doi:10.1007/s40808-015-0024-3
Ozdemir, H., and Bird, D. (2009). Evaluation of morphometric parameters of drainage networks derived from topographic maps and DEM in point of floods. Environ. Geol. 56, 1405–1415. doi:10.1007/s00254-008-1235-y
Pramanik, M., Singh, P., and Dhiman, R. C. (2021). Identification of bio-climatic determinants and potential risk areas for Kyasanur forest disease in Southern India using Maxent modelling approach. BMC Infect. Dis. 21 (1), 1226–1315. doi:10.1186/s12879-021-06908-9
Rahmati, O., Nazari Samani, A., Mahdavi, M., Pourghasemi, H. R., and Zeinivand, H. (2015). Groundwater potential mapping at Kurdistan region of Iran using analytic hierarchy process and GIS. Arabian J. Geosciences 8 (9), 7059–7071. doi:10.1007/s12517-014-1668-4
Rana, N., Chakravarthy, C. P., Nair, R., and Kannan, L. G. (2016). Identification of lineaments using Google tools. Recent Adv. Rock Eng.
Saaty, T. L. (1980). The analytic hierarchy process: planning, priority setting, resource allocation. McGraw-Hill International Book Co.
Saaty, T. L. (2008). Decision making with the analytic hierarchy process. Int. J. Serv. Sci. 1 (1), 83. doi:10.1504/ijssci.2008.017590
Saha, S. (2017). Groundwater potential mapping using analytical hierarchical process: a study on Md. Bazar Block of Birbhum District, West Bengal. Spatial Inf. Res. 25 (4), 615–626. doi:10.1007/s41324-017-0127-1
Shaban, A., Khawlie, M., and Abdallah, C. (2006). Use of remote sensing and GIS to determine recharge potential zones: the case of Occidental Lebanon. Hydrogeology J. 14, 433–443. doi:10.1007/s10040-005-0437-6
Shia, H., Lia, T., Weia, J., Fua, W., and Wanga, G. (2016). Spatial and temporal characteristics of precipitation over the three-river headwaters region during 1961–2014. J. Hydrology Regional Stud. 6, 52–65. doi:10.1016/j.ejrh.2016.03.001
Srivastava, P. K., and Bhattacharya, A. K. (2006). Groundwater assessment through an integrated approach using remote sensing, GIS and resistivity techniques: a case study from a hard rock terrain. Int. J. Remote Sens. 27 (20), 4599–4620. doi:10.1080/01431160600554983
State of Uttarakhand, Department of Horticulture and Food Processing and Japan International Cooperation Agency (JICA) Nippon KOEI CO., LTD. (2022). Preparatory survey on Uttarakhand integrated horticulture development project (UKIHDP). Available at: https://openjicareport.jica.go.jp/pdf/12369302.pdf.
Suganthi, S., Elango, L., and Subramanian, S. K. (2013). Groundwater potential zonation by remote sensing and GIS techniques and its relation to the groundwater level in the coastal part of the Arani and Koratalai River Basin, Southern India. Earth Sci. Res. J. 17 (2), 87–95.
The World Bank (2010). Sustainable groundwater management contributions to policy promotion. Available at: https://www.unigrac.org/sites/default/files/resources/files/GWMATE%20Strategic%20overview%20-%20Sustainable%20groundwater%20irrigation.pdf.
The World Bank (2024). Deep wells and prudence: towards pragmatic action for addressing groundwater overexploitation in India. Accessed. Washington, D.C.: World Bank Group. Available at: http://documents.worldbank.org/curated/en/272661468267911138/Deep-wells-and-prudence-towards-pragmatic-action-for-addressing-groundwater-overexploitation-in-India January 29, 2010).
Keywords: geospatial, groundwater recharge, artificial recharge, AHP, AUC, ROC, Haridwar
Citation: Pirasteh S, Samad A, Ahmad R, Thakural LN, Khan HH, Chauhan P, Khan A and Qamar MZ (2025) Geospatial and AHP based identification of potential zones for groundwater recharge in Haridwar District of India. Front. Environ. Sci. 13:1421918. doi: 10.3389/fenvs.2025.1421918
Received: 23 April 2024; Accepted: 13 January 2025;
Published: 13 March 2025.
Edited by:
Mohammad Shoab, Shaqra University, Saudi ArabiaReviewed by:
Nepal Dey, BRAC University, BangladeshAshutosh Bhardwaj, Indian Institute of Remote Sensing, India
Vishal Mishra, Indian Institute of Technology Roorkee, India
Copyright © 2025 Pirasteh, Samad, Ahmad, Thakural, Khan, Chauhan, Khan and Qamar. This is an open-access article distributed under the terms of the Creative Commons Attribution License (CC BY). The use, distribution or reproduction in other forums is permitted, provided the original author(s) and the copyright owner(s) are credited and that the original publication in this journal is cited, in accordance with accepted academic practice. No use, distribution or reproduction is permitted which does not comply with these terms.
*Correspondence: Rizwan Ahmad, cmFobWFkLnJzQGFtdS5hYy5pbg==
†ORCID: Rizwan Ahmad, https://orcid.org/0000-0002-1445-1924; Pankaj Chauhan, https://orcid.org/orcid.org/0000-0002-7757-4825