- 1College of Economics and Management, Beijing University of Technology, Beijing, China
- 2College of Economics and Management, Anhui Polytechnic University, Wuhu, China
Households' carbon emissions (HCEs) plays an important role in the overall carbon emission (CE) reduction. This study conducts a comparative analysis of the trends and characteristics of the rural and urban HCEs in China in 1997–2020, by applying the environmental input-output (EIO) model. Then, a three-stage SDA model is applied to decompose the driving forces of the rural and urban HCEs evolution into population effect, per capita HCEs effect, expenditure effect, CE intensity effect, energy structure effect, and energy consumption intensity effect. It is obtained that the rural HCEs increases before 2015 and then decreases, but its per capita HCEs has always shown an upward trend. The urban HCEs has been increasing, but its per capita HCEs starts to decrease after 2015. Indirect HCEs accounts for over 80% of both the rural and urban HCEs, and Residence, Food and Tobacco, Transportation and Communication are the three biggest contributing sectors. To reveal the driving forces of the rural and urban HCEs evolution, this study conducts phase decomposition analysis with 2015 as a turning point. For rural HCEs, in 1997–2015, rural HCEs increased due to the dominant expenditure effect; from 2015 to 2020, the driving force reversed, leading to a decline in rural HCEs. For urban HCEs, the positive population and expenditure effects have always been larger than the negative energy structure and energy consumption intensity effects, resulting growth in urban HCEs. For urban per capita HCEs, in 1997–2015, the positive expenditure effect is greater than the negative CE intensity effect, leading to an increase in urban per capita HCEs, and a positive urban per capita HCEs effect. In 2015–2020, the driving force reversed, leading to a decline in urban per capita HCEs. Based on above results, countermeasures to promote rural and urban HCEs reduction are discussed.
1 Introduction
Greenhouse gas emissions, represented by CO2, are the primary cause of global climate change. The Paris Agreement (2015) states that to avoid a climate catastrophe, it is necessary to hold the increase in the global average temperature to well below 2°C above pre-industrial levels and pursuing efforts to limit the temperature increase to 1.5°C above pre-industrial levels, and requires that countries achieve carbon neutrality by the second half of this century. As the world’s largest emitter of CO2, in 2020, General Secretary Xi Jinping committed at the general debate of the 75th Session of the United Nations General Assembly that China would strive to peak carbon emissions (CEs) before 2030 and achieve carbon neutrality before 2060 (the dual carbon goals), and has integrated these goals into the overall planning of social-economic development and ecological civilization construction, making them an intrinsic requirement and driving force for high-quality development in China. For a time, the whole society sparked a research craze on the implementation path and action plans for China’s dual carbon goals. Experts and scholars explored coping strategies from multiple dimensions such as energy transition, industrial upgrading, and technological innovation (Zhang et al., 2022; Lin, 2022; Hu, 2021; He et al., 2020; Wang and Zhang, 2020). However, achieving the dual carbon goals not only requires a persistent push for innovation and reform in the supply side, but also calls for attention to the significant role of HCEs. The “Emissions Gap Report (2020)” published by UNEP indicates that household greenhouse gas emissions account for about two-thirds of the total global emissions. “Climate Change (2022): Mitigation of Climate Change” of IPCC also suggests that implementing correct policies, infrastructure, and technologies, and changing lifestyles and behaviors, would reduce greenhouse gas emissions by 40%–70% by 2050. Thus, the role of HCEs reduction in the overall CE reduction is evident. Therefore, with the urgent constraints of global climate change and China’s dual carbon goals, fully revealing the evolutionary trend and characteristics of China’s HCEs, clarifying its key driving factors, and proposing countermeasures to promote HCEs reduction, are vital to reduce China’s HCEs and promoting the achievement of the dual carbon goals.
Currently, research on HCEs in China mainly focuses on two aspects: 1) Accounting and trend analysis of HCEs. For instance, Peng et al. (2023) analyzed the trend of HCEs in China in 2010–2017, and concluded that the amount of HCEs in China is gradually increasing, accounting for approximately one-third of China’s total CEs. Mi et al. (2020) analyzed the HCEs of different income groups in China in 2007–2012 and concluded that the HCEs from the top 5% high-income groups accounted for 19% of the total HCEs, while HCEs from the bottom 50% income groups only accounted for 25% of the total HCEs. This finding is consistent with the study conducted by Wiedenhofer et al. (2017). Additionally, Xie et al. (2020) calculated the direct HCEs in Guangdong province in 1995–2017. Wang and Yang (2016) analyzed the trend of HCEs in Beijing in 2000–2010. 2) Examining the driving factors of HCEs in China. One approach involves using econometric regression models to analyze the main factors influencing HCEs and the extent of their impact. Zhao et al. (2023) employed a panel data regression model to analyze the impact of housing wealth and financial wealth on HCEs in China in 2012–2016, and concluded that housing wealth has an evidently larger impact on HCEs, almost twice as large as that of financial wealth. Shi et al. (2020) analyzed the driving forces of indirect HCEs in China in 2012–2016, and obtained that income, urban or rural residency, and fuel type are the three most important influencing factors. Li et al. (2015) analyzed the impact of urbanization on China’s HCEs and concluded that the direct HCEs and indirect HCEs increased by 2.9% and 1.1%, respectively, for every 1% increase in the urbanization rate. The other approach is to decompose the evolution of HCEs by applying factor decomposition methods. Peng et al. (2021) used the SDA model to decompose the evolution of indirect HCEs in China in 2002–2017 into the effect caused by change of direct CE intensity, production technology, consumption structure, propensity to consume, income scale, and population. They concluded that income scale has always been the main driving factor promoting CE growth, while direct CE intensity is the main inhibiting factor. Liu et al. (2019) used the LMDI method to decompose the evolution of HCEs in China in 2002–2012, they obtained that per capita consumption is the main factor driving the HCEs growth, and that the decrease in CE intensity is the main inhibiting factor. In addition, Fan et al. (2021), Zhao et al. (2021), Yuan et al. (2019) also analyzed the main driving forces of HCEs in China.
Existing research plays a significant role in analyzing the trend of HCEs in China and its main driving factors. However, it is not hard to identify following limitations: 1) There is a lack of accounting for China’s HCEs in long-term and in latest years, which makes it difficult to uncover the long-term trend and characteristics of its evolution and the current patterns; 2) In terms of driving factor decomposition, few studies have conducted phase decomposition, especially when there has been a significant turning point in the total or per capita HCEs. Consequently, it doesn’t truly reflect the driving effects of the influencing factors at different stages. 3) Moreover, China’s urban-rural dual structure is pronounced, with significant differences in the total and per capita HCEs, as well as the effects of driving factors. However, few studies have conducted comparative analysis of the evolution and driving factors of the rural and urban HCEs in China, leading to a lack of targetability and effectivity of countermeasures in urban and rural HCEs reduction.
Aiming at above deficiencies, this study, based on the latest long-term input-output tables of China in 1997–2020, sectoral energy consumption data, etc., conducts a comparative analysis of the evolutionary trends, characteristics, and driving forces of the rural and urban HCEs in China, by applying the EIO and SDA (EIO-SDA) model. Consequently, it proposes countermeasures to promote rural and urban HCEs reduction, which can help the implementation of China’s dual carbon goals.
2 Methods and data sources
2.1 Methods
To reveal the evolutionary trends of the rural and urban HCEs in China, the sectoral accounting method provided by IPCC was applied to account the direct HCEs, and the EIO model was applied to account the indirect HCEs. Then, the SDA model was applied to quantify the effects of the driving forces in evolution of the rural and urban HCEs.
2.1.1 Accounting of HCEs in China
2.1.1.1 Accounting of direct HCEs in China
The direct HCEs is obtained from “China CO2 inventory in 1997–2021 (by IPCC Sectoral Emission)” provided by CEADs (2024). CEADs calculated CEs of 47 sectors, including both rural and urban direct HCEs, based on the sectoral accounting method provided by IPCC, as shown in Equation 1.
2.1.1.2 Accounting of indirect HCEs in China by EIO model
EIO model has been widely used in accounting of indirect HCEs (Meng et al., 2023; Yang et al., 2022; Jakob and Marchiniski, 2013; Peters and Hertwich, 2008). It is based on the IO table and take into account the inter-relationships between economic activities and the environment. The accounting method is as shown as Equation 2.
2.1.1.3 Accounting of total HCEs
The total HCEs equals the sum of direct HCEs and indirect HCEs, as shown in Equation 3.
2.1.2 SDA decomposition of evolution of HCEs in China
SDA model is a classic model for quantifying the effect of evolution of driving factors. It is based on IO table and decomposes the dependent variable into the product of several driving factors, and reflects the change of the dependent variable as the product of the changes of its driving factors. The SDA model has been widely used in decomposing the evolution of CEs (Yang et al., 2024; Yang et al., 2024; Cheng et al., 2018; Su et al., 2010).
To analyze the driving factors of HCEs, this study employs a three-stage SDA model, in which, we analyze the driving forces through a three-stage decomposition. Firstly, the evolution of HCEs is decomposed into the product of population (P) change and per capita HCEs (
Secondly, the change of per capita HCEs is decomposed into the product of change of CE intensity (CO2 emissions per households’ consumption expenditure,
Thirdly, the change of CE intensity is furtherly decomposed into product of CE coefficient (
Based on the three-stage SDA model, we can quantify the driving effects of changes of population, per capita HCEs, CE intensity, households’ consumption expenditure, energy structure, and energy consumption intensity on changes of the rural and urban HCEs.
The first-stage decomposition:
The second-stage decomposition:
The third-stage decomposition:
2.2 Data sources
The input-output tables of China are obtained from the “China Statistical Yearbook” and includes 10 years of data, 1997, 2000, 2002, 2005, 2007, 2012, 2015, 2017, 2018, and 2020. Since the year 2000 only includes 17 sectors, the coarse industry classification would lead to significant changes in the direct consumption coefficients in the input-output table, thereby reducing data accuracy. Therefore, to ensure the unity of the accounting process and the reliability and comparability of the results, the indirect HCEs in 2000 is not accounted. Data of the rural and urban population, per capita households’ consumption expenditure, and sectoral energy consumption are all sourced from the official website of the National Bureau of Statistics (2024) of China.
3 Results
3.1 Overall trend comparison of HCEs in China
3.1.1 Trend of rural HCEs in China
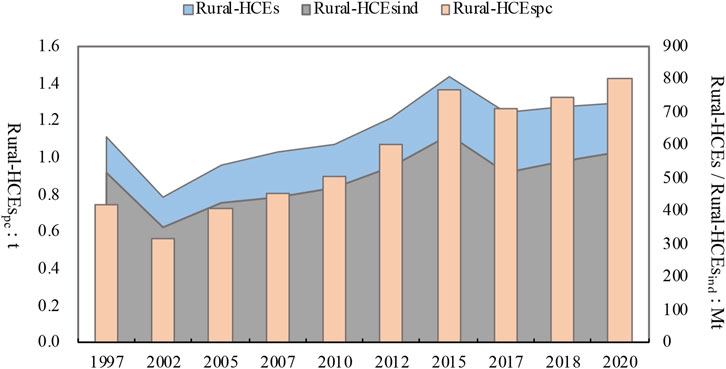
In 1997–2020, the rural HCEs in China showed a trend of first increasing and then decreasing (Figure 1), rising from 625 Mt to 807 Mt in 2015 and then decreasing to 730 Mt in 2020. The per capita rural HCEs showed a wave-like upward trend, gradually increasing from 0.74 t in 1997 to 1.43 t 2020. Among rural HCEs, the proportion of indirect HCEs accounted for about 80%, which is the main component.
Combining the changes of the rural population (in 1997–2020, the total rural population in China decreased rapidly from 842 million to 510 million), rural HCEs, and rural per capita HCEs, it can be observed that, before 2015, the increase in rural HCEs was driven by the positive effect (+) of the increase in rural per capita HCEs, which outweighed the negative effect (−) of the decrease in the rural population. After 2015, the negative effect (−) of the population decrease exceeded the positive effect (+) of the increase in rural per capita HCEs, leading to a reduction in rural HCEs.
3.1.2 Trend of urban HCEs in China
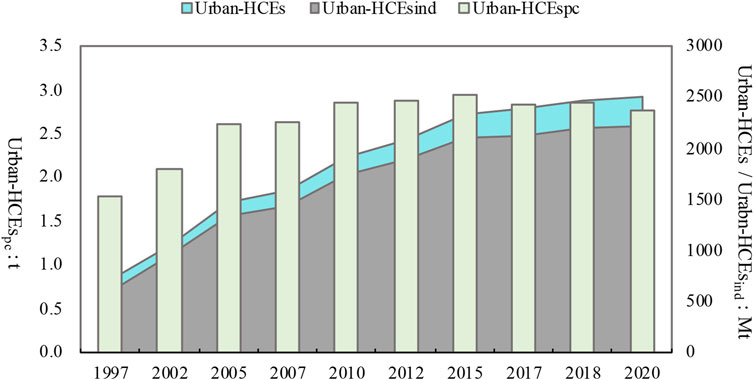
The urban HCEs in China has shown an upward trend, increasing from 709 Mt in 1997–2,505 Mt in 2020, but the growth rate has gradually slowed down after year 2015 (Figure 2). The per capita urban HCEs first increased and then decreased, rising from 1.8 t in 1997 to 2.96 t in 2015, and then gradually decreasing to 2.78 t in 2020, but is still significantly higher than rural per capita HCEs (1.43 t). Among urban HCEs, indirect HCEs accounts for about 90%, which is higher than that of rural households.
China is in the midst of rapid urbanization, with the urbanization rate increasing from 31.9% in 1997 to 63.9% in 2020, and the urban population growing from 395 million to 902 million during the same period. Combined with the evolutionary trend of the urban HCEs, it can be observed that from 1997 to 2015, the increase in urban HCEs was driven by two positive effects: the increase in urban population and the increase in per capita urban HCEs. After 2015, although the decrease in per capita urban HCEs had a negative effect on urban HCEs, it was smaller than the positive effect by the increase in urban population, thus the urban HCEs still shows an upward trend, but at a slower rate of increase.
3.1.3 Trend of the total HCEs in China
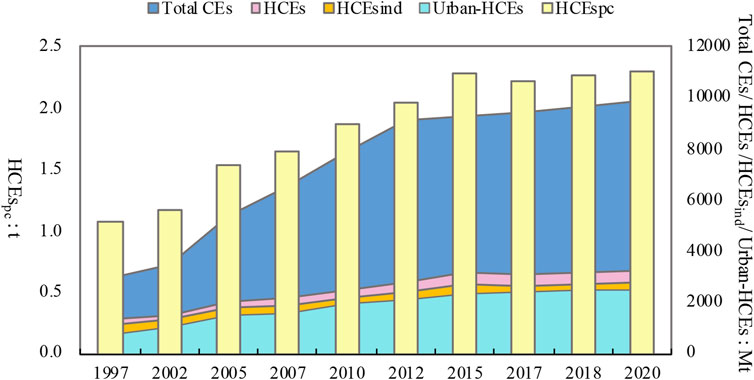
Integrating the rural and urban HCEs, the total HCEs in China showed an upward trend. It firstly increased fast from 1,333 Mt to 3,152 Mt in1997–2015 (Figure 3), with an annual growth rate of 4.9%, which was due to the rapid rise in both urban and rural HCEs. After 2015, the growth rate of total HCEs slowed down, only reaching 3,235 Mt in 2020, with an annual growth rate of 0.5%, mainly because the rural HCEs began to decline and the growth rate of urban HCEs slowed down. The total HCEs in China accounts for about one-third of its total CEs, which is consistent with the research results of Peng et al. (2023), Li et al. (2015), Liu et al. (2011), and Guan et al. (2018).
The per capita HCEs in China showed a significant upward trend before 2015, increasing from 1.08 t in 1997 to 2.28 t in 2015. After 2015, the variations were relatively small, with a value of 2.29 t in 2020.
In terms of urban-rural structure, the urban HCEs is the main source of HCEs in China, accounting for nearly 80%. Although per capita urban HCEs is on a downward trend, it is still far higher than the per capita level in rural areas.
In terms of emission sources, the proportion of indirect HCEs (both rural and urban included) in the total HCEs exceeds 80%. This indicates that promoting HCEs reduction not only requires attention to reduce direct energy consumption from households’ electricity and energy use, but also to reduce indirect energy consumption from residence, clothing, transportation, entertainment, education, etc.
3.2 Comparison of major contributing sectors in rural and urban indirect HCEs
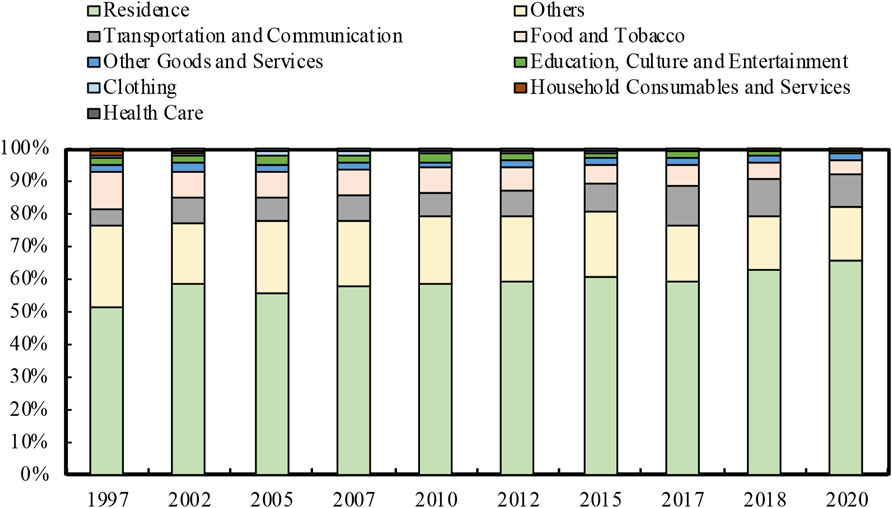
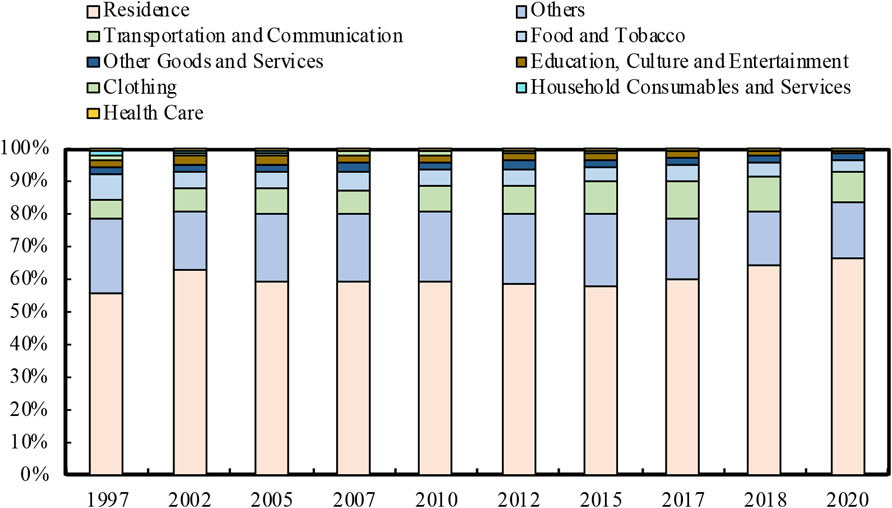
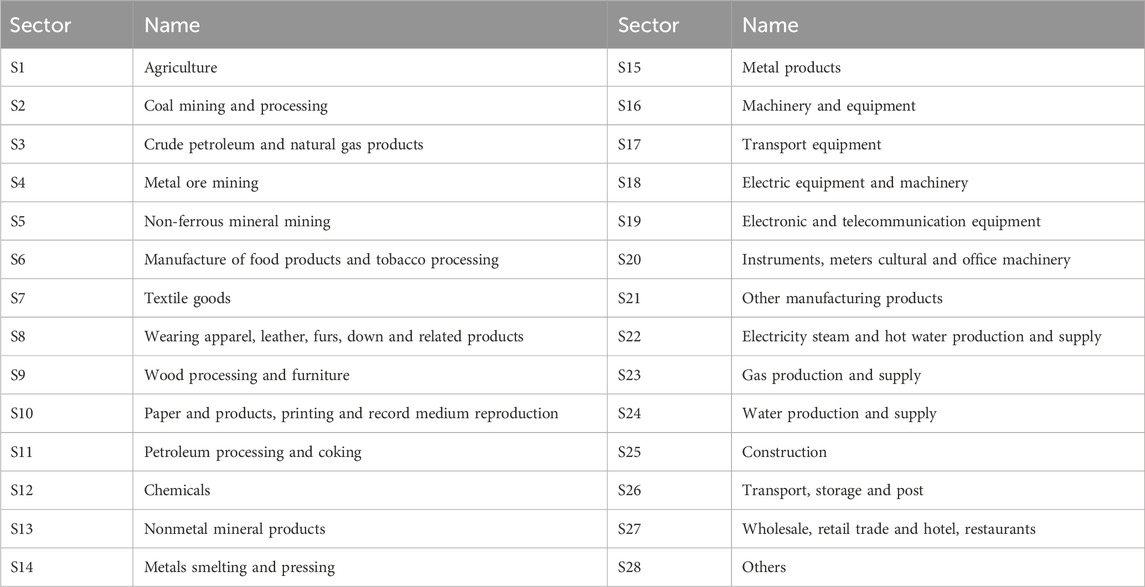
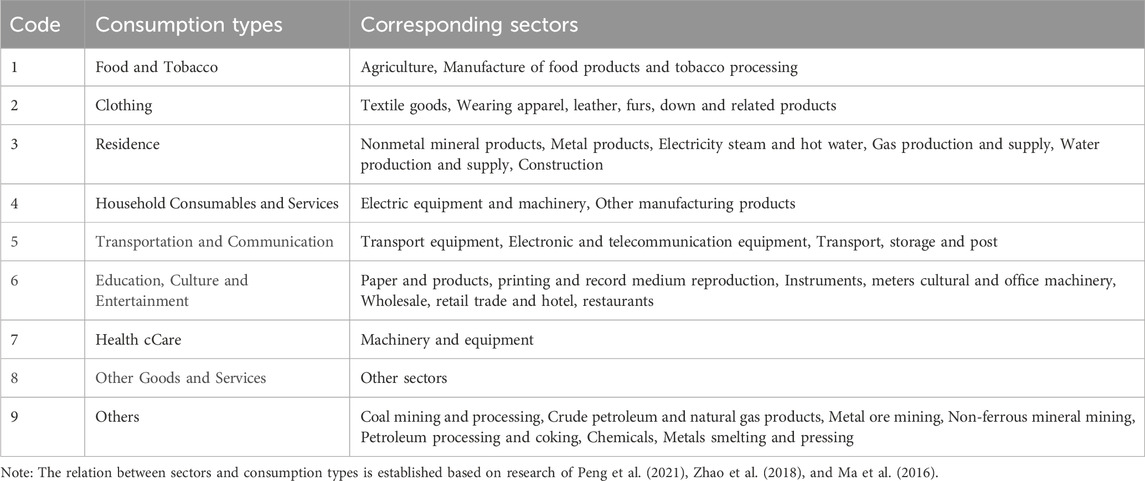
To reveal the main contributors of the rural and urban indirect HCEs, we interact the 28 sectors in accounting indirect HCEs with the eight consumption types (the relation between the 28 sectors and the consumption types is in Table A2). It can be obtained that Residence, Food and Tobacco, Transportation and Communication are the main contributors of both rural and urban indirect HCEs. They account for 66.65%, 9.78%, 4.54% of the rural indirect HCEs (Figure 4), and 66.68%, 9.36%, 3.23% of the urban indirect HCEs (Figure 5), respectively in 2020.
3.3 Phase analysis and driving force decomposition
3.3.1 Phase analysis
Summarizing the above analysis results, the evolution of rural and urban HCEs in China, as well as that of rural and urban per capita HCEs, show different trends. The rural HCEs increased before 2015 and then decreased, but its per capita HCEs has always shown an upward trend. The urban HCEs has been increasing, but its per capita HCEs started to decrease after 2015. Therefore, in order to deeply analyze the driving forces of rural and urban HCEs in China, this study conducts SDA on the evolution of rural and urban HCEs, separately. Moreover, because 2015 is a turning point for the rural HCEs and the urban per capita HCEs, this study conduces a phase SDA analysis of the rural and urban HCEs in 1997–2015 and 2015–2020.
3.3.2 Driving force decomposition of rural HCEs in China
From 1997 to 2015, the rural HCEs increased from 625 Mt to 807 Mt, with the population effect was −265 Mt, and the rural per capita HCEs effect was 448 Mt. The decrease in the rural population, which decreased from 842 million to 590 million, led to a reduction in rural HCEs by 265 Mt (Figure 6). The increase in per capita rural HCEs, which increased from 0.74 t to 1.37 t, contributed to an increase in rural HCEs by 448 Mt. Therefore, the rural HCEs increased. In the decomposition of per capita HCEs, the rise in rural households’ consumption expenditure (increased from 1,617 to 9223 yuan) was the driving factor for the increase in rural per capita HCEs, which promotes the rural per capita HCEs increase by 2.31t, while the decline in CE intensity (decreased from 4.59 t/104 yuan to 1.67 t/104 yuan) was the inhibiting factor, leading to a decrease of 1.68 t for urban per capita HCEs. The positive driving forces of households’ consumption expenditure is greater than the inhibiting forces of CE intensity, leading to a growth in rural per capita HCEs, and a positive expenditure effect of 1,654 Mt, and a negative CE intensity effect of −1,206 Mt, on the total rural HCEs. For change of CE intensity, the optimization of the energy structure (with the CE coefficient decreased from 1.96 to 1.67) and the reduction in energy consumption intensity (decreased from 2.34 t/104 to 0.89 t/104) in rural areas collectively push down the rural CE intensity, and correspondingly negative effects of −180 Mt and −1,026 Mt on rural HCEs, respectively.
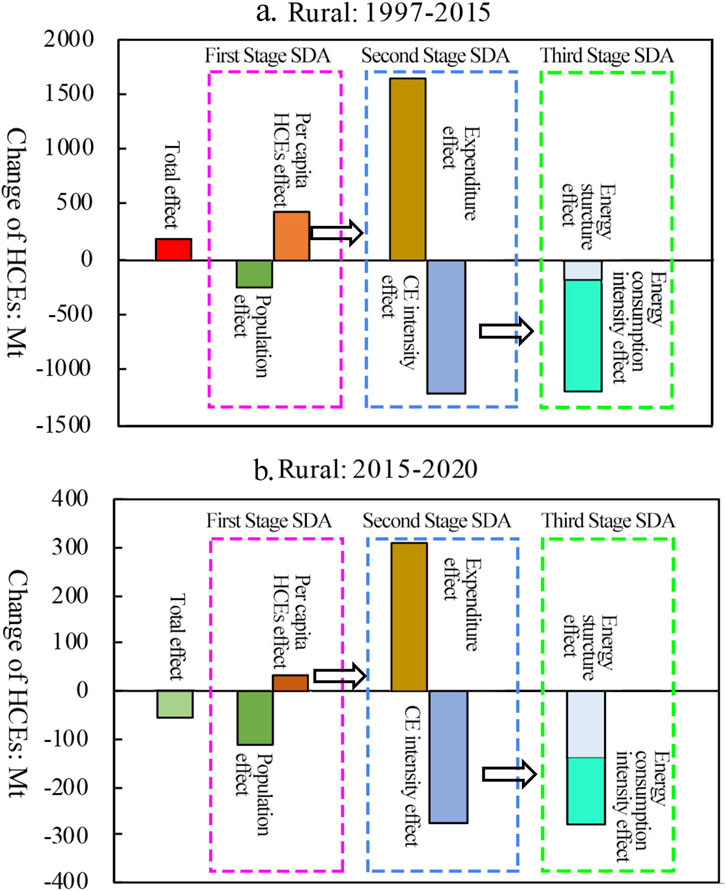
Figure 6. The SDA results of change of the rural HCEs in China. (A) Rural: 1997–2015. (B) Rural: 2015–2020.
From 2015 to 2020, The population effect remains negative, −112 Mt, the rural per capita HCEs effect remains positive, 35 Mt, hence rural HCEs shows a downward trend. In terms of the decomposition of change of rural per capita HCEs, the increase in rural households’ consumption expenditure (increased from 9223 yuan to 13713 yuan) leading to an increase in rural per capita HCEs (0.57 t), is still higher than the decrease caused by the reduction in CE intensity (0.5 t), thus rural per capita HCEs continue to rise but with a declining speed, leading to a positive rural per capita HCEs effect of 35 Mt, a positive expenditure effect of 312 Mt, and a negative effect of −277 Mt on the rural HCEs. As a result, the negative population effect is greater than the positive per capita HCEs effect, and the rural HCEs starts to decrease. The effects of energy structure and energy consumption intensity continue to be negative, at −139 Mt and −138 Mt, respectively, jointly promoting the decrease in rural CE intensity.
In summary, the increase in rural households’ consumption expenditure promotes an increase in rural HCEs, while the reduction in the rural population, the optimization of the energy structure, and the decrease in energy consumption intensity jointly drive its reduction. From 1997 to 2015, the negative population effect, energy structure effect, and energy consumption intensity effect is smaller than the positive expenditure effect, thus the rural HCEs increase. From 2015 to 2020, the driving forces reversed, the rural HCEs decreases.
3.3.3 Driving force decomposition of urban HCEs in China
From 1997 to 2015, the growth in urban population (increased from 395 million to 793 million, with the urbanization rate growing from 31.9% to 57.3%) and the increase in urban per capita HCEs (increased from 0.74 tons to 1.37 tons) jointly drove the growth in urban HCEs. The population effect and the urban per capita HCEs effect are 947 Mt and 689 Mt, respectively (Figure 7). For the urban per capita HCEs effect, the rise in urban households’ consumption expenditure (increased from 4,186 yuan to 21,392 yuan) promotes the urban per capita HCEs increase by 4.88 t, and the decline in CE intensity (decreased from 4.59 t/104 yuan to 1.48t/104 yuan) leads to the urban per capita HCEs reduce by 3.72 t, causing a positive urban per capita HCEs effect of 689 Mt, a positive expenditure effect of 2,898 Mt, and a negative CE intensity of 2,209 Mt, respectively. Further decomposing the CE intensity effect, the optimization of the energy structure (with the CE coefficient decreasing from 1.99 to 1.85) and the decrease in energy consumption intensity (decreased from 2.16 t/104 yuan to 0.75 t/104 yuan) jointly pushed down CE intensity, thereby leading to a negative CE intensity effect. The energy structure effect and the energy consumption intensity effect were −154 Mt and −2,055 Mt, respectively.
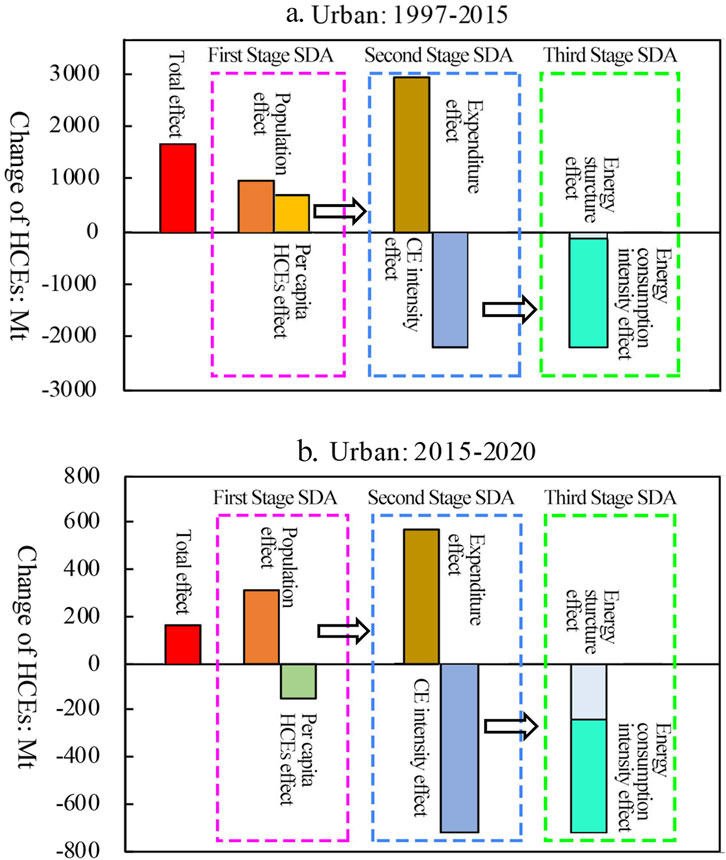
Figure 7. The SDA results of change of the urban HCEs in China. (A) Urban: 1997–2015. (B) Urban: 2015–2020.
From 2015 to 2020, the continuous growth of the urban population (increased to 902.2 million, and the urbanization rate grew to 63.9%) further boosted the urban HCEs, with a population effect of 312.96 Mt. However, the urban per capita HCEs effect turned negative due to the decline in urban per capita HCEs, amounting to −153.20 Mt, which inhibits the increase in urban HCEs. Decomposing the urban per capita HCEs, it can be seen that the promotional effect of the rise in urban households’ consumption expenditure on urban per capita urban HCEs (+0.68t) was smaller than the inhibitory effect of the decline in CE intensity (−0.86t), resulting in a decrease in urban per capita HCEs, presenting an positive expenditure effect of 573.55 Mt, while a negative CE intensity effect of −726.75 Mt. Furtherly decomposing the urban CE intensity effect, it can be obtained that the energy structure effect and the energy consumption intensity effect were −239 million tons and −487 million tons, respectively.
In summary, the increase in urban population and the rise in expenditure have promoted the growth of urban HCEs, while optimization of the energy structure and a decline in energy consumption intensity have inhibited its increase. However, the overall inhibiting effect is smaller than the promotional effect. From 1997 to 2015, the effect caused by the rise in urban households’ consumption expenditure is greater than the decrease caused by the decline in CE intensity, leading to an increase in urban per capita HCEs, and a positive urban per capita HCEs effect. From 2015 to 2020, the magnitudes of the two effects were reversed, resulting in a decrease in urban per capita urban HCEs, a negative urban per capita urban HCEs effect.
4 Policy recommendations and implications
Based on above results, it can be obtained that the evolutionary trends and driving forces of rural and urban HCEs in China, as well as that of rural and urban per capita HCEs in China are obviously different. For urban HCEs, although the urban per capita HCEs have decreased, the continued rapid growth of the urban population has promoted the urban HCEs to continue rising. China is now in the process of rapid urbanization, according to the “National Population Development Plan (2016)”, by 2030, the rate of permanent urbanization in China will reach 70%. The continued increase in urban population will further have a positive effect on the urban HCEs and promote its growth. For rural HCEs, although the rural HCEs shows a downward trend, this is mainly due to the decrease in the rural population. The rural per capita HCEs is still on the rise, and the gap between rural and urban per capita HCEs is still significant (the rural per capita HCEs is 1.43t, while the urban per capita HCEs is 2.78t, in 2020). In the future, as the expenditure level of rural households continues to rise, the rural per capita HCEs will continue to grow, leading to a positive effect on rural HCEs. Therefore, when analyzing China’s HCEs and formulating policy recommendations for HCEs reduction, it is essential to fully consider the urban-rural characteristics, so as to ensure their relevance and effectiveness.
Meanwhile, China is the world’s largest developing country, with a strong development momentum and tremendous potential. According to China’s second centennial goal, by the mid-21st century, the per capita GDP should reach the level of middle-income countries, achieving a range of 40,000 to 50,000 US dollars (Wang, 2023). In the future, with China’s economic growth and the improvement of people’s income and expenditure levels, the expenditure effect will continue to be positive. The dual positive effects of increased urban population and increased expenditure in both urban and rural households will promote an increase in HCEs. In this case, to inhibit increase in HCEs or to promote its reduction, it is crucial to intensify efforts to optimize the energy structure and reduce energy consumption intensity. To achieve these goals, on one hand, it is necessary to develop clean and renewable energy sources, especially solar energy, to increase their proportion in the energy structure. In China, the cost of photovoltaic power generation is far lower than that of coal - fired power generation. China has a vast territory and is rich in solar energy resources. Thereby, promoting photovoltaic power generation is essential for energy conservation and CE reduction. In rural areas, utilize the advantages of rural residences to promote distributed photovoltaic power generation, and strengthen the construction of household energy - storage devices, to achieve self - sufficiency in energy use for rural households. In urban area, build distributed photovoltaic power generation systems on large - area surface areas such as the roofs and walls of industrial parks, large - scale commercial and public buildings in the city, construct solar power stations on vacant lands around the city, and integrate photovoltaic power generation into the urban power grid. In addition, use solar lights in urban street lighting, parks, squares and other lighting systems. Take multiple measures simultaneously to promote the development of renewable and clean energy in rural and urban areas. On the other, it is necessary to accelerate the construction of a circular economy system, promote the recycling of resources, and achieve energy conservation and emission reduction.
Additionally, China’s HCEs accounts for one-third of the country’s total CEs, with indirect HCEs accounting for over 80% (both rural and urban included). Therefore, promoting the reduction of HCEs not only requires reduction in direct energy consumption, but also in indirect energy consumption. Among the indirect HCEs, Residence, Food and Tobacco, and Transportation and Communication are the three main contributing sectors, both in rural and urban households. Thus, promoting the low-carbon transformation of households’ consumption, especially low-carbon transformation of these three types, and encouraging households to adopt low-carbon consumption behaviors, such as frugal consumption, waste avoidance, recycling, and choosing low-carbon products, is of great significance. It will not only directly promote the HCEs reduction, but also indirectly incentivize the production side to save energy and reduce CEs, which is of great significance both for HCEs reduction and the overall production CEs reduction. To promote the low-carbon transformation of households’ consumption, following countermeasures could be implemented. ①Strengthen the publicity and promotion of low - carbon consumption, and gradually establish residents’ awareness of low - carbon consumption. ② Establish a low - carbon consumption incentive mechanism. For example, subsidies can be obtained for purchasing products with lower carbon emissions among similar products. ③Moderately specify the legal obligations of residents in low-carbon consumption. For example, clearly specify in laws that residents bear the obligations of CE reduction and low - carbon consumption, etc. By integrating publicity and education, incentive mechanisms, and obligation, to promote the low - carbon transformation of households’ consumption, thereby reducing the HCEs and forcing enterprises to improve energy efficiency and reduce CE intensity.
5 Conclusion
This study conducts a comparative analysis of the evolutionary trends, characteristics, and driving forces of the urban and rural HCEs in China by applying the EIO-SDA model, based on the latest long-term input-output tables of China from 1997 to 2020, sectoral energy consumption data, etc. It is acquired that the evolutionary trends and driving forces of rural and urban HCEs in China, as well as that of rural and urban per capita HCEs in China vary significantly. The rural HCEs increased before 2015 and then decreased, but the per capita HCEs has always shown an upward trend. The urban HCEs has been increasing, but its per capita HCEs started to decrease after 2015. The indirect HCEs accounting for over 80% of the total HCEs, and Residence, Food and Tobacco, Transportation and Communication are the three main contributing sectors, both for rural and urban households.
For driving forces, the rural HCEs: the increase in rural households’ consumption expenditure promotes an increase in rural HCEs, while the reduction in the rural population, the optimization of the energy structure, and the decrease in energy consumption intensity jointly drive its reduction. From 1997 to 2015, the negative population effect, energy structure effect, and energy consumption intensity effect is smaller than the positive expenditure effect, thus the rural HCEs increase. From 2015 to 2020, the magnitudes of these effects were reversed, the rural HCEs decreases. For rural per capita HCEs, its expenditure effect is always bigger than the CE intensity effect, thus the rural per capita HCEs keeps rising. For urban HCEs, the increase in urban population and the rise in expenditure have promoted the growth of urban HCEs, while optimization of the energy structure and a decline in energy consumption intensity have inhibited its increase. However, the overall inhibiting effect is smaller than the promotional effect. From 1997 to 2015, the effect caused by the rise in urban households’ consumption expenditure was greater than the decrease caused by the decline in CE intensity, leading to an increase in urban per capita HCEs, and a positive urban per capita HCEs effect. From 2015 to 2020, the magnitude of the two effects was reversed, resulting in a decrease in urban per capita urban HCEs, a negative urban per capita urban HCEs effect.
Based on above results, some policy implications were proposed, including fully consider the urban-rural characteristics, so as to ensure policies’ relevance and effectiveness, intensify efforts to optimize the energy structure and reduce energy consumption intensity, promotes the low-carbon transformation of households’ consumption and encourage households to adopt low-carbon consumption behaviors. This study can promote urban and rural HCEs reduction, and help the implementation of China’s dual carbon goals.
Data availability statement
The original contributions presented in the study are included in the article/supplementary material, further inquiries can be directed to the corresponding authors.
Author contributions
YY: Conceptualization, Formal Analysis, Funding acquisition, Methodology, Writing–original draft. MY: Data curation, Formal Analysis, Methodology, Writing–original draft. JL: Conceptualization, Methodology, Writing–original draft. ZW: Formal Analysis, Methodology, Writing–review and editing. YuC: Conceptualization, Formal Analysis, Supervision, Writing–review and editing. YaC: Data curation, Methodology, Writing–original draft.
Funding
The author(s) declare that financial support was received for the research, authorship, and/or publication of this article. This work is funded by the Science and Technology Basic Resources Investigation Program of China (2022FY101903), National Natural Science Foundation of China (72304026 and 72140001).
Conflict of interest
The authors declare that the research was conducted in the absence of any commercial or financial relationships that could be construed as a potential conflict of interest.
Generative AI statement
The author(s) declare that no Generative AI was used in the creation of this manuscript.
Publisher’s note
All claims expressed in this article are solely those of the authors and do not necessarily represent those of their affiliated organizations, or those of the publisher, the editors and the reviewers. Any product that may be evaluated in this article, or claim that may be made by its manufacturer, is not guaranteed or endorsed by the publisher.
References
CEADs (2024). China CO2 inventory in 1997-2021 (by IPCC sectoral emissions). CEADs. Available at: https://www.ceads.net.
Cheng, H., Dong, S. C., Li, F. J., Yang, Y., Li, S. T., and Li, Y. (2018). Multiregional input-output analysis of spatial-temporal evolution driving force for carbon emissions embodied in interprovincial trade and optimization policies: case study of northeast industrial district in China. Environ. Sci. Technol. 52, 346–358. doi:10.1021/acs.est.7b04608
Climate Change (2022). Mitigation of climate change. IPCC. Available at: https://www.ipcc.ch/report/ar6/wg3/.
Emissions Gap Report (2020). Emissions gap Report. Nairobi, Kenya: UNEP. Available at: https://www.unep.org/emissions-gap-report-2020.
Fan, J. S., Zhou, L., Zhang, Y., Shao, S., and Ma, M. (2021). How does population aging affect household carbon emissions? Evidence from Chinese urban and rural areas. Energy Econ. 100, 105356. doi:10.1016/j.eneco.2021.105356
Guan, D. B., Meng, J., David, R., Zhang, N., Shan, Y. L., Mi, Z. F., et al. (2018). Structural decline in China’s CO2 emissions through transitions in industry and energy systems. Nat. Geosci. 11, 551–555. doi:10.1038/s41561-018-0161-1
He, J. K., Li, Z., and Zhang, X. L. (2020). Comprehensive report on China’s long-term low-carbon development strategy and transformation path. China Pop. Resour. Environ. 30 (11), 1–25. doi:10.12062/cpre.20201025
Hu, A. G. (2021). China’s goal of achieving carbon peak by 2030 and its main approaches. J. Beijing Univ. Technol. 21 (03), 1–15. doi:10.12120/bjutskxb202103001
Jakob, M., and Marchiniski, R. (2013). Interpreting trade-related CO2 emissions transfers. Nat. Clim. Change 3, 19–23. doi:10.1038/nclimate1630
Li, Y. M., Zhao, R., Liu, T. S., and Zhao, J. F. (2015). Does urbanization lead to more direct and indirect household carbon dioxide emissions? Evidence from China during 1996–2012. J. Clean. Prod. 102, 103–114. doi:10.1016/j.jclepro.2015.04.037
Lin, B. Q. (2022). China’s high-quality economic growth in the process of carbon neutrality. Econ. Res. J. 57 (01), 56–71.
Liu, L. C., Gang, W., Jnw, A., and Ymwb, D. (2011). China’s carbon emissions from urban and rural households during 1992–2007. J. Clean. Prod. 19, 1754–1762. doi:10.1016/j.jclepro.2011.06.011
Liu, X. Y., Wang, X. A., Song, J. N., Wang, H. N., and Wang, S. (2019). Indirect carbon emissions of urban households in China: patterns, determinants and inequality. J. Clean. Prod. 241, 118335. doi:10.1016/j.jclepro.2019.118335
Ma, X. W., Ye, Y., Du, J., and Li, H. Z. (2016). Calculation and analysis on indirect carbon emissions from household consumption between China and the United States based on input-output model. J. Beijing Inst. Technol. Soc. Sci. ed. 18 (1), 24–29. doi:10.15918/j.jbitss1009-3370.2016.0104
Meng, J., Huo, J. W., Zhang, Z. K., Liu, Y., Mi, Z. F., Guan, D. B., et al. (2023). The narrowing gap in developed and developing country emission intensities reduces global trade's carbon leakage. Nat. Commun. 14 (1), 3775. doi:10.1038/s41467-023-39449-7
Mi, Z. F., Zheng, J. L., Meng, J., Qu, J. M., Hubacek, K., Liu, Z., et al. (2020). Economic development and converging household carbon footprints in China. Nat. Sustain. 3 (7), 529–537. doi:10.1038/s41893-020-0504-y
National Bureau of Statistics (2024). Annual data. National Bureau of Statistics of China. Available at: https://www.stats.gov.cn.
National Population Development Plan (2016). State Council of China. Beijing, China, 12–30. Available at: https://www.gov.cn/gongbao/content/2017/content_5171324.htm.
Paris Agreement (2015). The UN. Available at: https://www.un.org/en/climatechange/paris-agreement.
Peng, L. L., Li, N., Zheng, Z. Y., Li, F., and Wang, Z. (2021). Spatial-temporal heterogeneity of carbon emissions and influencing factors on household consumption of China. China Environ. Sci. 41 (01), 463–472. doi:10.19674/j.cnki.issn1000-6923.2021.0052
Peng, S., Wang, X., Du, Q., Wu, K. R., Lv, T. T., Tang, Z., et al. (2023). Evolution of household carbon emissions and their drivers from both income and consumption perspectives in China during 2010-2017. J. Environ. Manage. 326, 116624. doi:10.1016/j.jenvman.2022.116624
Peters, G. P., and Hertwich, E. G. (2008). CO2 embodied in international trade with implications for global climate policy. Environ. Sci. Technol. 42, 1401–1407. doi:10.1021/es072023k
Shi, X. P., Wang, K. Y., Cheong, T. S., and Zhang, H. W., 2020. Prioritizing driving factors of household carbon emissions: An application of the LASSO model with survey data. Energy Econ. 92, 104942. doi:10.1016/j.eneco.2020.104942
Su, B., Huang, H. C., Ang, B. W., and Zhou, P. (2010). Input-output analysis of CO2 emissions embodied in trade: the effects of sector aggregation. Energy Econ. 32, 166–175. doi:10.1016/j.eneco.2009.07.010
Wang, C., and Zhang, Y. X. (2020). Implementation pathway and policy system of carbon neutrality vision. Chin. J. Environ. Manage. 12 (06), 58–64. doi:10.16868/j.cnki.1674-6252.2020.06.058
Wang, Y. M. (2023). Promote Chinese-style modernization with high-quality development. Available at: http://theory.people.com.cn/n1/2023/0407/c40531-32659090.html.
Wang, Z. H., and Yang, Y. T. (2016). Features and influencing factors of carbon emissions indicators in the perspective of residential consumption: evidence from Beijing, China. Ecol. Indic. 61 (2), 634–645. doi:10.1016/j.ecolind.2015.10.015
Wiedenhofer, D., Guan, D. B., Liu, Z., Meng, J., Zhang, N., and Wei, Y. M. (2017). Unequal household carbon footprints in China. Nat. Clim. Change 7 (1), 75–80. doi:10.1038/nclimate3165
Xie, Z. Q., Gao, X. N., Yuan, W. H., Fang, J. D., and Jiang, Z. B. (2020). Decomposition and prediction of direct residential carbon emission indicators in Guangdong Province of China. Ecol. Indic. 115, 106344. doi:10.1016/j.ecolind.2020.106344
Yang, Y., Dong, S. C., Li, F. J., Cheng, H., Chi, Y. Y., Li, Z. H., et al. (2022). Interregional polarized and trickling-down effect of carbon emission space and the optimization policies: case studies of the Jing-Jin-Ji region. J. Clean. Prod. 370, 133426. doi:10.1016/j.jclepro.2022.133426
Yang, Y., Zhou, Y. N., Shan, Y. L., and Klaus, H. (2024). The shift of embodied energy flows among the Global South and Global North in the post-globalisation era. Energy Econ. 107408. doi:10.1016/j.eneco.2024.107408
Yuan, R., Rodrigues, J., and Behrens, P. (2019). Driving forces of household carbon emissions in China: a spatial decomposition analysis. J. Clean. Prod. 233, 932–945. doi:10.1016/j.jclepro.2019.06.110
Zhang, X. L., Huang, X. D., Zhang, D., Geng, Y., Tian, L. X., Fan, Y., et al. (2022). Research on the pathway and policies for China’s energy and economy transformation toward carbon neutrality. Manage. World. 38 (01), 35–66. doi:10.19744/j.cnki.11-1235/f.2022.0005
Zhao, L. T., Zhao, T., and Yuan, R. (2021). Drivers of household decarbonization: decoupling and decomposition analysis. J. Clean. Prod. 289, 125154. doi:10.1016/j.jclepro.2020.125154
Zhao, M. X., Yuan, Z. H., and Chan, H. S. (2023). Housing wealth and household carbon emissions: the role of homeownership in China. Ecol. Econ. 212, 107908. doi:10.1016/j.ecolecon.2023.107908
Zhao, Y. H., Li, W. L., and Wang, S., 2018. Calculation and driving forces of indirect carbon emissions from household consumption in Beijing. J. Beijing Inst. Technol. Soc. Sci. ed. 20(3), 33–44. doi:10.15918/j.jbitss1009-3370.2018.3265
Appendix
Keywords: households’ carbon emissions (HCEs), evolutionary trend, characteristics, driving forces, EIO-SDA model
Citation: Yang Y, Yang M, Luo J, Wang Z, Chi Y and Chen Y (2024) The evolution, characteristics, and driving forces of the rural-urban HCEs in China: based on the EIO-SDA model. Front. Environ. Sci. 12:1518120. doi: 10.3389/fenvs.2024.1518120
Received: 28 October 2024; Accepted: 29 November 2024;
Published: 13 December 2024.
Edited by:
Ji Zheng, The University of Hong Kong, Hong Kong SAR, ChinaReviewed by:
Chen Li, Shanghai University of Engineering Sciences, ChinaSheng Cheng, China University of Geosciences Wuhan, China
Copyright © 2024 Yang, Yang, Luo, Wang, Chi and Chen. This is an open-access article distributed under the terms of the Creative Commons Attribution License (CC BY). The use, distribution or reproduction in other forums is permitted, provided the original author(s) and the copyright owner(s) are credited and that the original publication in this journal is cited, in accordance with accepted academic practice. No use, distribution or reproduction is permitted which does not comply with these terms.
*Correspondence: Yang Yang, eWFuZ3lAYmp1dC5lZHUuY24=; Yuanying Chi, Z29vZGN5eUBianV0LmVkdS5jbg==
 Yang Yang
 Meijian Yang2