- 1College of Business Administration, Liaoning Technical University, Huludao, Liaoning, China
- 2Business School, University of Western Australia, Perth, WA, Australia
- 3Research Center of Public Policy, Peking University, Beijing, China
Reducing carbon emissions is crucial for environmental protection and the survival of humankind, particularly in agricultural growth, as it ensures the sustainability of the food supply. This study examines the import of the crop production agglomeration on carbon emissions across several areas of China. It employs panel data spanning from 2012 to 2022. The crop production agglomeration was assessed using the average industrial agglomeration rate, whereas the carbon emissions were evaluated using the IPCC carbon emission factors. Empirical analyses were conducted using the panel fixed effects model and the Spatial Durbin Model . The results indicate that crop production agglomeration directly reduces carbon emissions. Moreover, the concentration of crop production has a geographical demonstration effect on carbon emissions, where greater levels of crop production agglomeration result in a more efficient decrease of carbon emissions in nearby regions. An analysis of heterogeneity indicates that the impact of crop production agglomeration on carbon emissions is more pronounced in the eastern and northeastern regions of China compared to the central and western areas. The study advocates for the formulation of tailored carbon reduction methods that align with the distinct attributes of crops in various locations. It promotes variety and low-carbon development in crop production to drive industrial advancement. The study advocates for enhancing cooperation among crop production enterprises across various areas to provide platforms for information exchange and technical innovation. Furthermore, it advocates for governments to design efficient methods and regulations to reduce carbon emissions in crop production.
1 Introduction
Human-induced climate change represents a substantial environmental hazard driven mainly by greenhouse gas emissions. It is imperative for all industries worldwide to swiftly participate in decreasing these emissions to mitigate this persistent trend. Despite considerable advancements in the energy and industrial sectors regarding climate change mitigation, the significant influence of the agriculture sector has often been neglected. Agricultural production significantly contributes to greenhouse gas emissions, impacting global warming and climate change. Notably, since the 1970s, agriculture has constituted approximately one-third of global greenhouse gas emissions (Gilbert, 2012). Crop production carbon emissions (CPCE), including black carbon released from the incineration of agricultural residues, have persistently adversely affected the quantity and quality of agricultural outputs (Gupta, 2014). CPCE is identified as a significant impediment to the sustainability of agricultural growth (Koondhar et al., 2021). Addressing CPCE is essential for sustaining food systems and facilitating human civilization’s continued existence and advancement (Singh et al., 2021). China accounts for around 18% of the worldwide population while holding just 7.8% of the world’s arable land, a statistic diminishing (Greenwood, 2022). Consequently, improving food security by decreasing CPCE is especially urgent.
Agriculture, which encompasses both natural and human characteristics, naturally has the capacity to engage with regional economies (He et al., 2020). Recently, the spatial distribution of agriculture has shown a distinct tendency toward agglomeration. In contrast to the concentration in the industrial and energy sectors, agricultural agglomeration mainly occurs in resource-rich areas, which is evident in crop production agglomeration (CPA). This specialization generally encompasses the production, processing, and distribution stages of agricultural goods. While this concentration of resources promotes regional economic development, it also results in elevated resource consumption and an increased application of fertilizers and pesticides, thereby raising carbon emissions. Conversely, production agglomeration allows crop production enterprises to exchange resources and promotes technical collaboration, innovation, and talent cultivation across enterprises and research institutes. These activities facilitate technological progress and may decrease carbon emissions. The precise effect of this urbanization on crop production carbon emissions (CPCE) requires further examination.
Therefore, this research aims to assess the influence of CPA on CPCE. This research utilizes panel data from 2011 to 2022 across 29 Chinese provinces, using the IPCC’s carbon emission coefficients and the average industrial agglomeration rate to measure both CPCE and CPA. Additionally, the Spatial Durbin Model (SDM) is used to assess the spatial interactions among these components, providing innovative additions to the current research. This study first enriches the literature on crop production agglomeration in green agriculture. To date, no studies have focused on the mechanisms by which CPA affects CPCE; this study aims to fill this gap. Secondly, this article use spatial econometric models to assess the geographical effects of CPA on carbon emissions and examines its influence on emissions in adjacent regions. This research is groundbreaking since it investigates the influence of CPA on carbon emissions, a subject not previously addressed in published literature.
2 Literature review
2.1 Measurement and influencing factors of CPCE
In agriculture, inputs and energy are well-acknowledged as critical indicators for assessing carbon emissions. Academic studies often calculate agricultural carbon emissions by analyzing the emission factors of materials used during production and their final consumption (Chen et al., 2020). Furthermore, other assessments have elaborated on this by quantifying agricultural carbon emissions according to end-use, including the impacts of both production materials and energy use (Nguyen et al., 2021; Wilberforce et al., 2021). However, the study on carbon emissions in agriculture must include more than just the use of production inputs and energy, especially for rice cultivation, which is linked to significant emissions of several other greenhouse gases. Thus, assessing agricultural carbon emissions from a life-cycle viewpoint requires the incorporation of all greenhouse gases released during the production cycle (Li et al., 2024).
The current study thoroughly investigates the determinants affecting the decrease of carbon emissions in agriculture and the feasible strategies for doing this, with some studies emphasizing the pivotal role of industrial agglomeration (Wang and Wang, 2020). Preliminary research suggests that human attributes, including farmers’ understanding of low-carbon practices, social network integration, reputation, and expectations, substantially influence their choices to embrace low-carbon agricultural production techniques (Adedoyin et al., 2020). Research indicates that farmers possessing more understanding of low-carbon agriculture are more likely to implement low-carbon norms in fertilizer use (Tian et al., 2015). Similarly, farmers designated as cadres have a greater propensity to choose low-carbon insecticides. Moreover, studies have examined the influence of carbon reduction policies on agricultural strategies, indicating that government subsidy initiatives significantly enhance low-carbon agriculture’s economic and environmental advancement, thus encouraging farmers to adopt diverse low-carbon agricultural practices (Li and Xu, 2022; Sarkodie et al., 2020). Recent research has thus moved its focus to the impact of industrial agglomeration on agricultural carbon emissions. Studies indicate that industrial agglomeration results in the enlargement of agricultural scale, the establishment of economies of scale, and the enhancement of energy efficiency, subsequently causing total carbon emissions and carbon emission intensity to initially rise and then decline, exhibiting an inverted U-shaped and N-shaped curve, respectively (Yao et al., 2018; Tian and Yin, 2021).
2.2 Research on the effect of agricultural production aggregation
The current study extensively examines the relationship between industrial clustering and its impacts on economic growth and environmental effects, covering agricultural, manufacturing, and services. Research substantiates that through positive externalities, economic and industrial agglomerations contribute to economic growth (Fang et al., 2021). However, several studies highlight that agglomerations may induce congestion issues, resulting in a complicated nonlinear dynamic where a suppressive impact follows the early economic expansion and environmental deterioration (Lin et al., 2011; Yuan et al., 2020). Agricultural agglomeration is distinct from industrial and service sectors because of its significant reliance on natural resources and susceptibility to socio-economic changes. With the scale, specialization, and regionalization of agricultural production, more and more studies are being conducted on the impact of agricultural production agglomeration on economic growth and environmental pollution. From the perspective of the brand of agricultural products, Zhang et al. (2024) concluded that the brand of agricultural products reduces carbon emissions through industrial agglomeration. Some research suggests that agglomeration, by increasing production size, intensifies resource use, deteriorates the agricultural ecological environment, and amplifies carbon emissions (Li and Li, 2022). Conversely, another study suggests that agglomeration may alleviate environmental pollution in agriculture; Tian and Yin (2021) discovered that agricultural industrial agglomeration improved the efficiency of agricultural material consumption, hence decreasing carbon emissions. Li et al. (2023) discovered that environmental regulation in the form of resource agglomeration, represented by the high-standard farmland construction policy, can significantly decrease agricultural emissions. Zhang et al. (2022) discovered a threshold impact in agricultural industrial agglomeration on the green and sustainable advancement of agriculture, indicating that it promotes growth to a certain extent, beyond which it may impose a limiting effect.
In conclusion, researchers have thoroughly examined the impact of agricultural production clustering on carbon emissions, emphasizing the significance of the agricultural sector. Nonetheless, due to the prevailing fragmented and non-standardized land use in our nation, research on the correlation between CPA and carbon emissions need additional development. The marginal contributions of this paper are as follows: The incremental contributions of this work are as follows: Firstly, it enriches the literature on crop production agglomeration in green agriculture. To date, no studies have focused on the mechanisms by which CPA affects CPCE; this study aims to fill this gap. Secondly, this research is the inaugural investigation of the carbon reduction consequences of CPA from the viewpoint of several regions inside our nation. This article use spatial econometric models to assess the geographical effects of CPA on carbon emissions and examines its influence on emissions in adjacent regions. This research is groundbreaking since it investigates the influence of CPA on carbon emissions, a subject not previously addressed in published literature.
3 The theoretical mechanism and research hypothesis
Crop production is dependent not only upon the natural environment but also on economic and social factors. China encompasses a vast expanse, with diverse areas demonstrating significant variances in natural and socioeconomic circumstances, resulting in pronounced variations in regional grain output. Nonetheless, from a regional standpoint, neighboring locations’ ecological, economic, and social characteristics are very similar, as are the conditions, types, and techniques of agricultural production. The rapid progress in contemporary transportation and communication has resulted in a tighter interconnection of crop production across neighboring regions, contributing to the region’s CPA and impacting the CPCE.
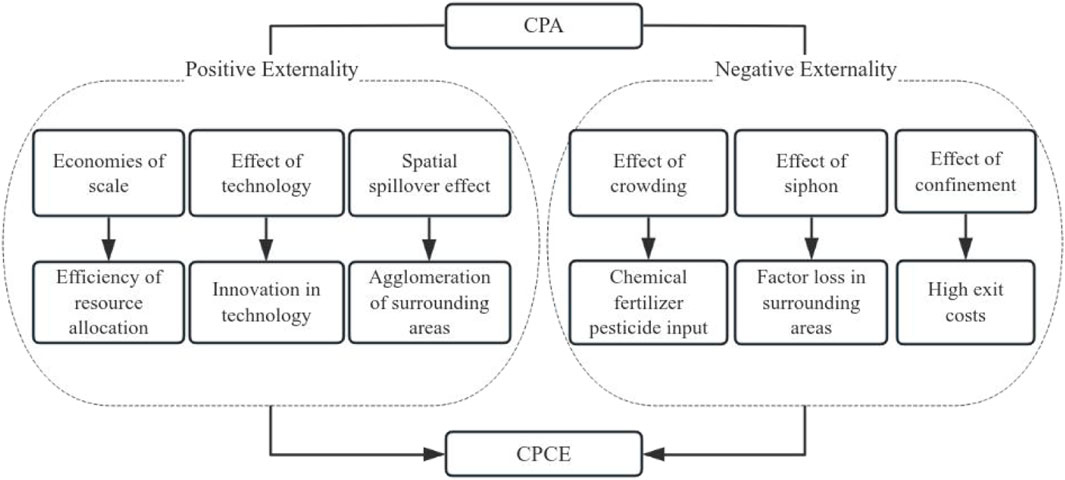
CPA mainly mitigates the CPCE through economies of scale, effects of technological, and spatial spillover effects. (1) Economies of scale. CPA can enhance resource allocation efficiency, facilitate the sharing of production factors in the planting industry, improve the specialization and collaboration among professionals, reduce agricultural production costs and transaction costs, promote the expansion of agricultural production, and thereby generate economies of scale (de Roest et al., 2018). The effect of agricultural economies of scale can curtail the cost of pollution control, optimize the allocation of factors, and enhance the efficacy of resource utilization, hence reducing the CPCE. (2) Technological effect. CPA spurs mutual communication and learning among planting enterprises, jointly realizes technological innovation, and promotes the innovation of energy conservation and emission reduction technologies, thereby improving the efficiency of input factor usage and reducing the consumption of production resources, enabling planting production to obtain more expected output under the condition of the same factor input, and thus improving the carbon reduction efficiency (Xu et al., 2023). (3) Spatial spillover effect. The CPA in this region contributes to reducing carbon emissions within the local planting industry and drives adjacent areas to learn and draw lessons, thereby reducing the CPCE in adjacent areas (Zhang et al., 2024). Based on this, Hypothesis 1a is proposed:
Hypothesis 1a. The CPA can substantially diminish carbon emission intensity and lower carbon emissions per unit area within the crop production.
However, the impact of CPA on carbon emissions is not consistently dampening, and CPA might also engender negative externalities. On the one hand, the concentration of crop production results in an expansion of planting scale, accompanied by increased inputs of pesticides, fertilizers, and other factors. This escalation exerts pressure on the ecological environment of the regional planting industry, contributes to crowding effects, and raises carbon emission intensity in the area (Scotchmer, 2002). On the other hand, the CPA in a particular region will attract the production resources of the planting industry in surrounding areas to converge in this region, resulting in a siphon effect, which is detrimental to the improvement of green and low-carbon technology of the planting industry in surrounding areas and increases the carbon emissions in surrounding areas. Additionally, CPA also has an incarceration effect; that is, due to the substantial investment in land, agricultural machinery, and infrastructure in the early stage of planting, certain farmers with suboptimal production efficiency and minimal profits struggle to exit production and operations, leading them to consume agricultural resources to maintain output inefficiently. This situation contributes to CPA regions’ low green and low-carbon development efficiency and fails to mitigate the CPCE significantly (Lu et al., 2021). Therefore, the effect of CPA on carbon emissions remains uncertain. Based on this, Hypothesis 1b is proposed:
Hypothesis 1b. The CPA enhances carbon emission intensity and elevates carbon emissions per unit area within crop production.
From the perspective of spatial effect, crop production agglomeration affects inter-regional carbon emissions through two mechanisms: (1) Industrial synergies. CPA can guide the optimal allocation of industrial resources through infrastructure sharing and product production cost reduction, and improve industrial production efficiency by using the specialization and rapid flow of labor, thus reducing carbon emissions. (2) Learning effect and competition effect: To become the development benchmark and strive for more favorable policies from the state, there will be competition and imitation among enterprises. On the one hand, through imitating and learning advanced production experience, both industrial development and energy conservation and emission reduction will be taken into account. On the other hand, outstanding enterprises constantly stand out in the competition and become the benchmark in the agglomeration area. The superposition of the imitation learning effect and the competition effect has deepened the carbon correlation between regions. Based on this, Hypothesis 2 is proposed:
Hypothesis 2. The CPA will influence carbon emissions via spatial spillover effects.
Through the above theoretical analysis, the theoretical mechanism diagram of CPA to CPCE is constructed (Figure 1).
4 Data and methodology
4.1 Model settings
This study examines the correlation between crop production agglomeration (CPA) and crop production carbon emission (CPCE) by constructing a model using panel data from 29 provinces, omitting Shanghai, Tibet, Hong Kong, Macau, and Taiwan, from 2012 to 2022.
In Equation 1, i and t represent the province and time respectively,
4.2 Description of variables
4.2.1 Measurement method for CPA
Industrial agglomeration is a relatively comprehensive concept, and there are various methods for its calculation, commonly including industry concentration, the Herfindahl-Hirschman Index (H-index), location quotient, and spatial Gini coefficient, among others. Furthermore, some studies have extended these measures by decomposing the spatial Gini coefficient to generate various extended indices, such as the EG and MS indices, which evaluate the degree of market industry agglomeration. However, due to the high computational demands of these derived indices and the difficulty in obtaining the necessary data for evaluation, their practical application in research is significantly limited. Choosing an appropriate method can often yield more results with less effort.
In this paper, CPA refers explicitly to the concentration and scale of agricultural crop production (including both economic and food crops) and the degree of aggregation of related production entities and production factor resources. Current academic measures of agricultural agglomeration include the spatial Gini coefficient, Herfindahl-Hirschman Index, and Theil Index. However, these indices often overlook spatial biases caused by differences in smaller geographical units (Liu, 2014). Output density, which measures the economic activity per unit area, is considered a robust indicator of economic agglomeration in a region. It illustrates the geographical density and distribution of economic activities and precisely represents the economic output per unit of geographic area. Therefore, this paper adopts the regional industry average agglomeration rate index proposed by Fan (2007) to analyze the geographical agglomeration characteristics of China’s agricultural industry. The specific formula is as follows:
In Equation 2,
Table 1 delineates the chosen categories of agricultural goods for assessing the degree of crop production agglomeration across different provincial areas. The crops primarily include grain and economic crops. However, it is essential to acknowledge that the production conditions of crop products vary across different natural environments and regions. In the final calculation, the m value for each type of crop product should be determined based on the production conditions of crop products in each province. Overall, the total number of crop product kinds is categorized into 17 categories, as detailed in the following Table 1.
This table categorizes the primary agricultural products into two main sectors: grain crops and economic crops. Grain crops include staples such as rice, wheat, corn, legumes, and tubers. Economic crops are further divided into oilseeds (peanuts, rapeseed, sesame), fiber crops (cotton, bast fibers), sugar crops (sugarcane, sugar beet), and fruit crops (apples, citrus fruits, pears, grapes, bananas). This classification aids in the systematic analysis of crop production across different regions.
4.2.2 Measurement method for CPCE
Currently, there are two prevailing interpretations within the academic community regarding CPCE: On the one hand, it is understood that CPCE is solely the greenhouse gas effects directly or indirectly caused by human activities during the crop production process; on the other hand, some believe that CPCE also includes the carbon sequestration effects of the crops themselves. Most existing studies on CPCE tend to focus on the former interpretation (Li et al., 2014). This study, integrating practical production experience and relevant research, after expert consultation and acknowledging that the decarbonization of crop production primarily entails minimizing high-carbon crop inputs and preserving soil organic carbon, identifies the principal sources of carbon emissions in crop production as follows:
1. Emissions, direct or indirect, resulting from the application of fertilizers, pesticides, and crop films
2. Emissions from diesel fuel consumption by crop machinery
3. Emissions arising from energy utilization during irrigation
4. Depletion of organic carbon attributable to soil plowing and tilling
Accordingly, this research employs the IPCC carbon emission coefficient method and references studies by scholars such as Li et al. (2013), focusing primarily on the direct or indirect emissions from six types of carbon sources involved in crop production: fertilizers, pesticides, agricultural films, diesel, irrigation, and plowing. The carbon emissions from production are calculated using the relevant carbon emission coefficients for these sources, with the specific formula as follows:
In Equation 3,
4.2.3 Control variables
1) Upgrading Industrial Structure (UIS). Carbon emissions are intricately linked to the industrial composition, namely, the growth of the primary and secondary sectors, which often release pollutants. On the other hand, a higher proportion of the tertiary sector, due to industrial efficiency, may contribute to reducing carbon emissions. Thus, this research employs the ratio of the production value of the tertiary sector to that of the secondary sector as a representation of industrial structure.
2) Foreign Direct Investment openness level (FDI). As openness increases, affluent nations may relocate their labor-intensive and ecologically detrimental industries to developing countries, exacerbating carbon emissions in those regions. Nevertheless, several academics contend that heightened openness might facilitate introducing cutting-edge technology, money, and environmental ideologies, reducing the host regions’ carbon emissions and environmental pollution. This research adopts the methodology proposed by Zhou and Shi (2018), which utilizes the ratio of foreign direct investment to gross domestic product to measure openness.
3) Degree of Agricultural Mechanization (ADV). Mechanization is an essential pathway for the technical progress of agriculture. Agricultural innovation depends on the use of agricultural equipment and the research and development associated with it. Mechanization in agriculture may free up a portion of the workforce, reducing the need for labor and time, which can then be used towards expanding production or other non-agricultural jobs, thus improving agricultural output efficiency. This research uses the metric of total power of agricultural equipment per sown area of crops to quantify the degree of automation in crop production, as referenced by Zhang et al. (2017).
4) Public investment in the plantation industry (API). Augmenting public investment in the plantation industry has the potential to somewhat diminish carbon emissions, with the overall impact on carbon being contingent upon the magnitude of reduction achieved in the agricultural sector. Thus, this variable serves as a control variable, measured by the amount of fixed asset investment in agriculture, forestry, animal husbandry, and fishery in various places, and takes its logarithm.
5) Government financial assistance for the agricultural sector (FISCAL). This is quantified by calculating the proportion of fiscal expenditures allocated to assist agriculture relative to the overall fiscal expenditures. The extent of governmental financial support for agriculture significantly influences the future advancement of agricultural output across different locations. Fiscal expenditures may influence the business choices of agricultural businesses regarding adopting low-carbon technology, hence indirectly impacting carbon emission intensity.
4.2.4 Data sources and descriptive statistics
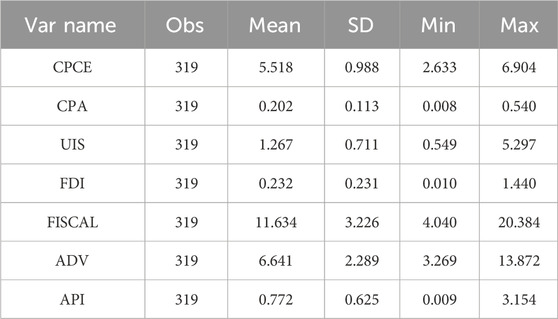
Given the availability of data, this analysis employs panel data from 29 provinces (excluding Tibet, Shanghai, and the regions of Hong Kong, Macau, and Taiwan) for 2012–2022. The data for the indicators mentioned are sourced from the “China Statistical Yearbook,” “China Rural Statistical Yearbook,” “China Household Survey Yearbook,” “China Human Capital Report,” the websites of the National Bureau of Statistics, and various local statistical bureaus. This produced a dataset covering the years 2012–2022 for 29 provinces. Table 3 presents the descriptive statistics for the primary variables.
5 Results and discussion
5.1 Fundamental regression analysis
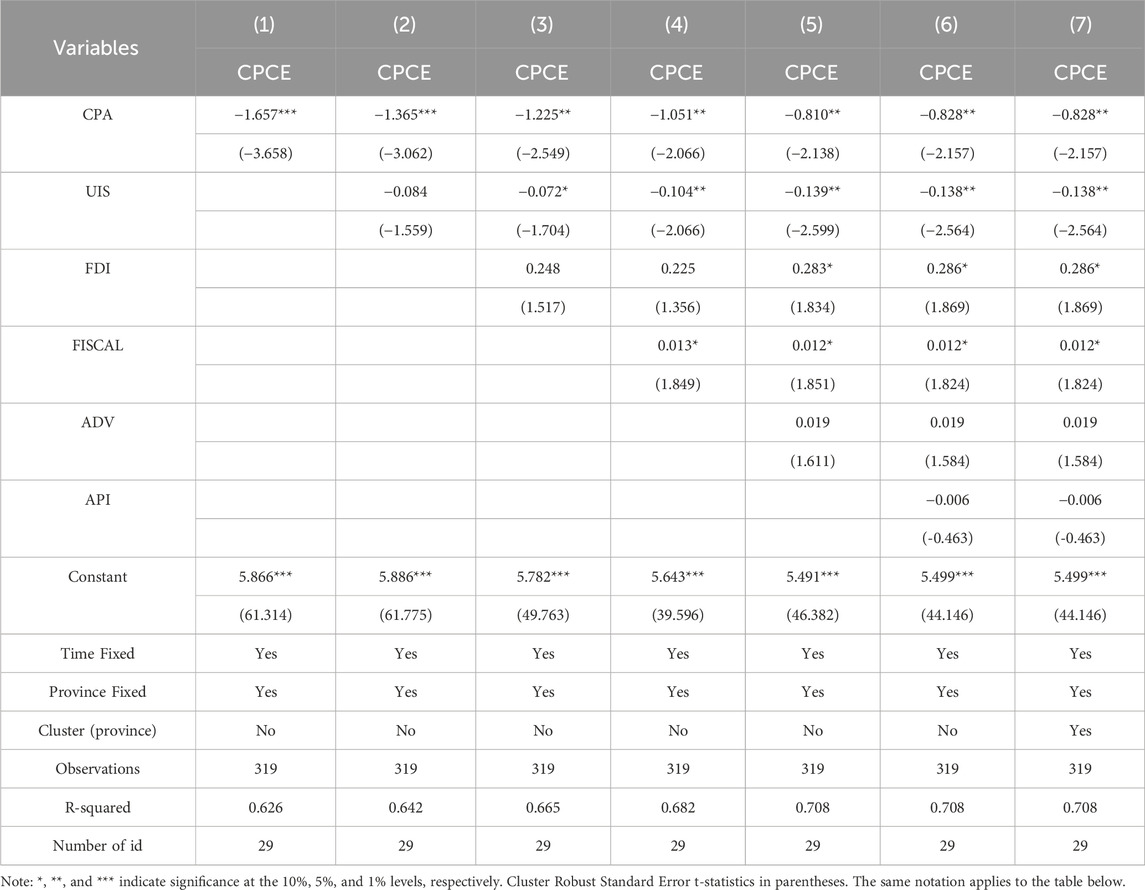
Based on the measurement data for CPA and CPCE described earlier, a two-way fixed effects panel model was employed for regression analysis. The findings are displayed in Table 4. Column (1) reports the regression outcomes without including control variables. The coefficient for CPA is −1.657, with a p-value below 0.01, indicating significance at the 1% level. The fact that this is the case indicates that the CPA can substantially diminish carbon emission intensity and lower carbon emissions per unit area within crop production. The control variables UIS, FDI, ADV, API, and FISCAL were gradually introduced into columns (2) through (6) with each successive addition. A slight decrease in the coefficient for CPA was observed when compared to the regression in Column (1); nonetheless, the coefficient remained substantially unchanged throughout the analysis. Column 7 includes a clustering analysis at the provincial level, and its regression results are consistent with earlier ones, confirming that the results are valid. It is evident that CPA significantly inhibits carbon emissions. Hypothesis 1a is demonstrated.
5.2 Endogeneity test
A two-way fixed effects model was utilized for this study’s Benchmark regression analysis. This model offered some relief from the endogeneity problems brought about by the absence of certain variables. However, considering the potential reverse causality between the dependent and independent variables. For instance, higher carbon emissions might be associated with higher agricultural production levels, further encouraging the concentration of production activities in certain regions. Thus, this study adopted the instrumental variable approach and Lag test to further address endogeneity concerns.
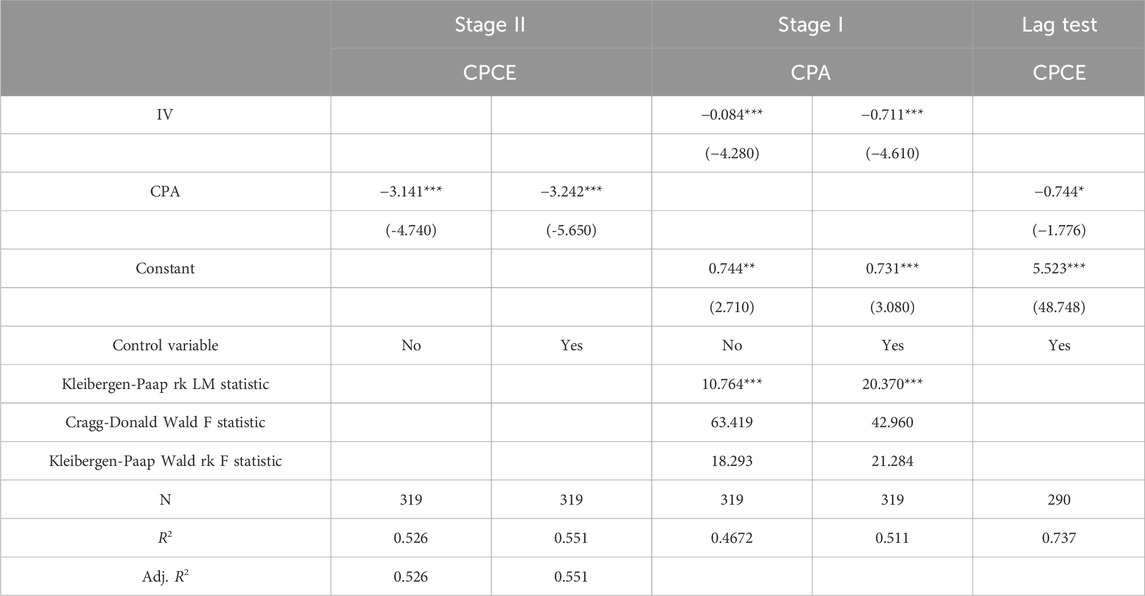
Following the recommendation of Feng et al. (2007), this paper selects topographical variability as the instrumental variable. Topographical variability is a natural geographic feature defined by the elevation difference between a region’s highest and lowest points, the extent of flat regions, and the total area. This feature is intrinsically linked to crop production activities because suitable elevations and terrains (such as slopes, terraced fields, and plains) facilitate the geographical concentration of crop production, meeting the relevance requirement for an instrumental variable. Simultaneously, the relative elevation and surface cutting depth reflected by topographical variability have no direct connection to carbon emission levels, thus ensuring the homogeneity of the instrumental variable. Therefore, using topographical variability as an instrumental variable for CPA in this study is justified. Since terrain relief is a cross-section data, this paper takes the product of terrain relief and annual agricultural GDP of each province as the instrumental variable of this paper. Table 5 presents the results, indicating a CPA coefficient of −3.242, which is significant at the 1% level and aligns with the Benchmark regression results. The F-statistic of 21.284 leads to the rejection of the null hypothesis regarding the instrumental variable assumption, hence affirming the validity of the selected instrumental variable and successfully passing the endogeneity test.
5.3 Lag test
Given that CPA does not immediately impact carbon emissions, a lagged variable of carbon emissions was used to mitigate endogeneity issues. The findings in column (3) of Table 5 reveal that the coefficient for CPA is −0.744, which is significant at the 10% level, confirming that CPA can continuously suppress carbon emissions.
5.4 Robustness tests
5.4.1 Substitution of explanatory variables
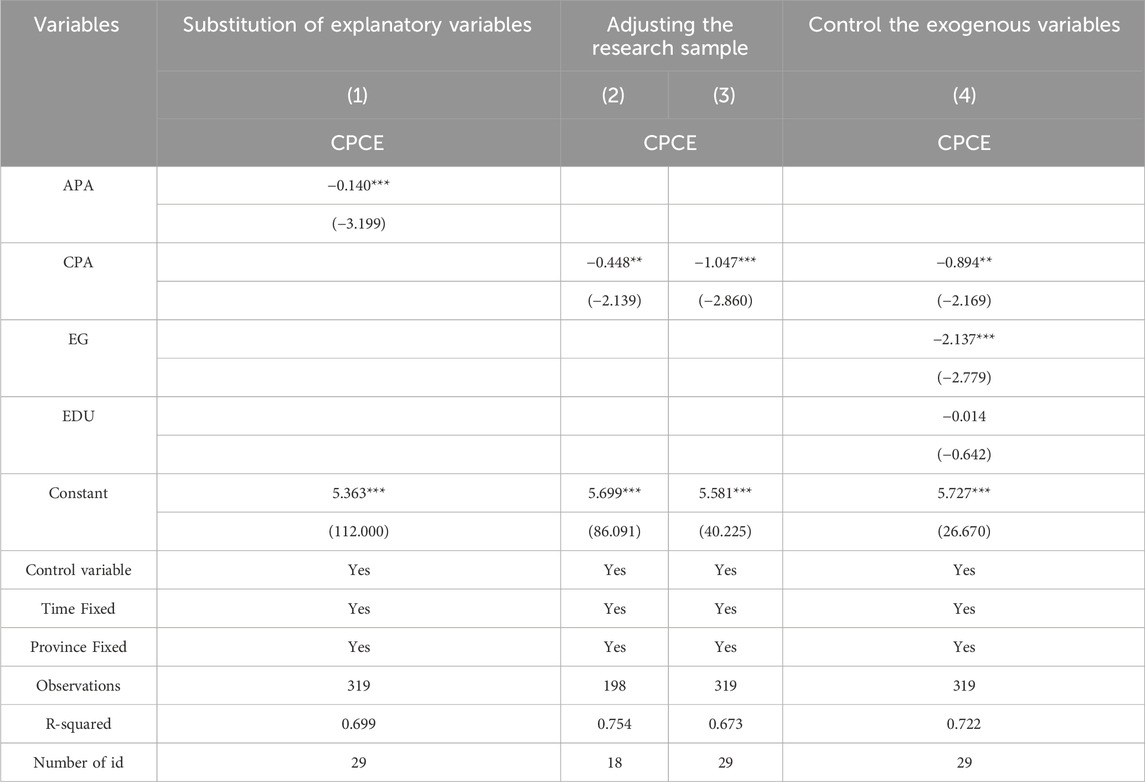
In this study, the ratio of primary industry output value to planted area (APA) for every province was employed as a substitute variable for CPA in the regression analysis. The findings in column (1) of Table 6 reveal that the coefficient for APA is −0.140, which is significant at the 1% level, thereby confirming the robustness of the Benchmark regression outcomes.
5.4.2 Adjusting the research sample
Firstly, the sample size was reduced to include only the provinces within the Yangtze River Economic Belt and the Yellow River Basin, considering that crop production is predominantly concentrated near water sources. This selection aims to reflect the influence of CPA on carbon emissions more accurately. As shown in column (2) of Table 6, the findings reveal that the CPA coefficient is −0.448, which is significant at the 1% level. Secondly, to deal with the possible extremum and limitation of samples, this paper also performs Double shrinkage tail processing for all variables at the 1% level. The result is shown in columns (3) of Table 6. The two results as above have passed the robustness check, which is consistent with the previous research conclusion.
5.4.3 Control the exogenous variables
The carbon emissions of the planting industry are not only influenced by production agglomeration but also disturbed by numerous external factors. For example, the government’s protection of the planting environment may reduce the carbon emissions of the planting industry, and the rural education level will also optimize farmers’ planting decisions, thus affecting the crop production carbon emissions. Therefore, this paper takes environmental governance (EG) and the skill level of workers (EDU) as control variables for regression, and the results are presented in Column (4) of Table 6, and the results are valid.
5.5 Heterogeneity tests
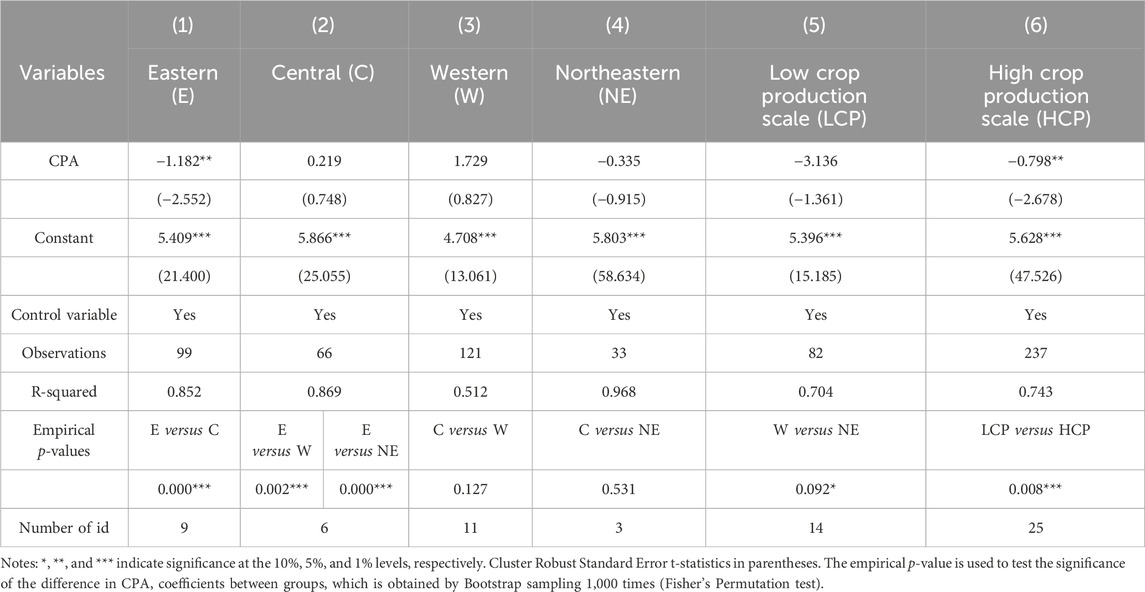
According to this study, the 29 provinces in China are divided into four primary regions based on geographical and economic characteristics: the Eastern, Central, Western, and Northeastern regions. This is done in consideration of the significant differences between the levels of economic development and the degree of crop production agglomeration present in each province in China. An empirical investigation was carried out to determine the degree of geographical variation in the effect of crop production agglomeration on carbon emissions. The results are shown in columns (1), (2), (3) and (4) of Table 7.
At the same time, considering the different scale of crop production in each province, it will bring different production agglomeration modes, which will further affect carbon emissions. Therefore, the ratio of crop product yield to agricultural planting area is used to measure crop production scale level, and the average of crop production scale level in all provinces is used as the dividing line to divide crop production scale into low crop production scale and high crop production scale. From the perspective of crop production scale, the crop production concentration and carbon emission were empirically analyzed. The results are shown in columns (5) and (6) of Table 7.
The analysis indicates that in the Eastern and Northeastern parts of China, CPA has negatively impact on carbon emissions, whereas in the Central and Western regions, it has positively influences on carbon emissions. The impact coefficient in the Eastern region was −1.1819 and achieved significance at the 5% level, indicating the substantial efficacy of CPA in mitigating carbon emissions in this region. Conversely, while the Northeastern region exhibited a negative effect, its coefficient did not attain statistical significance. According to the empirical p-value, the difference in the degree of inhibition of CPCE between the E and NE groups is significantly different from 0 at the 1% level. This indicates that the suppression of CPCE is more significant in the eastern region. This regional variance may be attributable to varying degrees of economic growth and agricultural production techniques across different areas. The Eastern region, being economically developed coastal urban clusters, benefits from advanced agricultural technologies and management methods, effectively reducing carbon emissions. The Northeastern region, despite being a major national grain-producing area, relies primarily on traditional large-scale cultivation. As a transitional area from an old industrial base, its agglomeration effect has not yet significantly manifested in reducing carbon emissions, necessitating further technological and managerial innovations to enhance its environmental performance.
At the same time, this paper also notes that when the central region and the western region are grouped, the CPA of the two regions can promote CPCE, and the increase rate of carbon emissions in the western region (1.729) is faster than that in the central region (0.219), but the empirical p-value (0.127) shows that the difference between the two regions does not reach the 10% significance level. That is, the above conclusions cannot be accurately drawn by comparing the coefficient sizes. Because both the central and western regions fail to pass the significance level at the 10% level, the CPA of the central and western regions has little impact on CPCE.
The analysis showed that in areas with high crop production scale, CPA had a negative effect on carbon emissions, it had a positive effect on carbon reduction. Its coefficient is −0.798, which is significant at the 5% level, indicating the significant effect of CPA on reducing carbon emissions in areas with high crop production scale. On the contrary, although the low crop production scale area has a negative effect on the coefficient, its coefficient is not statistically significant. According to the empirical p-value, the difference in the degree of inhibition of CPCE between the LCP and HCP groups is significantly different from 0 at the 1% level. This indicates that the inhibition degree of HCP on CPCE is more significant. This may be related to the fact that the scale of crop production has not reached the economic scale. China’s agricultural production is mainly based on scattered land, and when the economic scale is not reached, the crop production concentration is not prominent, resulting in no carbon emission reduction effect.
5.6 Global spatial autocorrelation test
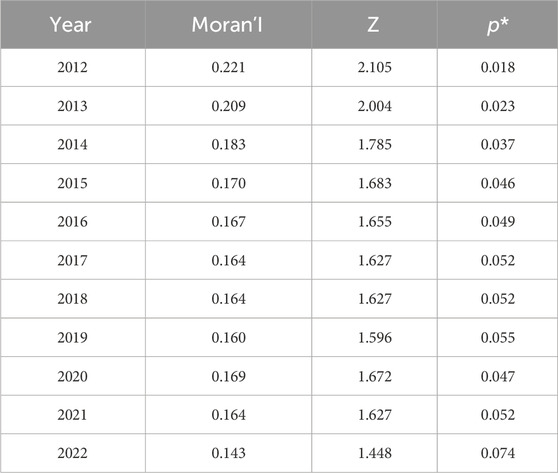
According to the fundamental principles of geography, particularly the First Law, most phenomena in the world demonstrate spatial clustering. If similar phenomena are regularly distributed across different geographical spaces, this indicates spatial correlation. Consequently, the Global Moran’s I index is a robust instrument for evaluating geographical correlation. This study employed the Global Moran’s I index to examine the spatial autocorrelation of Carbon Emissions from CPCE between 2012 and 2022, with results in Table 8. The analysis reveals that within the framework of a spatial adjacency matrix, the Global Moran’s I index for crop production carbon emissions continuously above the significance threshold at the 10% level, affirming a solid positive spatial correlation in CPCE.
5.7 Temporal and spatial pattern evolution of CPA and CPCE
To intuitively delineate the spatial evolution of production agglomeration and carbon emission of the planting industry, ArcGIS software was employed to categorize the production agglomeration and carbon emission of the planting industry into five levels, ranging from low to high, based on the natural break point method. The results are presented in Figure 2. It can be observed from the figure that the provinces with a higher degree of production agglomeration in the planting industry are mainly concentrated in the central and eastern regions. Among them, Henan and Shandong have the highest degree of production agglomeration, followed by the eastern coastal provinces. In 2012, the provinces with the highest carbon emissions from the planting industry were mainly located in the central and eastern regions. However, with the passage of time, the carbon emissions of provinces in the central region have decreased significantly, especially in the Beijing-Tianjin-Hebei region, and the carbon emissions of planting industry have been significantly inhibited.
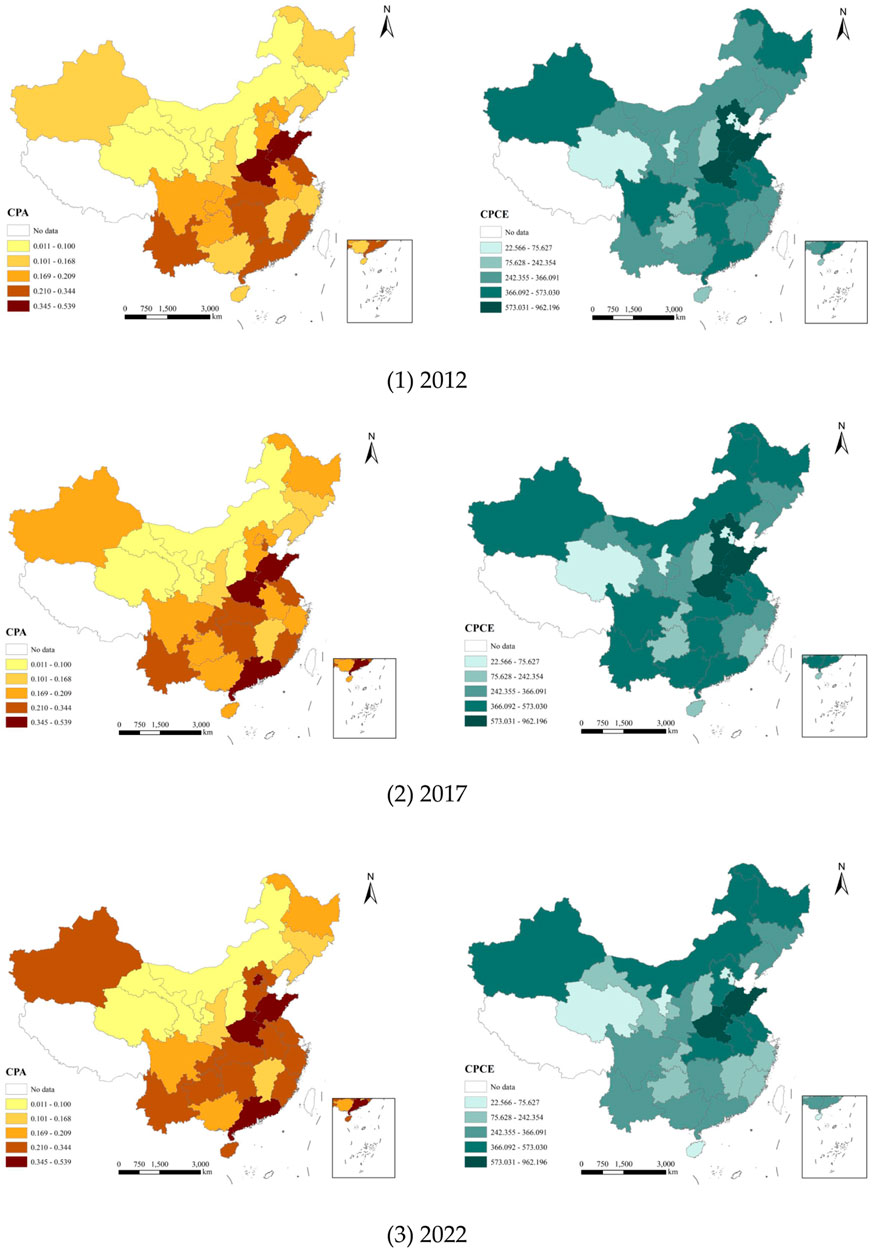
Figure 2. Spatio-temporal evolution diagram of CPA and CPCE from 2012 to 2022 (Note: This figure was produced based on the standard map with the review number GS (2022) 1873 downloaded from the standard map service website of the Ministry of Natural Resources, and no modifications were made to the base map).
5.8 Spatial Durbin Model estimation
The above Global Moran index was used to test the spatial correlation between crop industry carbon emissions and production agglomeration. On this basis, through LM, LR, HAUSMAN test, and Wald test, it is determined that it is reasonable to use a two-way fixed spatial Durbin model in the subsequent test, and the construction ofthe spatial Durbin model is shown in Equation 4.
Where i and t represent the province and year respectively, j represents the neighboring province (
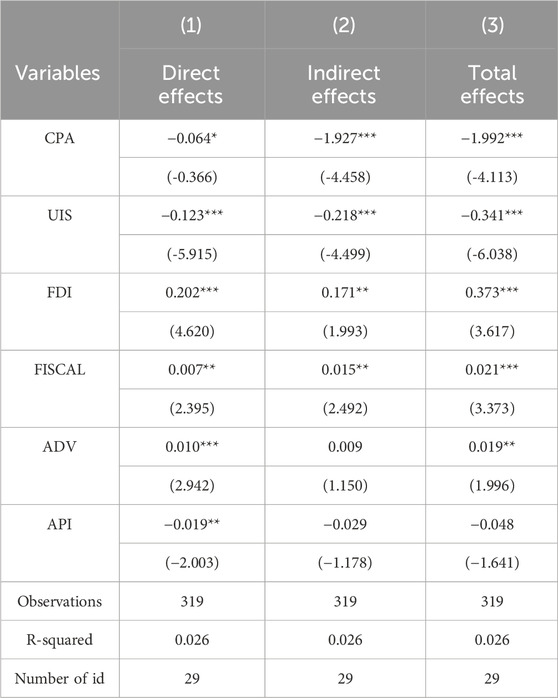
The regression is carried out on the Durbin space model based on two-way fixed, and the total effect of the model is decomposed by using the partial differential method in the model. The impact of planting production agglomeration on carbon emissions is decomposed into direct effect, indirect effect, and total effect, and the specific results are shown in Table 9. The Spatial Durbin Model estimates a direct effect of CPA at −0.064, which is significant at the 10% level, suggesting that CPA can diminish local CPCE. The spatial spillover impact of CPA was −1.927, significant at the 1% level, indicating that CPA has a suppressive influence on CPCE in adjacent regions. This means that the agglomeration of crop production can reduce the local region’s carbon emission intensity and have a spatial spillover effect to reduce the carbon emission intensity of neighboring regions.
6 Discussion and conclusion
From the above discussion, it can be concluded that with the expansion of the agglomeration of planting industry production, the carbon emissions of the planting industry have been significantly suppressed, which is verified in the study of Tian and Yin (2021). For the eastern regions with developed economy and mature agricultural technology, the expansion of the agglomeration of the planting industry has a more obvious inhibitory effect on carbon emissions. The agglomeration of planting industry production also plays a demonstration role, driving the surrounding areas to carry out production agglomeration and inhibiting carbon emissions in the surrounding areas, showing a spatial spillover effect, which is confirmed in the study of Zhang et al. (2024) (Xu et al., 2023). Although these studies reveal important discoveries, they also have limitations. First, this paper does not separately discuss the inhibitory effects of the production agglomeration of each crop on carbon emissions. Second, in measuring the agglomeration of the planting industry, the data used in this paper is derived from respective provincial sources. The macro nature of this data may introduce biases in the article, which is unavoidable. Lastly, this paper does not consider local environmental changes, such as climate risks. These risks may lead farmers to abandon the agglomeration of planting industry production in favor of decentralized planting to mitigate losses caused by climate risks, which may result in a lack of samples for study in some areas. Therefore, there are three aspects of this issue that need to be addressed. The first question involves classifying all crops in greater detail and conducting experimental comparisons to determine which crop production agglomeration has the most significant inhibitory effect on carbon emissions. The second issue relates to data availability and accuracy. The third aspect concerns the influence of environmental factors (moderating variables) on the agglomeration of the planting industry, which will be related to carbon emissions.
This study examines the influence of crop production agglomeration on carbon emission reduction. As crop production agglomeration intensifies, its contribution to carbon reduction increases; however, excessive aggregation may lead to dependency on specific industries, increasing the risks associated with market and policy changes. Therefore, the following recommendations are proposed:
Develop differentiated carbon reduction strategies: Tailor emission reduction measures based on regional and crop characteristics, and enhance the policy support system. Governments should increase investments in agricultural technological innovation, improve infrastructure, raise farmers’ incomes, and strengthen environmental protection measures to promote the sustainable development of agriculture.
Promote industrial structure upgrading: While maintaining the advantages of aggregation, guide the agricultural sector towards diversification and low-carbon development. For example, encourage organic farming, reduce the use of fertilizers and pesticides, expand the agro-processing industry, enhance ecological benefits, and foster industry transformation through technological innovation.
Advocate for cross-regional corporate cooperation: Encourage agricultural enterprises from different regions to strengthen cooperation, establish industrial parks, attract high-quality enterprises and talents, and avoid excessive concentration of resources. Improve communication and coordination mechanisms, establish platforms for information sharing and technological innovation, and promote collaboration and resource sharing along the industrial chain.
In summary, in crop production, it is essential to reasonably aggregate various agricultural resources to enhance the quality and carbon emission efficiency of crop production, thereby supporting the achievement of the national “dual carbon” goals. Additionally, by leveraging the spillover effects of crop production agglomeration, it is important to establish low-carbon green demonstration zones to promote the low-carbon transformation of crop production through their demonstration and spillover effects.
Data availability statement
The original contributions presented in the study are included in the article/Supplementary Material, further inquiries can be directed to the corresponding author.
Author contributions
HJ: Funding acquisition, Project administration, Resources, Supervision, Writing–review and editing. SL: Conceptualization, Data curation, Formal Analysis, Investigation, Methodology, Resources, Software, Writing–original draft, Writing–review and editing. LC: Project administration, Supervision, Writing–original draft, Writing–review and editing.
Funding
The author(s) declare that financial support was received for the research, authorship, and/or publication of this article. This research was funded by Liaoning Provincial Social Science Fund Major Project, grant number L22ZD005 and Liaoning Provincial Department of Education Project: Industrial Digitalization enabling Liaoning Equipment Manufacturing Industry New quality productivity research, grant no. LJ112410147080.
Conflict of interest
The authors declare that the research was conducted in the absence of any commercial or financial relationships that could be construed as a potential conflict of interest.
Generative AI statement
No Generative AI was used in the preparation of this manuscript.
Publisher’s note
All claims expressed in this article are solely those of the authors and do not necessarily represent those of their affiliated organizations, or those of the publisher, the editors and the reviewers. Any product that may be evaluated in this article, or claim that may be made by its manufacturer, is not guaranteed or endorsed by the publisher.
References
Adedoyin, F. F., Gumede, M. I., Bekun, F. V., Etokakpan, M. U., and Balsalobre-lorente, D. (2020). Modelling coal rent, economic growth and CO2 emissions: does regulatory quality matter in BRICS economies. Sci. Total Environ. 710, 136284. doi:10.1016/j.scitotenv.2019.136284
Chen, X., Shuai, C., Wu, Y., and Zhang, Y. (2020). Analysis on the carbon emission peaks of China’s industrial, building, transport, and agricultural sectors. Sci. Total Environ. 709, 135768. doi:10.1016/j.scitotenv.2019.135768
de Roest, K., Ferrari, P., and Knickel, K. (2018). Specialisation and economies of scale or diversification and economies of scope? Assessing different agricultural development pathways. J. Rural. Stud. 59, 222–231. doi:10.1016/j.jrurstud.2017.04.013
Fan, J. (2007). Industrial agglomeration and difference of regional productivity. Front. Econ. China 2, 346–361. doi:10.1007/s11459-007-0018-9
Fang, C. D., Cheng, J. H., Zhu, Y. G., Chen, J. H., and Peng, X. J. (2021). Green total factor productivity of extractive industries in China: an explanation from technology heterogeneity. Resour. Policy 70, 101933. doi:10.1016/j.resourpol.2020.101933
Feng, Z. M., Tang, Y., and Yang, Y. Z. (2007). The relief degree of land surface in China and its correlation with population distribution. J. Geogr. Sci. 10, 1073–1082. doi:10.3321/j.issn:0375-5444.2007.10.007
Gilbert, N. (2012). One-third of our greenhouse gas emissions come from agriculture. Nature 31, 10–12. doi:10.1038/nature.2012.11708
Greenwood, L. (2022). China’s interests in US agriculture: augmenting food security through investment abroad. US-China Economic and Security Review Commission. Staff Research Report 11. Available at: https://www.uscc.gov/sites/default/files/2022-05/Chinas_Interests_in_U.S._Agriculture.pdf (Accessed July 31, 2024).
Gupta, R. (2014). Low-hanging fruit in black carbon mitigation: crop residue burning in South Asia. Clim. Change Econ. 5, 1450012. doi:10.1142/S2010007814500122
He, Q., Zhang, J. B., Wang, L. J., and Zeng, Y. M. (2020). Impact of agricultural industry agglomeration on income growth: spatial effects and clustering clustering differences. Transform. Bus. Econ. 19, 486–507. doi:10.1007/978-981-15-4021-9
Koondhar, M. A., Aziz, N., Tan, Z., Yang, S., Raza Abbasi, K., and Kong, R. (2021). Green growth of cereal food production under the constraints of agricultural carbon emissions: a new insights from ARDL and VECM models. Sustain. Energy Technol. Assess. 47, 101452. doi:10.1016/j.seta.2021.101452
Li, H., Xu, Y. N., Gao, W. S., Cui, J. X., and Chen, Y. Q. (2024). Carbon budget of diversified cropping systems in southwestern China: revealing key crop categories and influencing factors under different classifications. Environ. Res. 255, 119189. doi:10.1016/j.envres.2024.119189
Li, J., and Xu, J. T. (2022). Analyses of carbon reduction potential of low carbon technologies in China. Issues Agric. Econ. 3, 117–135. doi:10.13246/j.cnki.iae.2022.03.001
Li, L., Han, J. L., and Zhu, Y. C. (2023). Does environmental regulation in the form of resource agglomeration decrease agricultural carbon emissions? Quasi-natural experimental on high-standard farmland construction policy. J. Clean. Prod. 420, 138342. doi:10.1016/j.jclepro.2023.138342
Li, L., Zhou, C., Li, E. L., and Li, X. J. (2013). Decoupling analysis of agricultural carbon emission and economic development from an input perspective: a case study of Huang-Huai-Hai plain. J. Ecol. Rural. Environ. 29 (5), 551–558. doi:10.3969/j.issn.1673-4831.2013.05.002
Li, T. S., Zheng, Y. Y., Wang, H., Chen, G. H., Ma, C. Q., Yao, H. R., et al. (2014). Spatiotemporal patterns of carbon emissions during the crop production process in Baoji area from 2005 to 2011. Hubei Agric. Sci. 53 (7), 1546–1550. doi:10.14088/j.cnki.issn0439-8114.2014.07.022
Li, Z., and Li, J. D. (2022). The influence mechanism and spatial effect of carbon emission intensity in the agricultural sustainable supply: evidence from China’s grain production. Environ. Sci. Pollut. Res. 29, 44442–44460. doi:10.1007/s11356-022-18980-y
Lin, H. L., Li, H. Y., and Yang, C. H. (2011). Agglomeration and productivity: firm-level evidence from China’s textile industry. China Econ. Rev. 22 (3), 313–329. doi:10.1016/j.chieco.2011.03.003
Liu, X. Y. (2014). Spatial efficiency and regional balance: testing the agglomeration effects at the provincial level in China. World Econ. 37 (01), 55–80. doi:10.19985/j.cnki.cassjwe.2014.01.004
Lu, P., Liu, J., Wang, Y., and Ruan, L. (2021). Can industrial agglomeration improve regional green total factor productivity in China? An empirical analysis based on spatial econometrics. Growth Change 52 (2), 1011–1039. doi:10.1111/grow.12488
Nguyen, D. K., Huynh, T. L. D., and Nasir, M. A. (2021). Carbon emissions determinants and forecasting: evidence from G6 countries. J. Environ. Manag. 285, 111988. doi:10.1016/j.jenvman.2021.111988
Sarkodie, S. A., Adams, S., Owusu, P. A., Leirvik, T., and Ozturk, I. (2020). Mitigating degradation and emissions in China: the role of environmental sustainability, human capital and renewable energy. Sci. Total Environ. 719, 137530. doi:10.1016/j.scitotenv.2020.137530
Scotchmer, S. (2002). “Local public goods and clubs,” in Hand book of public economics. Elsevier, 1997–2042. doi:10.1016/S1573-4420(02)80008-8
Singh, R., and Khanna, V. (2021). “Climate change and food systems: implications on food security,” in Climate change and resilient food systems. Editors V. K. Hebsale Mallappa,, and M. Shirur (Singapore, Singapore: Springer), 73–111. doi:10.1007/978-981-33-4538-6_3
Tian, Y., and Yin, M. H. (2021). Study on the influence of industrial agglomeration on net carbon effect of agriculture in China. J. Huazhong Agric. Univ. Soc. Sci. 2 (3), 107–117. doi:10.13300/j.cnki.hnwkxb.2021.03.012
Tian, Y., Zhang, J. B., He, K., and Feng, J. H. (2015). Analysis of farmers’ low-carbon agricultural production behavior and its influencing factors: a case study of fertilizer application and pesticide use. China Rural Surv. 4, 61–70.
Wang, H., and Wang, M. (2020). Effects of technological innovation on energy efficiency in China: evidence from dynamic panel of 284 cities. Sci. Total Environ. 709, 136172. doi:10.1016/j.scitotenv.2019.136172
Wilberforce, T., Olabi, A., Sayed, E. T., Elsaid, K., and Abdelkareem, M. A. (2021). Progress in carbon capture technologies. Sci. Total Environ. 761, 143203. doi:10.1016/j.scitotenv.2020.143203
Xu, J. B., Wang, J. J., Wang, T. Y., and Li, C. X. (2023). Impact of industrial agglomeration on carbon emissions from dairy farming ——empirical analysis based on life cycle assessmsent method and spatial durbin model. J. Clean. Prod. 406, 137081. doi:10.1016/j.jclepro.2023.137081
Yao, X., Kou, D., Shao, S., Li, X., Wang, W., and Zhang, C. (2018). Can urbanization process and carbon emission abatement be harmonious? new evidence from China. Environ. Impact Assess. Rev. 71, 70–83. doi:10.1016/j.eiar.2018.04.005
Yuan, H. X., Feng, Y. D., Lee, C.-C., and Cen, Y. (2020). How does manufacturing agglomeration affect green economic efficiency. Energy Econ. 92, 104944. doi:10.1016/j.eneco.2020.104944
Zhang, H. R., Zhang, J. W., and Song, J. F. (2022). Analysis of the threshold effect of agricultural industrial agglomeration and industrial structure upgrading on sustainable agricultural development in China. J. Clean. Prod. 341, 130818. doi:10.1016/j.jclepro.2022.130818
Zhang, K., Deng, X., Shen, Q. L., and Qi, Y. B. (2017). Agricultural technological progress, rural labor migration, and farmers’ income: an analysis based on agricultural labor productivity using a grouped PVAR model. J. Agrotech. Econ. (06), 28–41. doi:10.13246/j.cnki.jae.2017.06.003
Zhang, S., Wen, X., Sun, Y., and Xiong, Y. (2024). Impact of agricultural product brands and agricultural industry agglomeration on agricultural carbon emissions. J Environ Manage 369, 122238. doi:10.1016/j.jenvman.2024.122238
Keywords: crop production, production agglomeration, carbon emissions, spatial Durbin model, China
Citation: Han J, Shen L and Li C (2024) Can crop production agglomeration reduce carbon emissions?—empirical evidence from China. Front. Environ. Sci. 12:1516238. doi: 10.3389/fenvs.2024.1516238
Received: 24 October 2024; Accepted: 29 November 2024;
Published: 18 December 2024.
Edited by:
Juan Lu, Nanjing Agricultural University, ChinaReviewed by:
He Li, Nanjing University of Posts and Telecommunications, ChinaMin Zhang, Hunan University, China
Copyright © 2024 Han, Shen and Li. This is an open-access article distributed under the terms of the Creative Commons Attribution License (CC BY). The use, distribution or reproduction in other forums is permitted, provided the original author(s) and the copyright owner(s) are credited and that the original publication in this journal is cited, in accordance with accepted academic practice. No use, distribution or reproduction is permitted which does not comply with these terms.
*Correspondence: Chengyu Li, bGljaGVuZ3l1NTU4OEAueWVhaC5uZXQ=
†These authors have contributed equally to this work and share first authorship
 Jiabin Han1,2†
 Chengyu Li