- Department of Geography and Environmental Studies, Faculty of Social Science, Bahir Dar University, Bahir Dar, Ethiopia
In northern Ethiopia, meteorological droughts overwhelm crops and often lead people to food insecurity and poverty traps. Socioeconomic droughts similarly aggravate poverty and impact livelihoods; causing significant challenge on communities. Such issues in the area were not researched and not well addressed. Hence, the objective of this study was to evaluate the temporal and spatial trends of meteorological drought and the implied socioeconomic drought impacts in the Tekeze Watershed. The main data sources for this study included survey questionnaires, field observations, and CHIRPS data. Precipitation data from various stations were also employed to validate the CHIRPS data using a random forest regression model. The results revealed a strong coefficient of determination for the model, with values of 0.88, 0.87, 0.88, and 0.84 for the Mekele Obseva, Sekota, Yichila, and Ashere stations, respectively. This indicates that the precipitation recorded at these stations can be well-explained by the CHIRPS data. The temporal trends of meteorological drought showed that most of the years faced shortage of rainfall, where the year 2015 exceptionally faced a severe drought. The drought conditions in the area were exacerbating from time to time with a drought reoccurrence period of 2 years. The socioeconomic drought also found similar results within the agricultural drought that the years 2000, 2002, 2004–5, 2009–11, 2013–15, 2017, and 2021–23 were affected by droughts of different severity levels and associated socioeconomic impacts. Accordingly, almost all (99.5%) of the respondents reported that they were personally experiencing droughts. The major causes of drought in the study watershed were climate variability, land use changes, land degradation, water mismanagement, deforestation, war, and desert locusts. The consequences of these overlapping crises include pandemics, malnutrition, displacement, crop losses, desertification, and conflicts over resource use. While proposed interventions like improved irrigation, water infrastructure, drought-resistant crops, and emergency relief were intended to address these issues, ill-guided procedures and inadequate execution have undermined their effectiveness. Thus, these measures have not been successfully implemented and have fallen short of addressing the tangible impacts of drought. To this end, the study recommends effective implementation of the mitigation measures initially implemented by the government and nongovernmental organizations, emphasizing the active involvement of the local community.
1 Introduction
Meteorological drought refers to a period of abnormally dry weather conditions characterized by a deficit in precipitation (Menna et al., 2022; White and Glantz, 1985; Sadiq et al., 2023). Socioeconomic drought on the other hand denotes to the consequences of water scarcity on individuals and economic activities resulting from drought conditions (Liu et al., 2020; Zhou et al., 2022). Both of them have cause and effect relationship that Meteorological drought is often the initial phase that sets the stage to propagate into socioeconomic droughts (Hennessy et al., 2008). These types of drought combine elements from the agricultural, hydrological, and meteorological domains with the interplay of supply and demand for commercial goods and services. Some researchers argue that an objective definition of drought should encompass the consideration of supply and demand in specific locations and timeframes. For example, weather conditions can influence the availability of economic commodities like water and electricity, while population growth and increased per capita consumption often lead to heightened demand for these resources (Hennessy et al., 2008; WMO, 2022). Socioeconomic drought arises when water availability becomes inadequate to meet the needs of both people and the environment, resulting in negative effects on the supply and demand of economic commodities due to meteorological, hydrological, or agricultural drought conditions (Hennessy et al., 2008; Nagarajan, 2010).
Meteorological and socioeconomic droughts, encompassing the broader societal impacts of water scarcity, have far-reaching consequences worldwide. According to information from 101 country Parties to the United Nations Convention to Combat Desertification (UNCCD), 1.84 billion individuals worldwide are affected by drought, with 4.7% facing severe or extreme conditions (United Nations Convention to Combat Desertification, 2023; United Nations, 2023). Women and children bear a disproportionate impact from climate-related disasters (United Nations, 2023). In Africa and specifically in sub-Saharan Africa (SSA), these dual drought phenomena exacerbate food insecurity, poverty, and displacement, amplifying existing vulnerabilities and straining social structures (United Nations, 2023; Baptista et al., 2022). In December 2022, the persistent drought had resulted in around 23 million individuals experiencing severe food insecurity throughout the Horn of Africa (WFP, 2023).
The government of Ethiopia and various nongovernmental organizations (NGOs) such as Concern Worldwide, the American Red Cross, Amnesty International, Save the Children, Oxfam, World Vision and Greenpeace have implemented several interventions to address the drought conditions in the Tekeze watershed. Emergency food aid, water resource management projects, agricultural support programs, and livelihood diversification initiatives were among the long-term drought mitigation programs aimed at enhancing resilience and sustainable livelihoods implemented by the agencies (Concern worldwide, 2017; World Vision, 2023). However, the efficacy of these interventions has been impeded by the compounding factors of conflict and insecurity, recurring shocks, and enduring socio-economic impacts. The ongoing conflict in northern Ethiopia, has hindered the delivery of humanitarian aid and exacerbated the severity of needs (UNDP. Crisis, 2022; UNFPA, 2023; HIP. Humanitarian Implementation PlanHIP, 2023). Moreover, the convergence of consecutive failed rainy seasons, desert locust infestations, and disease outbreaks has amplified the vulnerability of the affected population, undermining efforts to restore normalcy (IPC. East & Horn of Africa, 2020; FEWSNet, 2020). The socio-economic ramifications of the drought, including food insecurity, water scarcity, conflicts and escalating malnutrition rates, have further complicated the path to recovery, perpetuating the cycle of vulnerability and impeding sustainable solutions (Terry and Rai, 2023).
Several scholars have studied droughts in northern Ethiopia. For instance, Araya and Stroosnijder (2011), assessed drought risk by examining meteorological and socioeconomic drought conditions in the region. Hermans and Garbe (2019), focused on the impact of drought on livelihoods and human migration in the rural highlands of northern Ethiopia. Senamaw et al. (2021), utilized geospatial techniques to analyze agricultural and meteorological drought in the Waghimra Zone. Zeleke et al. (2022), studied hydrological and meteorological drought using CHIRPS data and hydrological modeling. Menna et al. (2022), conducted a meteorological drought analysis applying copula theory to the upper Tekeze River basin. Finally, Enyew and Wassie Bazie and Bantigegn (2024), investigated the spatiotemporal patterns of meteorological drought in the Menna watershed in northwestern Ethiopia. While the previous studies did not attempt to integrate meteorological drought with socioeconomic drought, this research successfully filled the gap by integrating both aspects into its analysis. This aspect aims to contribute to the empirical literature on the potential theoretical crowding-out effects of the other drought types giving less emphasis to socioeconomic droughts.
The objective of this study is twofold: first, to evaluate the temporal trends and spatial dynamics of meteorological drought in the Tekeze watershed (to identify the drought prone areas spatially and temporally); second to assess the socioeconomic drought conditions in the Tekeze watershed. The study utilizes survey data to understand the causes and consequences of drought on various socioeconomic aspects. By assessing socioeconomic drought conditions, the study provided a comprehensive understanding of how drought impacts local communities and their resilience. By conducting this comprehensive assessment, the research is therefore expected to fill the existing knowledge gap regarding the temporal and spatial characteristics of meteorological and socioeconomic droughts.
2 Materials and methods
2.1 Study area description
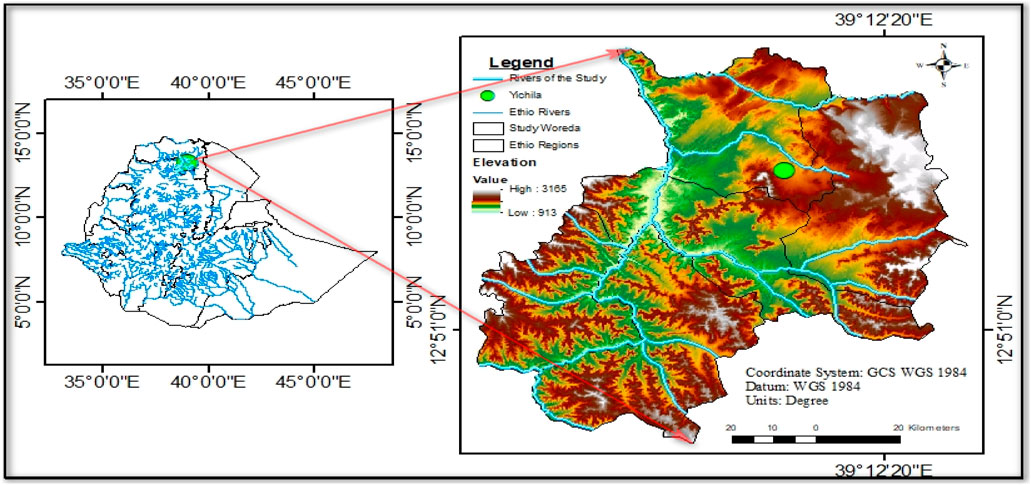
The study area is found within 12° 32′ 24″ & 13° 36′36″ N latitudes and 38° 19′12″& 39° 22′48″E longitudes. The elevation of the study area is found within the ranges of 913 and 3,165 m above sea level (Figure 1). The total size of the study area is 785, 169 ha (ha) of land.
Most of the upper part of the Tekeze watershed in Ethiopia is located in a semi-arid climatic zone, characterized by low and erratic precipitation patterns and high temperatures. According to a study conducted by the Ethiopian Institute of Agricultural Research (EIAR), the upper Tekeze watershed receives an average annual precipitation of 400–700 mm, with the rainy season occurring from June to September (Gebremicael et al., 2017; Fentaw et al., 2023).
The upper part of the Tekeze watershed is an important agricultural area in Ethiopia, with a significant contribution to the country’s economy (Welde and Gebremariam, 2017). The Tekeze watershed is overall an important source of livestock and livestock products, with a large population of cattle, sheep, and goats. Livestock production plays a significant role in the local economy, providing income and food for the communities in the area (Mekuriaw and Harris-Coble, 2017). The area is also known for its beekeeping activities, with honey production being an important source of income for many households. In addition, there are also mining activities in the upper Tekeze watershed, particularly in the Tigray region. The Tigray region has significant mineral deposits, including gold, copper, and silver, which are being mined by both local and international companies (Wubet et al., 2019; Zenebe et al., 2024).
2.2 Sampling technique and sample size determination
The sampling technique for this study is a multi-stage type. Multi-stage sampling is a complex form of sampling that involves taking samples in stages using smaller and smaller sampling units at each stage (Turner, 2003; Mohsin, 2016; Taherdoost et al., 2016). The technique encompasses purposive, simple random, and proportional sampling options, which allows for a methodical and robust selection process that can be aligned with the research objectives.
Purposive sampling is employed to select five highly drought-affected Woredas (Districts) and one Kebele 1 per woreda. This deliberate approach ensures a focused examination of socioeconomic drought conditions and incorporates diverse perspectives through expert recommendations. By targeting areas with significant drought impact, the findings of the study are grounded in the specific challenges and dynamics of the selected woredas, leading to a comprehensive assessment of drought and socioeconomic conditions.
To determine the sample size for the research, Yamane’s sample size calculation model (Yemane, 1967), was employed (Equation 1). This method considers the population size and ensures the selection of samples with equal probability.
Where
The total sample size for the selected Kebeles was calculated from the total households (which were ≈6,876) and the degree for error of confidence (≈0.07).
So, a total of 198 households were selected as sample respondents using the systematic sampling method; proportionally to the size of households of each Kebele (stratum) using Equation 2:
Where:
Using this formula, the sample sizes for each Kebele was calculated proportionally based on the household numbers, ensuring that the sample is representative of the population distribution across the selected Kebeles (Table 1).
2.3 Data acquisition
2.3.1 CHIRPS precipitation estimate
The Climate Hazards Group Infrared Precipitation Satellite (CHIRPS) dataset, integrating satellite estimates, global climatology, and in situ data, offers high-resolution of 0.05° precipitation records from 1981 to the present, facilitating detailed climatic analyses (Shahid et al., 2021). The CHIRPS precipitation Estimate Data, available through the Google Earth Engine (GEE) software package (Table 1), is a crucial satellite-based source for this drought analysis with a spatial resolution of 5 km by 5 km naturally and reduced to 250 m using the program. However, the GEE provides a cloud data catalog (https://developers.google.com/earth-engine/datasets) website for CHIRPS with a more manageable 250 m resolution, enabling resampling. This high-quality precipitation data is essential for calculating the Standardized Precipitation Index (SPI) and conducting comprehensive drought analysis in the study area.
2.3.2 Observed precipitation data
Daily precipitation data were gathered from the Ethiopian Meteorological Agency (EMA) for the years 2000–2020, sourced from Mekele Obseva, Sekota, Yichila, and Ashere meteorological stations located near and within the study area. Although, a minimum data series of 30 years is typically required for comprehensive climate data analysis, while in regions with scarce historical climate data availability, utilizing shorter time ranges of 20 years and above becomes a viable option to address data constraints and conduct meaningful analyses (Dinku, 2019). These datasets were used to validate the CHIRPS data to ensure accuracy and reliability of the meteorological drought assessment. Random forest regression (RFR) model was applied to evaluate the validation between the variables. It is mainly because, the model is a machine learning algorism, which has a better performance than the other models such as the linear regression (Tesfay, 2024). It has also several advantages, including its ability to handle complex datasets (handle both numerical and categorical features including missing data), and reduces overfitting compared to individual decision trees (Montesinos López et al., 2022).
2.3.3 Socioeconomic survey data
Socioeconomic survey, and self-observation with field notes in the drought-affected areas were collected for socio-economic drought investigation. Quantitative data were gathered through a questionnaire survey of 198 households (Table 2).
2.4 Software packages used
The software packages used for this analysis were Python programing version 2.5, GEE, ArcGIS 10.8, and the Statistical Package of the Social Sciences (SPSS) version 27. Python programming is important because it is a versatile and user-friendly language that can be applied across various domains (Raza et al., 2024). It was used for spatial and temporal analysis, mapping, statistical analysis, and scripting tasks related to drought index calculation, data manipulation, and integration of various datasets. Its extensive libraries and strong community support make it an ideal choice for both beginners and experienced developers seeking efficient solutions. Google Earth Engine (GEE) is crucial for leveraging vast amounts of satellite imagery and geospatial data to analyze environmental and climatic changes at scale. Its powerful cloud computing capabilities enable researchers and policymakers to make informed decisions about land use, conservation, and disaster response effectively and efficiently (Velastegui-Montoya et al., 2023; Mashala et al., 2023). In the present study, GEE was used for data downloading. ArcGIS 10.8 was used for geospatial data processing and mapping techniques. On the other hand, SPSS is a powerful software tool used for statistical analysis and data management, allowing researchers to perform complex statistical analyses and interpret data trends easily. It provides a user-friendly interface and a suite of statistical functions, making it accessible for users across various fields, including social sciences (Rahman and Muktadir, 2021). The SPSS here was used for socioeconomic data management and statistical analysis of the socioeconomic data in tabular format.
2.5 Data processing and analysis techniques
2.5.1 Detection of meteorological droughts
2.5.1.1 Standardized Precipitation Index (SPI)
The SPI is a drought index widely used for monitoring drought conditions (WMO, 2016). It measures the deviation of precipitation from the long-term average by applying a gamma distribution function to the precipitation data. The SPI calculates alpha (α) and beta (β) parameters based on the long-term precipitation record, providing a measure of rainfall anomalies. SPI is preferred over other indices due to its standardized approach, flexibility in time scale analysis for varying time scales, allowing for the assessment of either short-term and long-term precipitation deficits or surpluses. In addition, SPI is based solely on precipitation data, making it less sensitive to subjective or variable climate factors compared to other meteorological indices, thus providing a more standardized measure of drought conditions. It is applicable for long-term trend assessment, and research applicability in assessing drought severity (Kemal, 2024). It also helps indicate the onset and severity of drought conditions and has been used in studies worldwide for drought monitoring (Mckee et al., 1993). The SPI, in general, has the advantage of being highly flexible, as it can be computed for varying time scales, allowing for the assessment of both short-term and long-term precipitation deficits or surpluses.
The research utilized the SPI data obtained from the CHIRPS data catalog through GEE. The GEE allows for data resampling to a 250 m resolution and enables corrections before downloading the data in GeoTIFF and CSV formats. The GeoTIFF data is re-projected to Universal Transverse Mercator (UTM) zone 37 using ArcGIS 10.8 for spatial analysis, while the CSV file supports time series analysis. The SPI values for summer months (June, July, August, and September) and summer seasons are calculated using the Python programming (version 2.5). The spatial SPI displayed using a Python script involving several key steps. The process begins with collecting precipitation data from 2000 to 2023 for the study area, followed by importing essential libraries like rasterio, matplotlib, and os. The script calculates the long-term mean and standard deviation by defining file paths for input raster datasets and setting an output directory path, deriving SPI values for each pixel using the formula; in Equation 3. These SPI values are visualized through color mapping onto a predefined scale representing various drought levels in a 6 × 4 grid of subplots using Matplotlib. A legend is prepared to explain the color mapping scheme, and the SPI results for each year were saved as TIFF files.
The study applied the SPI calculation formula introduced by (Mckee et al., 1993; Guttman, 1998; Lloyd-Hughes and Saunders, 2002), as indicated in Equation 3.
Where:
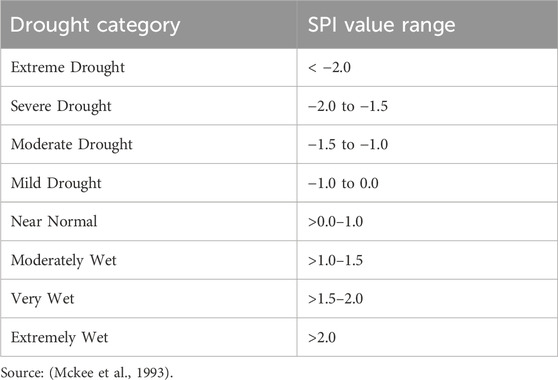
The resulting SPI values can be categorized based on the ranges provided in Table 3 from (Mckee et al., 1993).
2.5.2 Socioeconomic data analysis
To analyze and organize the socioeconomic data, the research project utilized the SPSS software. Various analysis techniques, including descriptive statistics and qualitative narrations were employed to examine the data collected from different sources. The raw data captured from the various sources were primarily edited and checked for accuracy. The edited data were encoded into the SPSS software for analysis. Following this, the quantitative data collected through questionnaire surveys were analyzed using statistical techniques available in the SPSS software. The software facilitated the generation of tables and charts to present the analyzed data effectively. The integration of statistical, descriptive and narrative analysis allowed for a comprehensive exploration of the research data. The statistical analysis provided quantitative insights and trends, while the narrative analysis delved into the rich narrative aspects of the data. Moreover, python programing options were applied in generating tables and charts from the data.
2.5.3 Identification of drought risk areas
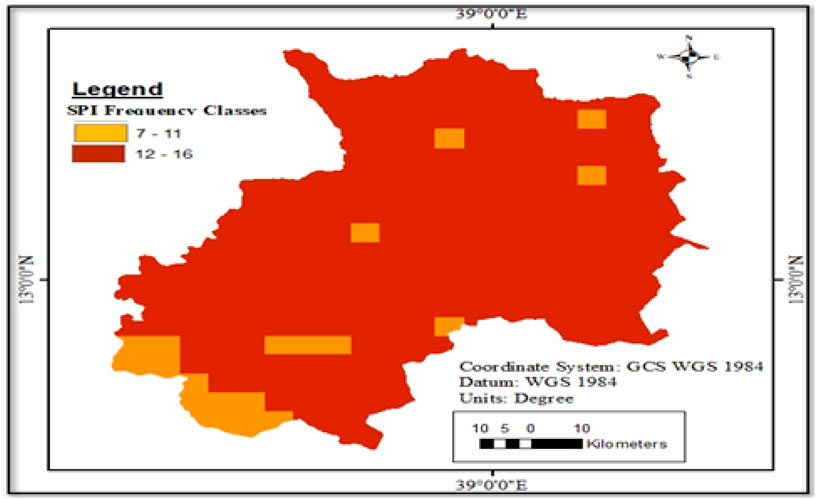
The identification of drought-prone areas in this study was conducted by combining SPI based meteorological drought frequency maps. This is significant and often applied in various research studies (Senamaw et al., 2021; Bazie and Bantigegn, 2024; WMO, 2016). The study utilized 96 separate agricultural drought images for each summer months and this was aggregated into 24 seasonal images to determine the occurrence of droughts in the study watershed. To represent different severity levels, each yearly binary image was transformed into a Boolean image. A Boolean image refers to a raster image where each pixel has a binary value, typically representing two states such as “true” or “false”, “1” or “0”, or “on” or “off”, used for binary operations in spatial analysis like overlaying multiple layers or defining areas of interest based on specific criteria. It is commonly used for image processing and pattern recognition (Bhowmick et al., 2014). By summing the images from each year, the frequency of drought at each pixel level was calculated. To this end, drought probability zones in an area can be classified as high, moderate, or low risk, when drought occurs over 50%, 30%–50%, or less than 30% of the years, respectively (Gonfa, 1996). Therefore, the frequency map was subsequently classified into five agricultural drought risk categories based on the following criteria: 0–1 (no drought risk); 2–6 (low drought risk); 7–11 (moderate drought risk); 12–16 (high drought risk); and ≥17 (very high drought risk) zones (Senamaw et al., 2021; Gonfa, 1996; Suryabhagavan, 2017; Wassie et al., 2022b).
3 Results and discussion
3.1 Temporal and spatial SPI drought trends in the Tekeze watershed
Before proceeding to the final analysis, it is essential to validate the accuracy and reliability of the CHIRPS precipitation data by conducting correlation and regression analysis with precipitation data from four selected meteorological stations (Mekele Obseva, Sekota, Yichila, and Ashere). This analysis covers the period from 2000 to 2020.
Accordingly, the coefficient of determination (R-squared) is calculated to be 0.88, 0.87, 0.88, and 0.84 for Mekele Obseva, Sekota, Yichila, and Ashere stations, respectively (Figure 2). This value implies that approximately 88, 87, 88, and 84% of the variation in the observed station precipitations can be explained by the CHIRPS precipitation data. In other words, CHIRPS is a very good predictor of the actual precipitation recorded at the stations, capturing a significant portion of the precipitation variability. These findings provide confidence in the accuracy and reliability of the CHIRPS precipitation data, indicating its suitability for further analysis and interpretation. It demonstrates the potential of CHIRPS as a valuable tool for precipitation estimation and monitoring in the study area. This result is supported by results of various scholars (Senamaw et al., 2021; Bazie and Bantigegn, 2024; Lloyd-Hughes and Saunders, 2002; Wassie et al., 2022a).
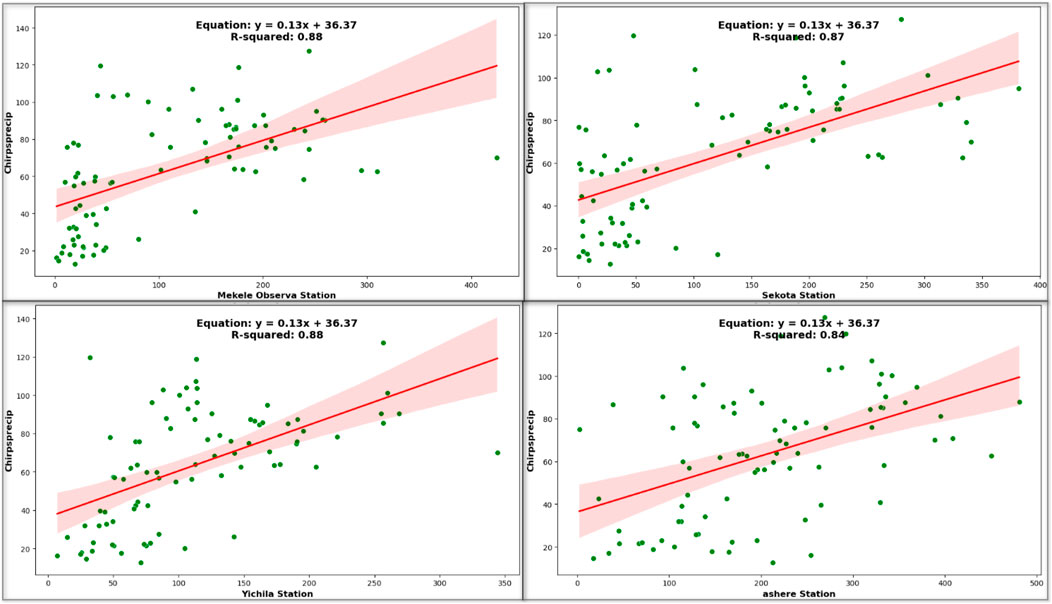
Figure 2. Regression chart between CHIRPS and Mekele Obseva, Sekota, Yichila, and Ashere stations precipitation.
3.1.1 Temporal trends of standardized precipitation index (SPI) from 2000 to 2023
Temporal trend assessment is important in drought assessment because it helps to monitor drought severity over time, identify drought hotspots, understand climate change impacts on drought patterns, inform water resource planning and management, and contribute to the development of early warning systems. It provides valuable information into long-term changes in drought conditions.
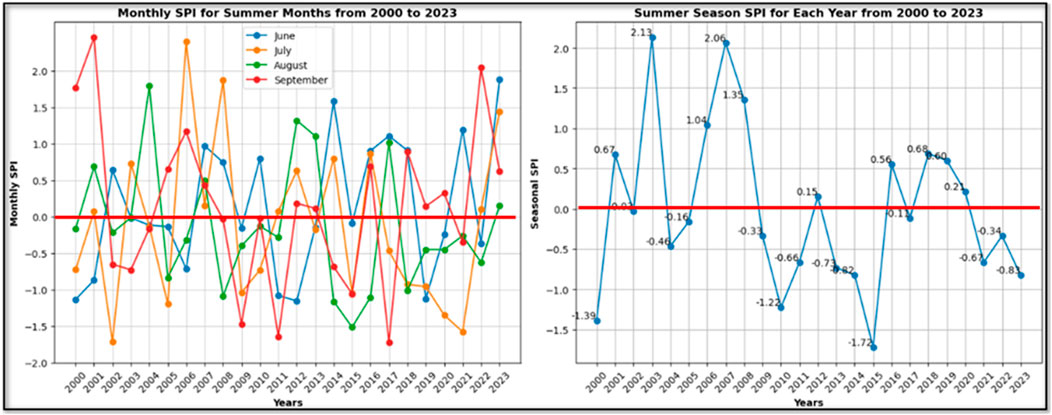
In Figure 3, two charts are presented. The first chart displays SPI-1 values for each summer month (June, July, August, and September), while the second chart shows the SPI-4 values, which represent the combined value for the four summer months of each year. The charts utilize zero as the demarcation line to distinguish between drought and no drought conditions. It is observed that the monthly SPI variations are minimal, indicating slight fluctuations in drought severity throughout the summer months.
Based on the second chart in Figure 3, the results indicate that all the values listed below the demarcation line represent various drought categories. The year 2015 experienced a severe drought condition with a value of −1.72. The years 2000 and 2010 on the other hand fall under the moderate drought category with values of −1.39 and −1.22, respectively. Additionally, the years 2002, 2004, 2005, 2009, 2011, 2013, 2014, 2017, 2021, 2022, and 2023 were classified as mild drought conditions with values of −0.03, −0.46, −0.16, −0.33, −0.66, −0.73, −0.82, −0.11, −0.67, −0.34, and −0.83, respectively. Based on the identified drought years, the drought reoccurrence period is 1.71 which is approximately 2 years. Which means drought can happen in every 2 years for the entire study period in the area.
On the other hand, the value results above the demarcation line of 0.0 indicate no drought categories. The years 2003 and 2007 are classified as extremely wet with values of 2.13 and 2.06, respectively. Additionally, the years 2006 and 2008 fall into the moderately wet category with values of 1.04 and 1.35, respectively. The remaining years, namely 2001, 2012, 2016, 2018, 2019, and 2020, are categorized as near normal.
These results are consistent with findings from various scholars like Birhanu Gedif and Karuturi Venkata Suryabhagavan (2014) focused on agricultural drought in northern Tigray from 1998 to 2005, utilizing NDVI. They identified severe drought conditions in the years 2000 and 2004. Gebre et al. (Gebre et al., 2017) Examined agricultural drought in the North Wollo zone from 2000 to 2015, also using NDVI. Their research identified the drought years as 2005, 2009, 2013, and 2015. Wassie et al. (Wassie et al., 2022b) Analyzed agricultural drought using NDVI anomalies in North Wollo from 2000 to 2019, finding varying levels of drought in the years 2004, 2008, 2009, 2010, 2011, and 2015, which align with the results. Also Enyew and Wassie (Bazie and Bantigegn, 2024) Conducted research on meteorological drought in the Menna watershed from 2000 to 2022 using various indices, also highlighted severe drought conditions were in 2009, 2010, 2011, 2014, and 2015.
3.1.2 Spatial distribution of meteorological drought status using SPI
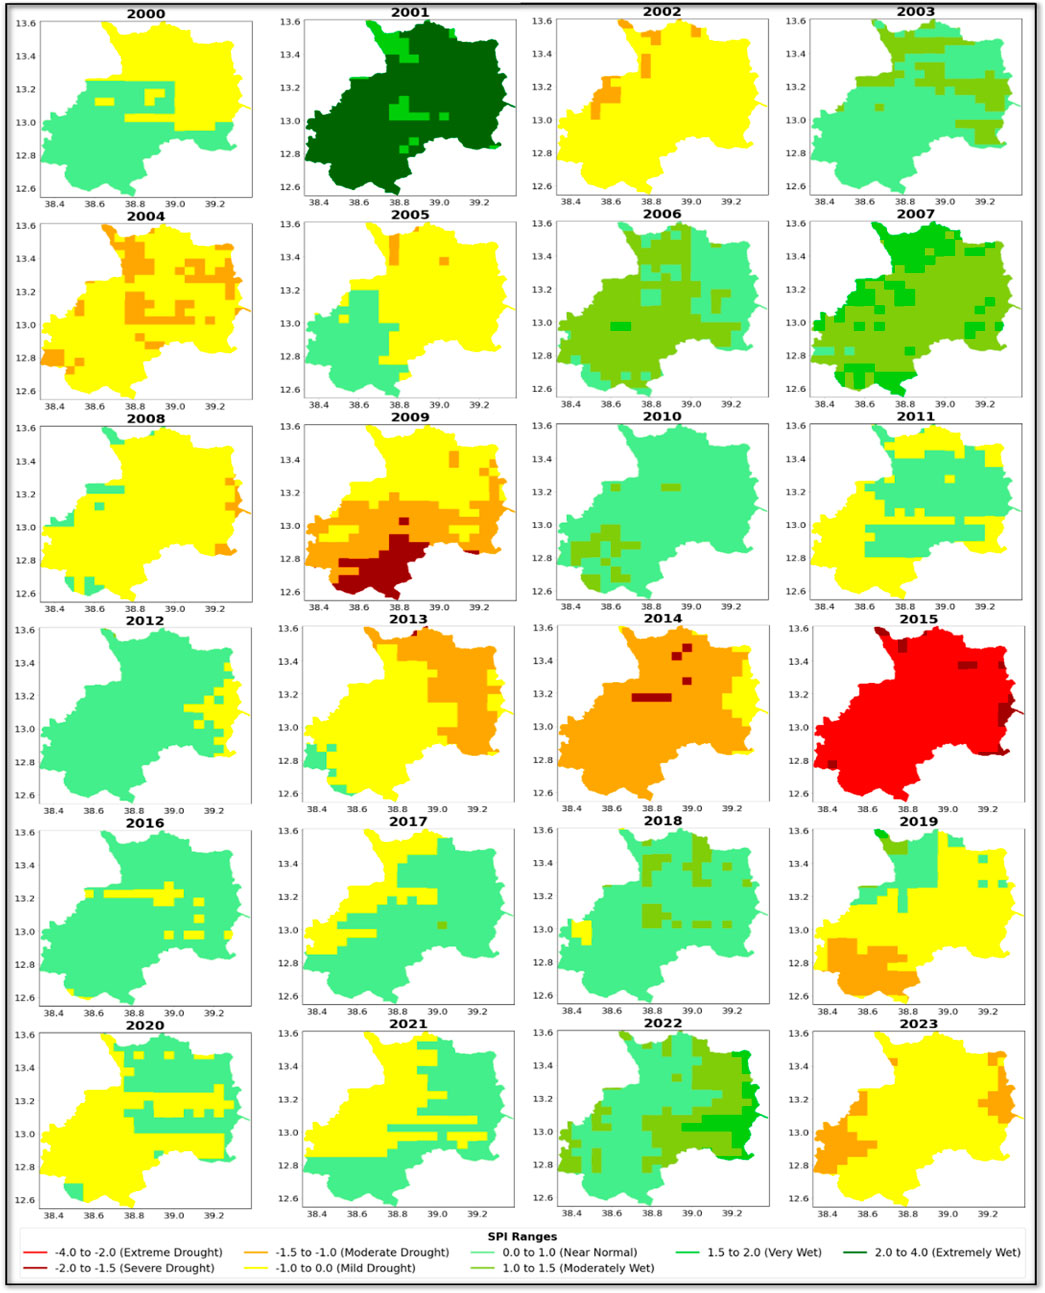
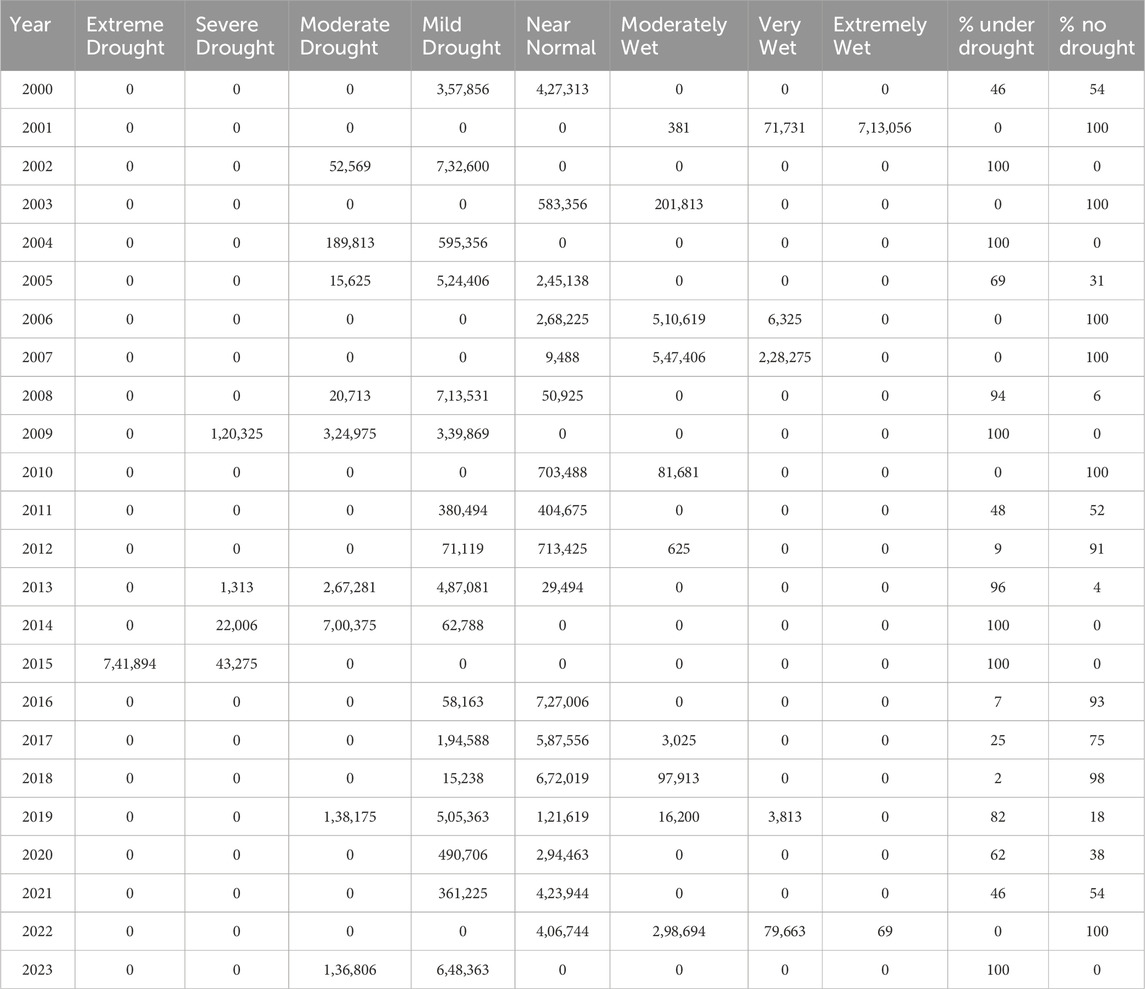
The spatial SPI maps in Figure 4, can be classified into various drought categories spatially. The years 2002, 2004, 2009, 2014, 2015, and 2023 are fully categorized under different drought categories. Among them, 2015 stands out as the most notable drought year, with extreme and severe drought conditions covering the entire area.
The years 2000, 2005, 2008, 2011, 2012, 2013, 2016, 2017, 2018, 2019, 2020, and 2021 experienced a mix of moderate and mild droughts, as well as near normal and moderately wet conditions, indicating both drought-affected and drought-free areas. Conversely, the remaining years, namely 2001, 2003, 2006, 2007, 2010, and 2022, are known to be drought-free, with categories ranging from near normal to extremely wet conditions observed in the area. The wettest season, in terms of spatial coverage, occurred in 2001, with the highest percentage of the area classified as extremely wet. Table 3 represents The “Extreme Drought,” “Severe Drought,” “Moderate Drought,” and “Mild Drought” columns representing the total area in ha for each respective drought category. The “Near Normal,” “Moderately Wet,” “Very Wet,” and “Extremely Wet” columns represent the total area in ha for each respective non-drought category. The “% under drought” column indicates the percentage of the area under drought, and the “% no drought” column indicates the percentage of the area without drought.
According to Table 4, several years stand out in terms of drought occurrences and their respective areal coverages. Specifically, the years 2002, 2004, 2005, 2008, 2009, 2013, 2015, 2019, 2020, and 2023 experienced significant drought events with areal coverages of 100, 100, 69, 94, 100, 96, 100, 100, 82, 62, and 100%, respectively. Among these years, 2015 emerged as the most severe drought year, as the entire area was affected by extreme and severe drought conditions. This pattern highlights the recurrent and substantial impact of meteorological drought or precipitation shortages in the watershed. Conversely, the remaining years were considered relatively wet, as 50% or more of their area remained drought-free. Notably, 2001 and 2007 represent the wettest years, with a large portion of their area categorized as very wet and extremely wet. These findings suggest an excessive amount of precipitation during those specific years in the study area.
The findings of this study on meteorological drought align with previous research conducted by various scholars in different regions of the study area and other parts of Ethiopia. For instance, Chere et al. (2022) examined meteorological drought in the highlands of Ethiopia using SPI-1 from 2004 to 2018. His study identified drought conditions in the years 2004, 2005, 2009, 2014, 2015, 2016, 2017, and 2018, which closely correspond to the findings of the current research. Similarly, Nasir et al. (2021) investigated meteorological drought in the northeastern escarpment of the Rift Valley from 1989 to 2016 using SPEI-3 for the summer season. They identified drought years as 2002, 2004, 2008, 2011, and 2015, which aligns with the results of the current study. Senamaw et al. (2021) Conducted a study in the Waghimra Zone using SPI from 2000 to 2016 and identified drought-affected years in 2003, 2004, 2005, 2008, 2009, 2011, 2014, and 2015, which strongly coincide with the current research findings. Likewise, Wassie et al. (2022b) investigated meteorological drought in North Wollo from 2000 to 2019, identifying drought years as 2002, 2004, 2009, 2011, 2014, 2015, and 2019 based on the Z-Score Index. In the upper Tekeze basin, Menna et al. (2022) found drought years to be 1984, 2004, 2006, 2011, and 2015. Lastly, Enyew and Wassie Bazie and Bantigegn (2024) studied meteorological drought in the Mena watershed from 2000 to 2023, identifying drought years as 2002, 2004, 2009, 2014, 2015, and 2019. All of these findings show similarities with the current findings.
Based on data accessed from the Emergency Events Database (EM-DAT) website (www.emdat.be), in the case of Amhara and Tigray regions, the years 2003, 2008, 2009, 2010, 2015, and 2021 were identified as drought years caused by precipitation shortages, La Niña, and El Niño events. These droughts resulted in significant impacts, including crop failure, loss of pasture, food shortages, and famines in 2008 and 2015.
The EM-DAT records also indicated that other disasters such as floods and epidemics exacerbated the drought conditions in the area. Flooding events were documented in most of Amhara and Tigray in 2001, 2005, 2006, 2007, 2010, and 2022, as well as, in the Gondar province in 2020. Additionally, various epidemics, including bacterial diseases (e.g., Meningococcal), infectious diseases (e.g., watery diarrhea), and viral diseases (e.g., Yellow fever and Measles), affected different parts of the study area. Bacterial disease outbreaks were reported in Kobo and Alamata in 2000, while these epidemics have been prevalent in most parts of Tigray and Amhara regions since 2001, 2005, 2006, 2008, 2009, 2018, 2019, and 2022.
3.1.3 SPI drought frequency risk map from 2000 to 2023
Figure 5, presents the severity classes of drought risk based on SPI and their corresponding areas in a percentage. The findings reveal that the analyzed region is characterized by varying levels of drought risks. The class of “Moderate Drought Risk” covers 92.18% of the area. On the other hand, only 7.82% of the area characterized under “High Drought Risk”. This suggests a relatively lower vulnerability to more severe drought conditions. It is important to assess and address the impacts of both moderate and high drought risks, as they can have significant implications for various sectors such as agriculture, water resources, and ecosystems. Proper drought management strategies, including water conservation, land-use planning, and drought-resistant crop cultivation, should be implemented to mitigate the potential impacts of drought in the region.
To validate the results of this study, the researcher compared the findings with those of various other studies. For instance Senamaw et al. (2021) Created a drought risk map for the Waghimra Zone and found that 0.4%, 35%, 56%, and 8.3% of the area fall into the categories of slight, moderate, severe, and very severe drought classes, respectively. According to Enyew (2024) in his study of agro-meteorological drought in the Menna watershed, the combined drought risk map indicated low, moderate, high, and very high drought risks of 3.2%, 21.2%, 47.4%, and 28.1%, respectively.
3.2 Addressing drought and ensuring food security: insights from questionnaire survey
The purpose of this survey was to gather information on addressing drought and ensuring food security in the Abergele, Samre, Sehala, Tanqua-Abergele, and Ziquala woredas. It was specifically targeting farmers who are the main affected group by drought. The survey seeks to understand their experiences, perceptions, and coping strategies. With a sample size of 198 households out of a total of 6,876, the survey aims to identify the impacts of drought on agriculture, water availability, income, and food security, as well as farmers’ perceptions of the causes of drought and their utilization of government or non-governmental programs/initiatives. The findings can inform policies and initiatives to enhance resilience and promote sustainable agriculture in the target woredas ensuring a more secure future for farming communities.
3.2.1 Demographic characteristics of the respondents
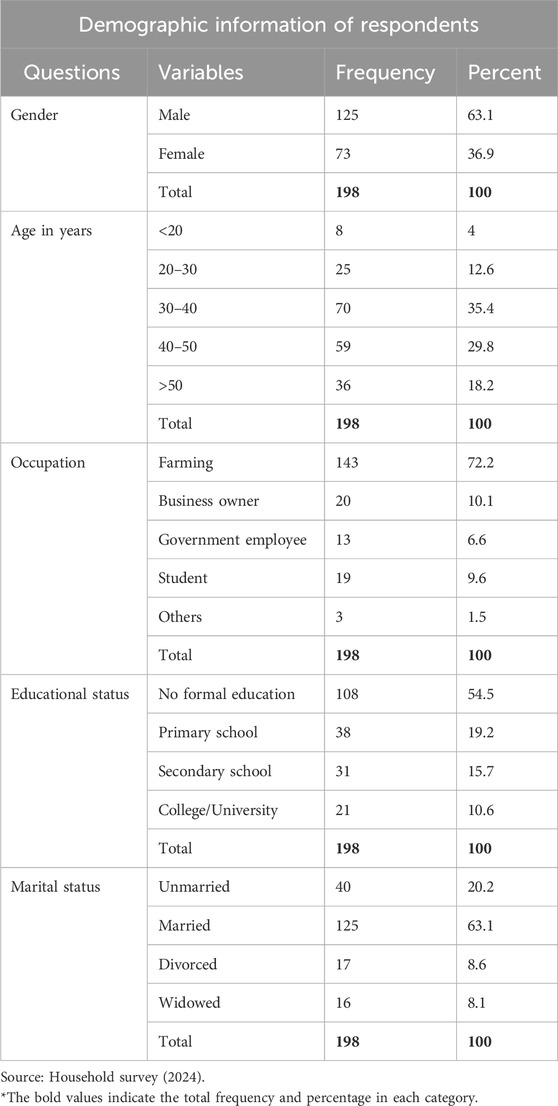
Table 5 presents the demographic characteristics of the respondents. It provides information about the composition of the respondent’s gender, age, occupation, educational background, and marital status. In Gender composition: among the studied households, 63.1% were male-headed and 36.9% female-headed. This indicates a slightly higher representation of male-headed households in the study.
On the other hand the age distribution of the respondents shows that the majority of household heads fall within the age range of 30–50 years. More than 35% (35.4%) are falling between 30 and 40 years and some 29.8% are 40–50 years of age. The remaining 4, 12.6% and 18.2% of the heads fall within <20, 20 to 30, and above 50 years ages, respectively (Table 5). This indicates that the study has a significant proportion of middle-aged participants.
Furthermore, the occupation of the respondents also reveals that the largest group consists of farmers, accounting for 72.2% of the participants. Business owner’s make-up 10.1% of the households, followed by government employees (6.6%), students (9.6%), and others (1.5%) (Table 5). This majority group of farmers participated in the survey have a great interest. Farmers are directly dependent on precipitation and climatic conditions for their agricultural activities. Therefore, they are particularly vulnerable to the impacts of drought, as it can have severe consequences on their livelihoods, crop yields, and overall economic wellbeing. By including a significant proportion of farmers in the study, the research can gain valuable information about the socioeconomic effects of drought.
In terms of educational background, 54.5% of the respondents had no formal education, while 19.2% had completed primary school education. Additionally, 15.7% had attained a secondary school level, and the other 10.6% had pursued further education at college or university level (Table 5). The distribution of educational backgrounds among the respondents highlights the varying levels of knowledge, skills, and capacities within the population regarding socioeconomic drought. This information is crucial for understanding potential disparities in vulnerability, adaptive capacity, and access to resources and opportunities.
The marital status distribution shows that the majority of the respondents were married (63.1%). Unmarried individuals accounted for 20.2%, while 8.6% were divorced and 8.1% widowed (Table 5). The distribution of marital status among the respondents indicates the diversity of marital situations within the studied population.
3.2.2 Perception and experience of drought by the affected group
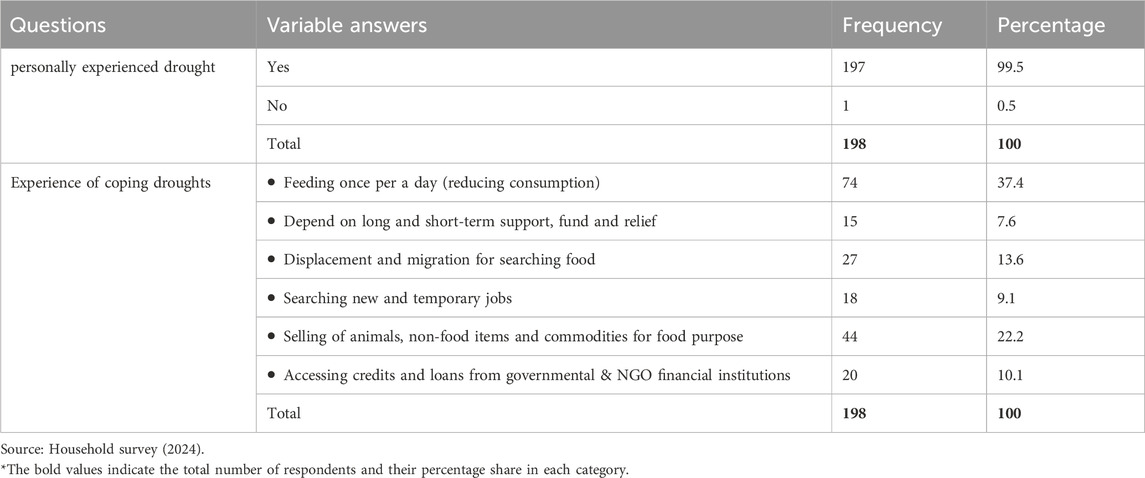
Table 6 presents important information about the personal experiences of drought and coping mechanisms of households. Out of the 198 participants, an overwhelming majority of 197 individuals (99.5%) reported personally experienced drought; indicating the significant impact of drought within the study area. This highlights the relevance and importance of their perspectives in understanding the socioeconomic effects of drought. The high percentage of respondents who have encountered drought suggests that they possess valuable firsthand knowledge about the challenges and impacts associated with drought conditions. Their experiences can provide crucial data for assessing the severity of drought, identifying vulnerable groups, and understanding the coping strategies employed during such periods. This result is supported by the results of Olaleye (2010), indicates that 92% of the respondents were experienced drought. Abdela (2024), find that most of the respondents are understanding what a drought is.
The respondents were using various coping mechanisms. The most prevalent coping mechanism reported was reducing food consumption such as feeding once per day (37.4%), indicating the challenges individuals facing in accessing sufficient food during drought periods (Table 5). Some other individuals relied on support, funds, and reliefs (7.6%) provided by governmental or NGOs. Displacement and migration (13.6%) were reported as strategies to search for food, while others sought new job opportunities (9.1%) to mitigate the impact on their livelihoods. Selling animals and non-food items emerged as a means to acquire immediate food by 22.2% of the households. Accessing credits and loans from financial institutions (10.1%) was another coping strategy. These findings highlight the diverse approaches individuals adopt to address the socioeconomic challenges imposed by droughts.
In order to validate the results, it is beneficial to compare them with findings from other researchers. Example, Awoke et al. (2022), identified coping strategies such as planting early maturing crops, changing cropping patterns, purchasing food using cash, and seeking alternative income sources. Bahiru et al. (2023), highlighted coping mechanisms including selling charcoal, firewood, and livestock, migrating in search of employment, and resorting to begging. Additionally, Abate (Abate, 2016), outlined coping strategies such as selling livestock, reducing daily food consumption, and participating in social support networks.
3.2.3 Primary causes of drought occurrence and severity
Table 7, represents the results from the respondents that indicate the primary causes or contributing factors to drought occurrence and severity in the local area. The majority of respondents (86.36%) identified climatic variability, including factors such as decreased precipitation, increased temperature, and other changes, as the primary causes of drought. This highlights the significant influence of climate patterns on the occurrence and severity of drought.
Land use land cover changes (LULCCs) and land degradations were mentioned by 36.36% of the respondents, indicating that activities such as deforestation and improper land management play a significant role in exacerbating drought conditions (Table 7). Water mismanagement was reported by 29.80% of respondents, emphasizing the importance of proper water resource management practices to mitigate drought impacts (Table 7). Deforestation, including practices like burning and land clearance for agriculture, was identified as a cause by 45.96% of respondents, suggesting that LULCCs can disrupt the local water balance and contribute to drought events. Other factors such as conflict and desert locust were mentioned by 22.73% of the respondents, indicating their indirect effects on water resources, agricultural practices, and productivity.
The LULCCs in northern Ethiopia, driven by factors such as population growth, agricultural expansion, deforestation, and urbanization, have led to deforestation, soil degradation, water resource depletion, biodiversity loss, and other significant environmental and socioeconomic impacts (Alemu, 2015; Wassie, 2020; Hussein, 2023).
The foregoing causes mentioned by the respondent households are also supported by reports of past researches and scholars. For instance, Bahiru et al. (2023) identified factors such as family size, farm land size, household education levels, pests, diseases, and flooding as contributors to drought. Abate (2016), pointed out causes like inadequate precipitation, population pressure, poor soil conditions, improper harvest management, deforestation, and land scarcity as triggers of drought. Mekonnen and Gökçekuş (2020), highlighted issues such as insufficient precipitation, human activities, and surface water depletion, and climate change, lack of food reserves, high food prices, low cattle prices, and limited knowledge of adaptive farming techniques as common problems leading to drought. Gebremedhin Gebremeskel et al. (2019), attributed the changing pattern of droughts primarily to climate variability and anthropogenic influences.
3.2.4 Frequency and severity of drought in the study area
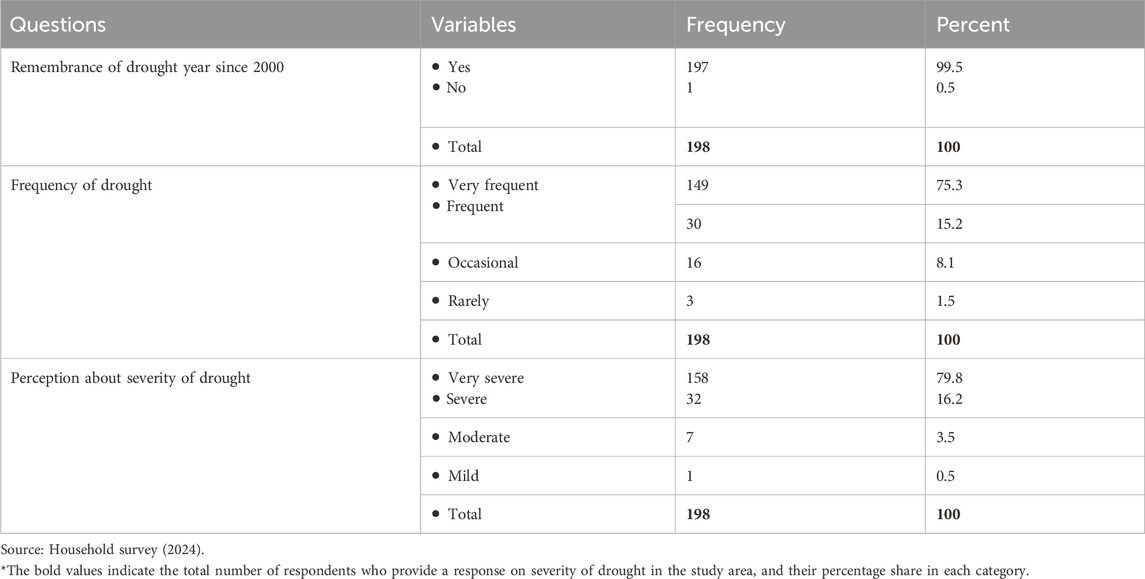
According to Table 8, the frequency of drought in the local area is perceived differently by the respondents. The majority (75.3%) described drought as “very frequent,” indicating that drought events occur frequently and are a recurring issue in the region. This also validates to the results of the temporal SPI that shows 14 out of the 24 years were facing various drought levels on average indicating that drought is very frequently happening in the Tekeze watershed. A smaller percentage of respondents (15.2%) reported drought as “frequent,” suggesting that while not as persistent as the “very frequent” category, drought events still occur regularly. Some respondents (8.1%) classified drought as “occasional,” indicating that drought is not as common but still occurs periodically. A few respondents (1.5%) described drought as “rarely,” suggesting that drought events are infrequent occurrences in the local area. The tangibility of responses regarding drought frequency stems from a multitude of factors. One significant aspect is the less willingness to respond carefully. Furthermore, when examining the respondents’ profiles, a mere 10.1% comprise business owners, 6.6% are government employees, and 9.6% are students. These figures indicate that individuals whose livelihoods do not primarily depend on agriculture possess a rather superficial comprehension of drought frequency. Consequently, this situation engenders a myriad of divergent and misguided responses.
Table 8 also shows the severity of drought impacts on the local area. The majority of the respondents (79.8%) classified the impact as “very severe,” indicating that drought has a significant and highly detrimental effect on the region. Additionally, 16.2% of the respondents reported the impact as “severe,” suggesting that while not classified as “very severe,” drought still has a substantial negative impact on the local area. A small percentage of respondents (3.5%) perceived the impact of drought as “moderate,” indicating a milder but still noticeable effect. Only 0.5% of respondents described the impact as “mild,” suggesting that for the majority of respondents, the impact of drought is significant and has severe consequences for the local area.
The vast majority of the respondents (99.5%) recall that they were experiencing drought years in the local area since 2000. This suggests a high level of awareness and firsthand experience with drought events in the region. Only a very small percentage of respondents (0.5%) reported not remembering any drought year since 2000.
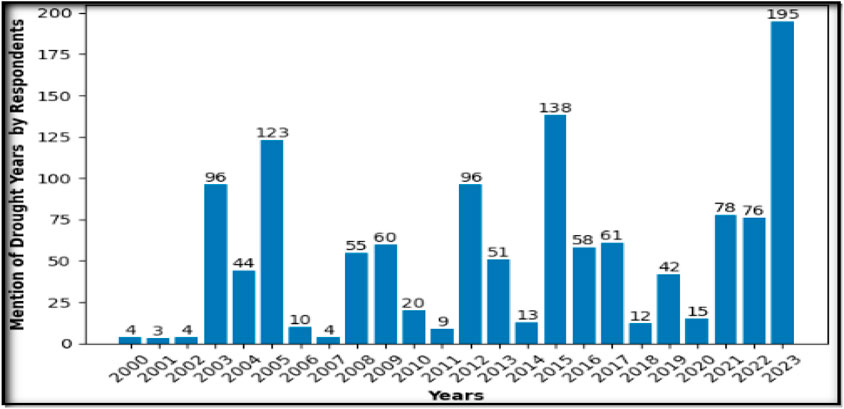
Based on the researcher’s judgment for the chart in Figure 6, the drought years can be categorized as follows: wet years with a mention of respondents less than 25, mild drought years with a mention of respondents ranging from 25 to 50, moderate drought years with a mention of respondents ranging from 50 to 75, severe and extreme drought years with a mention of respondents above 75. Based on this categorization, the years 2000, 2001, 2002, 2006, 2007, 2010, 2014, 2018, and 2020 had 4, 3, 4, 10, 10, 4, 20, 13, 12, and 15 mentions, respectively, indicating wet years. This result can validate the results of SPI (page 8), mentioned earlier indicating that there are similarities among the satellite estimates and ground observation results.
On the other hand, the years 2004 and 2019, with mentions of 44 and 42 respectively, fall into the category of mild drought years. The years 2008, 2009, 2013, 2016, and 2007, with mentioned values of 55, 60, 51, 50, and 61, respectively, were considered moderate drought years. Finally, the years 2003, 2005, 2012, 2015, 2021, 2022, and 2023, with mentioned values of 96, 123, 96, 138, 78, 76, and 195, respectively, were classified as severe and extreme drought years. More or less, these results also have a great linkage with the foregoing results of the satellite based indices of the SPI.
3.2.5 Significant impacts of drought on the local community of the study area
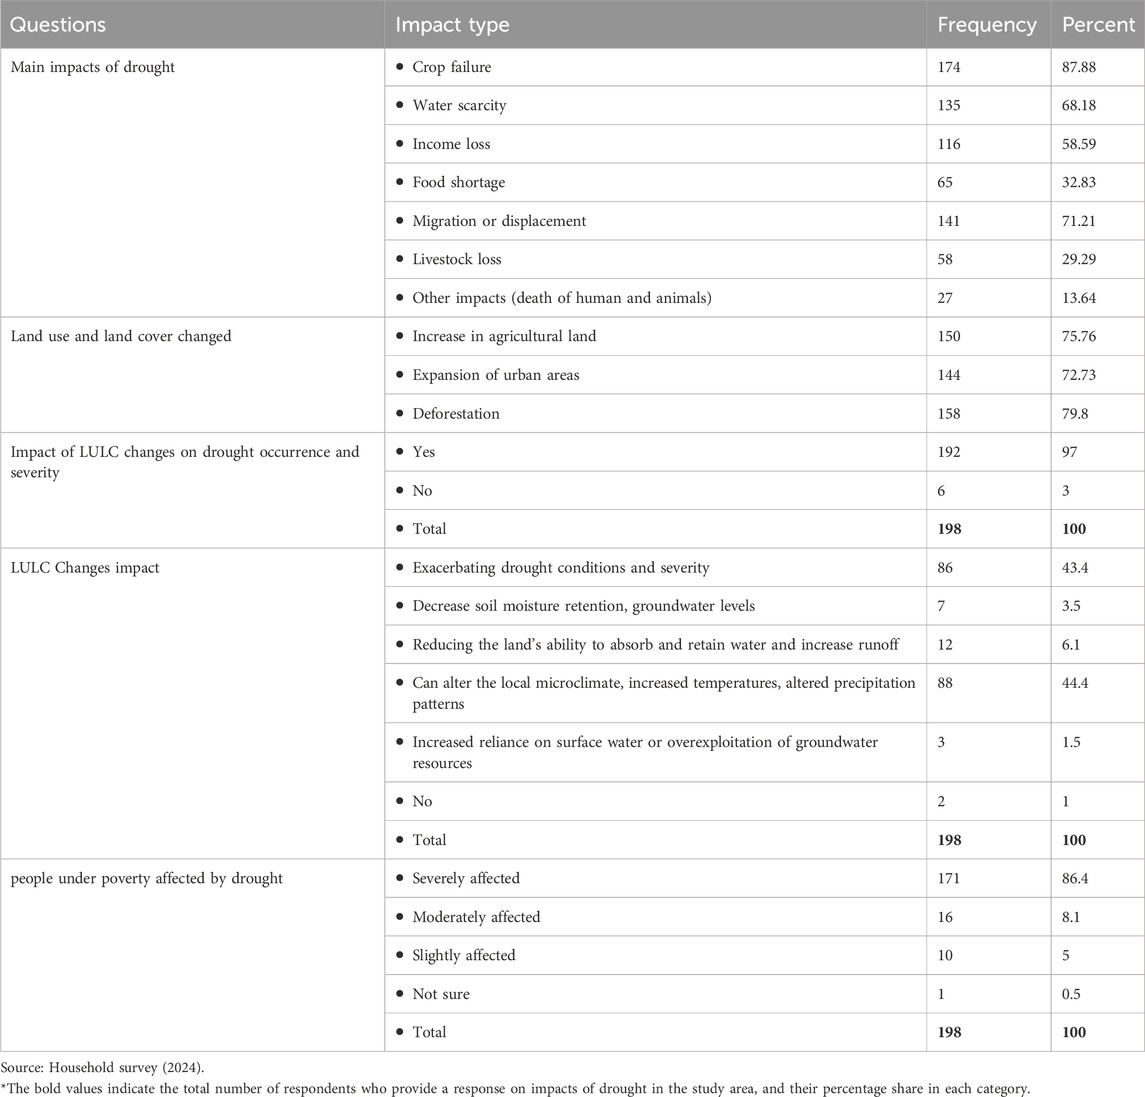
In Table 9, the survey results indicate that the main impacts of drought in the local area, as reported by the respondents are; crop failure (mentioned by the majority of respondents ≈87.88%), highlighting the vulnerability of agriculture to drought conditions. Water scarcity was reported by 68.18% of respondents, emphasizing the impact on the availability and access to water resources. Income loss was identified by 58.59% of the respondents, indicating the economic consequences of drought on individuals and communities. Food shortage was again mentioned by 32.83% of the respondents, indicating the potential impact on food security. Migration or displacement was reported too by 71.21% of the respondents, suggesting that drought can lead to population movements as people seek better living conditions or struggle to cope with the impacts. Livestock loss was another damage mentioned by 29.29% of the respondents, highlighting the impact on animal husbandry and livelihoods depending on livestock. Other impacts, including the death of humans and animals, were reported by 13.64% of respondents, indicating the severity of the consequences of drought events (see Table 9).
Furthermore, various scholarly works support and reinforce the aforementioned findings. For instance, Bogale and Erena (2022) have highlighted the adverse effects of drought in Ethiopia’s agro-ecological zones, including economic hardships, livestock mortality, water resource depletion, crop failures, increased food prices, losses in livestock productivity, environmental degradation, and health issues. Additionally, Hendrix (Morgan, 2012) has emphasized the consequences of drought in Ethiopia, such as water scarcity, food shortages, famine, water-borne diseases, disrupted education, exacerbation of poverty, and impacts on various aspects of life in the country. Other research conducted by Sinore and Wang (2024) also affirm that the negative impacts of droughts in Ethiopia, caused by insufficient precipitation and prolonged dry spells, extend to agricultural production by disrupting crop suitability, phenology, and productivity, while also significantly affecting water resources, ecosystems, and human wellbeing.
Based on Table 9, LULCCs in the local area have undergone significant transformations. The majority of respondents reported an increase in agricultural land (75.76%), indicating the expansion of agricultural activities. The expansion of urban areas was mentioned by 72.73% of the respondents, highlighting the urbanization process and its associated land use changes. Deforestation, including the clearing of forests, was reported by 79.8% of the respondents, suggesting the loss of forest cover in the local area. These results reflect the dynamic nature of LULCCs, with agricultural expansion, urbanization, and deforestation being prominent factors in the local area. Also out of the total respondents, 192 individuals (representing 97%) believe that LULCCs have an impact on drought occurrence and severity, while only 6 respondents (3%) believe LULCC does not have an impact.
The survey result in Table 9 again highlights the potential impacts of LULCCs on drought occurrence and severity in the local area. A significant proportion of respondents (43.4%) reported that these changes exacerbate drought conditions and severity. This suggests that alterations in Land Use Land Cover (LULC) contribute to worsening drought impacts. A smaller percentage of respondents (3.5%) mentioned a decrease in soil moisture retention and groundwater levels, indicating the potential reduction in water availability due to the LULCCs. Additionally, 6.1% of the respondents reported that LULCCs reduce the land’s ability to absorb and retain water, which can lead to increased runoff and decreased water infiltration. The alteration of the local microclimate and increased temperatures were mentioned by 44.4% of the respondents, suggesting that LULCCs can influence local weather patterns, further affecting drought conditions. A small portion of respondents (1.5%) mentioned increased reliance on surface water or overexploitation of groundwater resources as a potential impact of LULCCs. A few respondents (1%) answered “No,” indicating a perception that LULCCs do not have an impact on drought occurrence and severity.
The outcomes of this research align with findings from various scholars, for example Miheretu and Yimer (2018), observed that shrubland, cultivated and rural settlement areas, grassland, bare land, and urban built-up areas expanded annually at rates of 0.48%, 0.14%, 0.62%, 4.95%, and 28.45%, respectively and this can lead to natural habitat degradation. Tesfaw et al. (2023), investigated LULCCs and noted their potential impacts on livelihoods in the research area. Additionally, Yohannes et al. (2018), highlighted that LULCCs can lead to soil erosion, surface runoff, sediment degradation, and deforestation, underscoring the interconnected environmental consequences of such transformations.
The survey findings in Table 9 reveal that the impact of drought on people in poverty or with low socioeconomic status in the area. The majority of the respondents (86.4%) reported that these vulnerable groups are severely affected by drought. This indicates that individuals and households with limited resources and economic opportunities bear a significant burden when facing drought conditions. A smaller percentage of the respondents (8.1%) mentioned that people in poverty or with low socioeconomic status are moderately affected by drought, suggesting a varying degree of impact across the population. Additionally, 5% of the respondents reported that this group is slightly affected by drought, indicating a relatively milder impact. A very small proportion of respondents (0.5%) expressed uncertainty by selecting “Not sure” regarding the impact on people in poverty or with low socioeconomic status. These results highlight the disproportionate effects of drought on vulnerable communities and underscore the need for targeted interventions and support to mitigate the socioeconomic consequences they face. These findings can be substantiated by the results of (Araya and Stroosnijder, 2011; Bogale and Erena, 2022; Morgan, 2012; Sinore and Wang, 2024).
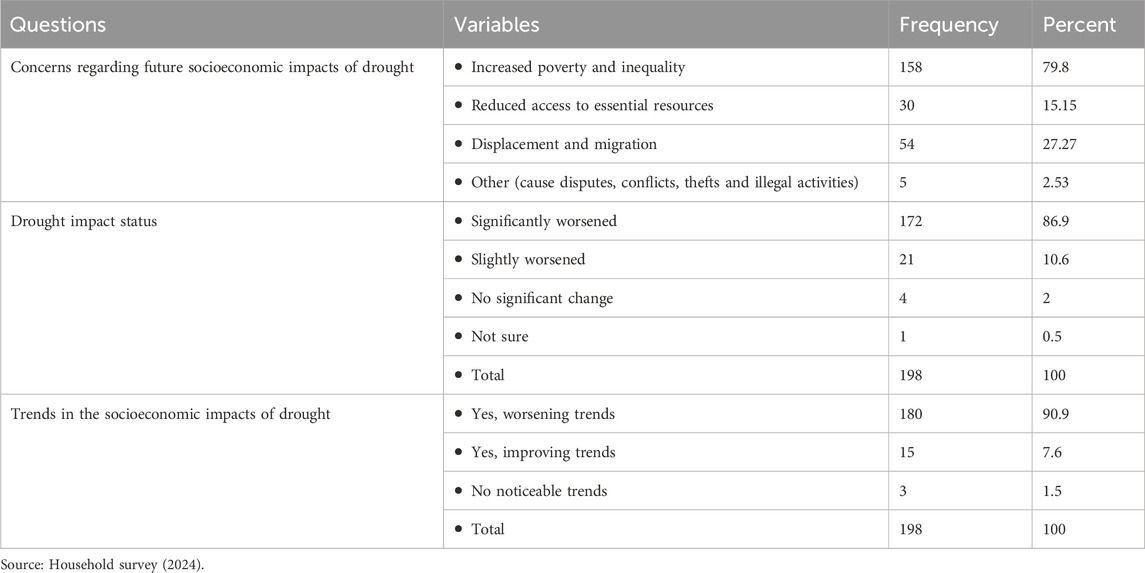
Based on Table 10, the results from the respondents indicate that the primary concerns regarding future socioeconomic impacts of drought in the local area have increased poverty and inequality, with 79.8% of the respondents mentioning it as a significant concern. This suggests that drought has the potential to exacerbate existing socioeconomic disparities and push more individuals and communities into poverty. This is supported by the results of (Yang et al., 2023; De Silva and Kawasaki, 2018; Nyamwaro et al., 2006). Additionally, 15.15% of the respondents expressed concerns about reduced access to essential resources, highlighting the potential impact on basic necessities such as water, food, and livelihood opportunities. Displacement and migration were identified as concerns by 27.27% of the respondents, indicating that drought may lead to population movements as people seek better living conditions or struggle to cope-with the impacts. A smaller portion of respondents (2.53%) mentioned other concerns related to disputes, conflicts, thefts, and illegal activities, implying that drought can contribute to social tensions and criminal activities in the affected areas (see Table 10).
Furthermore, the results in Table 10 indicated that drought has had a significant impact on the socioeconomic status of communities in the studied watershed. The majority of the respondents (86.9%) reported that drought has significantly worsened the socioeconomic conditions. This suggests that drought has caused substantial negative effects on various aspects of the local economy, including livelihoods, income, and overall wellbeing. A smaller proportion of the respondents (10.6%) mentioned that the impact was slightly worsened, indicating a less severe but still noticeable decline in socioeconomic conditions. Only a few respondents (2%), reported no significant change, suggesting that the majority of the affected communities experienced adverse effects due to drought. Additionally, a small percentage of respondents (0.5%) were unsure about the impact, indicating a need for further examination or information. This result is validated by the results from (Sinore and Wang, 2024; Orievulu et al., 2022; Personal and Archive, 2009; Edwards et al., 2008).
In question three of Table 10, the findings suggest that there have been noticeable long-term trends in the socioeconomic impacts of drought in the local area. The majority of the respondents (90.9%) reported worsening trends, indicating that the socioeconomic conditions have been deteriorating overtime due to the recurrent occurrence or persistent impact of drought. This implies that the negative effects of drought have accumulated, leading to long-lasting and increasingly challenging conditions for the affected communities. This strengthens the results of the various agricultural and meteorological drought indices results used in this research which they reflect that drought status is worsening from time to time. A smaller proportion of respondents (7.6%) mentioned improving trends, suggesting that some communities have managed to mitigate or adapt to the socioeconomic impacts of drought and have witnessed positive changes. However, this positive trend was less prevalent compared to the worsening trends. A very small portion of respondents (1.5%) reported no noticeable trends, indicating that the socioeconomic impacts of drought have remained relatively stable or inconsistent over the years, requiring further investigation or clarification.
3.2.6 Coping strategies and support programs in the study area
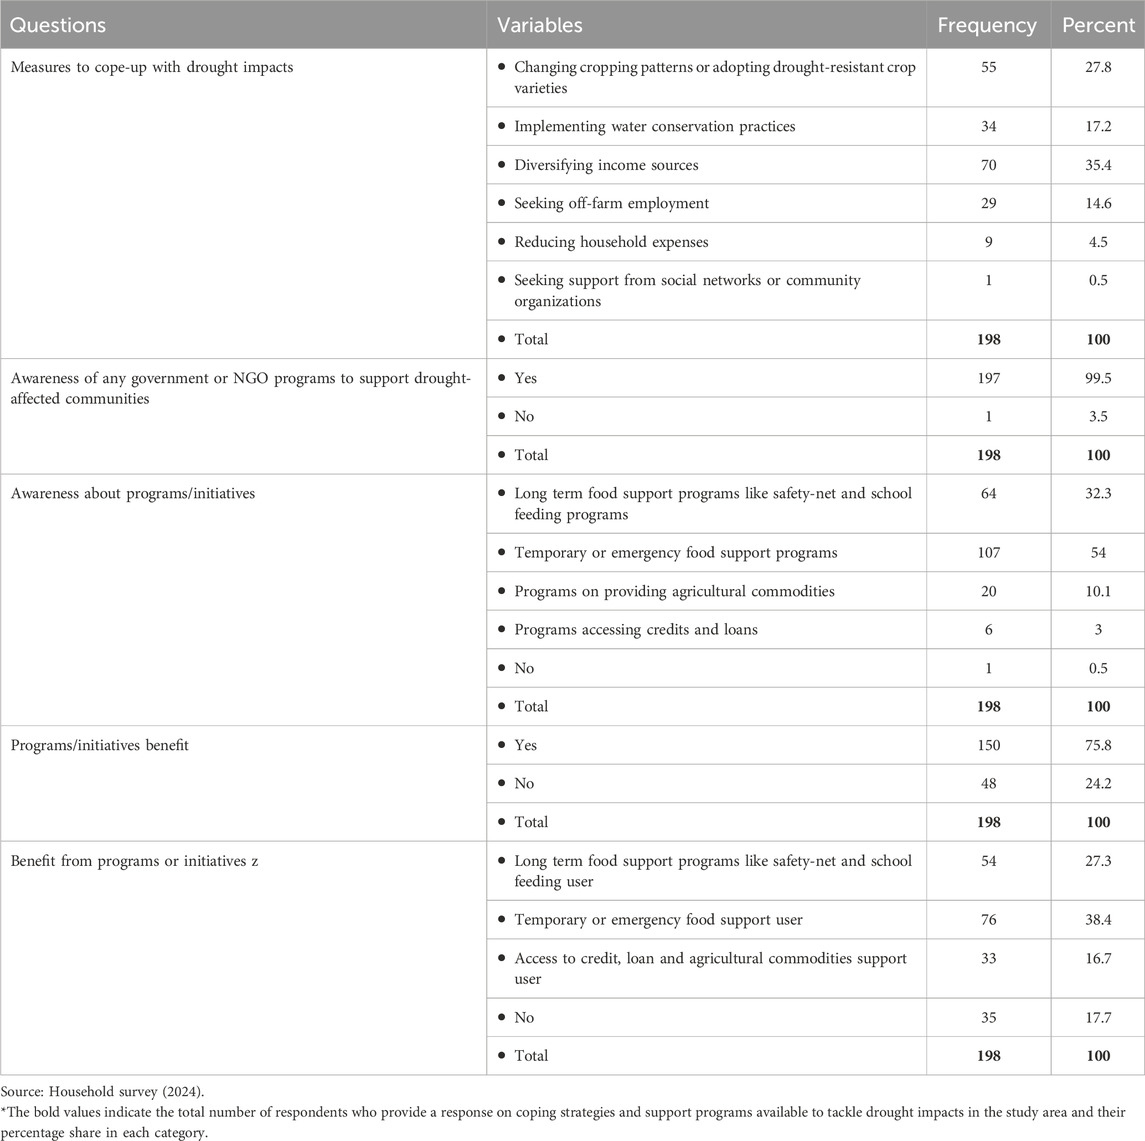
Table 11 presents the measures taken by respondents to cope with the impacts of drought. The most common response was diversifying income sources; means engaging in additional income sources such as irrigation, temporary daily labor, merchandise, etc., with 70 individuals (35.4%) indicating this strategy.
Changing cropping patterns or adopting drought-resistant crop varieties (such as teff, Finger millet, Sorghum, etc.) was mentioned by 55 respondents (27.8%), while 34 respondents (17.2%) reported implementing water conservation practices. Seeking off-farm employment was chosen by 29 individuals (14.6%), and reducing household expenses was the least frequently mentioned strategy, with only 9 respondents (4.5%) selecting this option. Only one respondent (0.5%) mentioned seeking support from social networks or community organizations (Table 11).
Table 11 also illustrates the respondents’ awareness of government or NGO programs to support drought-affected communities. The majority of respondents, 197 individuals (99.5%), reported being aware of such programs or initiatives. However, only 1 respondent (0.5%), indicated not being aware of any programs or initiatives in their local area. From the programs applied in the local area, the most frequently mentioned program was temporary or emergency food support programs, with 107 respondents (54%) indicating awareness of such initiatives. Long-term food support programs like safety-net and school feeding were mentioned by 64 individuals (32.3%). Programs focused on providing agricultural commodities were mentioned by 20 individuals (10.1%), whereas programs accessing for credits and loans were mentioned by 6 individuals (3%). Only one respondent (0.5%) did not mention any specific program or initiative.
Furthermore Table 11, displays the respondents’ reported benefit from government or NGO initiatives. Out of the total respondents, 150 individuals (75.8%) reported benefiting from these programs, while 48 respondents (24.2%) indicated not having received any benefits. Among the total respondents, 54 individuals (27.3%) reported benefiting from long-term food support programs like safety-net and school feeding initiatives. These programs have likely provided consistent access to food, particularly for vulnerable individuals and families. Temporary or emergency food support programs were mentioned by 76 individuals (38.4%), indicating that these initiatives have been instrumental in providing immediate relief during periods of acute food scarcity caused by drought. Access to credit, loans, and agricultural commodities support were reported by 33 respondents (16.7%), suggesting that these programs have enabled individuals to invest in agricultural activities and expand their income-generating opportunities. However, it is worth noting that 35 respondents (17.7%) did not specify any particular benefit from the mentioned initiatives. This finding highlights the need to further explore and address the gaps in assistance to ensure comprehensive support for all individuals affected by drought.
3.2.7 Government policies and mitigation measures in the study area
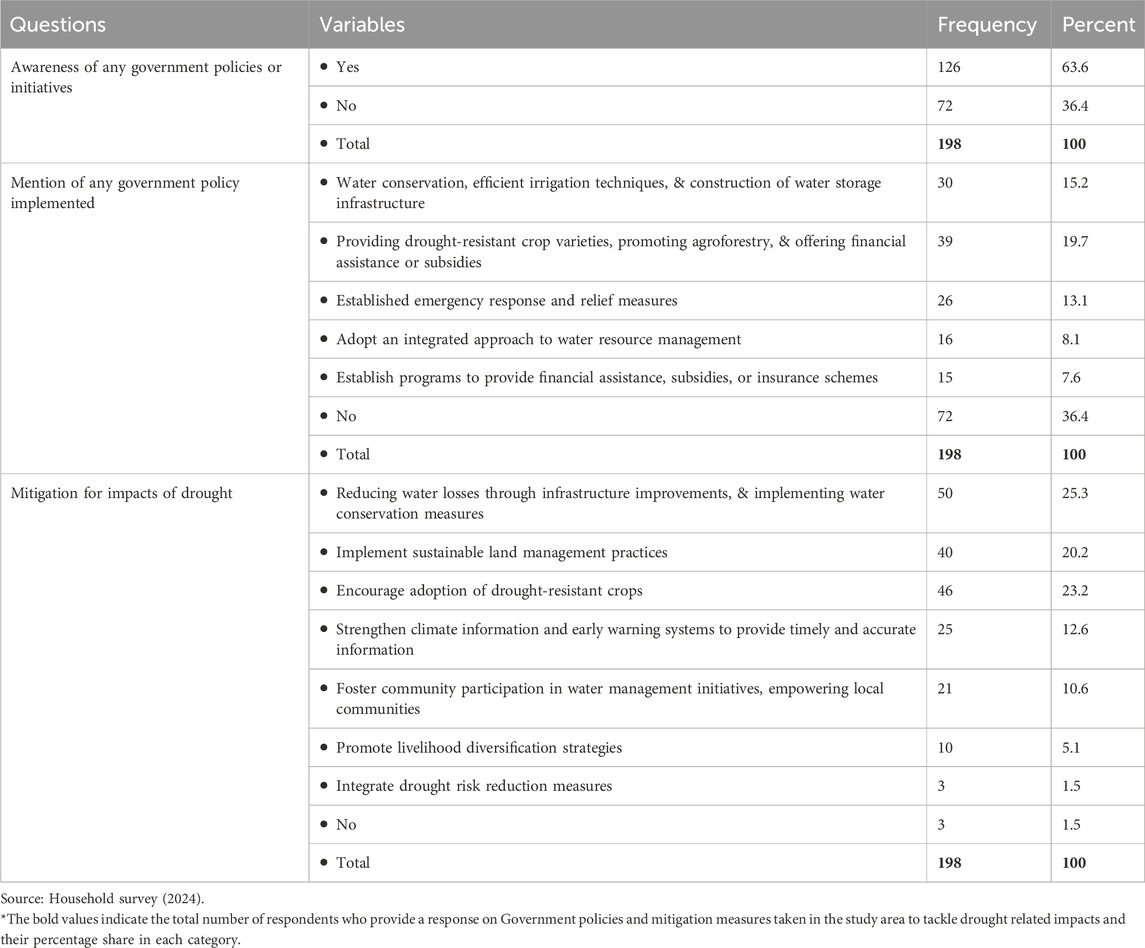
Table 12 illustrates the respondents’ awareness of government policies or initiatives aimed at reducing drought impacts in the local area. Out of the total respondents, 126 individuals (63.6%) reported being aware of such policies or initiatives, while 72 (36.4%) indicated not having knowledge of any government policies in place. Among the respondents, the most frequently mentioned policy was providing drought-resistant crop varieties, promoting agroforestry, and offering financial assistance or subsidies, with 39 individuals (19.7%) indicating awareness of these measures. Water conservation, efficient irrigation techniques, and the construction of water storage infrastructure were mentioned by 30 respondents (15.2%), while 26 individuals (13.1%) reported the presence of established emergency response and relief measures. Adopting an integrated approach to water resource management was mentioned by 16 individuals (8.1%), and 15 respondents (7.6%) mentioned the establishment of programs to provide financial assistance, subsidies, or insurance schemes. However, 72 respondents (36.4%) did not specify any particular government policy or initiative in place.
Table 12 additionally presents the measures suggested by respondents that can be taken to mitigate the impacts of drought in the study watershed. The most commonly mentioned measure was reducing water losses through infrastructure improvements and implementing water conservation measures, with 50 individuals (25.3%) advocating for these actions. Implementing sustainable land management practices was suggested by 40 respondents (20.2%), while 46 individuals (23.2%) emphasized the importance of encouraging the adoption of drought-resistant crop varieties. Strengthening climate information and early warning systems to provide timely and accurate information was mentioned by 25 individuals (12.6%), and 21 respondents (10.6%) highlighted the need for fostering community participation in water management initiatives and empowering local communities. Promoting livelihood diversification strategies was suggested by 10 individuals (5.1%). A small number of respondents (3 individuals, or 1.5%) mentioned integrating drought risk reduction measures whilst other 3 respondents did not provide any specific suggestions.
4 Conclusion
An assessment of meteorological and socioeconomic drought in the Tekeze watershed of northern Ethiopia was conducted through analysis of CHIRPS satellite data and a questionnaire survey of 198 households. The analysis reveals a consistent shortage of precipitation and the occurrence of severe drought conditions in most of the years investigated. Temporal analysis indicates a shortage of precipitation with specific years, including 2000, 2002, 2004, 2005, 2009, 2010, 2011, 2013, 2014, 2015, 2017, 2021, 2022, and 2023, experiencing varying severity levels of drought. The recurrence period was approximately 2 years, exacerbating drought conditions over time. However, the most severe drought was recorded in 2015. Spatially, in 2002, 2004, and 2005, 2008–09, 2013–15, 2019–20, and 2023 about 70%–100% of the study area has been affected by meteorological droughts and associated socioeconomic drought conditions. From these, six of the twelve drought years were totally (100%) affected by such recurrent droughts.
The socioeconomic consequences of drought in area are wide-ranging, affecting individuals, communities, and economic activities. The results of the socioeconomic drought impacts align with the results of meteorological droughts, where 99.5% of respondents reported that they personally experienced drought. The major causes reported include climatic variability, land use changes, and mismanagement of resources, etc. The consequences of droughts encompass various issues such as disease expansion, death of humans and animals, displacement, crop damage, and economic conflicts. With the aim to deter such impacts and related consequences, various mitigation measures have been implemented by the government and NGOs in the study areas. The major ones are applying efficient irrigation techniques, construction of water storage infrastructures, providing drought-resistant crop varieties, promoting agroforestry, offering financial assistance or subsidies, establishing emergency response and relief measures. Nonetheless, these mitigation measures have not effectively addressed the visible challenges. Therefore, it is crucial to prioritize the correct and enhanced implementation of mitigation measures and other adaptation strategies by the government and NGOs to tackle the adverse effects of drought and promote long-term sustainability in the region. Therefore, the study recommend sustainable water management practices, promote efficient land conservation techniques, advocate drought-resistant agriculture, encourage community participation, strengthen early warning systems, increase public awareness, and foster collaboration to address the issues related to drought and mitigate the observed agricultural and socioeconomic impacts of droughts in the Tekeze watershed.
The findings underscore the critical need for effective drought mitigation strategies by revealing the profound socioeconomic repercussions of drought on communities, economies, and individuals, which are exacerbated by factors such as climatic variability and resource mismanagement. By aligning the impacts of meteorological and socioeconomic droughts and highlighting the gaps in current mitigation efforts, this research contributes valuable insights to the literature, advocating for an integrated approach that encompasses sustainable water management, community engagement, and enhanced public awareness to foster resilience in drought-affected regions.
Data availability statement
The raw data supporting the conclusions of this article will be made available by the authors, without undue reservation.
Ethics statement
Ethical review and approval was not required for the study on human participants in accordance with the local legislation and institutional requirements. Written informed consent from the (patients/participants OR patients/participants legal guardian/next of kin) was not required to participate in this study in accordance with the national legislation and the institutional requirements.
Author contributions
YT: Conceptualization, Data curation, Formal Analysis, Investigation, Methodology, Resources, Software, Validation, Visualization, Writing–original draft, Writing–review and editing. SW: Conceptualization, Data curation, Methodology, Supervision, Validation, Writing–review and editing. MF: Conceptualization, Resources, Supervision, Validation, Visualization, Writing–review and editing.
Funding
The author(s) declare that no financial support was received for the research, authorship, and/or publication of this article.
Acknowledgments
Great thanks to Ethiopian meteorological agency for providing station recorded precipitation data. We also thank to CHIRPS data repository for providing the CHIRPS dataset and also thanks for all individual households for participating during the collection of the socioeconomic survey data.
Conflict of interest
The authors declare that the research was conducted in the absence of any commercial or financial relationships that could be construed as a potential conflict of interest.
Generative AI statement
The author(s) declare that no Generative AI was used in the creation of this manuscript.
Publisher’s note
All claims expressed in this article are solely those of the authors and do not necessarily represent those of their affiliated organizations, or those of the publisher, the editors and the reviewers. Any product that may be evaluated in this article, or claim that may be made by its manufacturer, is not guaranteed or endorsed by the publisher.
Footnotes
1 Kebele is smallest administration unit in Ethiopia.
References
Abate, T. (2016). Food insecurity and coping mechanisms under changing climate in Guji pastoral areas of south Ethiopia. Am. J. Agric. Environ. Sci. 16 (11), 1737–1749. doi:10.5829/idosi.aejaes.2016.1737.1749
Abdela, U. (2024). Assessment of community-driven drought risk management strategies in pastoral and agro-pastoral district of Bale zones south east Ethiopia. Front. Environ. Sci. 12, 1–18. doi:10.3389/fenvs.2024.1411138
Alemu, B. (2015). The effect of land use land cover change on land degradation in the highlands of Ethiopia. J. Environ. Earth Sci. 5 (5), 1–13. Available at: www.iiste.org ISSN 2225-0948.
Araya, A., and Stroosnijder, L. (2011). Assessing drought risk and irrigation need in northern Ethiopia. Agric For Meteorol 151 (4), 425–436. doi:10.1016/j.agrformet.2010.11.014
Awoke, W., Eniyew, K., and Meseret, B. (2022). Analysis of causes and coping strategies of food insecurity: the case of central and North gondar zone, Ethiopia. Int. J. Rural. Manag. 18 (3), 429–448. doi:10.1177/09730052211035296
Bahiru, A., Senapathy, M., and Bojago, E. (2023). Status of household food security, its determinants, and coping strategies in the Humbo district, Southern Ethiopia. J. Agric. Food Res. 11 (October 2022), 100461. doi:10.1016/j.jafr.2022.100461
Baptista, D., Farid, M., Fayad, D., Kemoe, L., Lanci, L., Mitra, P., et al. (2022). Climate change and chronic food insecurity in sub-saharan Africa. Dep. Pap. 2022, 1. doi:10.5089/9798400218507.087
Bazie, F., and Bantigegn, S. (2024). Rainfall trends and spatiotemporal patterns of meteorological drought in Menna watershed, northwestern Ethiopia. Heliyon 10 (6), e27919. doi:10.1016/j.heliyon.2024.e27919
Bhowmick, P., Mukhopadhyay, S., and Sivakumar, V. (2014). A review on GIS based Fuzzy and Boolean logic modelling approach to identify the suitable sites for Artificial Recharge of Groundwater. Sch. J. Eng. Technol. 2 (SJET), 316–319. Available at: www.saspublisher.com.
Birhanu Gedif, A., and Karuturi Venkata Suryabhagavan, S. A. (2014). (PDF) drought risk assessment using remote sensing and GIS: the case of Southern zone, Tigray region, Ethiopia. J. Nat. Sci. Res. 4. Available at: https://www.researchgate.net/publication/270584806_Drought_Risk_Assessment_using_Remote_Sensing_and_GIS_The_Case_of_Southern_Zone_Tigray_Region_Ethiopia.
Bogale, G. A., and Erena, Z. B. (2022). Drought vulnerability and impacts of climate change on livestock production and productivity in different agro-Ecological zones of Ethiopia. J. Appl. Anim. Res. 50 (1), 471–489. doi:10.1080/09712119.2022.2103563
Chere, Z., Abegaz, A., Tamene, L., and Abera, W. (2022). Modeling and mapping the spatiotemporal variation in agricultural drought based on a satellite-derived vegetation health index across the highlands of Ethiopia. Model Earth Syst. Environ. 8 (4), 4539–4552. doi:10.1007/s40808-022-01439-x
De Silva, MMGT, and Kawasaki, A. (2018). Socioeconomic vulnerability to disaster risk: a case study of flood and drought impact in a rural Sri Lankan community. Ecol. Econ. 152, 131–140. doi:10.1016/j.ecolecon.2018.05.010
Dinku, T. (2019). Challenges with availability and quality of climate data in Africa. Extrem Hydrol. Clim. Var. Monit. Model Adapt Mitig., 71–80. doi:10.1016/b978-0-12-815998-9.00007-5
Edwards, B. M., Gray, A., and Hunter, B. (2008). The social and economic impacts of climate change. Dev. Pract. Child. Youth Fam. Work J. (21), 15.
Enyew, B. (2024). Agro-meteorological drought monitoring using geospatial technology: the case of Menna watershed, northwestern ethiopi.
Enyew, F. B., and Wassie, S. B. (2024). Rainfall trends and spatiotemporal patterns of meteorological drought in Menna watershed, northwestern Ethiopia. Heliyon 10 (6), e27919. doi:10.1016/j.heliyon.2024.e27919
Fentaw, A. E., Yimer, A. A., and Zeleke, G. A. (2023). Monitoring spatio-temporal drought dynamics using multiple indices in the dry land of the upper Tekeze Basin, Ethiopia. Environ. Challenges 13, 100781. doi:10.1016/j.envc.2023.100781
FEWSNet. Food insecurity remains elevated in several areas, despite improvement in parts of the Horn. 2020.
Garrido, A. (2014). Socio-economic impacts of droughts and economic instruments. Natl. Capacit. Dev. Train. Trainers Work Dev. Implement Mitig. Prep. Water Scarcity Drought Manag. Plans. Available at: https://sustainabledevelopment.un.org/content/documents/384704.Garrido__SocioEconomicsImpactsDrought.pdf.
Gebre, E., Berhan, G., Lelago, A., Change, C., and Ababa, A. (2017). “Application of remote sensing and GIS to characterize agricultural drought conditions in North Wollo zone, Amhara regional state,”. Ethiopia, 41–50.
Gebremedhin Gebremeskel, Q. T., Sun, S., Huang, Z., Zhang, X. A., and Liu, X. (2019). Droughts in east Africa: causes, impacts and resilience gebremedhin. Adv. Drug Deliv. Rev. doi:10.1016/j.addr.2019.08.007
Gebremicael, T. G., Mohamed, Y. A., Zaag, P. V., and Hagos, E. Y. (2017). Temporal and spatial changes of rainfall and streamflow in the Upper Tekezē-Atbara river basin, Ethiopia. Hydrol. Earth Syst. Sci. 21 (4), 2127–2142. doi:10.5194/hess-21-2127-2017
Gonfa, L. H. (1996). Climate classification of Ethiopia. Natl. Meteorol. Serv. Agency (NMA), Ethiop. 1996.
Guttman, N. B. (1998). Comparing the palmer drought index and the standardized precipitation index1. J. Am. Water Resour. Assoc. 34 (1), 113–121. doi:10.1111/j.1752-1688.1998.tb05964.x
Hennessy, K., Fawcett, R., Kirono, D., Mpelasoka, F., Jonesb, D., Bathols, J., et al. (2008). “An assessment of the impact of climate change on the nature and frequency of exceptional climatic events,” in Report by climate and ocean services bureau of meteorology, CSIRO climate adaptation flagship and drought policy review climate change division depar.
Hermans, K., and Garbe, L. (2019). Droughts, livelihoods, and human migration in northern Ethiopia. Reg. Environ. Chang. 19 (4), 1101–1111. doi:10.1007/s10113-019-01473-z
Hussein, A. (2023). Impacts of land use and land cover change on vegetation diversity of tropical highland in Ethiopia. Appl. Environ. Soil Sci. 2023, 1–11. doi:10.1155/2023/2531241
IPC. East & Horn of Africa (2020). IPC food security phase classification and desert locusts | 12 february 2020 key.
Kemal, K. (2024). Characterize of drought events via the decile. SPI RDI Southeast Ethiop., 1–17. doi:10.21203/rs.3.rs-5111418/v1
Kheyruri, Y., Sharafati, A., and Neshat, A. (2023). The socioeconomic impact of severe droughts on agricultural lands over different provinces of Iran. Agric. Water Manag. 289 (September), 108550. doi:10.1016/j.agwat.2023.108550
Liu, S., Shi, H., and Sivakumar, B. (2020). Socioeconomic drought under growing population and changing climate: a new index considering the resilience of a regional water resources system. J. Geophys Res. Atmos. 125 (15). doi:10.1029/2020jd033005
Lloyd-Hughes, B., and Saunders, M. A. (2002). A drought climatology for Europe. Int. J. Climatol. A J R Meteorol Soc. 22 (1), 1571–1592. doi:10.1002/joc.846
Mashala, M. J., Dube, T., Ayisi, K. K., and Ramudzuli, M. R. (2023). Using the Google Earth Engine cloud-computing platform to assess the long-term spatial temporal dynamics of land use and land cover within the Letaba watershed, South Africa. Geocarto Int. 38 (1). doi:10.1080/10106049.2023.2252781Available from
Mckee, T. B., Doesken, N. J., and Kleist, J. (1993). “The relationship of drought frequency and duration to time scales,” in Proceedings of the 8th conference on applied climatology (CO: Department of Atmospheric Science Colorado State University Fort Collins), 179–184.
Mekonnen, Y., and Gökçekuş, H. (2020). Causes and effects of drought in northern parts of Ethiopia. Civ. Environ. Res.
Mekuriaw, Z. A., and Harris-Coble, L. (2017). Ethiopia’s livestock systems overview and areas of inquiry. USAID Bur. Food Secur 107 (2), 27–51.
Menna, B. Y., Mesfin, H. S., Gebrekidan, A. G., Siyum, Z. G., and Tegene, M. T. (2022). Meteorological drought analysis using copula theory for the case of upper Tekeze river basin, Northern Ethiopia. Theor. Appl. Climatol. 149 (1–2), 621–638. doi:10.1007/s00704-022-04061-0
Miheretu, B. A., and Yimer, A. A. (2018). Land use/land cover changes and their environmental implications in the Gelana sub-watershed of Northern highlands of Ethiopia. Environ. Syst. Res. 6 (1), 7. doi:10.1186/s40068-017-0084-7
Mohsin, A. (2016). A manual for selecting sampling techniques in research. University of Karachi, Iqra. Munich Pers RePEC Arch: University, 1–56.
Montesinos López, O. A., Montesinos López, A., and Crossa, J. (2022). Multivariate statistical machine learning methods for genomic prediction. Multivar. Stat. Mach. Learn. Methods Genomic Predict. doi:10.1007/978-3-030-89010-0
Morgan, H. (2012). Water in Ethiopia:Drought,Disease and death. Glob. Major E-Journal. 3 (2), 110–120.
Nasir, J., Assefa, E., Zeleke, T., and Gidey, E. (2021). Meteorological drought in northwestern escarpment of Ethiopian Rift Valley: detection seasonal and spatial trends. Environ. Syst. Res. 10 (1), 16. doi:10.1186/s40068-021-00219-3
Nyamwaro, S. O., Notenbaert, A., and Watson, D. J. (2006). Assessment of the impacts of the drought response program in the provision of emergency livestock and water interventions in preserving pastoral livelihoods in Kenya.
Olaleye, O. L. (2010). Drought coping mechanisms: a case study of small scale farmers in motheo district of the free state province, 9. University of South Africa.
Orievulu, K., Ayeb-Karlsson, S., Ngwenya, N., Ngema, S., McGregor, H., Adeagbo, O., et al. (2022). Economic, social and demographic impacts of drought on treatment adherence among people living with HIV in rural South Africa: a qualitative analysis. Clim. Risk Manag. 36, 100423. doi:10.1016/j.crm.2022.100423
Personal, M., and Archive, R. (2021). Munich Personal RePEc Archive the impact of drought on household vulnerability: the case of rural Malawi.
Rahman, A., and Muktadir, M. G. (2021). SPSS: an imperative quantitative data analysis tool for social science research. Int. J. Res. Innov. Soc. Sci. 05 (10), 300–302. doi:10.47772/ijriss.2021.51012
Raza, A., Maqbool, S., Safdar, M., Ali, H., Ullah, I., Akbar, A., et al. (2024). Python-Powered remote sensing data. Geospatial Appl. Dev. Using Python Program., 62–93. doi:10.4018/979-8-3693-1754-9.ch003
Sadiq, M. A., Sarkar, S. K., and Raisa, S. S. (2023). Meteorological drought assessment in northern Bangladesh: a machine learning-based approach considering remote sensing indices. Ecol. Indic. 157, 111233. doi:10.1016/j.ecolind.2023.111233
Senamaw, A., Addisu, S., and Suryabhagavan, K. V. (2021). Mapping the spatial and temporal variation of agricultural and meteorological drought using geospatial techniques, Ethiopia. Environ. Syst. Res. 10 (1), 15. doi:10.1186/s40068-020-00204-2
Shahid, M., Rahman, K. U., Haider, S., Gabriel, H. F., Khan, A. J., Pham, Q. B., et al. (2021). Assessing the potential and hydrological usefulness of the CHIRPS precipitation dataset over a complex topography in Pakistan. Hydrol. Sci. J. 66 (11), 1664–1684. doi:10.1080/02626667.2021.1957476
Sinore, T., and Wang, F. (2024). Impact of climate change on agriculture and adaptation strategies in Ethiopia: a meta-analysis. Heliyon 10 (4), e26103. doi:10.1016/j.heliyon.2024.e26103
Suryabhagavan, K. V. (2017). GIS-based climate variability and drought characterization in Ethiopia over three decades. Weather Clim. Extrem 15 (November 2016), 11–23. doi:10.1016/j.wace.2016.11.005
Taherdoost, H., Business, H., Sdn, S., Group, C., and Lumpur, K. (2016). Sampling methods in research methodology; how to choose a sampling technique for. Int. J. Acad. Res. Manag. 5 (2), 18–27.
Terry, K., and Rai, A. (2023). Amid record drought and food insecurity, east africa’s protracted humanitarian crisis worsens. Migr. Inf. Source (MPI). Available at: https://www.migrationpolicy.org/article/east-africa-drought-food-insecurity-refugees#
Tesfaw, B. A., Dzwairo, B., and Sahlu, D. (2023). Assessments of the impacts of land use/land cover change on water resources: Tana Sub-Basin, Ethiopia. J. Water Clim. Chang. 14 (2), 421–441. doi:10.2166/wcc.2023.303
Tesfay, Y. (2024). Analyzing the spatiotemporal dynamics of agrometrological and socio-economic droughts using geo-spatial techniques: the case of Tekeze watershad, northern Ethiopia. Bahir Dar University. Available at: http://ir.bdu.edu.et/handle/123456789/15972
UNDP. Crisis, Resilience and opportunity: poverty, human development, and the macro-economy in Ethiopia, 2020-23. 2022;(1).
UNFPA (2023). Unfpa Ethiopia humanitarian response. Available at: https://reliefweb.int/sites/reliefweb.int/files/resources/ethiopia_drought_update_march_2022.pdf%0Ahttp://ethiopia.unfpa.org.
United Nations (2023). Global Drought Snapshot 2023 | the need for proactive action. Available at: www.unccd.int.
United Nations Convention to Combat Desertification (2023). Convention to Combat desertification. Berks. Encycl. Sustain. 3/10, 101–104. doi:10.2307/jj.9561408.33
Velastegui-Montoya, A., Montalván-Burbano, N., Carrión-Mero, P., Rivera-Torres, H., Sadeck, L., and Adami, M. (2023). Google Earth engine: a global analysis and future trends. Remote Sens. 15 (14), 3675. doi:10.3390/rs15143675
Wassie, S. B. (2020). Natural resource degradation tendencies in Ethiopia: a review. Environ. Syst. Res. 9 (1), 33–29. doi:10.1186/s40068-020-00194-1
Wassie, S. B., Mengistu, D. A., and Birlie, A. B. (2022a). Agricultural drought assessment and monitoring using MODIS-based multiple indices: the case of North Wollo, Ethiopia. Environ. Monit. Assess. 194 (10), 787. doi:10.1007/s10661-022-10455-4
Wassie, S. B., Mengistu, D. A. A., and Berlie, A. B. (2022b). Trends and spatiotemporal patterns of meteorological drought incidence in North Wollo, northeastern highlands of Ethiopia. Arab. J. Geosci. 15 (12), 1–21. doi:10.1007/s12517-022-10423-9
Welde, K., and Gebremariam, B. (2017). Effect of land use land cover dynamics on hydrological response of watershed: case study of Tekeze Dam watershed, northern Ethiopia. Int. Soil Water Conserv. Res. 5 (1), 1–16. doi:10.1016/j.iswcr.2017.03.002
WFP (2023). Regional drought for the Horn of Africa. Available at: https://reliefweb.int/report/ethiopia/wfp-regional-drought-response-plan-horn-africa-january-december-2023.
White, D. A., and Glantz, M. H. (1985). Understand drought phenomenon: role of definitions. Water Int.
World Vision. East Africa hunger emergency response situation report #20 | december 2022 World. 2023.
Wubet, A., Assefa, A., and Girmay, G. (2019). Major resource bases and constraints for development of waghemira zone: a short synopsis. ResearchGate. doi:10.1016/j.envc.2023.100781
Yang, X., Liao, X., Di, D., and Shi, W. (2023). A review of drought disturbance on socioeconomic development. Water (Switzerland) 15 (22), 3912. doi:10.3390/w15223912
Yohannes, A. W., Cotter, M., Kelboro, G., and Dessalegn, W. (2018). Land use and land cover changes and their effects on the landscape of Abaya-Chamo basin, Southern Ethiopia. Land 7 (1), 2. doi:10.3390/land7010002
Zeleke, E. B., Melesse, A. M., and Kidanewold, B. B. (2022). Assessment of climate and catchment control on drought propagation in the Tekeze River basin, Ethiopia. Water (Switzerland) 14 (10), 1564. doi:10.3390/w14101564
Zenebe, M., Birhane, E., Teka, K., Haile, M., Tadesse, T., and Taye, G. (2024). Traditional gold mining in the highlands of Ethiopia: its effect on soil loss and possible reclamation measures. J. Degrad. Min. Lands Manag. 11 (3), 5565–5574. doi:10.15243/jdmlm.2024.113.5565
Keywords: meteorological drought, socioeconomic drought, temporal trends, mitigation measures, Tekeze watershed, Ethiopia
Citation: Tela YT, Wassie SB and Ferede MB (2024) Assessment of meteorological and socioeconomic drought conditions in the Tekeze watershed, northern Ethiopia. Front. Environ. Sci. 12:1506883. doi: 10.3389/fenvs.2024.1506883
Received: 06 October 2024; Accepted: 03 December 2024;
Published: 18 December 2024.
Edited by:
Erhan Sener, Süleyman Demirel University, TürkiyeReviewed by:
Muhammad Shahid, Brunel University London, United KingdomÖzlem Terzi, Isparta University of Applied Sciences, Türkiye
Copyright © 2024 Tela, Wassie and Ferede. This is an open-access article distributed under the terms of the Creative Commons Attribution License (CC BY). The use, distribution or reproduction in other forums is permitted, provided the original author(s) and the copyright owner(s) are credited and that the original publication in this journal is cited, in accordance with accepted academic practice. No use, distribution or reproduction is permitted which does not comply with these terms.
*Correspondence: Yonas Tesfay Tela, dGVzZmF5eW9uYXMyN0BnbWFpbC5jb20=
 Yonas Tesfay Tela
 Simachew Bantigegn Wassie
 Mehrete Belay Ferede