- School of Economics and Management, China University of Geosciences, Wuhan, China
The Chinese government has proposed shifting the regulation of energy consumption and intensity towards a dual control system of total carbon emissions and carbon emission intensity gradually, aiming to promote the continued role of green finance in optimizing resource allocation. To reveal the impact and mechanism of green finance on urban carbon emissions and intensity in China, this paper constructs a general equilibrium model based on endogenous growth theory and employs a two-way fixed effects model for empirical testing. The study finds that: (1) The development of green finance significantly inhibits both the total carbon emissions and carbon emission intensity of Chinese cities. (2) The impact of green finance on urban carbon emissions and intensity exhibits significant regional heterogeneity. In the northeastern regions of China, southeastern regions of the Hu Line, non-resource-based cities, and areas with higher financial efficiency, green finance can significantly reduce both urban carbon emissions and carbon emission intensity. However, in central and western regions and resource-based cities, green finance only suppresses urban carbon emission intensity. (3) Green finance can reduce urban carbon emissions and intensity through two channels: economic scale expansion and technological advancement, while the channel of industrial structure optimization has not yet shown a significant effect. Through research, it can be found that balancing the differences in green finance and carbon emission functions across regions, while fully optimizing the use and allocation mechanisms of resource elements from aspects such as technological innovation, environmental protection, and energy conservation, can enhance the quality and efficiency of economic development. This is of significant importance for green finance in promoting the realization of dual carbon control.
1 Introduction
Climate change is a common challenge faced by all of humanity. The continuous increase in greenhouse gas emissions has negative impacts on agricultural production, socio-economic activities, and human life, hindering the process of global sustainable development (Wang J. et al., 2022). To address the pressing issue of climate change, an array of nations collaboratively signed the “Kyoto Protocol” in 1972, representing one of the seminal international efforts aimed at curtailing greenhouse gas emissions. Since this landmark accord, a number of countries have systematically enacted policies to mitigate greenhouse gas emissions. For instance, Sweden and Canada have introduced carbon taxes to elevate the costs associated with fossil fuel consumption, thereby incentivizing reductions in usage. Meanwhile, the United States has fostered growth in the renewable energy sector, particularly solar and wind energy, through mechanisms such as investment tax credits and production tax credits. These strategic measures underscore the multifaceted approach required at both national and international levels to tackle environmental challenges. As the world’s largest carbon-emitting country, China not only bears the responsibility of reducing carbon emissions but is also constantly exploring new pathways for green development. In October 2021, China committed to reaching peak carbon emissions by 2030 and achieving carbon neutrality by 2060. To better achieve the “carbon peak and carbon neutrality” goals, the Chinese government issued the “Opinions on Gradually Shifting from Dual Control of Energy Consumption to Dual Control of Carbon Emissions” in July 2023. This policy proposed a strategic direction focused on carbon reduction, shifting the regulation of total energy consumption and intensity towards a system of dual control over total carbon emissions and carbon emission intensity, referred to as the dual control system for carbon emissions1. It is foreseeable that under the guidance of this system, China’s green economy will develop and transform, further enhancing the importance of market-based emission reduction policy tools such as green finance and carbon finance. The reason for this is that green finance can influence the new market equilibrium in two ways: first, by creating new drivers of development that direct capital into the green, low-carbon, and circular economy sectors; and second, by overcoming environmental and climate risks, gradually diverting capital away from traditional high-energy-consuming and high-emission sectors.
Given the important role of green finance, the Chinese government has, in recent years, been committed to continuously improving the institutional framework for green, low-carbon development and green finance, forming financial policy arrangements that match the dual control of carbon emission intensity and total volume. So, at the urban spatial scale, can green finance effectively curb both carbon emissions and intensity? What is its mechanism of action? Furthermore, given the significant differences in resource endowments, environmental capacity, industrial base, and innovation capabilities between different regions of China, will the impact of green finance on urban carbon emissions and intensity exhibit regional heterogeneity? To answer these questions, this paper constructs a comprehensive theoretical analysis framework to explore the mechanisms by which green finance affects urban carbon emissions and intensity, using relevant data from 260 Chinese cities from 2010 to 2022 and employing two-way fixed effects model. to test the effects of green finance on urban carbon emissions and intensity.
Over the past 20 years, extensive research has been conducted on the drivers of carbon emissions, focusing primarily on micro-level factors such as technological progress (Okushima and Tamura, 2010; Chen et al., 2020), energy efficiency (Zhang et al., 2018), carbon taxes (Mardones and Flores, 2018; Barrage, 2020). Additionally, macro-level and policy factors such as economic growth (Wu et al., 2019), urbanization (Sun and Zeng, 2023; Zhou et al., 2021), and carbon emission trading policies (Xuan et al., 2020; Zhang et al., 2020; Dong et al., 2022) have been widely studied. In recent years, the impact of finance, particularly green finance, on carbon emissions has become a hot topic in academic research.
Early studies mainly focused on the relationship between financial development and environmental pollution or energy consumption. Some scholars argue that financial development exacerbates environmental pollution by relaxing borrowing constraints for households and enterprises, leading to increased consumption, investment, and thus energy consumption and pollution emissions—a phenomenon known as the scale effect (Sadorsky, 2010; Abbasi and Riaz, 2016). On the other hand, some scholars believe that financial development can promote environmental improvement. One explanation is that financial development can provide funding for clean and environmentally friendly production technologies, thus achieving pollution control through the technology effect. Another explanation is that financial institutions can guide market development by responding negatively to polluting enterprises and by publicly supporting environmentally friendly practices (Tamazian et al., 2009; Bekhet et al., 2017).
With the development of environmental concepts and the emergence of green finance, scholars have begun to explore the relationship between green finance and carbon reduction. Some argue that the core of green finance development is to establish an incentive mechanism that reallocates external funds based on corporate pollution levels, thereby internalizing the negative externalities of environmental pollution (Xing et al., 2021). Green finance can restrict the expansion of polluting enterprises through punitive high-interest rates (Fan et al., 2021). Moreover, green finance can help enterprises overcome financial barriers associated with investing in environmental protection and procuring new energy raw materials (Lan et al., 2023), driving capital from high-pollution industries to low-pollution industries by restricting financing for high-pollution enterprises and supporting environmentally friendly ones, thereby achieving industrial carbon reduction. However, some scholars believe that the impact of green finance on carbon emissions is insignificant. For instance, Yu et al. (2021), using a sample of Chinese listed companies from 2001–2017, explored the impact of financing constraints and green finance policies on green innovation. Their findings suggest that green finance policies do not effectively alleviate financing constraints to benefit private enterprises, thereby limiting their green innovation capacity and failing to promote carbon reduction. Building on this, Zhang et al. (2021) used data from 30 Chinese provinces from 2007–2016 and employed a difference-in-differences model to examine the impact of green credit policies on carbon emissions. They found that the carbon reduction effects of green credit policies were not significant in non-resource-based cities.
The impact of heterogeneous green financial instruments on carbon emissions is a major focus of current research, with studies concentrating on two main aspects: green credit and green bonds. In terms of green credit, unlike command-and-control regulatory approaches, green credit relies on market mechanisms to address environmental issues (Lv et al., 2023). It achieves targeted effects through its capital allocation function, guiding societal funds towards environmentally friendly enterprises, increasing financing constraints for high-pollution companies, and thereby raising the proportion of green capital in the market, which reduces pollution from social production (Wen et al., 2021). The carbon reduction effects of green credit are primarily channeled through promoting green technology innovation (Tan et al., 2022) and industrial structure transformation (Xu et al., 2018).
Regarding green bonds, as a new financing tool, one of their main objectives is sustainable climate change management. In addition to their general financing attributes (Flammer, 2021), green bonds have a potential advantage over traditional bonds because they are backed by environmental assets like forests or wetlands, rather than just capital assets. This attracts more environmentally conscious investors (Zhang et al., 2022). In practice, green bonds promote carbon reduction either directly through environmental investment mechanisms and social attention mechanisms, or indirectly by fostering corporate green innovation (Wang T. et al., 2022; Lian et al., 2024).
In summary, while existing literature has extensively discussed the carbon reduction effects of green finance, the focus has largely been on specific types of green financial tools, and the research samples have mainly been at the provincial and corporate levels. There is a lack of direct exploration of the carbon reduction effects of green finance at the city level. To address these research gaps, this paper constructs a general equilibrium model based on endogenous growth theory and uses a two-way fixed effects model to verify the impact of green finance on urban carbon emissions and intensity. Furthermore, it explores the heterogeneity of these effects and possible mechanisms, employs various methods to test the robustness of the results, eliminates endogenous interference, and provides more robust empirical evidence for the proposed theoretical hypotheses, confirming the impact of China’s green finance development on urban carbon emissions and intensity, and clarifying the pathways through which these effects are realized.
The possible marginal contributions of this paper are threefold. First, it defines a unified theoretical analysis framework by constructing a general equilibrium model that encompasses four sectors: environment, households, production, and green finance. This model theoretically elucidates the effects and mechanisms of green finance on urban carbon emissions and intensity. Second, at the urban spatial scale, the paper empirically validates the impact of green finance on the carbon emissions and intensity of Chinese cities, as well as their regional heterogeneity, using a two-way fixed effects model, thereby filling a research gap at the urban level. Third, based on the “scale-structure-technology” theoretical analysis framework, the paper reveals how green finance influences urban carbon emissions and intensity through its effects on economic scale, industrial structure, and technological progress.
The remainder of the paper is organized as follows: Section 2 reviews the relevant literature; Section 3 establishes the theoretical analysis framework and proposes the research hypotheses; Section 4 introduces the research models and variable selection; Section 5 presents the empirical analysis; and Section 6 provides the conclusions and implications.
2 Theoretical model and research hypotheses
Direct Impact of Green Finance on Urban Carbon Emissions and Intensity.
To explore the impact of green finance on urban carbon emissions and intensity, this study integrates a multi-sector general equilibrium model with endogenous growth theory, inspired by the approaches of Bovenberg and Lans (1995), and Qi (2023). This integration introduces a green finance sector and technological progress in polluting enterprises to construct a new theoretical analysis model.
2.1 Environment
The fundamental goal of developing green finance is to manage urban environmental pollution. Therefore, this study incorporates an environmental sector into the general equilibrium theory model. The level of environmental quality is adapted from Bovenberg and Lans (1995) and is primarily influenced by two factors: environmental restoration capacity and environmental degradation. The expression is shown as follows in Equation 1:
In the above model,
The variable
2.2 Household sector
Urban consumers have a preference for a high-quality environment, which is represented in the model Equation 3:
Let
The utility function, with respect to the deviation
2.3 Green finance sector
For environmental protection purposes, the green finance sector provides different amounts of funding and interest rates to urban polluting enterprises and green enterprises. Specifically, it provides funding
In addition, let
Assuming the green finance sector earns an interest rate
2.4 Production sector
The urban production sector is categorized into two types: urban polluting enterprises
Within which, urban polluting enterprises produce intermediate goods using natural resources
Assuming that technological progress
where D and
After producing intermediate goods, the urban production sector assembles final products using labor inputs, considering the environmental impact
2.5 Dispersed equilibrium
According to the first theorem of welfare economics, when market participants’ utilities are strictly monotonic and information is complete, the general equilibrium market allocation is Pareto optimal. This paper discusses the situation where, in the absence of government intervention, urban economic agents achieve maximum profits through optimal business strategies.
The decision-making of urban polluting enterprises aims to maximize their profit through the optimal combination of natural resources and capital inputs and the formula of it is as Equation 12:
Urban green enterprises seek to maximize their profit through optimal capital investment and the formula of it is as Equation 13:
Assuming the final product price is normalized to 1, with
The urban final firms’ decision is to optimize the production ratio of the two intermediate goods to achieve maximum profit. Hence, the profit-maximizing expression for urban final firms is as Equation 15:
where
As mentioned previously, the financial market is frictionless, so there are no arbitrage conditions. Consequently, the green finance sector provides funding to both types of enterprises at the same interest rate as the deposit rate, expressed as Equation 19:
From Equations 16, 18, we can get the following Equation 20:
Thus, the proportion of funding allocated to urban polluting enterprises from the total funding provided by the green finance sector is as Equation 21:
2.6 Social planner’s equilibrium
First, solving the Hamiltonian equation:
According to the second theorem of welfare economics, the government can achieve Pareto optimal market allocation by adjusting the initial endowments among different sectors. The social planner’s problem is formulated as follows:
Where
Taking derivatives of the Hamiltonian function yields the first-order conditions for the optimal control problem:
The transversality conditions for the optimization problem are:
Second, steady-state and balanced growth path:
The analysis of the steady state is based on examining the growth rates of variables
From Equation 24, we obtain:
In the steady state, all variable growth rates
Similarly,
From Equation 25, we get Equation 28:
Similarly,
From the environmental dynamics
Similarly,
From Equation 23, taking the logarithm of both sides and differentiating yields:
Given
By taking the logarithmic derivative of the final output production function
When
Based on the above analysis, we can propose Theoretical Hypothesis 1:
Hypothesis 1. Green finance, under other unchanged conditions, can promote the reduction of urban carbon emissions and decrease carbon emission intensity.
3 The mechanism of green finance’s impact on urban carbon emissions and intensity
3.1 Economic scale expansion effect
As a derivative of traditional financial activities, green finance similarly integrates social funds through its financial services, improves resource allocation efficiency, and accelerates social capital accumulation. According to the Cobb-Douglas production function, there is a functional relationship between social production and capital; an increase in capital input will lead to an expansion of production scale, thereby enhancing the scale of the economy. Moreover, by incorporating environmental sustainability into its operational principles, green finance endows its financial instruments with green attributes, thus attracting environmentally conscious investors and institutions. Green finance not only broadens the financing channels of traditional finance, thereby expanding the economic scale, but also enhances market stability through the flow of funds into environmental projects.
The expansion of the urban economic scale influences the dual control of carbon emissions from both the supply side and the demand side. On the supply side, the theory of economies of scale, as proposed by British economist Adam Smith in The Wealth of Nations in 1776, suggests that an increase in output during production leads to a decrease in unit costs. The expansion of urban economic scale results in an increase in production scale, achieving economies of scale, which helps improve production efficiency, reduce production costs, and accelerate the specialization and rationalization of production. This allows production sectors to achieve more output with less input, thereby saving energy and resources and reducing carbon emissions and intensity.
However, it should be noted that when the urban economic scale expands beyond a certain range, it may lead to diseconomies of scale. Without changes in industrial structure and pollution emission coefficients, when the input of production factors exceeds the optimal level, diminishing marginal returns may occur, leading to increased production costs, greater consumption of natural resources, higher carbon emissions, and an increase in carbon emission intensity per unit of GDP.
On the other hand, from the demand side, in the early stages of urban economic development, consumers tend to focus more on basic material needs. To meet this widespread demand, market suppliers may increase the input of non-clean production factors. If, at this stage, technological advancements and government regulations fail to effectively curb the environmental pollution caused by expanded production, the scale effect may lead to increased carbon emissions. In this scenario, total carbon emissions and GDP would grow simultaneously, with carbon emission intensity experiencing fluctuations. However, as the level and quality of urban economic development improve and consumer environmental awareness increases, consumers may prefer products that are technologically advanced, resource-efficient, and environmentally friendly. The market’s demand for green products compels manufacturers to increase the production of low-carbon and environmentally friendly products, thereby contributing to the reduction of carbon emissions and intensity. Thus, we propose the following hypotheses:
Hypothesis 2a. Green finance can reduce urban carbon emissions and intensity by expanding economic scale.
Hypothesis 2b. Green finance can increase urban carbon emissions and intensity by expanding economic scale.
3.2 Industrial structure optimization effect
It is generally believed that industrial structure encompasses both industrial upgrading and industrial rationalization (Yuan and Zhu, 2018). Therefore, this paper explores the impact of green finance on urban carbon emissions through these two aspects of industrial structure optimization. On one hand, industrial upgrading refers to the transition of the industrial structure from lower to higher levels, specifically from labor-intensive to capital- and technology-intensive industries. Green finance can facilitate this transition by imposing punitive financing measures, such as raising loan interest rates for polluting industries, thereby increasing the financing difficulties for such industries. This internalizes the negative externalities generated by pollution, forcing these industries to undergo cleaner and greener industrial upgrading. Additionally, green finance channels funds toward clean industries and provides subsidies, reducing operational difficulties and costs, increasing investment returns, and enhancing the attractiveness of clean industries, thereby signaling the market to promote green industrial transformation.
On the other hand, industrial rationalization refers to the enhancement of interrelationships between different sectors of the economy, characterized by the increasing coupling between input structures and output structures, leading to improved efficiency in the utilization of production resources. In the early stages, supported by national policies, green finance may lower the standards for financial access to support the development of clean industries. However, as risk management remains a fundamental principle of the financial sector, green financial institutions may still avoid funding high-risk clean industries. As the market achieves overall industrial greening, clean industries may no longer hold a special advantage in accessing financial institution funds, and risk assessments by these institutions may become more stringent. Consequently, whether in the early or later stages of clean industry development, the risk aversion of green financial institutions will drive clean industries to enhance the rationalization of their industrial structures to improve resource utilization efficiency, increase operational profitability, and improve financial institutions’ risk ratings.
Both industrial upgrading and rationalization lead to a reduction in total industrial carbon emissions, and through the enhancement of economic benefits, further reduce carbon emission intensity. Therefore, we propose the following hypothesis:
Hypothesis 3. Industrial structure plays a significant mediating role in the impact of green finance on urban carbon emissions and intensity.
3.3 Technological progress effect
Technological innovation is inherently uncertain and often subject to the diseconomies of compressed timelines. For enterprises, technological innovation carries significant risks and is influenced by factors such as the heterogeneity of property rights, varying degrees of enterprise maturity, and differing scales of operation. These factors increase the difficulty of innovation and, consequently, the operational costs for enterprises. Green finance, by utilizing various structural tools, leverages the informational and scale advantages of financial markets to effectively allocate funds through capital markets. This process directs financial resources towards environmentally friendly enterprises, providing financing services that alleviate the practical challenges of financing difficulties and high costs caused by the positive externalities of innovation that are hard to internalize. Furthermore, as the green finance system matures, information about green enterprises becomes more transparent and accurate, reducing the information costs associated with adverse selection and moral hazard due to information asymmetry. This improvement attracts more investors to the green industry, offering green enterprises increased financing opportunities. Technological progress, in turn, reduces energy consumption in production processes, thereby decreasing carbon dioxide emissions. Additionally, technological advancements enhance the market competitiveness of enterprises, increasing their profits and thereby reducing carbon emission intensity.
However, the technological progress induced by green finance might also result in an environmental rebound effect, potentially inhibiting carbon reduction efforts. While technological progress is a key means of improving energy efficiency, it does not always lead to reduced carbon emissions. The Jevons paradox offers a detailed explanation of the environmental rebound effect: On one hand, technological progress increases the efficiency of production resources and leads to economic scale expansion, where the resulting income increase causes households to consume more energy, substituting for labor and capital investment in production activities. On the other hand, although technological advancements enhance resource use efficiency, they also lower the unit cost of resource consumption. The principle of maximizing returns may drive social production sectors to invest more in energy-rich production resources to reduce operational costs. Ultimately, the increase in energy consumption leads to a resurgence in environmental pollution, raising carbon dioxide emissions. In this scenario, carbon dioxide emissions grow in tandem with GDP, and the changes in carbon emission intensity remain uncertain. Therefore, we propose the following hypotheses:
Hypothesis 4a. Green finance can reduce urban carbon emissions and carbon emission intensity by promoting technological progress in enterprises.
Hypothesis 4b. The technological progress induced by green finance may cause a rebound effect, leading to an increase in urban carbon emissions, with an uncertain impact on urban carbon emission intensity.
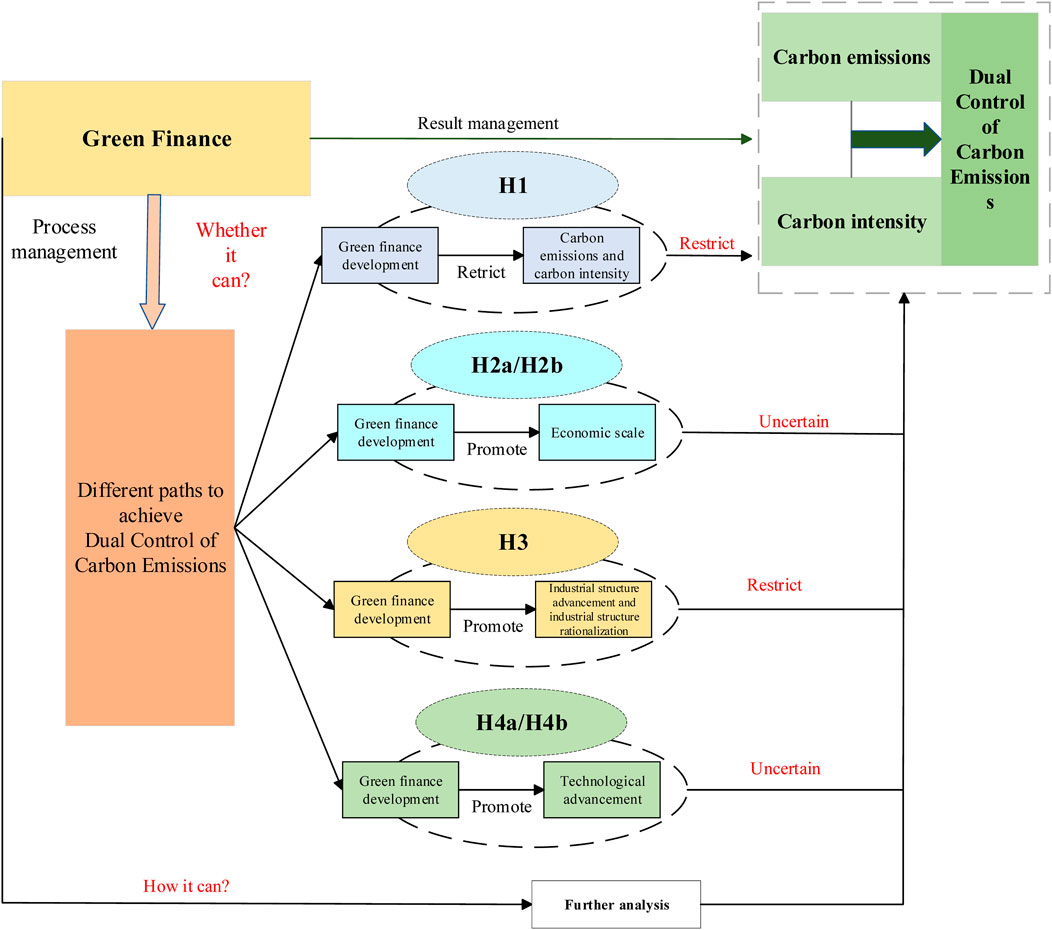
In summary, green finance has a direct impact on the dual control of urban carbon emissions, and this effect is realized through three transmission mechanisms: economic scale, industrial structure, and technological progress. The overall implementation pathway is shown in Figure 1.
4 Model framework, indicator measurement, and data sources
4.1 Model framework
4.1.1 Baseline model
To investigate the impact of green finance on urban carbon emissions and carbon emission intensity, we construct the following baseline model:
Where i and t correspond to cities and years, respectively, carbon emissions (
4.1.2 Mediation model
To examine the mechanism through which green finance impacts urban carbon emissions and intensity, the following mediation model is constructed:
Where
4.2 Variable selection
4.2.1 Explanatory variables
The core explanatory variable in this study is the level of green finance development. While existing literature on green finance measurement often focuses on provincial levels (Yang et al., 2022), this study chooses to measure green finance development at the city level and the specific indicators are shown in Table 1. This decision is based on the fact that cities are major energy consumers and also the primary entities responsible for implementing carbon emission control policies. To measure green finance development, this study uses data from 260 cities in China spanning from 2010 to 2022. The selection of measurement indicators is based on data availability and the actual development context of green finance in China, using the “Guiding Opinions on Building a Green Financial System” released by China in 2016 as a reference. The indicators selected for measuring green finance are green credit, green insurance, green bonds, and green funds. After normalizing the data, the entropy method is employed to calculate the level of green finance development in China. For green credit, the measurement involves summing the short-term and long-term loans of environmental clean industry listed companies in each city, using data from the “Statistical Classification of Energy-Saving and Environmental Protection Clean Industries (2021)” and excluding companies with abnormal trading. Green bonds (Chang et al., 2022) are measured by summing the total issuance of green bonds in each city from 2010 to 2022. In the context of green insurance, considering that China’s green insurance sector remains in its nascent stages and empirical data on environmental liability insurance is currently inaccessible, agricultural insurance is utilized as a proxy indicator. This study quantifies the development level of green insurance by examining the revenue scale of green insurance at the prefecture-level city. For green funds, the issuance of ESG funds from 2010 to 2022 is summed based on the registered cities of fund managers to determine the green fund development level for each city.
4.2.2 Dependent variables
Carbon emission control involves managing both urban carbon emissions (CE) and carbon intensity (CI). In this study, the dependent variables are urban carbon emissions and carbon intensity. The measurement of urban carbon emissions follows the approach by using boundary delineation criteria to classify carbon emission pathways into Scope 1, Scope 2, and Scope 3. Scope 1 refers to all direct emissions within the urban area, including greenhouse gas emissions from transportation, buildings, industrial processes, agriculture, forestry, land use changes, and waste management activities. Scope 2 includes indirect emissions related to energy consumption that occur outside the urban area, such as emissions from purchased electricity, heating, and/or cooling. Scope 3 covers other indirect emissions that are caused by activities within the urban area but occur outside the boundary of Scope 2, including emissions from the production, transportation, use, and disposal of all goods purchased from outside the urban area. Urban carbon emissions are calculated by summing the emissions from these three scopes and taking the logarithm. Urban carbon intensity is obtained by taking the ratio of urban carbon emissions to city GDP, which is then normalized and logarithmically transformed.
4.2.3 Control variables
The control variables for urban carbon emission control are selected based on the following principles: (1) consideration of mainstream theoretical factors, (2) variables commonly used in relevant research by most scholars, (3) factors determined by China’s national conditions, development characteristics, and economic realities, and (4) data availability. Based on these principles and referencing the methods of Tang and Yang (2023) and Wang and Fan (2024), the following control variables are selected:
• Foreign Direct Investment (FDI): Foreign direct investment can reduce urban carbon emissions through technology spillovers and pollution transfer, while also decreasing urban carbon intensity by providing economic benefits. This study measures FDI as the logarithm of the total amount of foreign direct investment in the city.
• Government Size (GS): The administrative hierarchy of the urban system is an important institutional arrangement for government intervention in urban development, and the extent of government intervention is closely related to government size. The government can directly impact urban carbon reduction through command-type environmental regulations, with the influence showing a “U” shape—appropriate intervention can promote reductions in urban carbon emissions and intensity, while excessive intervention can lead to increases. This study measures government size as the ratio of fiscal expenditure to GDP.
• Population Density (PD): The impact of population density on carbon reduction also exhibits a “U” shape. A moderate increase in population density can lead to scale effects that improve pollution reduction and resource utilization, thus lowering urban carbon emissions and intensity. However, excessive population density can result in reduced per capita resource availability and decreased market demand quality, potentially increasing production-side carbon emissions. The impact on carbon intensity remains uncertain. This study measures population density as the ratio of total urban population to city area.
• Employment Structure (ES): A larger employment structure index indicates a higher proportion of employment in the tertiary sector, suggesting a cleaner and more economically efficient industrial structure, which can reduce urban carbon emissions and intensity. This study measures employment structure as the ratio of employment in the tertiary sector to total employment.
• Urbanization Rate (UR): Generally, a higher urbanization rate is associated with increased urban infrastructure and industrial facilities, leading to higher urban carbon emissions. However, the impact on carbon intensity due to economic benefits is less clear. This study represents the urbanization rate as the ratio of the urban population to the total population.
• Human Capital Level (HCL): Higher levels of human capital are associated with greater innovation capabilities, which can help reduce urban carbon emissions and intensity. This study measures human capital level as the ratio of the number of students in higher education institutions to the registered population.
• Market Scale (MS): Market scale, through improved consumption behaviors and promoted technological innovation, can reduce urban carbon emissions. Additionally, the economic benefits associated with a larger market scale can contribute to lowering carbon intensity. This study measures market scale as the ratio of total retail sales of consumer goods to regional GDP.
4.2.4 Mechanism variables
Based on theoretical assumptions and relevant research by domestic and international scholars, the following mechanism variables are selected:
• Economic Scale (ES): A larger economic scale index indicates a higher level of economic development. This study represents economic scale as the logarithm of city GDP.
• Industrial Structure: This is assessed from two dimensions: industrial structure upgrading (Ais) and industrial structure rationalization (Theil). The measurement methods follow Yuan and Zhu (2018). Industrial structure upgrading is divided into the quantity (Ais1) and quality (Ais2) of upgrading. The quantity of industrial structure upgrading is represented by the structural hierarchy coefficient, reflecting the trend of industrial structure shifting from primary to secondary and tertiary sectors. The calculation method is shown in Equation 37. The quality of industrial structure upgrading is represented by the weighted value of the ratio of industries and the product of labor rates in each industry, reflecting the technological capabilities of industries. The calculation method is shown in Equation 38. Industrial structure rationalization is measured by the Theil index, reflecting the degree of coordination between industries. The calculation method is shown in Equation 39.
Where
• Technological Progress: Domestic technological innovation generally arises from internal independent innovation. Therefore, this study measures technological progress from an output perspective, using the logarithm of the number of invention patent applications as an indicator of technological advancement.
4.3 Data sources and processing
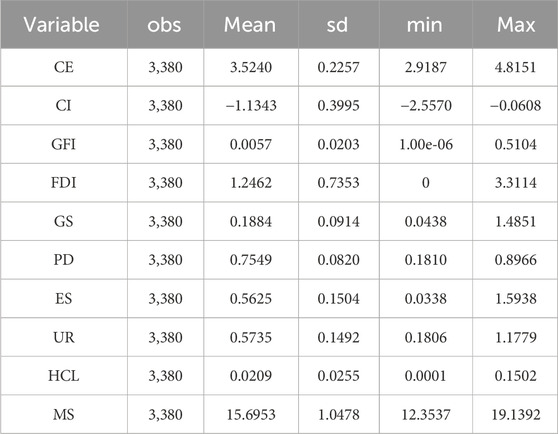
Considering the availability of data for green finance measurement indicators, a sample of 260 cities from China’s prefecture-level cities was selected. Data on green finance-related indicators are sourced from Guotai An (CSMAR), CNRDS, and Wind databases. Data for dependent variables are obtained from the “China Energy Statistical Yearbook,” “China Industrial Statistical Yearbook,” and “China Urban Statistical Yearbook,” among others. Data for control variables and mechanism variables come from the “China Urban Statistical Yearbook,” Guotai An (CSMAR), and CNRDS databases. To avoid issues with extreme values and heteroscedasticity, all absolute values are logarithmically transformed to eliminate dimensional errors, and missing or outlier values are excluded. Descriptive statistics for the sample data are shown in Table 2.
5 Empirical results analysis
5.1 Baseline regression results
A Hausman test was conducted on the sample data. The p-values for the effect of green finance on urban carbon emissions and intensity were 0.0838 and 0.004, respectively. Given that the null hypothesis was rejected, a two-way fixed effects model was selected. Table 3 presents the estimated results of the impact of green finance on urban carbon emissions and intensity.
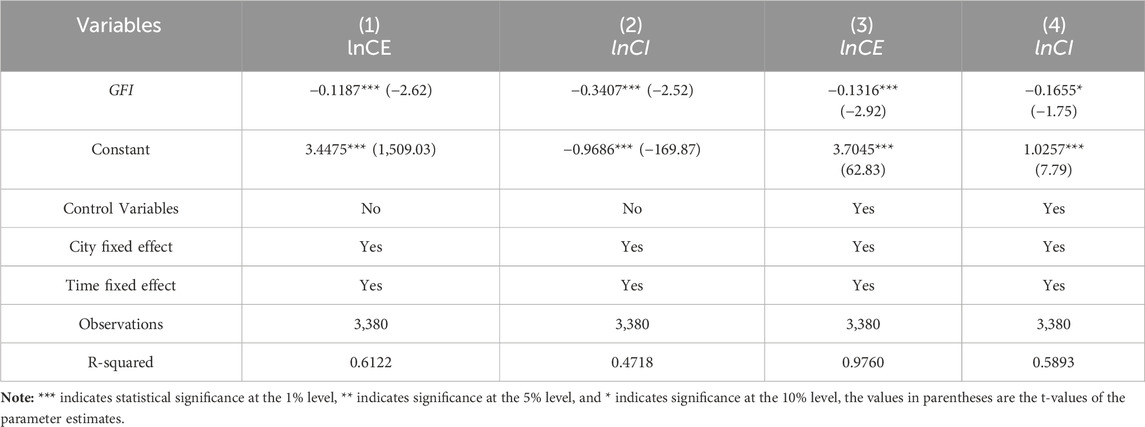
Table 3. Baseline regression results for the impact of green finance on urban carbon emissions and intensity.
In columns (1) and (2), the estimated coefficients of the core explanatory variable, green finance level, are statistically significant at the 1% level, with values of −0.1187 and −0.3407, respectively. This suggests that a 1% increase in the level of green finance leads to a reduction in carbon emissions and carbon intensity by 11.87% and 34.07%, respectively.
When control variables were added in columns (3) and (4), the estimated coefficients of the core explanatory variable, green finance, are statistically significant at the 1% and 10% levels, with values of −0.1316 and −0.1655, respectively. This indicates that a 1% increase in the level of green finance results in a reduction in carbon emissions and carbon intensity by 13.16% and 16.55%, respectively. However, the coefficients were affected by the inclusion of control variables. Specifically, the suppressive effect of green finance on urban carbon emissions strengthened. In contrast, the effect of green finance on urban carbon intensity weakened.
The results in Table 3 suggest that green finance has a suppressive effect on both urban carbon emissions and intensity, thereby promoting dual control of urban carbon emissions. This supports Hypothesis 1.
5.2 Endogeneity and robustness checks
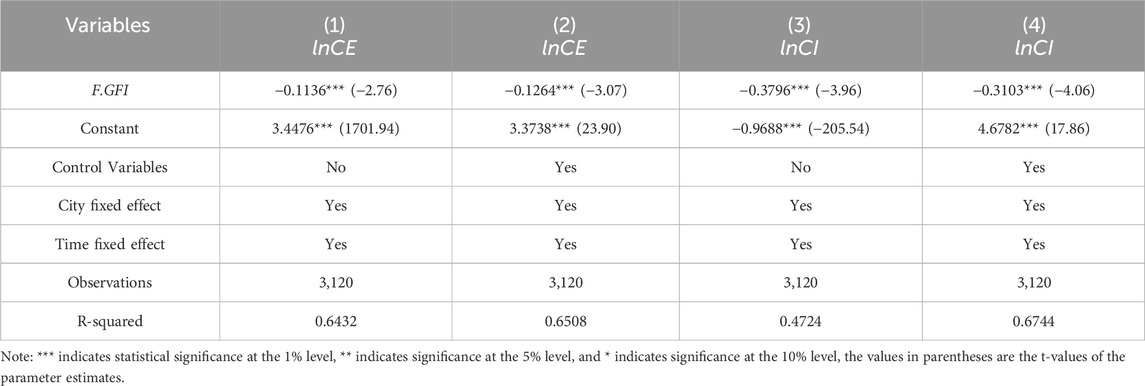
First, Endogeneity Check: When exploring the contemporaneous relationship between green finance and urban carbon emissions and intensity, endogeneity and self-selection issues may arise. To address potential endogeneity and self-selection problems, this study adopts a lagged regression model, following the methods of and Chen et al. (2024). In this model, the explanatory variable (F.GFI) is the value for period t+1, while the dependent variable and control variables are from period ttt. The results presented in columns (1) to (4) of Table 4 show that the regression coefficients for green finance remain significantly negative, indicating that the research findings are robust.
Second, Changing Estimation Methods: The estimation method was altered to a random effects model. The results are presented in columns (1) and (2) of Table 5. It is observed that even with this change in method, the regression coefficients for green finance remain significantly negative, indicating that the results are robust.
Third, Adding Control Variables: To more accurately assess the impact of green finance on urban carbon emissions and intensity, additional control variables were included to account for potential confounding factors. Specifically, education level (EDL) and infrastructure level (ISL) were added as new control variables to the original baseline regression. The results, shown in columns (3) and (4) of Table 5, reveal that the coefficients for green finance remain significantly negative even after adding these controls, confirming the robustness of the findings.
Third, Changing the Sample: On one hand, the baseline regression includes prefecture-level cities, municipalities directly under the central government, and sub-provincial cities. Given that the primary focus of the study is on prefecture-level cities and recognizing the significant differences in economic development, policy support, and other factors between municipalities/sub-provincial cities and prefecture-level cities, the sample was adjusted to include only prefecture-level cities. The results are presented in columns (1) and (2) of Table 6. Even after excluding municipalities and sub-provincial cities, the green finance regression results remain significant, showing that green finance continues to have a suppressive effect on carbon emissions and intensity for prefecture-level cities.
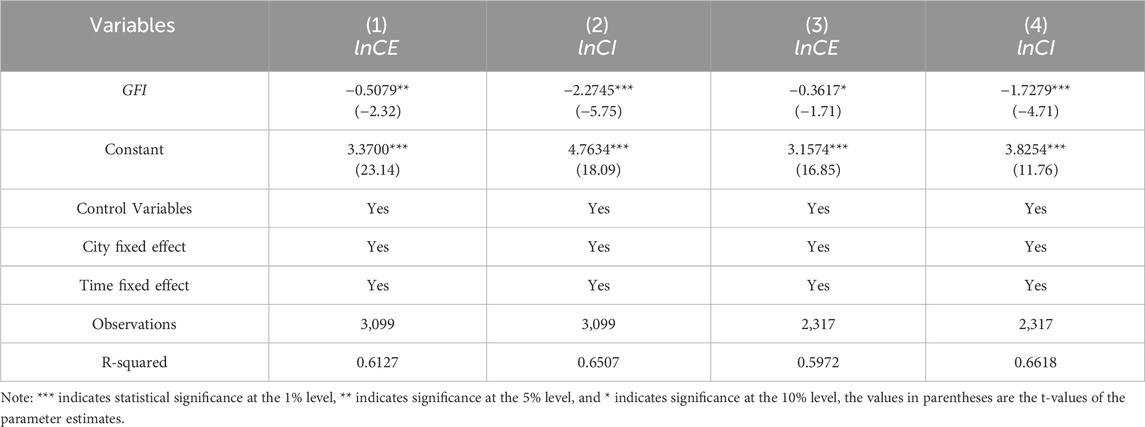
Table 6. Regression results excluding municipalities directly under the central government, sub-provincial cities, and low-carbon pilot cities.
On the other hand, considering the potential impact of low-carbon pilot policies on carbon emissions and intensity, low-carbon pilot cities were removed from the original sample. The regression results are shown in columns (3) and (4) of Table 6. After excluding low-carbon pilot cities, the green finance regression results remain significant, continuing to demonstrate a suppressive effect on both carbon emissions and intensity. In summary, the results of this study are robust.
5.3 Heterogeneity analysis
Considering the differences in regional economic development levels, economic development models, and resource endowments in China, as well as varying financial efficiencies, it is important to explore the heterogeneous effects of green finance on urban carbon emissions and intensity. This section examines the heterogeneity in the impact of green finance based on regional differences, resource endowment disparities, and financial efficiency.
5.3.1 Regional heterogeneity
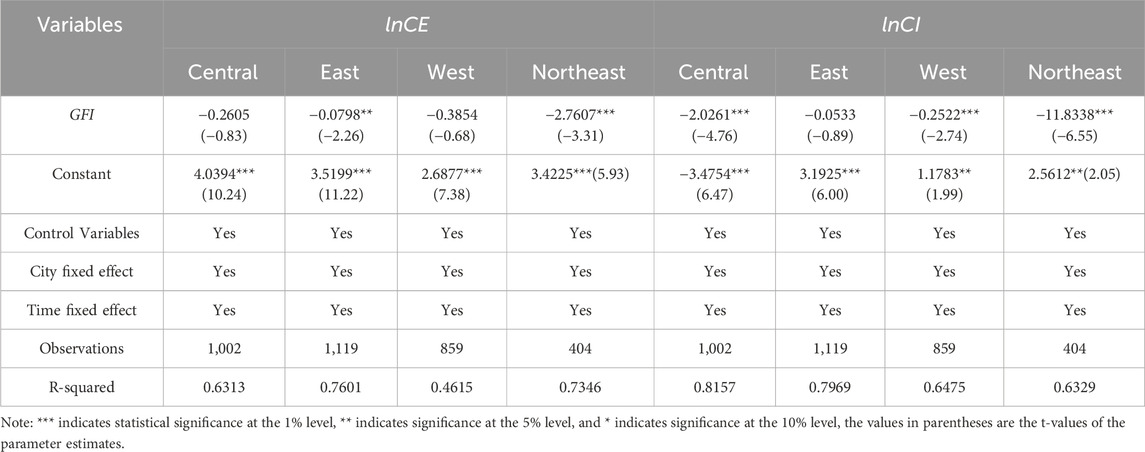
Based on the classification standards of the National Bureau of Statistics of China, the 260 cities in the sample are divided into four regions: Eastern, Central, Western, and Northeastern. The results in Table 7 indicate the following: In the Eastern region, the development of green finance can reduce urban carbon emissions but does not significantly affect carbon intensity. In the Central and Western regions, green finance only has an impact on reducing carbon intensity and does not significantly influence carbon emissions. In the Northeastern region, the development of green finance can significantly reduce both urban carbon emissions and intensity. The possible reasons are as follows: In the Central and Western regions, there are still many high-energy-consumption and low-tech industries. Green finance primarily supports improvements in energy efficiency and the development and application of low-carbon technologies, which helps reduce carbon intensity. However, because energy consumption in these regions still has the potential to increase, the scale and effectiveness of green finance may not be sufficient to significantly reduce carbon emissions. In contrast, the Eastern region is economically developed with a higher proportion of high-tech industries and services. Green finance in these areas can guide enterprises to adopt more efficient energy utilization and environmental protection technologies, thereby reducing overall carbon emissions. However, since the carbon intensity in these regions is already relatively low, there is limited room for further reduction, resulting in a less noticeable impact of green finance on carbon intensity.
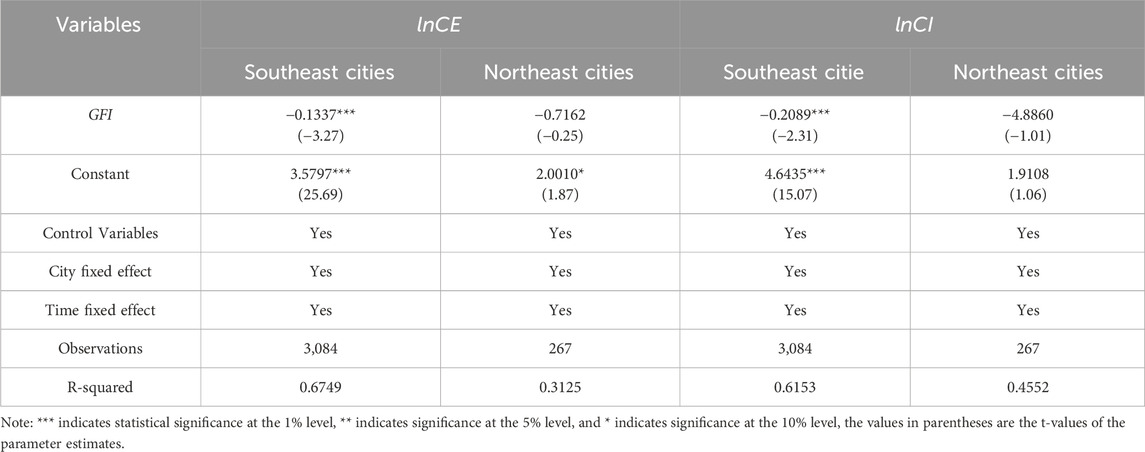
Additionally, this study examines whether the location-specific advantages of cities relative to the Hu Line2 affect the effectiveness of green finance in reducing urban carbon emissions. The Hu Line divides Chinese cities into two regions based on economic development levels and degrees of agglomeration: the southeastern side and the northwestern side. The results in Table 8 show that for cities on the southeastern side of the Hu Line, the regression coefficients for green finance are −0.1337 and −0.2089, both of which are statistically significant at the 1% level. In contrast, for cities on the northwestern side of the Hu Line, the regression coefficients for green finance are not significant.
This suggests that green finance development in northwestern cities has not effectively promoted reductions in carbon emissions and intensity. The likely reason is that, compared to cities on the southeastern side of the Hu Line, northwestern cities are constrained by their economic resources and market environment. Their lower levels of green finance development, combined with resource-dependent production methods, place them at a disadvantage in terms of the spatial flow of factor resources and resource allocation. This limitation restricts the effectiveness of green finance in reducing carbon emissions in these northwestern cities.
5.3.2 Resource endowment heterogeneity
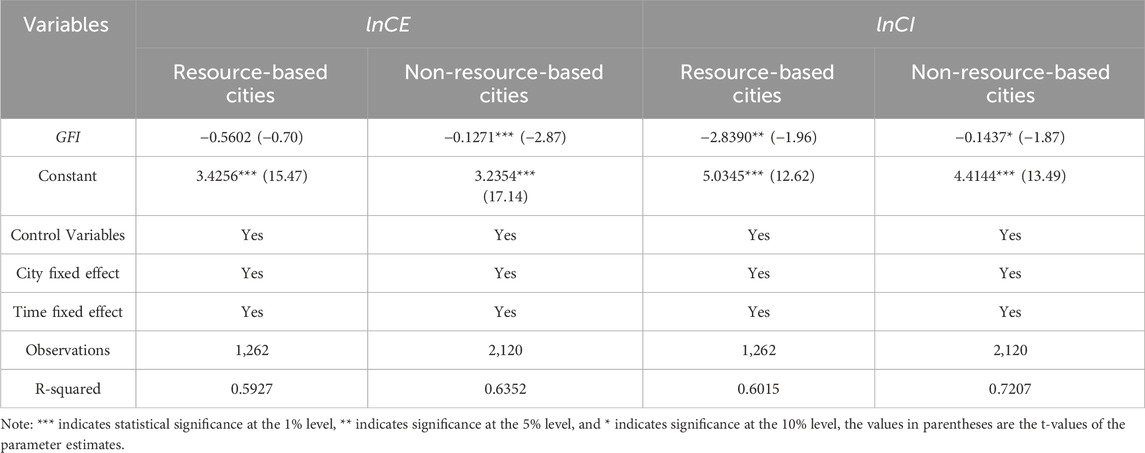
According to the “National Sustainable Development Plan for Resource-based Cities (2013–2020),” the 260 cities in the sample are categorized into resource-based and non-resource-based cities. The results in Table 9 show that: first, green finance development significantly reduces carbon intensity in resource-based cities but does not significantly affect their overall carbon emissions; second, for non-resource-based cities, green finance development significantly reduces both carbon emissions and intensity.
The likely reason for these findings is that the industrial structure of resource-based cities relies heavily on resource extraction and heavy industry, which are characterized by high capital intensity and technological lock-in effects. This makes it challenging for green finance to make a substantial impact on overall carbon emissions in the short term. Additionally, while green finance can lower carbon intensity by improving technological efficiency, the high emission characteristics of these industries limit the extent of overall emission reductions.
5.3.3 Financial development heterogeneity
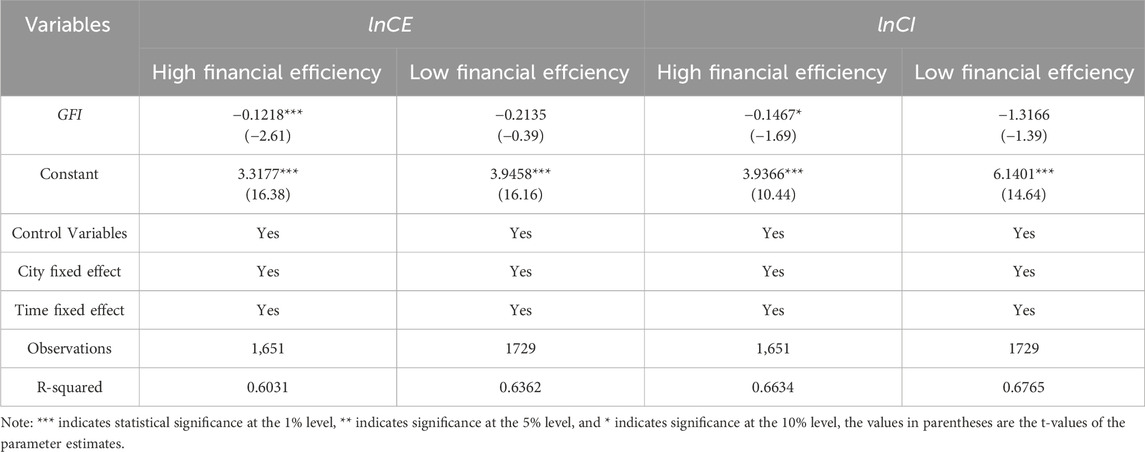
Financial development efficiency reflects the degree of regional financial resource allocation and competitiveness. This is measured by the loan-to-deposit ratio, with the sample of 260 cities divided into regions with high and low financial efficiency based on the annual median. Data is sourced from the annual “China Urban Statistical Yearbook.” Table 10 shows that: For cities with high financial efficiency, the development of green finance can effectively reduce both carbon emissions and intensity. For cities with low financial efficiency, green finance does not have a significant impact on carbon emissions or intensity.
The possible reason is that in regions with high financial efficiency, issues related to information asymmetry are relatively fewer, allowing for better allocation of green finance resources. This enables green finance to be quickly converted into low-carbon technologies and projects, thus improving carbon production efficiency and achieving better carbon reduction effects. Conversely, in cities with low financial efficiency, the low efficiency in resource allocation limits the effectiveness of green finance activities, resulting in negligible impacts.
5.4 Mechanism analysis results
As discussed in the theoretical framework, green finance impacts carbon emissions through various mechanisms, including economic scale, industrial structure, and technological advancement. This section delves into the mechanisms by which green finance influences urban carbon reduction, using indicators for economic scale, industrial upgrading, and technological progress.
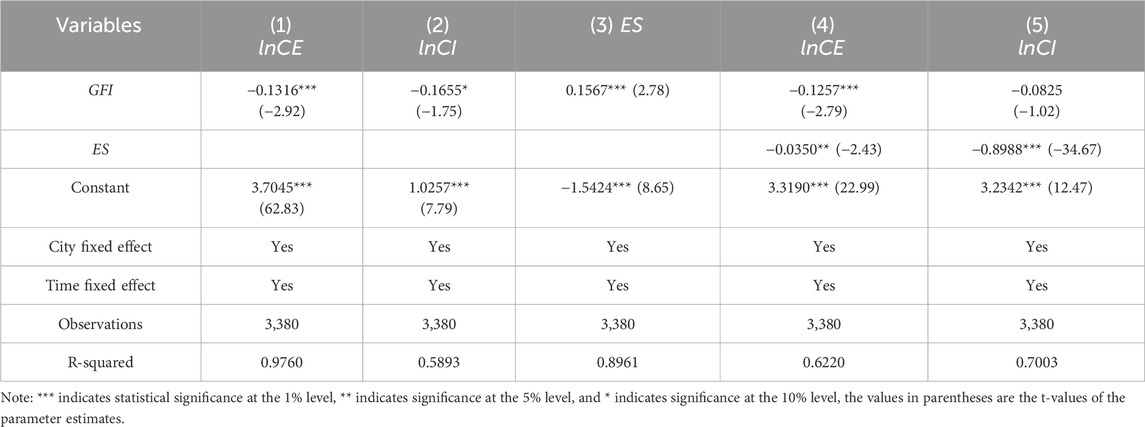
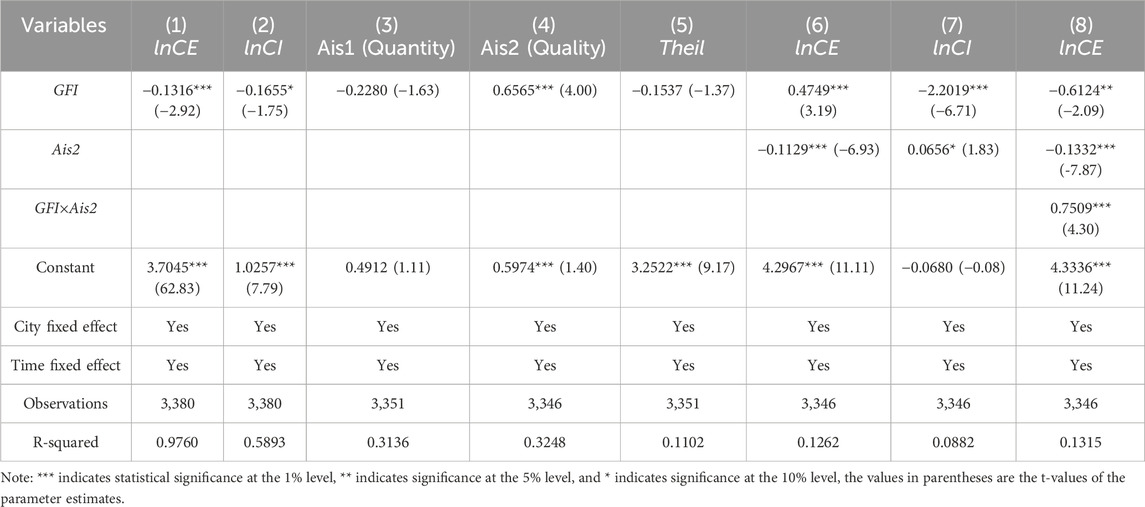
First, the mechanism test of economic scale. The regression results for the impact of green finance on urban economic scale are presented in Table 11 (3). The estimated coefficient of the core explanatory variable, green finance, is statistically significant at the 1% level, with a value of 0.1567. This suggests that a 1% increase in the level of green finance leads to a 15.67% increase in urban economic scale. Further analysis examines the effect of economic scale on urban carbon emissions and intensity. The regression results shown in Table 11 (4) and (5) indicate that economic scale significantly impacts urban carbon emissions and intensity, with coefficients of −0.0350 and −0.8988 at the 5% and 1% levels, respectively. This suggests that 1% increase in the level of urban economic scale leads to a 3.5% and 89.88% decrease in carbon emissions and carbon intensity, respectively. These results demonstrate that green finance contributes to the expansion of urban economic scale, which in turn helps reduce carbon emissions and intensity. Specifically, economic scale acts as a partial mediator in the relationship between green finance and urban carbon emissions and a complete mediator for carbon intensity. This implies that the current economic model in China has shifted from reliance on basic necessities to a focus on technology-driven products. Thus, Hypothesis 2b is rejected and Hypothesis 2a is accepted.
Second, the mechanism test of industrial structure. The mechanism test for the impact of green finance on industrial upgrading and rationalization is shown in Table 12 (3), (4), and (5). The regression coefficient for the quality of industrial upgrading is 0.6565 and is significant at the 1% level, indicating that 1% increase in green finance lead to a 65.65% increase in the quality of industrial upgrading. However, the regressions for the quantity of industrial upgrading and industrial rationalization are not significant. This may be because the development of energy-saving, environmental protection, and clean production industries in China is relatively recent, and their growth rates still lag behind those of pollution-intensive industries. Therefore, green finance is unable to quickly shift the focus of the industrial structure in the short term. Additionally, except for a few economically developed cities in China, most cities have not adequately considered their locational advantages and industrial development goals, leading to inefficient resource allocation and limited inter-industry linkage. This has negatively affected the rationalization of the local industrial structure, reducing the impact of green finance on industrial rationalization.
Further testing of the impact of the quality of industrial upgrading on urban carbon emissions and intensity is shown in Table 12 (6) and (7). After including the mechanism variables, the coefficient for the effect of green finance on urban carbon emissions changes from negative to positive, indicating that the quality of industrial upgrading moderates the carbon reduction capacity of green finance. Therefore, an interaction term between green finance and the quality of industrial upgrading was introduced for further testing, as shown in Table 12 (8). The interaction term’s coefficient for carbon emissions is significantly positive, indicating that the quality of industrial upgrading negatively moderates the carbon reduction capacity of green finance. This explains the change observed in Table 12 (6).
Additionally, the regression results in Table 12 (7) show that the coefficient for industrial structure on urban carbon intensity is positive, indicating that the quality of industrial upgrading has led to an increase in carbon intensity. This may be because green finance, by improving the quality of industrial upgrading, increases the proportion of capital and technology-intensive industries in output activities. Although these high-value-added industries have lower resource consumption and pollution emissions per unit of output compared to traditional industries, their overall scale and growth rate might lead to an increase in absolute resource and energy consumption, thereby offsetting the carbon reduction effects of green finance. In summary, the original Hypothesis 3 is rejected.
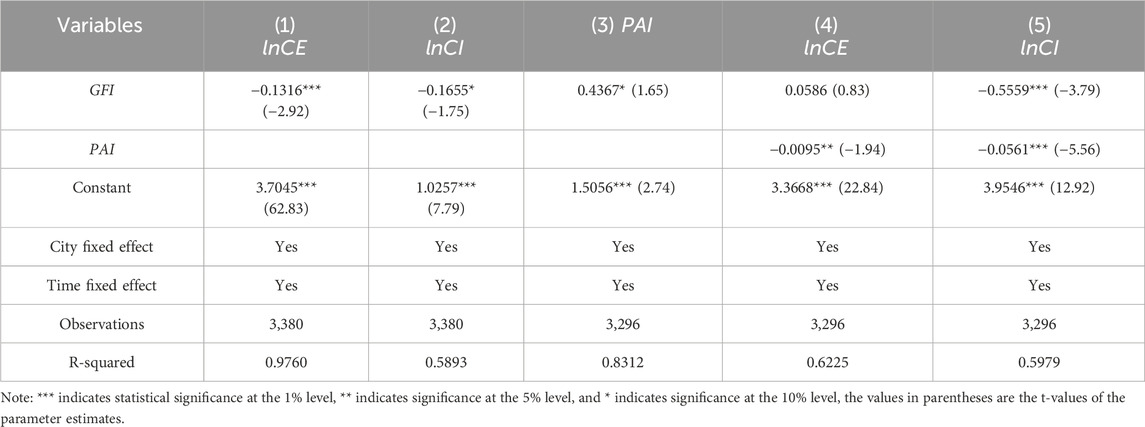
The last, the mechanism test of technological progress. The regression results for the impact of green finance on technological progress are shown in Table 13 (3). The coefficient for the effect of green finance on technological progress is 0.4367 and is significant at the 10% level, indicating that 1% increase in green finance leads to a 43.67% increase in technological progress. A. Further examination of the impact of technological progress on urban carbon emissions and intensity is shown in Table 13 (4) and (5). The coefficients for the effects of technological progress on urban carbon emissions and intensity are −0.0095 and −0.0561, significant at the 5% and 1% levels, respectively. This indicates that 1% increase in the level of green finance results in a reduction in carbon emissions and carbon intensity by 0.95% and 5.61%, respectively. The regression results demonstrate that the development of green finance promotes urban carbon emissions control through the channel of technological progress. Technological progress plays a full mediating role in reducing urban carbon emissions and a partial mediating role in reducing carbon intensity. This also indicates that there is no rebound effect as previously theorized. Therefore, Hypothesis 4b is rejected, and Hypothesis 4a is accepted.
To further validate the robustness of the mechanism test results, both Bootstrap tests (with 1,000 samples) and Sobel-Goodman tests were conducted, confirming the robustness of the mechanism test conclusions. Due to space constraints, the robustness test results are not presented.
6 Research outlook and conclusion implications
The dual control of urban carbon emissions and intensity relies on a shift towards cleaner production and operational methods. Research into the effects and mechanisms of green finance on carbon reduction is crucial for achieving a low-carbon transformation of urban economic development and advancing the dual control of carbon emissions and intensity in China. This paper empirically examines the carbon reduction effects of green finance from both total amount and intensity perspectives and further analyzes the channels through which these effects operate. However, several limitations persist. First, due to constraints in data availability, certain green finance instruments are not incorporated into the green finance indicator framework. As a result, the assessment of the green finance level in cities presented in this paper may not fully capture their actual status. It is anticipated that with improved data accessibility in future research, the measurement system can be further refined. Second, owing to limitations in scope, this study does not explore the spatial effects of green finance on urban carbon emission controls. Future research should seek to address this gap in spatial analysis, thereby providing more actionable policy recommendations.
The results indicate that: (1) Green finance has a significant inhibitory effect on both urban carbon emissions and intensity, and this conclusion remains valid after introducing lagged regression models and changing control variables as part of robustness checks. (2) The effect of green finance on urban carbon reduction shows significant regional heterogeneity; it only significantly reduces carbon emissions and intensity in the Northeast region, non-resource-based cities, and areas with higher financial efficiency. In the Central and Western regions and resource-based cities, green finance only reduces carbon intensity and does not effectively reduce carbon emissions. In regions with low financial efficiency, green finance has not yet effectively contributed to carbon reduction. (3) Economic scale and technological progress are effective channels through which green finance achieves carbon reduction. Economic scale partially mediates the effect on urban carbon emissions and fully mediates the effect on carbon intensity, while technological progress fully mediates the effect on urban carbon emissions and partially mediates the effect on carbon intensity. Additionally, green finance has not achieved carbon reduction through industrial structure optimization; specifically, it only promotes the qualitative advancement of industrial structure without significantly affecting the quantity or rationalization of industrial structure. The qualitative advancement of industrial structure negatively moderates the effect of green finance on urban carbon emissions but has a partial mediating effect on carbon intensity.
The main policy implications of this study are as follows: First, green finance is an effective tool for reducing urban carbon emissions and intensity. Therefore, it is necessary to establish and improve a standard and policy support system for green finance to better utilize its resource allocation, risk management, and market pricing functions, guiding various resource elements to orderly gather in urban green and low-carbon fields. Second, considering the regional heterogeneity in the impact of green finance on urban carbon emissions and intensity, differentiated regional green finance policies should be formulated. It is essential to explore region-specific green finance development and reform paths, particularly in China’s Central and Western regions and resource-based cities, with a focus on effectively reducing total carbon emissions. This requires not only innovative green finance policy tools but also coordination with other policy tools such as green finance and fiscal policies. Thirdly, considering the mediating role of economic scale and technological progress, it is essential to fully optimize the utilization and allocation mechanisms of resources and factors from various aspects such as technological innovation, environmental protection, and energy conservation, to enhance the quality and efficiency of economic development. Specifically: To begin with, the government should increase financial support for enterprises engaged in green research projects, establishing special funds to encourage the development of green products with high technological content and added value. An innovation platform that integrates industry, academia, and research should be established to strengthen cooperation between research institutions and enterprises, promoting the transformation and commercialization of green technological achievements. Next it is important to improve environmental protection laws and regulations, intensify the supervision of pollutant emissions, and severely crack down on environmental violations. Strict environmental entry standards should be implemented to control the entry of polluting enterprises from the source. Lastly, industry energy efficiency standards should be developed, and an energy consumption quota system should be applied to high-energy-consuming industries to encourage enterprises in energy conservation and emission reduction efforts. A tiered energy pricing policy should be implemented to use economic levers to incentivize enterprises to actively reduce energy consumption. The construction of renewable energy projects should be accelerated, increasing the proportion of clean energy such as wind, solar, and biomass energy in the energy structure.
Data availability statement
The data analyzed in this study is subject to the following licenses/restrictions: We will provide data if necessary. Requests to access these datasets should be directed to TZ, emhhbmd0aWFudEBjdWcuZWR1LmNu.
Ethics statement
The research does not require ethical committee approval, participant assent, or publication consent.
Author contributions
TZ: Conceptualization, Data curation, Formal Analysis, Investigation, Methodology, Software, Writing–original draft, Writing–review and editing. YaZ: Conceptualization, Formal Analysis, Investigation, Methodology, Project administration, Resources, Supervision, Writing–review and editing. YuZ: Formal Analysis, Writing–review and editing.
Funding
The author(s) declare that no financial support was received for the research, authorship, and/or publication of this article.
Conflict of interest
The authors declare that the research was conducted in the absence of any commercial or financial relationships that could be construed as a potential conflict of interest.
Publisher’s note
All claims expressed in this article are solely those of the authors and do not necessarily represent those of their affiliated organizations, or those of the publisher, the editors and the reviewers. Any product that may be evaluated in this article, or claim that may be made by its manufacturer, is not guaranteed or endorsed by the publisher.
Footnotes
1The dual control system for carbon emissions refers to the implementation of measures that constrain both the total carbon emissions and the carbon intensity. The focus is on limiting the total consumption and intensity of fossil energy.
2The Hu Line, also known as the Heihe-Tengchong Line or the Aihui-Tengchong Line, is a population density contrast line in China proposed in 1935. It divides China into two parts: the northwest and the southeast, with roughly equal geographic areas but vastly different population densities and levels of economic activity.
References
Abbasi, F., and Riaz, I. (2016). CO2 emissions and financial development in an emerging economy: an augmented VAR approach. Energy Policy 90, 102–114. doi:10.1016/j.enpol.2015.12.017
Barrage, L. (2020). Optimal dynamic carbon taxes in a climate-economy model with distortionary fiscal policy. Rev. Econ. Stud. 87 (1), 1–39. doi:10.1093/restud/rdz055
Bekhet, H. A., Matar, A., and Yasmin, T. (2017). CO2 emissions, energy consumption, economic growth, and financial development in GCC countries: dynamic simultaneous equation models. Renew. and Sustain. Energy Rev. 70, 117–132. doi:10.1016/j.rser.2016.11.089
Bovenberg, A., and Lans, S. S. (1995). Environmental quality and pollution-augmenting technological change in aTwo-sector endogenous growth model. J. Public Econ. 1995 (3), 369–391. doi:10.1016/0047-2727(95)80002-Q
Chang, L., Taghizadeh-Hesary, F., Chen, H., and Mohsin, M. (2022). Do green bonds have environmental benefits. Energy Econ. 115, 106356. doi:10.1016/j.eneco.2022.106356
Chen, F. Y., Zeng, X., and Guo, X. (2024). Green finance, climate change, and green innovation: evidence from China. Finance Res. Lett. 63, 105283. doi:10.1016/j.frl.2024.105283
Chen, J. D., Gao, M., Mangla, S. K., Song, M., and Wen, J. (2020). Effects of technological changes on China's carbon emissions. Technol. Forecast. Soc. Change 153, 119938. doi:10.1016/j.techfore.2020.119938
Dong, Z., Xia, C., Fang, K., and Zhang, W. (2022). Effect of the carbon emissions trading policy on the Co-benefits of carbon emissions reduction and air pollution control. Energy Policy 165, 112998. doi:10.1016/j.enpol.2022.112998
Fan, H., Peng, Y., Wang, H., and Xu, Z. (2021). Greening through finance? J. Dev. Econ. 152, 102683. doi:10.1016/j.jdeveco.2021.102683
Flammer, C. (2021). Corporate green bonds. J. Financial Econ. 142 (2), 499–516. doi:10.1016/j.jfineco.2021.01.010
Lan, J., Wei, M., Guo, J., Li, Q., and Liu, Z. (2023). The effect of green finance on industrial pollution emissions: evidence from China[J]. Resources policy 80. doi:10.1016/j.resourpol.2022.103156
Lian, J., Huang, X. S., and Wu, X. (2024). How green bonds promote firms' green collaborative innovation? Corp. Soc. Responsib. Environ. Manag. 31 (3), 2109–2126. doi:10.1002/csr.2688
Lv, C. C., Fan, J. F., and Lee, C. C. (2023). Can green credit policies improve corporate green production efficiency? J. Clean. Prod. 397, 136573. doi:10.1016/j.jclepro.2023.136573
Mardones, C., and Flores, B. (2018). Effectiveness of A CO2 tax on industrial emissions. Energy Econ. 71, 370–382. doi:10.1016/j.eneco.2018.03.018
Okushima, S., and Tamura, M. (2010). What causes the change in energy demand in the economy? The role of technological change. Energy Econ. 32, 41–46. doi:10.1016/j.eneco.2009.03.011
Qi, Y. k. (2023). Green finance, technological progress, and economic growth-theoretical analysis and empirical test based on a general equilibrium model. Lanzhou Acad. J. (03), 16–30. doi:10.3969/j.issn.1005-3492.2023.03.003
Sadorsky, P. (2010). The impact of financial development on energy consumption in emerging economies. Energy Policy 38 (5), 2528–2535. doi:10.1016/j.enpol.2009.12.048
Sun, C. W., and Zeng, Y. F. (2023). Does the green credit policy affect the carbon emissions of heavily polluting enterprises? Energy Policy 180, 113679. doi:10.1016/j.enpol.2023.113679
Tamazian, A., Chousa, J. P., and Vadlamannati, K. C. (2009). Does higher economic and financial development lead to environmental degradation: evidence from BRIC countries. Energy Policy 37 (1), 246–253. doi:10.1016/j.enpol.2008.08.025
Tan, X. J., Yan, Y. X., and Dong, Y. Y. (2022). Peer effect in green credit induced green innovation: an empirical study from China's green credit guidelines. Resour. Policy 76, 102619. doi:10.1016/j.resourpol.2022.102619
Tang, K. J., and Yang, G. Y. (2023). Does digital infrastructure cut carbon emissions in Chinese cities? Sustain. Prod. Consum. 35, 431–443. doi:10.1016/j.spc.2022.11.022
Wang, J., Dong, K., Dong, X., and Taghizadeh-Hesary, F. (2022). Assessing the digital economy and its carbon-mitigation effects: the case of China. Energy Econ. 113, 106198. doi:10.1016/j.eneco.2022.106198
Wang, S. K., and Fan, W. C. (2024). Financial accessibility and carbon emissions-macro and micro evidence from financial geographic structure. J. Quantitative and Tech. Econ. 41 (01), 67–89. doi:10.13653/j.cnki.jqte.20231117.005
Wang, T., Liu, X. X., and Wang, H. (2022). Green bonds, financing constraints, and green innovation. J. Clean. Prod. 381, 135134. doi:10.1016/j.jclepro.2022.135134
Wen, H. W., Lee, C. C., and Zhou, F. X. (2021). Green credit policy, credit allocation efficiency and upgrade of energy-intensive enterprises. Energy Econ. 94, 105099. doi:10.1016/j.eneco.2021.105099
Wu, Y., Tam, V. W., Shuai, C., Shen, L., Zhang, Y., and Liao, S. (2019). Decoupling China's economic growth from carbon emissions: empirical studies from 30 Chinese provinces (2001-2015). Sci. Total Environ. 656, 576–588. doi:10.1016/j.scitotenv.2018.11.384
Xing, C., Zhang, Y. M., and Tripe, D. (2021). Green credit policy and corporate access to bank loans in China: the role of environmental disclosure and green innovation. Int. Rev. Financial Analysis 77, 101838. doi:10.1016/j.irfa.2021.101838
Xu, S., Zhao, X. X., and Yao, S. (2018). Analysis of the impact of green credit on industrial structure upgrading. J. Shanghai Univ. Finance Econ. 20 (02), 59–72. doi:10.16538/j.cnki.jsufe.2018.02.004
Xuan, D., Ma, X. W., and Shang, Y. P. (2020). Can China's policy of carbon emission trading promote carbon emission reduction? J. Clean. Prod. 270, 122383. doi:10.1016/j.jclepro.2020.122383
Yu, C. H., Wu, X., Zhang, D., Chen, S., and Zhao, J. (2021). Demand for green finance: resolving financing constraints on green innovation in China. Energy Policy 153, 112255. doi:10.1016/j.enpol.2021.112255
Yuan, H., and Zhu, C. L. (2018). Have national high-tech zones promoted the transformation and upgrading of China's industrial structure? China Ind. Econ. (08), 60–77. doi:10.19581/j.cnki.ciejournal.2018.08.004
Zhang, H. Y., Geng, C. X., and Wei, J. H. (2022). Coordinated development between green finance and environmental performance in China: the spatial-temporal difference and driving factors J. Clean. Prod. 346, 131150. doi:10.1016/j.jclepro.2022.131150
Zhang, K., Li, Y., Qi, Y., and Shao, S. (2021). Can green credit policy improve environmental quality? Evidence from China. J. Environ. Manag. 298, 113445. doi:10.1016/j.jenvman.2021.113445
Zhang, Y. F., Li, S., Luo, T., and Gao, J. (2020). The effect of emission trading policy on carbon emission reduction: evidence from an integrated study of pilot regions in China. J. Clean. Prod. 265, 121843. doi:10.1016/j.jclepro.2020.121843
Zhang, Y. J., Sun, Y. F., and Huang, J. (2018). Energy efficiency, carbon emission performance, and technology gaps: evidence from CDM project investment. Energy Policy 115, 119–130. doi:10.1016/j.enpol.2017.12.056
Keywords: green finance, general equilibrium theory, carbon emission intensity, “economic-structural-technical” mechanism, multilevel heterogeneity analysis
Citation: Zhang T, Zhang Y and Zhang Y (2025) Green finance and urban carbon emission dual control: an empirical evidence from China. Front. Environ. Sci. 12:1503735. doi: 10.3389/fenvs.2024.1503735
Received: 29 September 2024; Accepted: 18 November 2024;
Published: 06 January 2025.
Edited by:
Haitao Wu, Hainan University, ChinaReviewed by:
Donghua Wang, East China University of Science and Technology, ChinaJilu Zhang, Henan University of Economics and law, China
Copyright © 2025 Zhang, Zhang and Zhang. This is an open-access article distributed under the terms of the Creative Commons Attribution License (CC BY). The use, distribution or reproduction in other forums is permitted, provided the original author(s) and the copyright owner(s) are credited and that the original publication in this journal is cited, in accordance with accepted academic practice. No use, distribution or reproduction is permitted which does not comply with these terms.
*Correspondence: Yao Zhang, emhhbmd5YW9AY3VnLmVkdS5jbg==
 Tian Zhang
 Yao Zhang*