- Department of Geographic Information Science, Wondo Genet College of Forestry and Natural Resources, Hawassa University, Wondo Genet, Ethiopia
This study investigated the historical and future trends of urban expansion and its subsequent impact on agricultural land-use in Hawassa city, Ethiopia. A time-series of remote-sensing imageries from Landsat Thematic Mapper for the years 1984, 1990, 2000, and 2010 and Operational Land Imager for 2021 were used to extract the LULC information from the study area. Seven major land-cover classes’ waterbody, built-up, agricultural land, wetland, grassland, woody vegetation, and agroforestry were identified with visual image interpretation along with supervised image classification techniques using the maximum-likelihood algorithm for the study years. The urban and agricultural lands were then extracted from the original LULC data to quantify the extent, rates, and number of area conversion between the two. The Land Change Modeler module of TerrSet software was used to predict the spatial extents of built-up and agricultural lands in 2030 and 2050. The results showed that there have been significant changes between the LULC types in Hawassa city within the past 37 years, from which built-up and agricultural land have shown the most prevalent changes. It showed that built-up land has increased from 584.73 ha in 1,984–3,939.03 ha in 2021, representing a 573.65% increase at an annual growth rate of 15.50%. However, agricultural land decreased from 8,324.64 ha to 3,595.68 ha in the respective years, with a 56.81% decrease at a rate of −1.54% each year. A total of 3,148.74 ha (37.82%) of agricultural land was converted into built-up land within the past 37 years (85.10 ha per year, a rate of 1.02%. The built-up land is projected to increase to 5,009.85 ha and 6,794.73 ha from 2021 to 2030 and 2050, with annual growth rates of 3.02% and 2.50%, respectively. In the same years, agricultural land will decrease to 2,849.58 ha and 2033.46 ha by 2.31% and 1.50% annually, respectively, from which 64.76 ha (1.80%) and 48.41 ha (1.35%) will be converted into built-up land, respectively. Future planning and development in the city should consider the rapid increase in built-up land toward agricultural land areas and develop appropriate adaptation mechanisms for the local community, which is highly dependent on agriculture.
1 Introduction
The dynamics of land use and land cover change (LULCC) are crucial drivers of global environmental change, contributing to ecological degradation, loss of biodiversity, and alterations in local climates and natural landscapes (Rimal et al., 2018). LULCC involves the conversion between different types of land use and stems from complex interactions between human activities and the natural environment. It significantly influences ecosystem processes, biological cycles, and biodiversity (Hamad et al., 2018; Hyandye and Martz, 2017; Liping et al., 2018).
Urbanization, a prominent and accelerating trend worldwide, is one of the most significant anthropogenic activities affecting LULCC (UN-DESA, 2015; Shi et al., 2016; Wu et al., 2010; Roy et al., 2021). This transformation involves a shift from rural to urban culture, characterized by an increase in urban populations, expansion of urban built environments, and establishment of urban landscapes, leading to changes in social structures and lifestyles (Chaolin, 2020; UN-DESA, 2019). However, there is no common universal definition of “urban,” as countries adopt different criteria to categorize urban and rural areas. As outlined by UN-DESA (2019) and Chaolin (2020), the level of urban expansion is often represented as the percentage of the population residing in urban areas, a statistic that has grown significantly over time. For instance, in 1950, approximately 29.6% of the global population lived in urban areas, which increased to 50.15% by 2007 and is projected to reach about 6.68 billion by 2050 (UN-DESA, 2019). UN-Habitat (2020) anticipates that within the next decade, all regions will experience increased urbanization, although highly urbanized regions will see slower growth. Less developed regions, particularly East Asia, South Asia, and Africa, are expected to witness the most substantial increases in urban populations, with India, China, and Nigeria projected to account for 35% of the global urban population increase from 2018 to 2050.
The patterns of urban expansion observed globally, characterized by rapid urbanization driven by economic growth, rural-to-urban migration, and infrastructural development; resonate closely with the situation in Hawassa City, where similar dynamics are at play. As seen in many developing regions, the influx of populations into urban areas in Ethiopia reflects global trends of urban agglomeration, which often lead to the conversion of agricultural lands into urban spaces, socio-economic stress, and cultural shifts. The rapid growth of urban populations has led to significant land consumption for urban development, resulting in the loss of prime agricultural land and posing challenges to food security (Pandey & Seto, 2015; Barati et al., 2015; Roy et al., 2022). In Ethiopia, approximately 80% of the rural population relies on agriculture for their livelihoods, constituting over 50% of the gross domestic product (GDP) and engaging more than 85% of the labor force, generating over 95% of foreign exchange earnings (Ayele and Tarekegn, 2020). However, agricultural land in peri-urban areas is increasingly being transformed into built environments due to horizontal urban expansion, adversely affecting land use value (Admasu et al., 2019; Ayele and Tarekegn, 2020). This trend is particularly evident in major Ethiopian cities such as Addis Ababa, Hawassa, Bahir Dar, and Mekele, where demand for urban land continues to rise (Dires, 2016; Roy et al., 2023a).
For effective sustainable development and natural resource management, timely and accurate information on land-use change patterns and urban expansion trends is essential (Das and Angadi, 2021). Remote sensing (RS) and Geographic Information Systems (GIS) are advanced technologies and essential for the comprehensive assessment, evaluation, and visualization of the spatial heterogeneity of urban environmental (ubham Roy a, 2022). These technologies provide critical historical datasets and depict an urban expansion trend that enables the decision makers to understand the environmental transformations and its impacts to prepare well informed monitoring plan alternatives (Lambin et al., 2001; Wu et al., 2016; Roy et al., 2023b). Multi-temporal satellite imagery has been used to analyze urban expansion patterns and model future changes (Pandey & Seto, 2015; Rimal et al., 2018; Zhong et al., 2011), offering valuable insights for urban planners and land use specialists regarding potential landscape alterations (Wu et al., 2006). Among various predictive models, the integration of the Land Change Modeler (LCM) with cellular automata (CA) and Markov chain models (CA-Markov) has proven to be particularly effective for simulating urban growth trends (Leta et al., 2021; Mohamed and Worku, 2020; Rimal et al., 2018; Sarkar and Chouhan, 2019).
This study investigates the historical trends of LULCC and urbanization in Hawassa City and their implications for agricultural land use. Using a time series of Landsat images from 1984 to 2021, this research also forecasts urban and agricultural land areas for 2030 and 2050 using GIS and RS analysis tools. Currently, LULCC poses significant environmental challenges. The rapid expansion of urban areas into agricultural and non-agricultural lands alters the physical landscape and contributes to complex social and economic issues. As one of the key aspects of LULCC, urbanization is an inevitable component of economic development, fundamentally changing the physical patterns of the environment (Barow et al., 2019; Belay, 2014; Majumder et al., 2023).
In Ethiopia, uncontrolled and illegal settlements in peri-urban areas are on the rise, leading to horizontal urban expansion and the consequent loss of fertile agricultural land. The increasing urban population in major cities such as Addis Ababa, Bahir Dar, Hawassa, and Mekele has intensified the demand for land for housing and infrastructure purposes in peri-urban areas, resulting in the transformation of agricultural land into urbanized spaces (Dires, 2016; Roy et al., 2024a; b). For example, Hawassa city has experienced rapid urbanization since its establishment; it expanded from approximately 48 ha in 1959 to over 4,044 ha in 2006, accompanied by a significant increase in population, estimated to be about 281,158 by 2015 (Admasu, 2015). This swift urbanization necessitates new urban land for various developments, including residential, commercial, institutional, industrial, and infrastructural projects, thereby prompting further land-use dynamics (Admasu, 2015).
In Ethiopia context as urban areas expand into previously fertile agricultural and non-agricultural lands, the transformation disrupts traditional land uses and exacerbates social issues, such as psychological distress and the erosion of cultural practices, as urban lifestyles increasingly encroach upon rural traditions. This growth, despite being a byproduct of economic development, threatens food security, exacerbates conflicts over land ownership, increasing migration towards urban areas in search of better economic opportunities and livelihood opportunities by reducing available cropland and limiting livestock rearing. Consequently, the Ethiopian experience underscores the urgent need for balanced urban planning that considers both development goals and sustainability to mitigate the adverse impacts of urban expansion. Consequently, land previously used for agricultural production and livestock farming is increasingly being converted for urban use. This shift exposes farmers to a range of challenges, including social issues like psychological distress, loss of traditional cultural practices due to the encroachment of urban culture, and economic setbacks stemming from reduced cropland availability, limited opportunities for livestock rearing, and diminished income sources (Dires, 2016).
Existing studies on urban expansion in Hawassa City have primarily focused on the spatial and economic aspects of growth, often overlooking the nuanced effects on agricultural land use and the social implications for local communities (Abate et al., 2021; Desta and Zeleke, 2020). While research has highlighted the quantitative loss of agricultural land due to urban encroachment, there is a lack of comprehensive analysis on the qualitative consequences, such as the impact on food security, traditional livelihoods, and local cultural practices, which are crucial for understanding the broader implications of urban sprawl (Mekuriaw and Gokcekus, 2019). By exploring these dimensions, my work aims to fill this critical gap, providing a holistic perspective that connects urban development with agricultural sustainability and social wellbeing, thereby enhancing stakeholders’ understanding and informing better land-use policies in the context of Ethiopia’s rapid urbanization.
Thus, knowledge of historical trends and rates of change among the different land cover types in the study area is essential for informed future planning and environmental management. Although various studies have investigated urban expansion patterns (Admasu, 2015; Gashu and Gebre-Egziabher, 2018), changes between different land cover types (Wondrade et al., 2014), and drivers of these changes (Degife et al., 2019) in Hawassa, previous research has not specifically addressed the extent of agricultural land loss due to urbanization or provided forecasts for future urban and agricultural land use in this area. To fill this research gap, this study analyzes the historical and future trends of urbanization and its impacts on agricultural land use by utilizing a time series of Landsat satellite imagery from 1984 to 2021 and forecasting potential developments for 2030 and 2050. This information will serve as a critical resource for urban land-use planning and the sustainable management of the urban environment in Hawassa city.
2 Materials and methods
2.1 Description of the study area
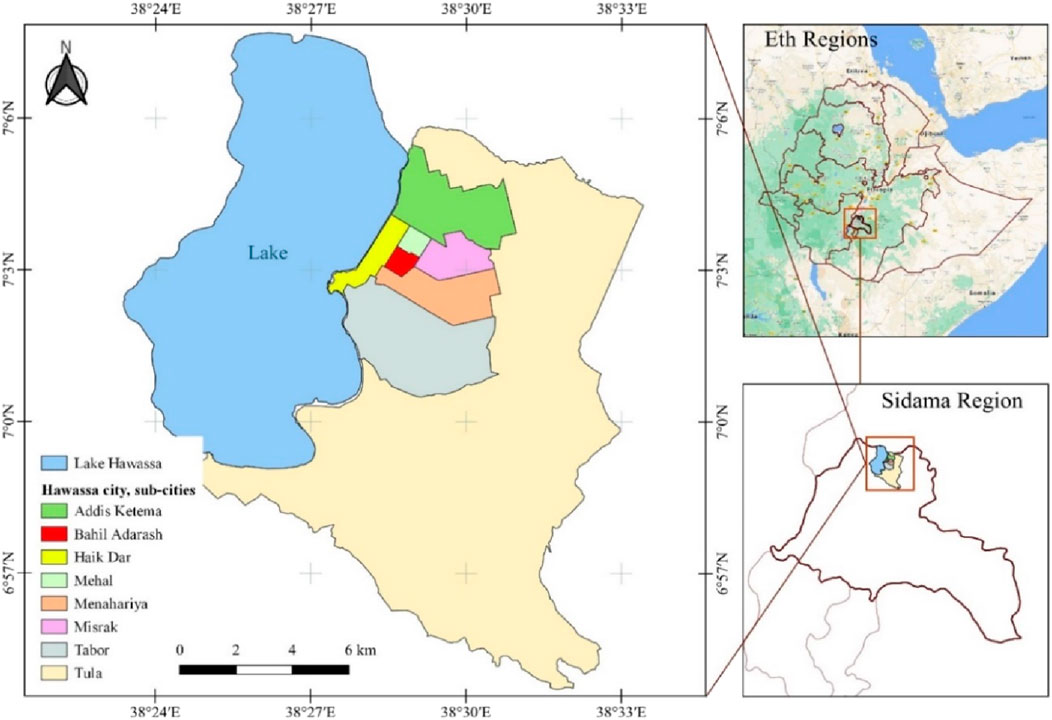
Hawassa city is located on the shore of Lake Hawassa (from which the name of the city was driven) on the fringes of the Great Ethiopian Rift Valley (Bekele, 2010). Hawassa city has been the capital of the Southern Nations, Nationalities, and People’s Region (SNNPR). Since June 2020, the city has been the capital of the Sidama Regional State. Hawassa city is located in the Southern part of Ethiopia along the Addis Ababa-Nairobi international highway at a distance of 275 km from the country’s capital, Addis Ababa, (Admasu, 2015). The city is located astronomically between 6054′42″N – 70 05′50″N latitude and 38024′51″E – 38033′25″E longitude. Hawassa city lies on a relatively flat plain in the rift valley topography, with an average elevation of approximately 1,690 m above mean sea level. Recently, the city has been structured into eight sub-cities, locally named “Kifle Ketema” (Figure 1): Addis Ketema, Bahil Adarash, Haik Dar, Mehal, Menharia, Misrak, Tabor, and Tula, and 32 Kebeles (Admasu, 2015). According to the 2020 Hawassa city administration boundary, the total area of the city is approximately 23,538.24 ha, which was used in the present study.
2.2 Methods of data collection
2.2.1 Data types and sources
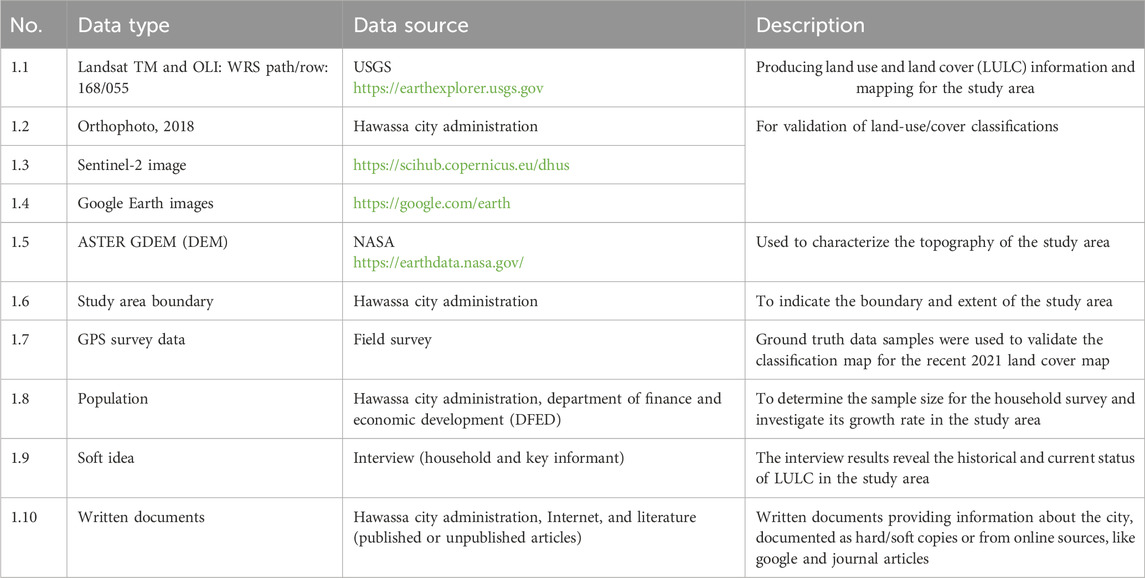
To carry out the research, different types of data from different sources were collected and used (Table 1). Data types used include time series Landsat Thematic Mapper (TM) and Operational Land Imager (OLI) images, Copernicus’s Sentinel-2 images from the European Space Agency (ESA), Orthophotos, DEM, Google Earth, Hawassa city boundaries, field survey data (GPS), population data, soft ideas, and related written documents.
2.2.2 Materials and analytical tools
Different materials and analysis software were used to carry out the research. Materials like handle GPS and field notebooks have been used to collect data during field observation. A computer with the necessary software installed was used for data analysis and report writing in the office.
Software like ArcGIS, QGIS, TerrSet, Kobo toolbox, and Microsoft Office were used as the major analysis and presentation tools for the study. ArcGIS was used to prepare variables for the prediction of future LULC and for accuracy assessment. Spatial variables like elevation, slope, distance to the city center, and distance from the road were prepared as input variables for the prediction using ArcGIS’s ArcMap program. In the accuracy assessment, a Frequency tool was used to compute the frequency of the reference and predicted land cover classes and combines them into a table of a matrix (error matrix table). QGIS was used to perform the image analysis processes and preparation of the final maps. Additional plugins such as the Semi-Automatic Classification Plugin (Congedo, 2021) were installed to perform image analysis and classification for producing thematic land cover classes from the source images. TerrSet (Eastman and He, 2020) software was used to predict future land cover in the study area.
2.2.3 Spatial data collection methods
The data used in this research were mostly from remote sensing data collected from secondary sources. The time series Landsat images for the study area were downloaded from the online data archives (Table 2) for each study year from 1984 to 2021 to generate the land cover information in the study area. Landsat TM for 1984, 1990, 2000, and 2010 and OLI and Sentinel-2 for 2021 were downloaded from USGS website, https://earthexplorer.usgs.gov. The base year, 1984, for the study was chosen in closer to the historical evidence of the city municipality establishment (Kinfu et al., 2019) and the availability of a medium resolution historical satellite image data to generate the land cover information. The devastating famine of 1984 triggered significant shifts in urbanization and land use patterns, as people migrated from rural areas to urban centers in search of relief and opportunities. This event served as a pivotal moment in Ethiopia’s development trajectory, shaping subsequent land management policies and practices. Following this, based on the political transformations, population growth, socio-economic development, and urban land supply and administration policy, a near 10 year gap land use and cover change was investigated for the years listed above.
Google Earth Pro and DEM data were also downloaded from their respective websites. Ortho-photographs and study area boundary data were obtained from the Hawassa city administration. A field survey was also conducted to collect some ground truth sample points using handle GPS for validation of the 2021 classification map as well as to get a general overview of the study area. The collection of GPS points was done randomly on the accessible land areas (except lake and swampy areas) within the study area. The sampling methods for ground truthing involved systematically selecting training sites based on stratified random sampling to ensure representation across different land cover types, while the final selection was guided by accessibility, variability in the landscape, and the availability of high-resolution imagery for accurate classification.
2.3 Data management and analysis
2.3.1 Data management
The data collected from different sources in different formats were combined into a structured folder in the form of a file database to facilitate the searching and use of the data for analysis. The datasets were stored in sub-folders according to their type and format for easy retrieval and analysis.
2.3.2 Analyzing the spatial datasets
2.3.2.1 Preprocessing images
Data collected from different sources can be in different file formats, coordinate reference systems, geometry, and radiometric conditions. Thus, these variations in the dataset must be corrected before use in any analysis. Satellite images acquired from different sources must be corrected for geometric and radiometric errors before use. The Landsat images used (Table 2) in this research were already corrected for these errors at the source, and these steps were skipped. In this study, the pre-processing steps applied to the images were the selection of bands and merging, clipping with the study area, and enhancing the image’s visual clarity. The selected bands for characterizing the land cover information were blue, green, red, near-infrared (NIR), and shortwave infrared (SWIR) bands (https://www.usgs.gov/faqs/what-are-best-landsat-spectral-bands-use-my-research; accessed on 03 September 2022). These bands were merged to form a single multi-band image and then clipped in the study area. The image scene for the study area was taken with a spatial reference system of the WGS 1984 datum and UTM Zone 37 N projection, and that of the study area was Adindan, UTM Zone 37N. To align the datasets correctly, the study area was projected into the image’s reference system (WGS 1984; UTM Zone 37N) with the same datum.
2.3.2.2 Analyzing land use and land cover patterns
The LULC pattern of the study area was obtained using a supervised classification technique with the maximum-likelihood classifier (MLC) in QGIS. In this process, training samples were collected for different land cover categories based on visual interpretation of the remote sensing images (Figure 2). The visual interpretation method was selected to identify and collect training samples for the land cover categories. These samples were then trained in software to perform the classification process. Approximately 10 different land cover classes were identified. Water bodies, built-up, agricultural land, wetland, grassland, woody vegetation, agroforestry, wet grassland, cultivated land, and open land are considered. These classes were later recoded into seven major land cover classes—waterbody, built-up, agricultural land, wetland, grassland, woody vegetation, and agroforestry (Table 3), to reduce the amount of error in the classifications using the assumptions of Congalton (1991).
Agriculture and cultivated lands are grouped into a common name, agriculture, where the former class indicates land with no crop cover and the latter class indicates crop cover, in the context of this study. Wetland and wet grassland were also grouped into the wetland class. Grass-dominated areas with a high degree of reflection as vegetation and smooth texture in the Cheleleka wetland were classified as wet grassland and later merged into the wetland class. Open and grassland land were merged into a common grassland class. This process was performed because medium-resolution Landsat images did not allow for the identification of correct and detailed land cover classes and types that were recorded in the images.
After the recoding process was completed, the r. neighbors grass tool in QGIS was used to remove unnecessary pixels from the classification results. A mode neighborhood operation with a 3 × 3 size was used to determine the most frequent value around the pixel and assign that value to the central cell (https://grass.osgeo.org/grass82/manuals/r.neighbors.html).
2.3.2.3 Accuracy assessment
Accuracy assessment was performed to identify variations that may have occurred between classification and reference sample data for each study year. Due to the complexity of digital classification, the reliability of the results must be assessed (Congalton, 1991). Accuracy assessment requires two things; one is the ground truth (reference) data and classification map data, to produce measures of the amount of error between them.
2.3.2.3.1 Reference data collection
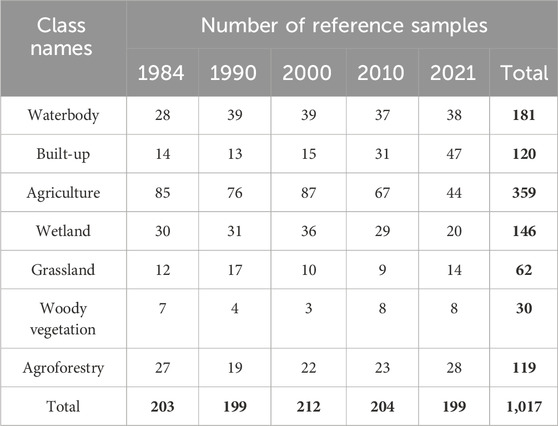
Reference samples were collected from all images used for classification to assess accuracy. Reference samples from 1984, 1990, 2000, and 2010 were collected from Google Earth images, Landsat image interpretations, field observations, and interviews conducted in 2021. For 2021, Google Earth images, Orthophotos, Sentinel image interpretations, field observations, and interviews were used as sources for collecting reference samples. Although it is recommended that a minimum of 50 reference sample sizes be required for each land cover category in the error matrix, the number may increase or decrease depending on the size of the area under study, the number of land cover categories and the relative importance of the categories (Congalton, 1991). Accordingly, the reference samples collected for each category varied (Table 4). A total of 1,017 reference sample points were collected for all study years to assess the accuracy of the classification maps for the study area.
2.3.2.3.2 Assessing classification accuracy
Using the classification results and reference data, the classification accuracy was determined by cross-tabulating the observed and classified map data. The class value of the classification map was extracted for each reference location, and the frequency of the class values from the reference data and the classified maps was computed in ArcMap. The reference class values, classified class values, and frequency fields were combined into an error matrix table form using the Pivot table tool in ArcGIS software. An error matrix table is the most common method of representing the accuracy of remote sensing data, using reference data as columns and classification data as rows (Congalton, 1991). The total accuracy, producer accuracy, user accuracy, and kappa values using the Equations 1–4 were calculated manually in Microsoft excel using the error matrix tables generated in ArcMap.
Where
The total, producer, and user accuracy results are presented as percentages.
2.3.2.4 Land use and land cover change analyses
Change analysis was performed between consecutive study years to characterize the pattern of changes and quantify the amount of land area changed from the older classification to the latter one in the QGIS environment. The changes were performed for 1984–1990, 1990–2000, 2000–2010, 2010–2021, and 1984–2021.
2.3.2.4.1 Percentage change (PC)
The percentage of change (PC) between the classes from the older year to the later year was computed using Equation 5 as the ratio of the difference between the final and initial year areas of a class to the initial year’s area of the same class.
Where
2.3.2.4.2 Annual rate of change (ARC)
The annual rate of change (ARC) for each LULC type was calculated using Equation 6 (Israel, 2013) using the data derived from the remote sensing analysis. It was computed as the proportion of the percentage change (PC) to the time interval between the first and second classification maps.
Where
2.3.2.4.3 Net change in area according to land cover types
The net change for each land cover type is computed using Equation 7 as the difference between the areas gained and lost by land cover class in each study year. The net change can be negative or positive. If the net change is negative, then the area gained is less than the area lost, indicating the loss of the area for that particular land cover type. Positive net change indicates that the area lost in the class is less than the area gained, indicating an increase or gain in the area of the land cover class between the study years.
The area gained in a land cover class is when the area from the other land cover classes in the older year classification is reduced to a class in the recent year classification, whereas an area loss occurs when the area of a class in the older classification is reduced to other land cover classes in the later year classification.
2.3.2.5 Analyzing urban expansion and agricultural land use trends
Urban and agricultural land use categories were extracted from the generated LULC information. LULC classes were reclassified into three classes, namely, other lands, built-up, and agricultural land, by recoding the original LULC data. The original classes like waterbody, wetland, grassland, woody vegetation, and agroforestry, were combined into a new class named other lands, and the remaining built-up and agricultural lands were left unchanged. These processes were performed for each year’s classification, the spatial patterns and trends of the built-up and agricultural lands were mapped, and their area extent was generated accordingly.
2.3.2.6 Predicting urban and agricultural land use
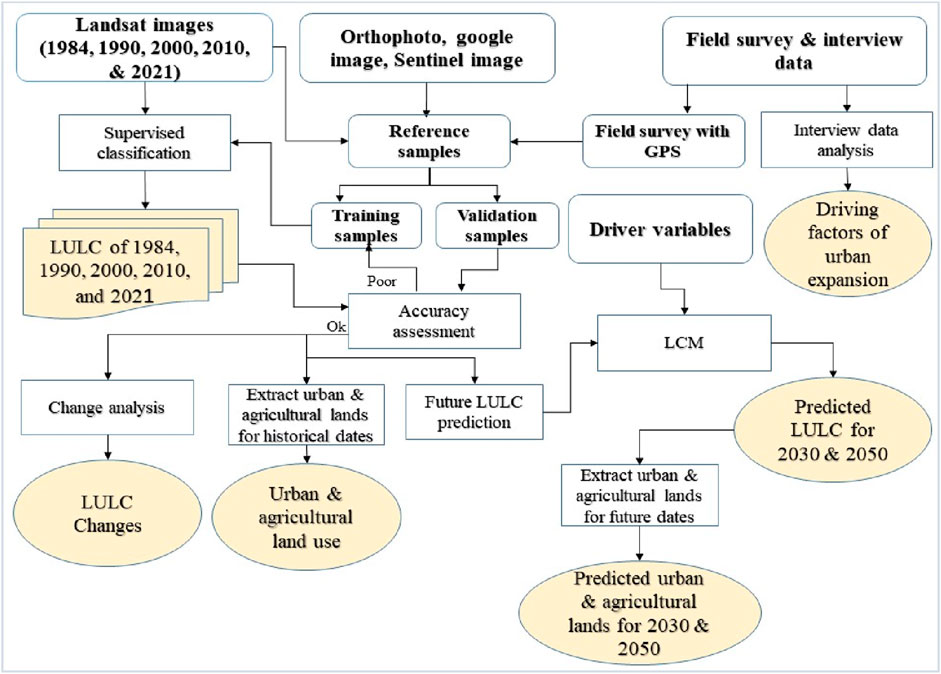
The land change modeler (LCM) module of TerrSet software (Eastman and He, 2020) was used to predict urban and agricultural lands for 2030 and 2050. LCM primarily uses a multilayer perceptron neural network-CA-Markov chain (MLPNN-CA-MC) approach to predict the future extents and patterns of LULC changes (Leta et al., 2021; Roy et al., 2024c). The model is strong due to its dynamic projection proficiency, suitable calibration, and ability to simulate several types of land cover (Leta et al., 2021; Rimal et al., 2020). The LCM was used to determine the transitions between the different LULC classes and predict future changes based on the historical changes between the time one and time two land cover classification maps (Eastman and He, 2020; Khawaldah et al., 2020; Rimal et al., 2020; Rimal et al., 2018). Three steps were followed (Figure 3). To perform land change prediction in LCM as an empirically driven process that moves in a stepwise fashion (Eastman and He, 2020): 1) Change Analysis, 2) Transition Potential Modeling, and 3) Change Prediction.
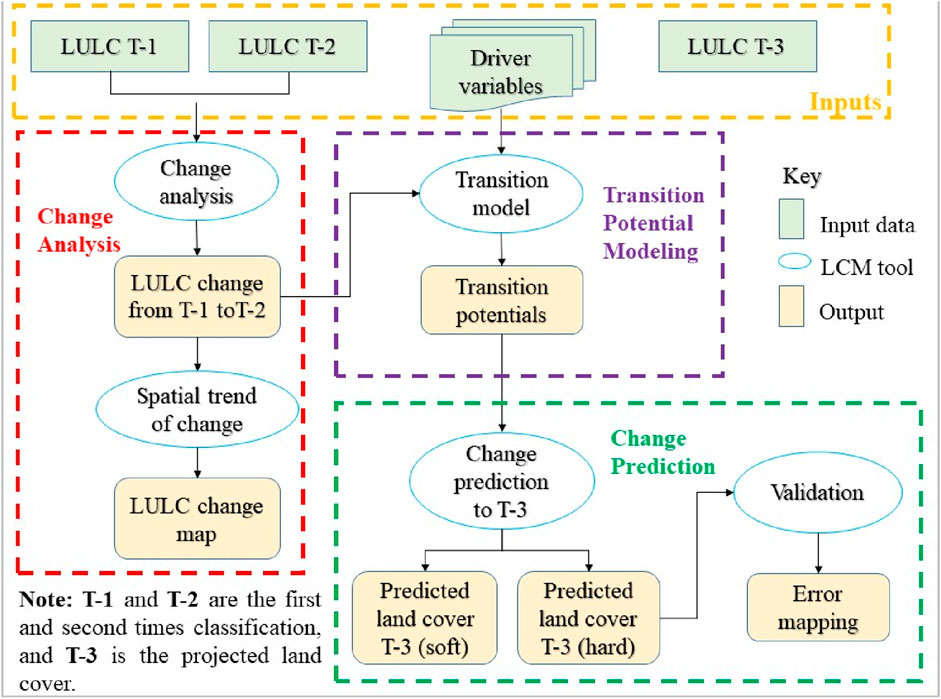
Figure 3. Generalized flow of prediction process using the LCM model Source: Adapted from Eastman and He (2020).
The combination of Land Change Modeler and Markov chain was selected due to their proven effectiveness in modeling land-use change, particularly in scenarios with complex dynamics. Alternative methods, such as cellular automata or artificial neural networks, were considered but deemed less suitable for this study due to their limitations in handling large datasets and complex interactions. While the chosen tools are powerful, it’s essential to acknowledge potential limitations, such as the sensitivity of Markov chains to historical trends. The CA-Markov model was selected for its effectiveness in simulating land-use changes by integrating cellular automata with Markov chains, allowing for a nuanced representation of urban dynamics; however, its limitations include potential oversimplification of complex urban growth patterns, reliance on historical data that may not account for unforeseen socio-economic factors, and the possibility of overestimating the predictability of future land-use changes in rapidly urbanizing settings and the need for accurate calibration of Land Change Modeler.
2.3.2.6.1 Change analysis
In this step, the changes/transitions between the different LULC types of time one and time two classification maps were performed. The proposed method determines the potential combinations between the two classification maps and produces a change map as the output. This approach also allows one to examine the contribution of changes as derived by one land cover category in the classification.
2.3.2.6.2 Transition potential modeling
The transition potential modeling step is where transition potential maps were generated, which are, in essence, maps of suitability for each transition. Here, a collection of transition potential maps is organized within an empirically evaluated transition sub-model that has the same underlying driver variables and is used to model the historical change process (Eastman and He, 2020; Roy et al., 2024d). The transition potential modeling tap of LCM helps group transitions into a set of sub-models and explore the potential power of explanatory variables. The variables can be either static or dynamic. Static variables are variables that do not change over time and are used to express basic suitability for the transition under consideration. Dynamic variables are time-dependent drivers such as proximity to existing development or infrastructure, and they are recalculated over time during a prediction (Eastman and He, 2020). In the context of this study, the variables used (elevation, slope, distance to road, and distance to city center) for the prediction were all assumed to be static.
2.3.2.6.3 Change prediction
The change prediction step in LCM uses historical rates of change and the transition potential model to predict future scenarios for a specified future date (Figure 3). It determines how the variables influence future changes and how much change occurred between time one and time two, and then calculates the relative amount of transition to the future date (Eastman and He, 2020; Roy et al., 2024e). The LCM change prediction produces two basic models of changes: hard and soft prediction models. The hard prediction model was based on a competitive land allocation model (Figure 3). The soft prediction yields a map of vulnerability to change for the selected set of transitions. The hard prediction yields only a single realization, whereas the soft prediction comprehensively assesses the change potential (Eastman and He, 2020).
2.3.2.6.4 Model validation
Validation of a model is significant before its use because it allows the quality of the predicted land cover to be determined compared to the actual land cover (Leta et al., 2021), although there is no consensus on the criteria used to assess the performance of land change models (Keshtkar and Voigt, 2016; Roy et al., 2024f). In the context of this study, the land cover maps of 2000 and 2010 were used to predict the land cover in 2021. The predicted maps were then compared to the actual land cover map of 2021 to determine the number of errors and quality of the prediction model.
3 Results and discussion
3.1 Historical trends of land cover change
3.1.1 Land cover extents and patterns in Hawassa from 1984 to 2021
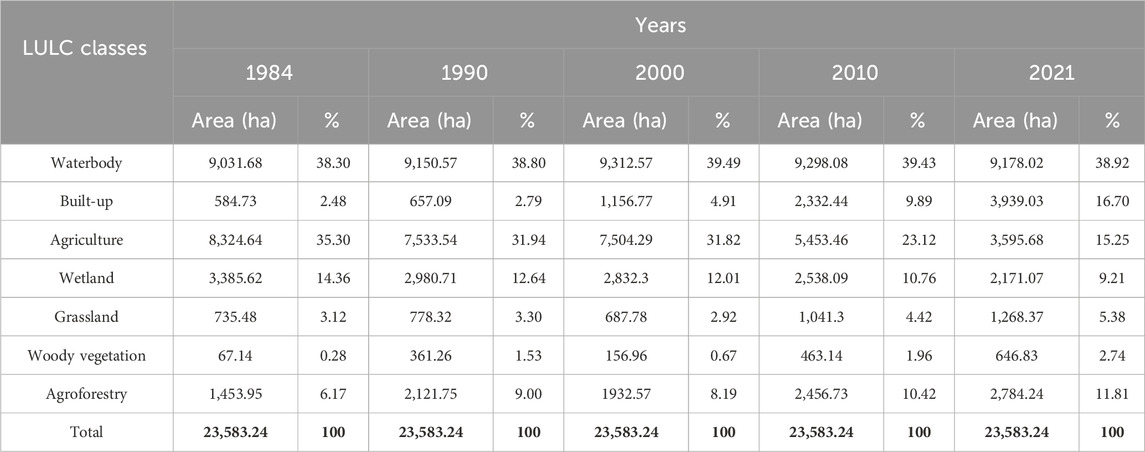
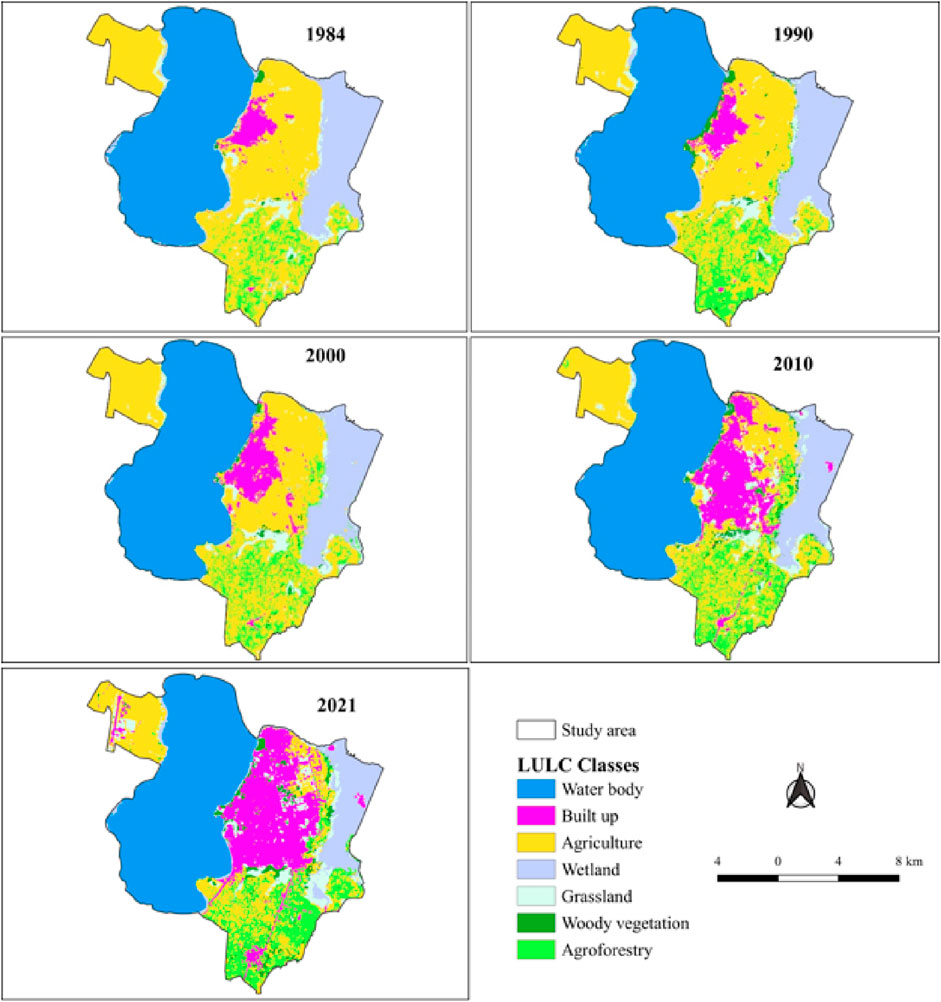
The results of the Landsat image analysis (Table 5; Figure 4) indicated that there has been a significant change in the pattern and extent of land use and land cover types in Hawassa between 1984 and 2021. Table 5 summarizes the area and percent cover generated from the Landsat image analysis. It showed that water bodies and agricultural lands covered the largest share (about 73.6%) of the land cover types investigated in the study area, which were about 38.3% and 35.3%, respectively, in 1984.
The largest coverage of water bodies was comprised of Lake Hawassa in the western part of the study area, as there was no other water body area detected in the images of the study area. The area coverage of the water bodies in 1984, 1990, 2000, 2010, and 2021 was reported to be 9,031.68 ha (38.3%), 9,150.57 ha (38.8%), 9,312.57 ha (39.49%), 9,298.08 ha (39.43%), and 9,178.02 ha (38.92%), respectively (Table 5). It increased from the beginning of the year until 2010 and then decreased by a small amount in 2021. Wondrade et al. (2014) found similar results for the increment of Lake Hawassa from 1973 to 2011 in their study on mapping land cover changes in the Lake Hawassa Watershed using multi-temporal remotely sensed image data. The reason for the increase in the lake water level was indicated an increase in runoff from the upper watershed as a result of excessive deforestation (Wondrade et al., 2014).
The major agricultural land area was the large-scale farms around Hawassa airport in the northwest and to the east of Lake Hawassa, and the fragmented smaller areas of the peasant’s farmlands were in the southern part of the study area. The agricultural land has been decreasing faster from 8,324.64 ha (35.3%) in 1984–3,595.68 ha (15.25%) in 2021 among the total land cover types in the study area. This trend was mainly due to the fastest expansion of built-up land driven by many pushing factors and to the expansion of agroforestry systems in the area.
Built-up land covered the least area next to woody vegetation, 584.73 ha (2.48%) in 1984. It has been increasing slowly from the date to 1990 (2.79%), increased by 0.31% within 6 years, but showed to increase very quickly (approximately one-half of the area in the previous year) starting from 2000 to 2021 (Table 5). These periods saw the formation of large settlements, higher development activities, and high informal settlements in the peripheral areas of the city. Higher development activities included the establishment of Hawassa University (main campus) and the establishment of Hawassa industrial park, to list a few, which occupied wider areas. Agroforestry has also shown an increase from 1,453.95 ha (6.17%) in 1984–2,784.24 ha (11.81%) in 2021. This was mainly due to the shifting of annual crop production systems into perennial cash crops like Enset and Khat in the rural Kebeles in the study area, which consume the largest agricultural cropland areas.
The amount of wetlands has also been decreasing in the study area. It was about 3,385.62 ha (14.36%) of the total land cover in the study area in 1984. This has gradually decreased to 2,980.71 ha (12.64%), 2,832.3 ha (12.01%), 2,538.09 ha (10.76), and 2,171.07 ha (9.21) in 1990, 2000, 2010, and 2021, respectively. This was due to the drying of the swampy area on the periphery as a result of climate change, which gradually changed into grassland, agricultural land, and built-up (2010 and 2021 maps in Figure 4) over time, resulting in a decrease in the total area of the wetland. The results were consistent with studies conducted in the Lake Hawassa watershed, which reported a decline in the wetland area (Degife et al., 2019; Wondrade et al., 2014).
Grasslands have also been shown to increase gradually over the study period. According to the image analysis results, 735.48 ha (3.12%) of the total land area in 1984 was covered by grasslands, mostly around the Alamura and Tabor mountains and along the boundary between the Cheleleka wetland and agricultural land, as shown in Figure 4. This increased to 1,268.37 ha (5.38%) in 2021. The area has gradually been increasing because of the drying of the Cheleleka wetland and the formation of open spaces through the reservation and fencing of agricultural land for construction or other purposes for a longer time. Woody vegetation has also been increasing in the study area from 67.14 ha (0.28%) in 1984 to 361.26, 156.96, 463.14, and 646.86 ha in 1990, 2000, 2010, and 2021, respectively. This was due to the formation of protected areas and/or parks, the establishment of green areas, and the planting of trees in institutional compounds within the city.
3.1.2 Rate of land use and land cover changes from 1984 to 2021 in Hawassa city
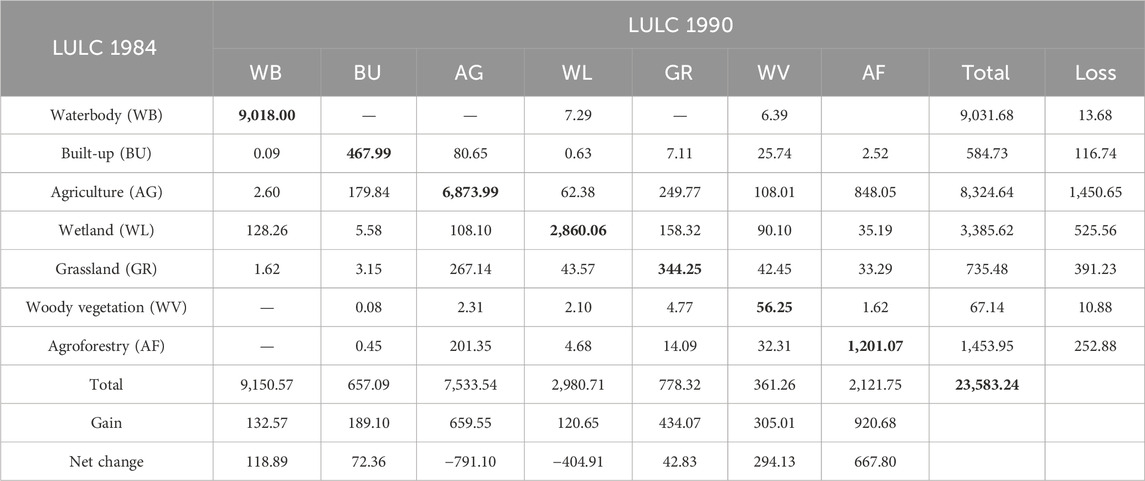
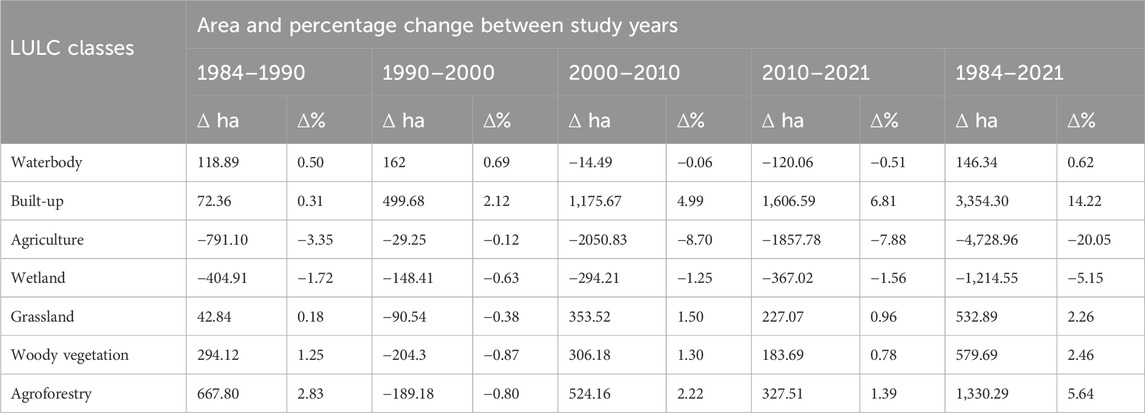
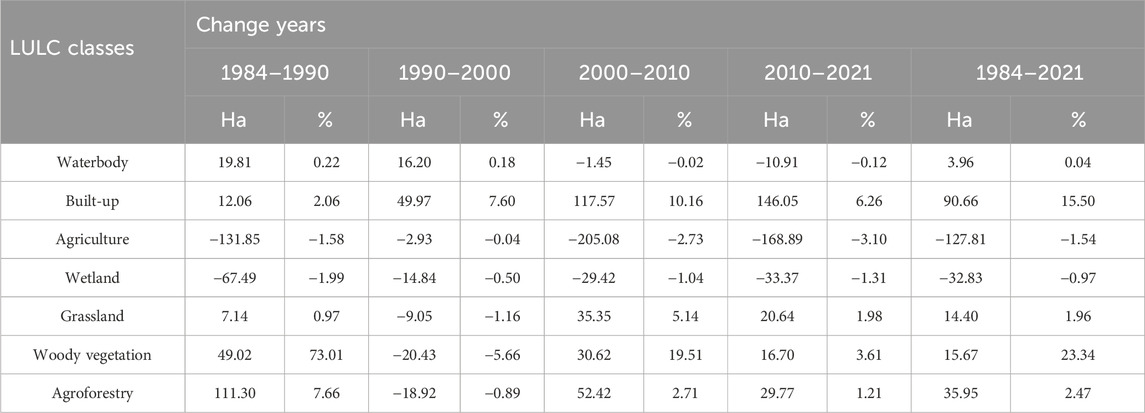
This section demonstrates the amount of area transition (Table 6) between the different categories that resulted in an increase or decrease in the spatial extents (Table 7) and patterns of change between the different LULC categories within the study years. Table 7 summarizes the amount of land area and percentage of change in each category between the years 1984–1990, 1990–2000, 2000–2010, and 2010–2021.
Water bodies, particularly Lake Hawassa, increased by 0.5% and 0.69% of the total land area from 1984 to 1990 and from 1990 to 2000, respectively, but decreased from 2000 to 2010 and from 2010 to 2021 by −0.06% and −0.51, respectively (Table 7). As shown in Table 6, water bodies gained a total of 132.57 ha from built-up (0.09 ha), agriculture (2.6 ha), wetland (128.26 ha), and grassland (1.62 ha) in 1990 and lost about 13.68 ha (7.29 ha into a wetland, and 6.39 ha into woody vegetation) in 1984, with a net gain of 118.89 ha (0.5%) of the total study area. In the same way, from 1990 to 2000, it gained a net area of 162 ha from the other land cover types. It has lost 14.49 and 120.06 ha in the years 2000–2010 and 2010–2021, respectively. The increase or decrease in the water body level might have been due to the increase or decrease in the water discharge from the upper watershed in the area as a result of the variability in the climatic factors in the area, which could require further investigation. The other possible reason is misclassification of the pixel values due to confusion between the spectral values with other land cover types and shadows in the images as a result of the spatial resolution of the images used for classification.
The amount of built-up land has been increasing between the study years. It increased by a net area of 72.36 ha (0.31% of the total land cover area) from 1984 to 1990 in 6-year intervals. The number increased to 2.12%, 4.99%, and 6.81% between 1990 and 2000, 2000–2010, and 2010–2021, respectively (Table 7). The net change in built-up land from 1984 to 2021 was approximately 3,354.30 ha (14.22% of the total area of the LULC types in the study area). It showed that the built-up land experienced a 6.7-fold increment during the study period (584.73 ha in 1984–3,939.03 ha in 2021) (Table 7). Built-up land gained its area from the different LULC classes, where agricultural land was the most changed and reduced from the other five.
Our current analysis identifies several primary factors driving urban expansion, including informal settlements, industrial development, and residential expansion. Notably, the urban growth pattern is characterized by horizontal development in all directions. The increase in built-up land in the study area can be attributed to population growth and a rising demand for land to accommodate various needs, such as housing, infrastructure services, industries and factories, institutional buildings, and other construction activities. This interconnected set of factors underscores the dynamic nature of urban development in the region. Classification error sources in remote sensing can significantly impact the reliability of results, particularly due to spectral confusion among land cover types and resolution limitations. Spectral confusion arises when different land cover types exhibit similar reflectance characteristics in certain spectral bands, leading to misclassification; for instance, vegetation types such as grassland and forest can appear similar in spectral signatures, making it challenging to accurately distinguish between them. Additionally, resolution limitations pertain to the spatial resolution of the imagery used; lower resolution can amalgamate various land cover types within a single pixel, resulting in further classification inaccuracies. These factors together complicate the land cover classification process and highlight the necessity for additional validation and refinement methods, such as supplementary ground truthing and the application of advanced classification algorithms, to enhance the reliability of the results obtained from remote sensing data.
Haregeweyn et al. (2012) found similar results of the increase in built-up land at the expense of agricultural land in their study in Bahir Dar on the dynamics of urban expansion and its impacts on land use/land cover change and small-scale farmers living near the urban fringe. Terfa et al. (2019) reported that the extent of major cities in Ethiopia (Addis Ababa, Adama, and Hawassa) have experienced significant changes from 1987 to 2017. It showed that the increment of the three cities was about 3-fold, 6-fold, and 6-fold during the study period (Terfa et al., 2019). A comparison of satellite estimates and census data in India, as reported by Pandey and Seto (2015), indicated that the conversion of agricultural land into built-up was largely concentrated in areas with high economic growth. The survey results also revealed that the rapid increase in the built-up area was due to the use of the city as a political center, improved basic infrastructure and utility services (road, water, electricity), educational and health services, population (birth and migration), and topographic and natural elements. Studies have witnessed a rapid increase in the city’s spatial extent (Admasu, 2015; Degife et al., 2019; Gashu and Gebre-Egziabher, 2018; Kinfu et al., 2019; Terfa et al., 2019; Wondrade et al., 2014) in the past few decades.
The potential ripple effects of the rapid conversion of agricultural land to urban uses in Hawassa’s economy could be considerable, as this trend threatens the livelihoods of many residents who depend on agriculture for their income and food security, potentially leading to increased poverty levels and economic instability if alternative employment opportunities within the urbanized areas do not materialize (Abate et al., 2021). Furthermore, this transformation is likely to exacerbate migration to other regions or urban areas, as rural populations facing land loss seek improved livelihoods and escape the socio-economic pressures stemming from diminished agricultural viability, mirroring trends seen in other rapidly urbanizing societies where rural disenfranchisement drives urban migration (Kebede & Gezahegn, 2021).
Agricultural land in the study area has been converted not only into built-up but also into other types of land cover. Next to built-up, the net conversion of agricultural land was to agroforestry, grassland, and woody vegetation from 1984–2021 with the respective area converted was 1,093.96 ha, 429.07 ha, and 275.78 ha. The highest percentage of change in agricultural land was observed between 2000 and 2010 (Table 8); approximately 2050.83 ha (8.7%) of the total land cover was changed into other land cover types. Between 1990 and 2000, the least agricultural land loss was 29.25 ha. In this period, agriculture gained much of the land area from other land cover types like grasslands. In general, the net loss of agricultural land from 1984 to 2021 was −4,728.96 ha, representing 20.05% of the total land cover.
Wetlands have also been decreasing each year and are being converted into other land cover types, such as grassland, agriculture, built-up, and agroforestry. Approximately 404.91 ha of wetland was lost between 1984 and 1990, from which 158.32 ha and 108.10 ha were converted into grassland and agricultural lands, respectively. A large conversion of the wetlands into grasslands was observed between 2000 and 2010 and between 2010 and 2021, which was 177.68 ha and 293.84 ha, respectively. The net area lost from 1984 to 2021 was about 1,214.55 ha, or 5.15% of the total area. Wondrade, Dick, and Tveite (2014) found similar results of a decrease in the wetland in the area that arises as a result of climate change, as discussed in other studies (Terfa et al., 2019; Wondrade et al., 2014).
On average, agroforestry increases within the study period. A net area of 1,330.29 ha of land was gained by agroforestry from other land cover types, such as agriculture, wetland, and grassland from 1984 to 2021. This is due to the conversion of croplands into perennial cropping systems in the area, which covers open land areas with perennial crops such as Khat and fruit trees.
3.1.3 Rate of changes in land use and land cover in Hawassa city
As presented in Table 8 the annual rate of change for each LULC category in the study area was computed. As presented in the table, agriculture and wetlands decrease each year in the study area from 1984 to 2021. The largest loss of agricultural land was observed in the years from 2010 to 2021, where approximately 168.89 ha (3.10%) of the land was lost each year, and the least was observed from 1990 to 2000, where only 2.93 ha (0.04%) was lost each year. From 2010 to 2021, the highest expansion of built-up (expansion of settlements) has been experienced, and large investments have taken place, like Hawassa industrial park. The least loss of agricultural land from 1990 to 2000 indicates the net loss of agricultural lands because it gained a large amount of land area from other land cover types like grassland and agroforestry, over the years (Table 8). Thus, approximately 127.81 ha (1.54%) of agricultural land was lost each year from 1984 to 2021 in Hawassa city. On the other hand, wetlands have been decreasing by 67.49 ha (1.99%) each year between 1984 and 1990, and this change were slowly decreasing until 2021. The net loss of the wetland, as shown in Table 8, from 1984 to 2021 was approximately 32.83 ha (0.97%) each year for the last 37 years, and the reason for the decrease in the wetland area is discussed in the previous sections.
Built-up was the only class in the study area that showed the fastest rate of change, particularly increased, in the study years. It has been increasing at a rate of 12.06 ha (2.06%) since 1984 to 1990 and increased to 49.97 ha (7.60%), 117.57 ha (10.16%) and 146.05 ha (6.26%) each year between 1990 and 2000, 2000 and 2010, and 2010 and 2021, respectively. Within the past 37 years, built-up land has been increasing at a net annual rate of 90.66 ha (15.50%). Water bodies have also increased at a rate of 0.22% and 0.18% each year from 1984 to 1990 and from 1990 to 2000, respectively, but have decreased from 2000 to 2010 and from 2010 to 2021 at a rate of 0.02% and 0.12% annually, respectively.
Grassland, woody vegetation, and agroforestry lands have also shown increasing rates from 1984 to 1990 and from 2000 to 2021 but decreasing rates in the years between 1990 and 2000 in the study area. Between 1990 and 2000, these LULC classes lost much of their area to agricultural lands than they gained in the years, resulting in a net loss of the area among the categories. From 1984 to 2021, annual rates of approximately 1.96%, 23.34%, and 2.47% changes in grassland, woody vegetation, and agroforestry, respectively, were determined (Table 8) by image analysis in Hawassa.
3.1.4 Accuracy assessment of classifications
Based on the reference samples collected and the classification maps, the accuracy report showed that the total accuracy of all maps in each year ranged from approximately 89%–93% and kappa ranged from 0.86 to 0.92. However, the total accuracy does not represent the errors in each category in the classification maps. The error amounts in each category were reported using the producer’s and user’s accuracy. The producer’s accuracy can be determined according to the interest of the map producer in how a certain area is classified or mapped, while the user’s accuracy can be determined from the point of view of the map user to indicate the probability that a pixel classified on the map represents that category on the ground (Congalton, 1991). For example, the producer accuracy of the 1984 classification was approximately 71.43%, whereas the user accuracy was 100%. This result can be interpreted as follows. Although 71.43% of the woody vegetation was classified on the map, 100% of the woody vegetation was actually as such on the ground.
Similarly, in 2010, the error matrix table showed that although the producer of this map can claim that 100% of the time an area that was grassland was identified as such, a user of this map will find that only 69.23% of the times will an area he/she visits that the map says is grassland will be grassland. The errors that occurred in the maps were because some pixels that were categorized into different/same land cover classes may have different/similar spectral reflectance, which makes it difficult to classify (Wondrade et al., 2014).
Agricultural land may be confused with open land classified as grassland. The accuracy of classification may also affected by the spatial resolution of the image used. High-resolution images can produce highly accurate land cover information for an area because they record every detail on the land. However, medium-resolution images can produce information that reveals the changes in LULC types over time but with fewer details.
3.2 Impacts of urban expansion on agricultural land
3.2.1 Historical trends in urban expansion and their effects on agricultural lands
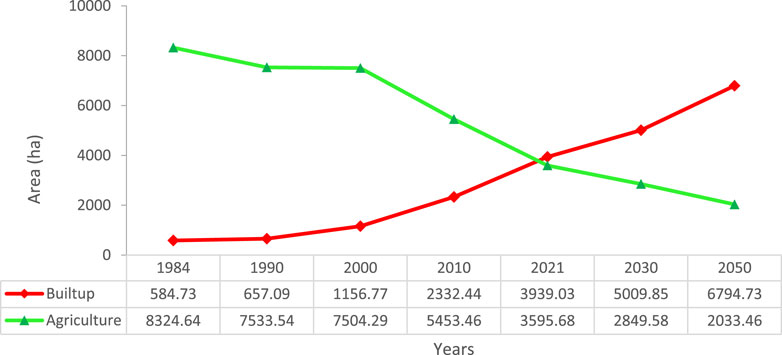
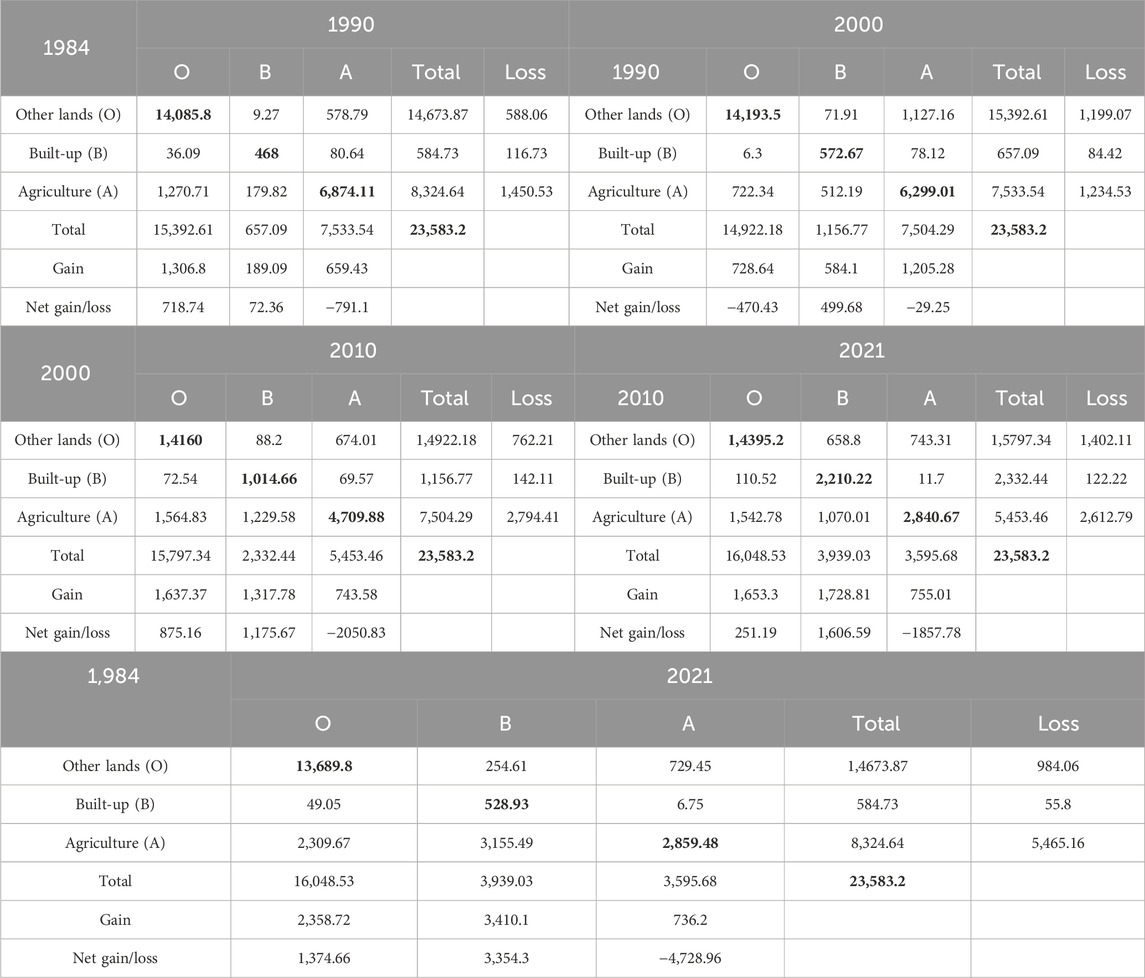
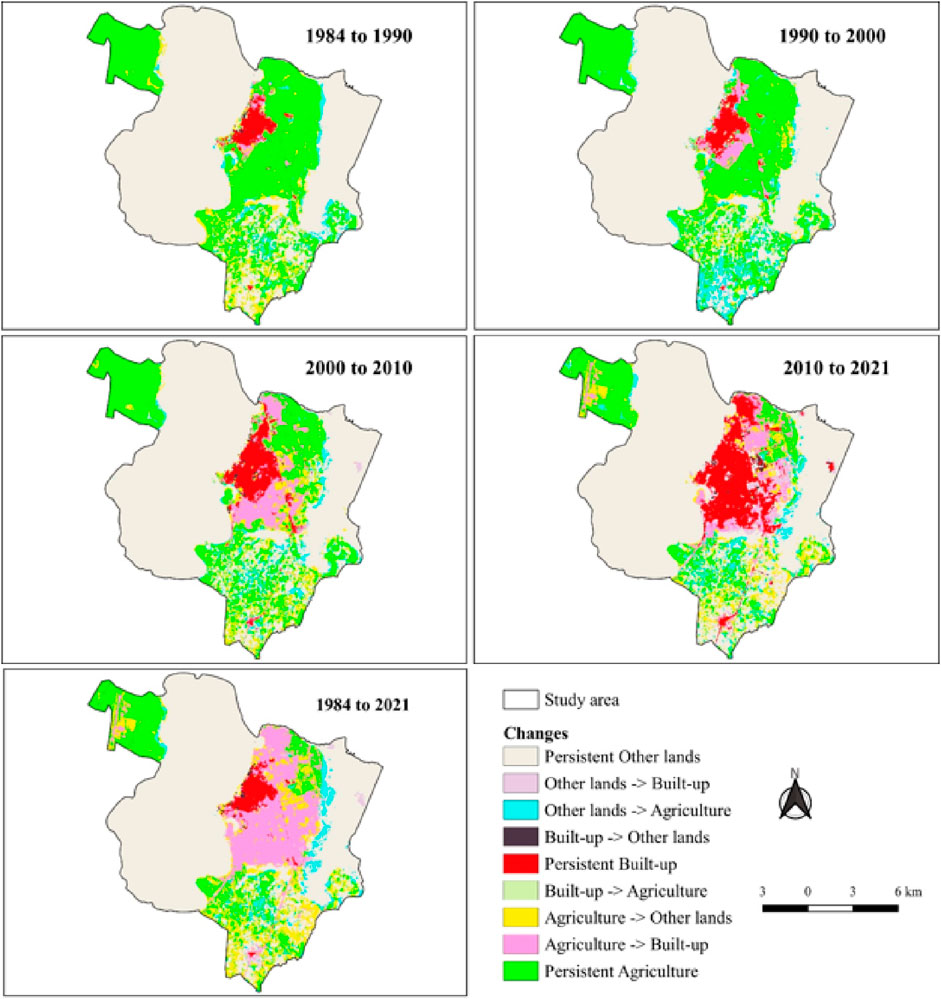
The analysis of satellite imagery in the study area revealed a highly increasing trend of urban expansion, largely at the expense of agricultural land area, between the study years in Hawassa (Figure 5). In 1984, only 584.73ha (2.48%) of the total area was covered by built-up, whereas agricultural land covered 8,324.64 ha (35.30%) in the year. However, in 1990, 2000, 2010, and 2010, built-up increased to 2.79%, 4.91%, 9.89, and 16.70%, respectively, whereas a decrease in agricultural land in the same respective years (31.94%, 31.82%, 23.12, and 15.25%). The spatial patterns and trends of changes between the two land use types are shown below. As summarized in the change matrix table (Table 9), built-up land gained a large amount of agricultural land in between the study years. This means that the largest amount of agricultural land was lost due to expansion in the built-up area. From 1984 to 1990, a net change of 99.18 ha of agricultural land was converted into built-up, which increased to 434.07 ha, 1,160.04 ha, and 1,058.31 ha between the years 1990–2000, 2000–2010, and 2010–2021, respectively. A total of 3,148.74 ha (13.35%) of agricultural land was converted into built-up within the past 37 years of the study period. The expansion of the built-up was restricted to the northeast, east and southeast because Lake Hawassa is located in the western part of the study area (Terfa et al., 2019), which prevented the built-up area to expand to the western part from the center.
Historical evidence indicates that the total area of built-up land in the city was 48 has in 1959 (Admasu, 2015), where 404 pensioned soldiers from different parts of the country (Addis Ababa, Harar, Korem, and Wukro) were given land to settle in the eastern part of Hawassa Lake during Haile Selassie, according to the elders and socioeconomic profile of Hawassa city (2020). This was the time where the prime agricultural land in Hawassa has started to be converted into housing units to serve the housing needs of the people.
This initial stage of the city has gradually been consuming large amounts of agricultural land for housing, industries, and other infrastructure services to serve the population of the city, resulting in the current status of the city. The rapid increase of the city’s population results in the need for housing, social services, infrastucture development, and socio-economic changes. In areas of weak government control, these results in an increasing informal settlemtnts and urban sprawl, with faster horizontal expansion of the built-up lands. This inturn consumes the larger agricultural lands, and leads to shorter food security.
Urban expansion affects local livelihoods and food security by often leading to the encroachment of agricultural lands, displacement of communities, and increased competition for resources, thereby highlighting the urgent need for policies that integrate sustainable urban planning with the preservation of livelihoods and agricultural practices to ensure resilient and food-secure urban environments.
Studies on urban land use dynamics have witnessed an increase in urban expansion in the main cities of Ethiopia (Fenta et al., 2017; Haregeweyn et al., 2012; Jenberu and Admasu, 2020; Terfa et al., 2019; Terfa et al., 2020), which results in the loss of major agricultural lands and mainly affects food security (Muchelo, 2018), particularly in countries like Ethiopia, where the majority of the people depend on agricultural products (Terfa et al., 2020). The increase in urban area reduces the available agricultural land area, which has seriously impacted peri-urban farmers, who are often left with little or no land to cultivate and thus have increased vulnerability (Ayele and Tarekegn, 2020). Wondrade et al. (2014), in their reports on the mapping of land cover changes utilizing multi-temporal remotely sensed image data in Lake Hawassa Watershed, claimed that about 70% of the cropland was converted into built-up due to the expansion of residential, industrial, and other infrastructures, including the occupation of public lands by residents, favorable economic conditions, and a rapid construction process.
According to the study results of (Dadi et al., 2016) presented in (Ayele and Tarekegn, 2020), on the major drivers of urban sprawl and their impacts on land use conversion in the peri-urban Kebeles of Dukem town, Ethiopia, it was shown that the available land to grow wheat and teff flour had declined from 2005 to 2011. It showed that wheat land declined from 230.82 km2 in 2005 to 104.82 km2 in 2011, whereas teff flour shrunk from 134.77 km2 to 93.67 km2 in the same period.
Field observation and household survey reports also showed that large amounts of agricultural land in the study area were lost due to the high expansion of urban built, which arose due to high population growth (birth and rural-to-urban migration), infrastructure services, economic development, which aligned with Pandey and Seto (2019), and the formation of the city as a regional center. Muchelo (2018) stated that urban population growth in Sub-Saharan Africa exerted more pressure on agricultural land in the peripheral areas of cities. The majority of rural migrants in Sub-Saharan Africa prefer to settle in peri-urban areas to engage in farming for survival, where the cost of living is lower and attainment of a home is much more rapid than in completely urban areas (Muchelo, 2018). These facts, along with the economic development of a city, result in a change in the LULC, particularly in the consumption of large agricultural lands for building purposes.
3.3 Modeling future trends of urban expansion and agricultural land (2030 and 2050)
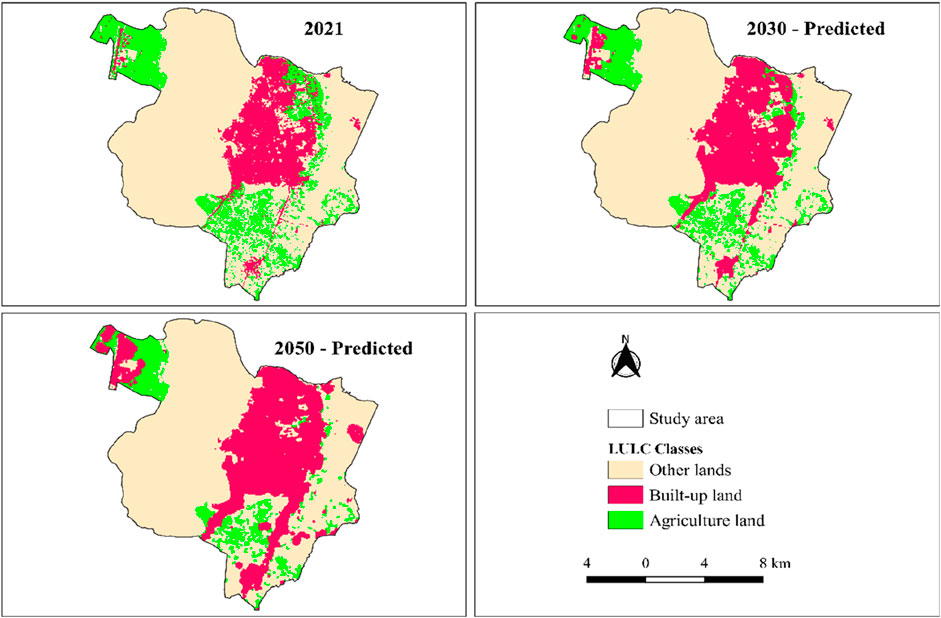
Future trends and extents of the Urban and agricultural lands for 2030 and 2050 were projected using TerrSet software with the LCM module. The 2021 classification image was used as the basis for prediction (Figure 6). The spatial extent of built-up agricultural lands for the prediction years (2030, and 2050) was shown in Figure 7. It was projected that the built-up land will cover an area of about 5,009.85 ha (21.24%) and 6,794.73 ha (28.81%) of the total land area in 2030 and 2050, respectively. The change matrix report in Table 10 shows the possible land cover types that will contribute to the increase in built-up land area during the study years. Of the LULC types, agricultural land accounts for the largest part of the area. As presented in Table 10, built-up land will gain a total of 1,070.82 ha (4.5%) from 2021 to 2030 and 2,855.7 ha (12.1%) from 2050, from which 582.84 ha (2.5%) and 1,403.91 ha (6%) will come from agricultural land, respectively. During the same period, agricultural land will lose a total of 746.1 ha (3.2%) and 1,562.22 ha (6.6%), respectively. The land area will be reduced from 3,595.68 ha in 2021–2,849.58 ha in 2030 and 2033.46 ha in 2050, which will cover a small area in the study area (Figure left). Mohamed and Worku (2020) simulated urban land use and cover dynamics in Addis Ababa and proved that an increase in built-up land consumes ecologically valuable natural landscapes such as waterbodies, forests, mixed woodland, and cropland, which will continue at the expense of the loss of these landscapes. Global projections of urban expansion indicate that urban land cover in Sub-Saharan Africa will expand at the fastest rate (Angel et al., 2011). According to Angel et al. (2011), urban land cover in the region will expand by more than 12-fold between 2000 and 2050. According to the report, the projected rate of increase in urban land cover will be higher than the rate of increase in the urban population because urban population densities can be expected to decline.
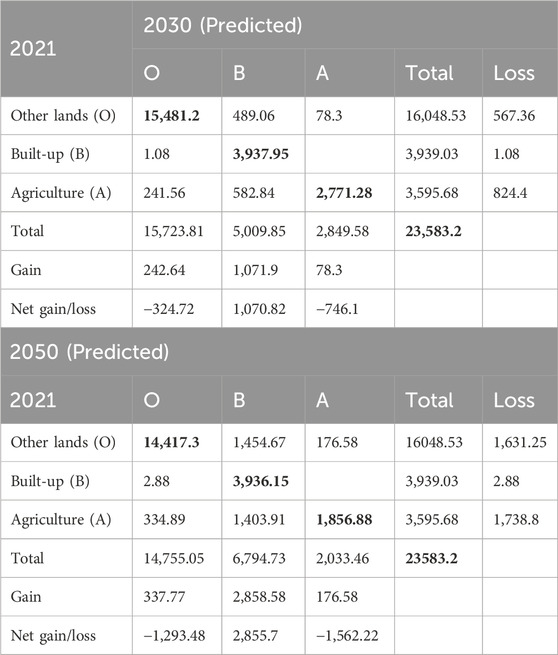
Table 10. Transition matrix table for the future built-up and agricultural land use changes from 2021 to 2030 and 2050.
3.3.1 Validation report of the prediction
In comparing the area reports of the actual and simulated land cover maps for 2021 (Table 11), it was found that there was a small variation within the area of the same class in both maps. A less effective simulation was observed for built-up and agricultural land because these land cover types change faster in actual situations.
Agreement between the actual and simulated land cover in 2021 was determined using the kappa indices (Kno, Kstandard, and Klocation) in this study. Kno is the measure of the overall proportion of pixels correctly classified versus the expected proportion correctly classified with no ability to specify quantity or location, Kstandard is the proportion assigned correctly versus the proportion that is correct by chance (measure of the ability of the simulated layer to attain perfect classification), and Klocation is the measure of spatial accuracy due to the correct assignment of values that also validate the location between the actual and simulated maps (Keshtkar and Voigt, 2016; Zadbagher and Becek, 2018). The results of the three indices were measured to be all above 70% (Kno = 0.75, Kstandard = 0.73, and Klocation = 0.77), The standard kappa index of the which means that the model is valid with substantial agreement strength (Leta et al., 2021; Zadbagher and Becek, 2018) and, hence can be used for predicting the 2030 and 2050 land cover of the study area. The statistical range of the three indices ranged from 0 (random location) to 1 (perfect location), (Keshtkar and Voigt, 2016; Zadbagher and Becek, 2018).
The kappa indices presented in the study provide strong evidence of the model’s accuracy in predicting land cover change. Specifically, Kno, Kstandard, and Klocation values of 0.75, 0.73, and 0.77, respectively, indicate that the model’s performance significantly surpasses random chance and accurately captures both overall classification and spatial patterns. While these indices confirm a high level of confidence in the projections, stakeholders should also consider the potential limitations of the model and the uncertainties inherent in long-term planning. By understanding these factors and conducting scenario analysis, stakeholders can effectively use the projections to inform decision-making related to land use, infrastructure, and environmental conservation.
3.3.2 Rates of future urban and agricultural land use changes
The rate of change in urban and agricultural land was computed from the data generated from the analysis of the remote sensing images. The percentage of change (PC) (Table 12) and annual rate of change (ARC) (Table 13) were computed for urban and agricultural land use types from 1984 to 2021, 2021 to 2030, and 2050 predictions. The results showed that PC (Table 12) in urban and agricultural lands increased faster but in opposite directions (increasing in the urban area, whereas decreasing in agricultural lands). Built-up land increased by approximately 12.37% from 1984–1990 to 76.04%, 101.63%, and 68.88% from 1990–2000, 2000–2010, and 2010–2021, respectively. In contrast, agricultural land decreased within the respective years by 9.5%, 0.39%, 27.33%, and 34.07%. The highest percentage of changes in built-up land (101.63%) was observed between 2000 and 2010, when a large amount of agricultural land was converted into built-up (Figure 8). On the other hand, the lowest percentage of change (0.39%) in agricultural land was observed in 1990–2000, where only 29.25 ha of the land was lost. Between 1990 and 2000, agricultural land gained much of the lands from other land cover types like agroforestry and grasslands than it lost during these periods, which resulted in a smaller rate of change between the years.

Table 13. Annual rate of change [area (ha) and %] in built-up and agricultural lands from 1984 to 2050.
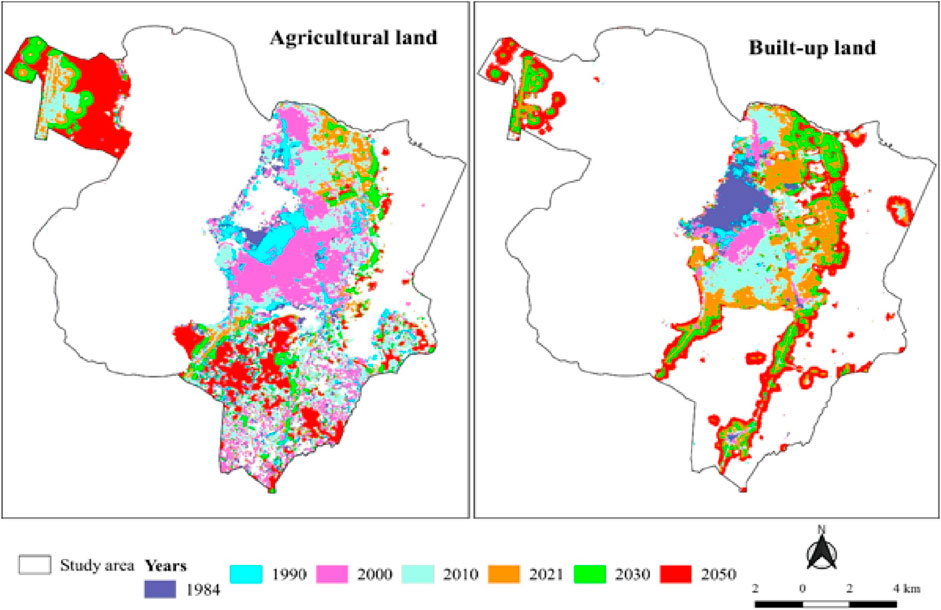
Figure 8. Spatial trends of agricultural land (left) and urban built-up area (right) from 1984 to 2050.
The results show that in the study years, built-up land has increased at a faster rate each year. As presented in Table 13, the annual rate of change in built-up land between 1984–1990, 1990–2000, 2000–2010, and 2010–2021 was reported to be about 2.06% year−1, 7.60% year−1, 10.16% year−1, and 6.26% year−1, respectively. In contrast, agricultural land has been declining in the respective years at rates of 1.58, 0.04, 2.73, and 3.10% each year (Figure 8). Between 1984 and 2021, built-up land increased by 3,354.3 ha, which increased by 90.7 ha year−1 at a rate of 15.5% each year. On the other hand, agricultural land decreased by 4,728.96 ha, which has been decreasing by 127.8 ha each year at a rate of 1.54%.
Field observation and survey reports revealed that a high expansion of the built-up area in Hawassa City was observed from 2000 onward. Terfa et al. (2019), in their study on the characteristics, spatial patterns, and driving forces of urban expansion in Addis Ababa, Adama, and Hawassa from 1987 to 2017, Ethiopia, reported that the annual expansion of Hawassa city from 1987–1995, 1995–2005, and 2005–2017 was about 0.65, 0.9, and 1.57 KM2, respectively, which aligns with the results presented in this study, although the dates selected for the study are different.
As shown in Table 12, it is expected that approximately 1,070.82 ha (27.18%) and 2,855.7 ha (72.50%) changes in the area of built-up land will take place from 2021 to 2030 and 2050. Between the same respective years, about 119.0 ha (3.02%) and 98.5 ha (2.50%) changes will occur annually (Table 13), increasing the total area of built-up land. At the same time, 746.1 ha (20.75%) and 1,562.22 ha (43.45%) agricultural land changes (loss) occur at a rate of 2.31% and 1.5% each year, respectively. From this, 64.76 ha (1.8%) and 48.41ha (1.35%) of the annual agricultural land loss are expected to change to built-up land, respectively.
The projection of the built-up and agricultural land changes was drawn based on the existing situation during the study. However, the rate of change in the projected land areas would increase or decrease based on the external factors such as urban land administration and use policies, climate changes, industrial development, and social transformations. For instance, if rural-to-urban population migration decreases and the government implements vertical growth, the consumption of the land for horizontal built-up will be slower.
Studies on urban land prediction have reported a significant increase in the urban built-up area in selected cities worldwide (Aburas et al., 2016; Bose and Chowdhury, 2020; Mohamed and Worku, 2020; Sarkar and Chouhan, 2019; Wu et al., 2010). The analysis results of Sarkar and Chouhan (2019) in the Siliguri Metropolitan Area, West Bengal, indicated that built-up areas (urban) have increased very rapidly, and this sudden growth in the built-up area is also causing a decrease in agricultural land and forest cover. It showed that built-up land increased from 2.18% in 1991 to 13.71% in 2017, whereas agricultural land decreased from 32.53% to 23.13% in the same years. The projected results of the authors for the built-up and agricultural land from 2017–2033 and 2033–2043 was 5.4% and 7.07%, and −3.83% and −7.36%, respectively. Although future LULC prediction research is limited to Ethiopia, Mohamed & Worku, 2020 projected the urban LULC dynamics of Addis Ababa and the surrounding area and reported that built-up land continuously increased over time with the decline of other land cover types, like cropland and forest. It increased from 3.7% in 2005 to 7.0% in 2015 and is expected to increase to 9.6% and 11.9% in 2025 and 2035, respectively.
Angel et al. (2011) based on the global projection of urban expansion from 2000 to 2050 indicated that the projections will be a function of urban population growth and density change. Although the world urban population is expected to increase from 3 billion in 2000 to 5 billion in 2030 and 6.4 billion in 2050, the rate of increase is expected to slow down from 2% per annum in 2000 to 1.65 in 2030 and 1.14% in 2050, and the rate of urban population growth in less developed countries will be five times faster than in more developed countries (Angel et al., 2011). According to the report, urban land area in less developed regions is expected to grow from 297,048 km2 in 2000 to 767,226 km2 in 2030 and 1,233,461 km2 in 2050 by about 158% and 315%, respectively.
To address the challenges posed by rapid urbanization and the consequent loss of agricultural land in Hawassa, implementing more structured urban planning that prioritizes the protection of designated agricultural zones could prove beneficial. Establishing clear land-use policies that delineate urban boundaries while conserving key agricultural lands can help safeguard food security and sustain local livelihoods. Additionally, incorporating mixed-use development strategies that integrate residential, commercial, and agricultural uses may promote sustainable growth and enhance the resilience of the community. Engaging local stakeholders in the planning process ensures that policies reflect the needs and perspectives of those most affected, ultimately fostering a balanced approach to urban development that accommodates growth while preserving essential agricultural resources (Desta & Zeleke, 2020).
4 Conclusion
The application of GIS and remote sensing technologies is essential for effectively monitoring land use and land cover (LULC) changes over time, providing valuable insights into environmental dynamics. Historical remotely sensed satellite images play a crucial role in this process, with the Landsat satellite offering global coverage at a medium resolution (30 m) since 1972. In contrast, Sentinel images, while providing higher resolution (10 m) since 2015, lack the comprehensive historical data necessary for long-term analysis. Furthermore, incorporating field visits and visual interpretation enhances digital image classification accuracy, while the land change modeler (LCM) tool enables predictions of future LULC changes by analyzing key geographical variables such as slope, elevation, and proximity to urban centers and main roads. Our analysis reveals that there have been significant changes between the LULC types in Hawassa city within the past 37 years, from which built-up and agricultural land have shown the most prevalent changes. It showed that built-up land has progressively increased from 584.73 ha in 1984–3,939.03 ha in 2021, however, agricultural land decreased from 8,324.64 ha to 3,595.68 ha in the respective years. This implies that there is a rapid urbanization in Hawassa City, in the expense of agricultural land. The built-up land is projected to increase to 5,009.85 ha and 6,794.73 ha from 2021 to 2030 and 2050, while, agricultural land will decrease to 2,849.58 ha and 2033.46 ha same years. This alarming trend poses a critical threat to the livelihoods of local communities in peri-urban areas, who primarily depend on agriculture for their subsistence. To address these challenges and strike a balance between development and environmental preservation, cities like Hawassa must adopt smart urban planning strategies. Approaches such as green infrastructure can promote urban resilience by integrating natural systems, while vertical urbanization can optimize land use and reduce pressure on agricultural areas. Additionally, encouraging peri-urban agriculture could sustain local food systems and provide alternative livelihoods for those communities affected by urban expansion. Overall, the implications of this study emphasize the urgent need for planners and policymakers to develop proactive urban planning and land-use policies that protect agricultural zones and support sustainable urban growth. Future research should focus on assessing the effectiveness of these smart planning strategies and exploring innovative solutions that reconcile urban expansion with environmental conservation, ultimately ensuring a more sustainable future for cities like Hawassa.
Data availability statement
All relevant data is contained within the article: The original contributions presented in the study are included in the article, further inquiries can be directed to the corresponding author.
Author contributions
MM: Conceptualization, Data curation, Formal Analysis, Funding acquisition, Investigation, Methodology, Project administration, Resources, Software, Supervision, Validation, Visualization, Writing–original draft. GG: Conceptualization, Data curation, Formal Analysis, Funding acquisition, Investigation, Methodology, Project administration, Resources, Software, Supervision, Validation, Visualization, Writing–original draft. GG: Conceptualization, Data curation, Formal Analysis, Funding acquisition, Investigation, Methodology, Project administration, Resources, Software, Writing–review and editing
Funding
The author(s) declare that no financial support was received for the research, authorship, and/or publication of this article. The authors are grateful to Hawassa University for financial support and all logistics of this research works. The authors sincerely thank the Hawassa City Administration and its members for their assistance in succeeding in this study and for permitting us to conduct this study in the area. My special thank would also go to Eshetu Gebre and Serawit Mengistu for their guidance and support in the planning for the field data collection.
Conflict of interest
The authors declare that the research was conducted in the absence of any commercial or financial relationships that could be construed as a potential conflict of interest.
Publisher’s note
All claims expressed in this article are solely those of the authors and do not necessarily represent those of their affiliated organizations, or those of the publisher, the editors and the reviewers. Any product that may be evaluated in this article, or claim that may be made by its manufacturer, is not guaranteed or endorsed by the publisher.
References
Abate, T., and Angassa, A. (2016). Conversion of savanna rangelands to bush dominated landscape in Borana, Southern Ethiopia. Ecological processes 5, 1–18.
Aburas, M. M., Ho, Y. M., Ramli, M. F., and Ash’aari, Z. H. (2016). The simulation and prediction of spatio-temporal urban growth trends using cellular automata models: a review. Int. J. Appl. Earth Observation Geoinformation 52, 380–389. doi:10.1016/j.jag.2016.07.007
Admasu, T. G. (2015). Urban land use dynamics, the nexus between land use pattern and its challenges: the case of Hawassa city, Southern Ethiopia. Land Use Policy 45, 159–175. doi:10.1016/j.landusepol.2015.01.022
Admasu, W. F., Van Passel, S., Minale, A. S., Tsegaye, E. A., Azadi, H., and Nyssen, J. (2019). Take out the farmer: an economic assessment of land expropriation for urban expansion in Bahir Dar, Northwest Ethiopia. Land Use Policy 87, 104038. doi:10.1016/j.landusepol.2019.104038
Anand, V., and Oinam, B. (2020). Future land use land cover prediction with special emphasis on urbanization and wetlands. Remote Sens. Lett. 11 (3), 225–234. doi:10.1080/2150704X.2019.1704304
Angel, S., Parent, J., Civco, D. L., Blei, A., and Potere, D. (2011). The dimensions of global urban expansion: estimates and projections for all countries, 2000–2050. Prog. Plan. 75 (2), 53–107. doi:10.1016/j.progress.2011.04.001
Ayele, A., and Tarekegn, K. (2020). The impact of urbanization expansion on agricultural land in Ethiopia: a review. Environ. Socio-Economic Stud. 8 (4), 73–80. doi:10.2478/environ-2020-0024
Barati, A. A., Asadi, A., Kalantari, K., Azadi, H., and Witlox, F. (2015). Agricultural land conversion in northwest Iran. Int. J. Environ. Res. 9 (1), 281–290. doi:10.22059/ijer.2015.898
Barow, I., Megenta, M., and Megento, T. (2019). Spatiotemporal analysis of urban expansion using GIS and remote sensing in Jigjiga town of Ethiopia. Appl. Geomatics 11 (2), 121–127. doi:10.1007/s12518-018-0245-z
Bekele, F. (2010). Impact of horizontal urban expansion on sub-urban agricultural community livelihood: the case of tabor sub-city, Hawassa city, SNNPRS, Ethiopia. Addis Ababa.
Belay, E. (2014). Impact of urban expansion on agricultural land use by remote sensing and GIS approach: a case study of gondar city, Ethiopia. Int. J. Of Innovative Res. and Dev. 3 (6), 129–133.
Bose, A., and Chowdhury, I. R. (2020). Monitoring and modeling of spatio-temporal urban expansion and land-use/land-cover change using Markov chain model: a case study in Siliguri Metropolitan area, West Bengal, India. Model. Earth Syst. Environ. 6 (4), 2235–2249. doi:10.1007/s40808-020-00842-6
Chaolin, G. (2020). “Urbanization,” in International encyclopedia of human geography. 2nd Edn (Elsevier), 14, 141–153. doi:10.1016/B978-0-08-102295-5.10355-5
Congalton, R. G. (1991). A review of assessing the accuracy of classifications of remotely sensed data. Remote Sens. Environ. 37 (1), 35–46. doi:10.1016/0034-4257(91)90048-B
Congedo, L. (2021). Semi-Automatic Classification Plugin: a Python tool for the download and processing of remote sensing images in QGIS. J. Open Source Softw. 6 (64), 3172. doi:10.21105/joss.03172
Dadi, D., Azadi, H., Senbeta, F., Abebe, K., Taheri, F., and Stellmacher, T. (2016). Urban sprawl and its impacts on land use change in Central Ethiopia. Urban For. Urban Green. 16 (2), 132–141. doi:10.1016/j.ufug.2016.02.005
Das, S., and Angadi, D. P. (2021). Land use land cover change detection and monitoring of urban growth using remote sensing and GIS techniques: a micro-level study. GeoJournal 1 (1), 2101–2123. doi:10.1007/s10708-020-10359-1
Degife, A., Worku, H., Gizaw, S., and Legesse, A. (2019). Land use land cover dynamics, its drivers and environmental implications in Lake Hawassa Watershed of Ethiopia. Remote Sens. Appl. Soc. Environ. 14, 178–190. doi:10.1016/j.rsase.2019.03.005
Dires, G. M. (2016). Detecting the rate of urban expansion and its influence on household livelihoods: a case study in the city of Hawassa Ethiopia-WUR. Can. Int. J. Soc. Sci. Educ. 12, 125–146. Available at: https://www.wur.nl/en/activity/Detecting-the-rate-of-urban-expansion-and-its-influence-on-household-livelihoods-a-case-study-in-the-city-of-Hawassa-Ethiopia.htm.
Desta, G., and Zeleke, A. (2020). The impact of agricultural practices on rural development in Ethiopia. J. Sustain. Agri. 15 (3), 200–215. doi:10.1234/jsa2020.003
Eastman, J. R., and He, J. (2020). A regression-based procedure for Markov transition probability estimation in land change modeling. Land 9 (11), 407.
Fenta, A. A., Yasuda, H., Haregeweyn, N., Belay, A. S., Hadush, Z., Gebremedhin, M. A., et al. (2017). The dynamics of urban expansion and land use/land cover changes using remote sensing and spatial metrics: the case of Mekelle City of northern Ethiopia. Int. J. Remote Sens. 38 (14), 4107–4129. doi:10.1080/01431161.2017.1317936
Gashu, K., and Gebre-Egziabher, T. (2018). Spatiotemporal trends in urban land use/land cover and green infrastructure change in two Ethiopian cities: Bahir Dar and Hawassa. Environ. Syst. Res. 7 (1), 1–15. doi:10.1186/s40068-018-0111-3
Hamad, R., Balzter, H., and Kolo, K. (2018). Predicting land use/land cover changes using a CA-markov model under two different scenarios. Sustain. Switz. 10 (10), 3421. doi:10.3390/su10103421
Haregeweyn, N., Fikadu, G., Tsunekawa, A., Tsubo, M., and Meshesha, D. T. (2012). The dynamics of urban expansion and its impacts on land use/land cover change and small-scale farmers living near the urban fringe: a case study of Bahir Dar, Ethiopia. Landsc. Urban Plan. 106 (2), 149–157. doi:10.1016/j.landurbplan.2012.02.016
Hyandye, C., and Martz, L. W. (2017). A Markovian and cellular automata land-use change predictive model of the Usangu Catchment. Int. J. Remote Sens. 38 (1), 64–81. doi:10.1080/01431161.2016.1259675
Israel, G. D. (2013). Determining Sample Size. FL, USA: Institute of Food and Agricultural Sciences (IFAS), University of Florida, PEOD-6, 1–15.
Jenberu, A. A., and Admasu, T. G. (2020). Urbanization and land use pattern in Arba Minch town, Ethiopia: driving forces and challenges. GeoJournal 85 (3), 761–778. doi:10.1007/s10708-019-09998-w
Keshtkar, H., and Voigt, W. (2016). Spatiotemporal analysis of landscape change using integrated Markov chain and cellular automaton models. Model. Earth Syst. Environ. 2 (1), 1–13. doi:10.1007/s40808-015-0068-4
Khawaldah, H. A., Farhan, I., and Alzboun, N. M. (2020). Simulation and prediction of land use and land cover change using GIS, remote sensing, and CA-Markov model. Glob. J. Environ. Sci. Manag. 6 (2), 215–232. doi:10.22034/gjesm.2020.02.07
Kinfu, E., Bombeck, H., Nigussie, A., and Wegayehu, F. (2019). The genesis of peri-urban Ethiopia: the case of Hawassa city. J. Land Rural Stud. 7 (1), 71–95. doi:10.1177/2321024918808125
Lambin, E. F., Turner, B. L., Geist, H. J., Agbola, S. B., Angelsen, A., Bruce, J. W., et al. (2001). The causes of land-use and land-cover change: moving beyond the myths. Glob. Environ. change 11 (4), 261–269. doi:10.1016/s0959-3780(01)00007-3
Leta, M. K., Demissie, T. A., and Tränckner, J. (2021). Modeling and prediction of land use land cover change dynamics based on land change modeler (LCM) in nashe watershed, upper blue nile basin, Ethiopia. Sustain. Switz. 13 (7), 3740. doi:10.3390/su13073740
Liping, C., Yujun, S., and Saeed, S. (2018). Monitoring and predicting land use and land cover changes using remote sensing and GIS techniques—a case study of a hilly area, Jiangle, China. PLoS ONE 13 (7), e0200493. doi:10.1371/journal.pone.0200493
Majumder, S., Roy, S., Bose, A., and Chowdhury, I. R. (2023). Multiscale GIS based-model to assess urban social vulnerability and associated risk: evidence from 146 urban centers of Eastern India. Sustain. cities Soc. 96, 104692. doi:10.1016/j.scs.2023.104692
Mekuriaw, T., and Gokcekus, H. (2019). The impact of urban expansion on physical environment in Debre Markos Town, Ethiopia. Civ Environ Res 11, 16–26.
Mohamed, A., and Worku, H. (2020). Simulating urban land use and cover dynamics using cellular automata and Markov chain approach in Addis Ababa and the surrounding. Urban Clim. 31, 100545. doi:10.1016/j.uclim.2019.100545
Muchelo, R. O. (2018). Urban expansion and loss of prime agricultural land in Sub-Saharan Africa: a challenge to soil conservation and food security (Ph. D. thesis). University of Sydney.
Pandey, B., and Seto, K. C. (2015). Urbanization and agricultural land loss in India: Comparing satellite estimates with census data. J. Environ. Manag. 148, 53–66. doi:10.1016/j.jenvman.2014.05.014
Pandey, B., and Seto, K. C. (2019). Urbanization and agricultural land loss in India: comparing satellite estimates with census data. J. Environ. Manag. 148, 53–66. doi:10.1016/j.jenvman.2014.05.014
Rimal, B., Sharma, R., Kunwar, R., Keshtkar, H., Stork, N. E., Rijal, S., et al. (2018). Effects of land use and land cover change on ecosystem services in the Koshi River Basin, Eastern Nepal. Ecosys. serv. 38, 100963.
Rimal, B., Sloan, S., Keshtkar, H., Sharma, R., Rijal, S., and Shrestha, U. B. (2020). Patterns of historical and future urban expansion in Nepal. Remote Sens. 12 (4), 628–722. doi:10.3390/rs12040628
Roy, S., Bose, A., Basak, D., and Chowdhury, I. R. (2024d). Towards sustainable society: the sustainable livelihood security (SLS) approach for prioritizing development and understanding sustainability: an insight from West Bengal, India. Environ. Dev. Sustain. 26 (8), 20095–20126. doi:10.1007/s10668-023-03456-x
Roy, S., Bose, A., Majumder, S., Roy Chowdhury, I., Abdo, H. G., Almohamad, H., et al. (2022). Evaluating urban environment quality (UEQ) for Class-I Indian city: an integrated RS-GIS based exploratory spatial analysis. Geocarto Int. 38, 2153932. doi:10.1080/10106049.2022.2153932
Roy, S., Bose, A., Singha, N., Basak, D., and Chowdhury, I. R. (2021). Urban waterlogging risk as an undervalued environmental challenge: an Integrated MCDA-GIS based modeling approach. Environ. Challenges 4, 100194. doi:10.1016/j.envc.2021.100194
Roy, S., Majumder, S., Bose, A., and Chowdhury, I. R. (2024a). GWPCA-based spatial analysis of urban vitality: a comparative assessment of three high-altitude Himalayan towns in India. J. Spatial Sci. 69 (2), 593–620. doi:10.1080/14498596.2023.2267011
Roy, S., Majumder, S., Bose, A., and Chowdhury, I. R. (2024b). Hilly terrain and housing wellness: geo visualizing spatial dynamics of urban household quality in the Himalayan town of Darjeeling, India. Singap. J. Trop. Geogr. 45, 361–383. doi:10.1111/sjtg.12533
Roy, S., Majumder, S., Bose, A., and Chowdhury, I. R. (2024c). Spatial heterogeneity in the urban household living conditions: a-GIS-based spatial analysis. Ann. GIS 30 (1), 81–104. doi:10.1080/19475683.2024.2304194
Roy, S., Majumder, S., Bose, A., and Chowdhury, I. R. (2024e). The rich-poor divide: unravelling the spatial complexities and determinants of wealth inequality in India. Appl. Geogr. 166, 103267. doi:10.1016/j.apgeog.2024.103267
Roy, S., Majumder, S., Bose, A., and Chowdhury, I. R. (2024f). Mapping the vulnerable: a framework for analyzing urban social vulnerability and its societal impact. Soc. Impacts 3, 100049. doi:10.1016/j.socimp.2024.100049
Roy, S., Majumder, S., Bose, A., and Roy Chowdhury, I. (2023a). Does geographical heterogeneity influence Urban quality of life? A case of a densely populated Indian City. Pap. Appl. Geogr. 9 (4), 395–424. doi:10.1080/23754931.2023.2225541
Roy, S., Singha, N., Bose, A., Basak, D., and Chowdhury, I. R. (2023b). Multi-influencing factor (MIF) and RS–GIS-based determination of agriculture site suitability for achieving sustainable development of Sub-Himalayan region, India. Environ. Dev. Sustain. 25 (7), 7101–7133. doi:10.1007/s10668-022-02360-0
Sarkar, A., and Chouhan, P. (2019). Dynamic simulation of urban expansion based on cellular automata and Markov chain model: a case study in Siliguri metropolitan area, West Bengal. Model. Earth Syst. Environ. 5 (4), 1723–1732. doi:10.1007/s40808-019-00626-7
Shi, K., Chen, Y., Yu, B., Xu, T., Li, L., Huang, C., et al. (2016). Urban expansion and agricultural land loss in China: a multiscale perspective. Sustain. Switz. 8 (8), 790–816. doi:10.3390/su8080790
Terfa, B. K., Chen, N., Liu, D., Zhang, X., and Niyogi, D. (2019). Urban expansion in Ethiopia from 1987 to 2017: characteristics, spatial patterns, and driving forces. Sustain. Switz. 11 (10), 2973–3021. doi:10.3390/su11102973
Terfa, B. K., Chen, N., Zhang, X., and Niyogi, D. (2020). Urbanization in small cities and their significant implications on landscape structures: the case in Ethiopia. Sustain. Switz. 12 (3), 1235. doi:10.3390/su12031235
UN-DESA (United Nations Department of Economic and Social Affairs) (2015). World urbanization prospects: The 2015 revision (ST/ESA/SER.A/366). Key findings and advance tables. New York: United Nations. Available at: https://population.un.org/wup/Publications/Files/WUP2014-Highlights.pdf.
United Nations, Department of Economic and Social Affairs, & Population Division, P. D. (2019). World Urbanization Prospects 2018: Highlights (ST/ESA/SER. A/421). New York: United Nations.
UN-Habitat (2020). World cities report 2020: the value of sustainable urbanization. Nairobi, Kenya: United Nations Human Settlements Program UN-Habitat.
Wondrade, N., Dick, Ø. B., and Tveite, H. (2014). GIS-based mapping of land cover changes utilizing multi-temporal remotely sensed image data in Lake Hawassa Watershed, Ethiopia. Environ. Monit. Assess. 186 (3), 1765–1780. doi:10.1007/s10661-013-3491-x
Wu, D., Liu, J., Wang, S., and Wang, R. (2010). Simulating urban expansion by coupling a stochastic cellular automata model and socioeconomic indicators. Stoch. Environ. Res. Risk Assess. 24 (2), 235–245. doi:10.1007/s00477-009-0313-3
Wu, Q., Li, H. qing, Wang, R. song, Paulussen, J., He, Y., Wang, M., et al. (2006). Monitoring and predicting land use change in Beijing using remote sensing and GIS. Landsc. Urban Plan. 78 (4), 322–333. doi:10.1016/j.landurbplan.2005.10.002
Wu, Y., Li, S., and Yu, S. (2016). Monitoring urban expansion and its effects on land use and land cover changes in Guangzhou city, China. Environ. Monit. Assess. 188 (1), 54–15. doi:10.1007/s10661-015-5069-2
Zadbagher, E., and Becek, K. (2018). Modeling land use/land cover change using remote sensing and geographic information systems: a case study of the Seyhan. Environ. Monit. Assess., 190(494), 1–15. doi:10.1007/s10661-018-6877-y
Keywords: agricultural land loss, land change modeler, Landsat, remote sensing, urban expansion
Citation: Molla MB, Gelebo G and Girma G (2024) Urban expansion and agricultural land loss: a GIS-Based analysis and policy implications in Hawassa city, Ethiopia. Front. Environ. Sci. 12:1499804. doi: 10.3389/fenvs.2024.1499804
Received: 21 September 2024; Accepted: 29 October 2024;
Published: 15 November 2024.
Edited by:
Sérgio António Neves Lousada, University of Madeira, PortugalReviewed by:
Subham Roy, University of North Bengal, IndiaAndrea Emma Pravitasari, IPB University, Indonesia
Copyright © 2024 Molla, Gelebo and Girma. This is an open-access article distributed under the terms of the Creative Commons Attribution License (CC BY). The use, distribution or reproduction in other forums is permitted, provided the original author(s) and the copyright owner(s) are credited and that the original publication in this journal is cited, in accordance with accepted academic practice. No use, distribution or reproduction is permitted which does not comply with these terms.
*Correspondence: Mikias Biazen Molla, bWlraWFzbW9sbGFAZ21haWwuY29t
 Mikias Biazen Molla
 Gezehagn Gelebo