- 1School of Physics and New Energy, Xuzhou University of Technology, Xuzhou, China
- 2Xuzhou University of Technology, Xuzhou, China
- 3Department of Earth and Environmental Science, Vanderbilt University, Nashville, TN, United States
- 4Xuzhou Environmental Monitoring Center Station, Xuzhou, China
- 5School of Pharmacy, Anhui Medical University, Hefei, China
Ozone formation is closely tied to emissions of precursors, meteorological conditions, and atmospheric chemistry. In June 2024, Xuzhou City, located at the intersection of Jiangsu, Shandong, Henan, and Anhui provinces in East China, experienced a series of ozone pollution events. The continuous pollution episodes were characterized by consistently high levels of ozone, with daytime peaks reaching 130 ppb. By combining observations of atmospheric oxidation and the use of the Observation-Based Model model, it was determined that the pollution was the result of a “heatwave-ozone” co-occurring extreme event triggered by elevated temperatures, low humidity, and intense radiation. The heatwave led to increased emissions of VOCs from both natural and human-related sources, with more pronounced contribution from Bio-alkenes and OVOCs. This, in turn, resulted in higher levels of oxidizing agents and ozone formation potential, exacerbating the co-occurrence of heatwaves and ozone extremes. Sensitivity tests on enhanced controls showed that reducing NOx had a significant adverse effect on ozone levels, whereas reducing VOCs had positive benefits, particularly for controlling alkenes. Despite ongoing reductions in anthropogenic VOCs, the elevated temperatures led to an increase in natural VOCs emissions. On average, a 1°C temperature decrease could reduce the reactivity ratio of VOCs to NOx (VOCR/NOxR) by 0.12, thereby enhancing the advantages of emission reductions. Therefore, implementing measures to alleviate extreme heatwaves, such as limiting high-energy consumption and inducing artificial rainfall, can simultaneously reduce the intensity and reactivity of VOC emissions, aiding in the effective implementation of ozone pollution control policies.
1 Introduction
China has made notable progress in addressing regional atmospheric pollution through the implementation of stringent pollution control policies. These measures have been effectively reducing primary pollutants such as nitrogen oxides (NOx), carbon monoxide (CO), sulfur dioxide (SO2), and significantly alleviating PM2.5 pollution (Huang et al., 2018; Zhu et al., 2011). Despite these achievements, there has been a persistent increase in near-surface ozone (O3) concentrations, which led to frequent occurrences of ozone pollution events in megacity clusters such as the Beijing-Tianjin-Hebei (BTH), the Pearl River Delta (PRD), and the Yangtze River Delta (YRD) (Lu et al., 2018).
Ozone, a highly oxidative atmospheric pollutant, is formed through ongoing photochemical reactions involving NOx, CO, and volatile organic compounds (VOCs) under solar radiation (Hofzumahaus et al., 2009; Rohrer et al., 2014). Previous work have established a strong connection between ozone formation and the emissions of precursors, meteorological conditions, and atmospheric chemistry (Lu et al., 2019). However, the formation mechanism of ozone pollution is complex due to the highly nonlinear relationship between O3 and its precursors (Li et al., 2019). During the daytime, atmospheric oxidation is initiated by ROx radical chemistry, leading to the generation and accumulation of ozone in the troposphere. The major sources of ROx radicals include the photolysis of ozone, nitrous acid (HONO), formaldehyde (HCHO), and oxygenated volatile organic compounds (OVOCs). The atmospheric oxidizing capacity, influenced by various factors such as photolysis, meteorology, and pollutant concentrations, plays a crucial role on spatial scales. For instance, in urban areas like Beijing, Shanghai, and Guangzhou, photolysis of formaldehyde and ozonolysis of alkenes contribute approximately 85% of HO2 and OH radical production (Tan et al., 2019). In oil and gas fields, high VOC emissions, particularly with OVOC photolysis contributions 2–5 times higher than in urban areas, significantly promote ozone formation (Chen et al., 2020; Edwards et al., 2014; Edwards et al., 2013). Furthermore, previous studies estimate that meteorological variations account for 23%–80% of the O3 concentration trends in China between 2013 and 2020 (Sun et al., 2021; Yin et al., 2021a; Yin et al., 2021b).
In recent years, China has witnessed a rise in both the frequency and severity of heatwaves during the summer months, spanning from June to August (Chen et al., 2024; Meng et al., 2023). The heatwaves are typically accompanied by low humidity, intense solar radiation, and stable atmospheric conditions, which can synergize with local oxidative processes and influence the formation of ozone. Although the intricate interplay between human activities and natural systems within the Yangtze River Delta (YRD) region under conditions of high temperature has been partially investigated in several studies, there remains a significant research gap concerning atmospheric oxidizing capacity in the multi-province border (MPB) areas. Supplementary Figure S1 illustrates the distribution of ozone concentration across the MPB region. The disparity in the maximum daily 8 h average (MDA8) concentrations among nine cities was under 10 ppb, indicating a clear uniformity in spatial distribution. Regarding temporal fluctuations, ozone pollution in June is the most severe during the summer months, featuring successive pollution episodes; in contrast, July and August do not exhibit comparable durations or peak levels of ozone concentration to those observed in June (Supplementary Figure S2). Consequently, the focus is on June, with a particular emphasis on Xuzhou—a city characterized by its resource-intensive industrial profile and substantial anthropogenic emissions located in the YRD region—to examine the concurrent occurrence of heatwaves and extreme ozone events.
The study employs an Observation-Based Model (OBM) to scrutinize the features of ozone pollution during heatwave episodes and to delineate the interconnection between these extreme phenomena and atmospheric oxidation processes. By dissecting the formation mechanisms of ozone pollution and the sensitivity of the O3-NOx-VOCs system, the research aims to enhance the precision of ozone pollution control strategies, especially within the broader context of global warming.
2 Materials and methods
2.1 Site description
The observation was conducted from June 1 to 30 June 2024, at the Xuzhou Environmental Monitoring Center Station (34.215° N, 117.256° E). Xuzhou is strategically positioned at the convergence of Jiangsu, Shandong, Henan, and Anhui provinces in East China, renowned for their industrial, agricultural, and manufacturing activities (Qin et al., 2017) (Figure 1). The observation site is situated southeast of Xuzhou in a mixed commercial and residential area (Rao et al., 2023). Major roads are located 100 m to the east and 500 m to the south of the site. To the north, extensive farmland and abundant vegetation can be found. Consequently, this site offers an ideal setting for investigating the interplay between human-made and natural sources of pollution (Feng et al., 2023).
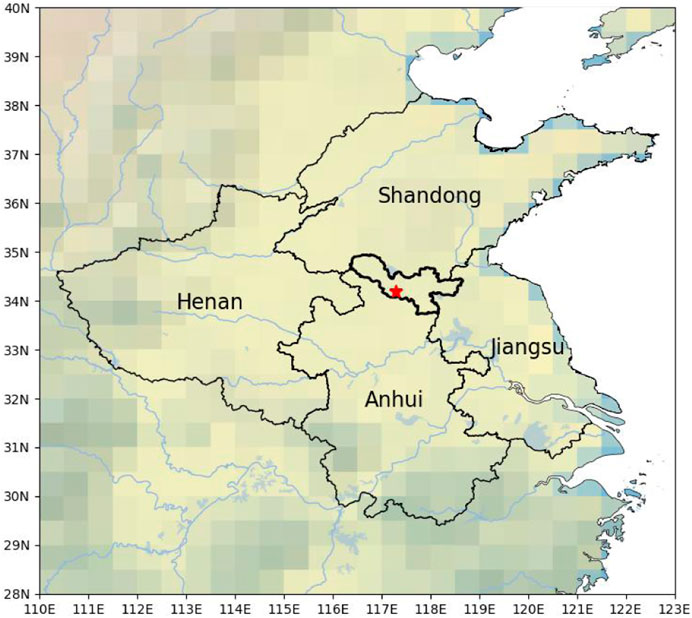
Figure 1. The location of the measurement site and surrounding cities. The map background represents topographic elevation distribution. This terrain map is illustrated by the Basemap package in Python 3.8.
2.2 Instrumentation
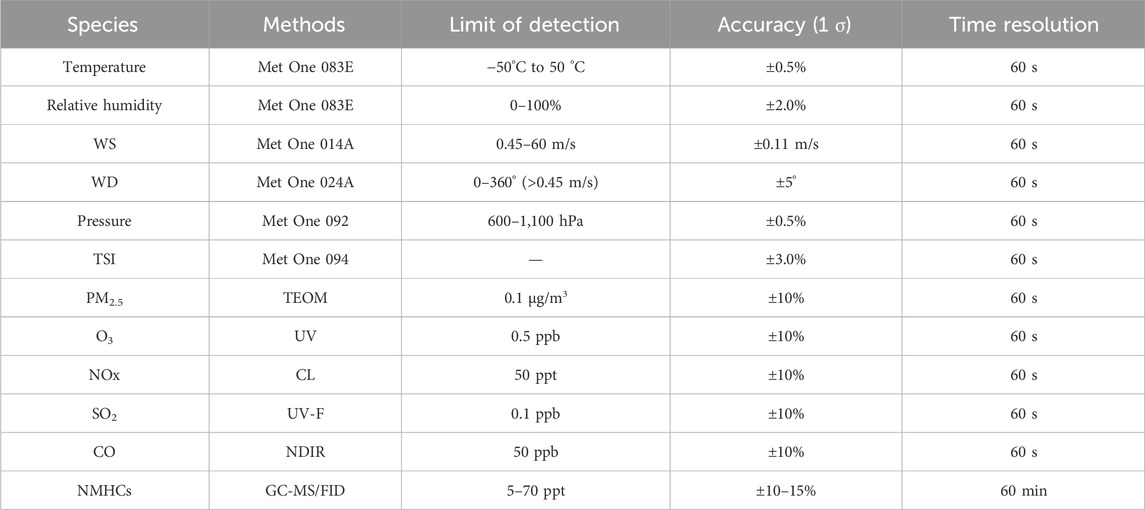
Instruments for meteorological data and pollutant concentrations were positioned on the rooftop of the Xuzhou Environmental Monitoring Center Station (34.22°N, 117.27°E). Situated approximately 20 m above ground level, the placement minimized the impact of turbulence near the ground. The specific instruments information are listed in Table 1. Thermo commercial instruments were employed to monitor NOx, O3, CO, and SO2 levels, while GC-MS/FID technology was utilized to detect VOCs species, encompassing 107 types of non-methane hydrocarbons (NMHCs) ranging from C2 to C14, as well as some other OVOCs. To ensure the precision of the measurements, all instruments underwent daily external standard quality control checks at midnight.
The photolysis rates were determined using the Tropospheric Ultraviolet and Visible (TUV) radiation model. To ensure accuracy, the rates were adjusted based on measurements of total solar irradiance (TSI) (Trebs et al., 2009). The validity of this approach has been confirmed through extensive long-term observations (Wang et al., 2020).
2.3 Observation-Based Model
A zero-dimensional box model based on the RACM2-LIM1 mechanism was utilized to calculate the explicit local ozone formation and the sensitivity of O3-NOx-VOCs(Griffith et al., 2013; Stockwell et al., 1997; Tan et al., 2017). To input the necessary data into the model, relevant meteorological and pollutant parameters were compiled into a time-dependent dataset for the model boundaries. In instances where there were gaps in the data due to instrument maintenance or malfunction, averaging or linear interpolation techniques were used to fill in the missing values. The time resolution used for the dataset was 15 min. For species that were not measured, such as H2 and CH4, default values were assigned at 550 ppb and 1900 ppb, respectively. To account for the removal of pollutants over a 24 h lifetime, corresponding removal rates were applied to all species in the model. Additionally, a 3 day spin-up period was included to allow the model to stabilize before generating results.
To evaluate the O3-NOx-VOCs sensitivity, the response of simulated ozone concentration to changes in individual precursors was calculated, which was expressed as the Relative Incremental Reactivity (RIR) in Equation 1 (Cardelino and Chameides, 1995):
∆O3 represents the change in simulated ozone concentration, O3 denotes the baseline ozone concentration, ∆C(X) represents the change in precursor concentration, and C(X) represents the baseline precursor concentration. For the sensitivity experiments, a baseline value of 20% was selected for ∆C(X), and then evaluating the impact on the simulated ozone concentration (Yu et al., 2020).
To predict ozone concentrations for the calculation of RIR, a constraint was applied to NO2 while removing constraints on O3 and NO in the box model (Tan et al., 2018; Zhang et al., 2024).
3 Results
3.1 Overview of measurement
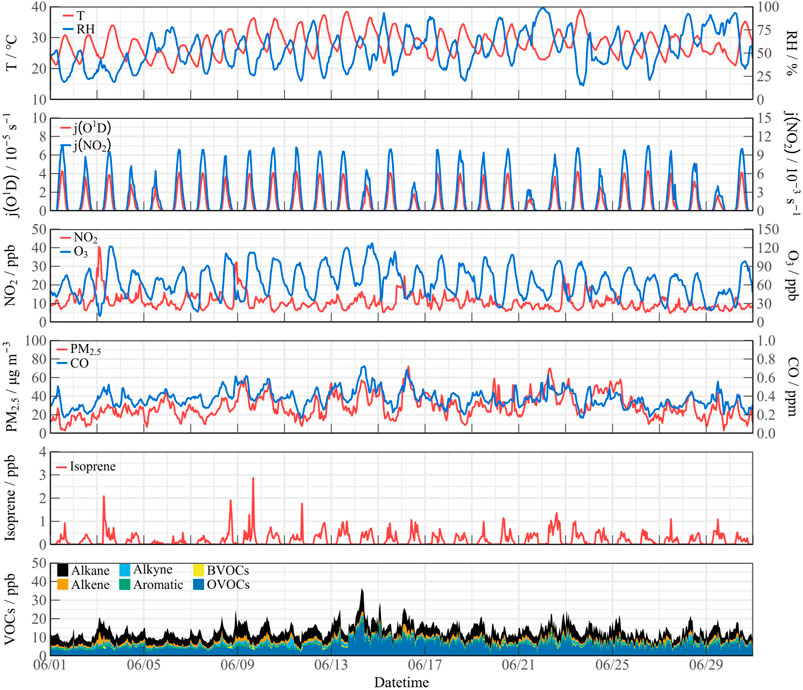
Figure 2 illustrates the timeseries of meteorological data and pollutant concentrations during the observation in June 2024 in Xuzhou. The city experienced consecutive extreme heatwaves and intense solar radiation, with daytime temperature peaks surpassing 30 °C, and j (O1D) reaching a value of 4.0 × 10⁻⁵ s-1. NO2 concentrations exhibited a range of 4.73–40.51 ppb, primarily attributed to elevated precursor emissions in the urban environment. PM2.5 and CO concentrations showed consistent patterns and occasionally reached mild pollution levels on specific days. The average daily peak concentration of VOCs was 16.69 ppb, with a maximum of 36.50 ppb recorded on June 14th. Anthropogenic VOCs (AVOCs) were predominantly composed of alkanes, alkenes, and aromatics. Oxygenated volatile organic compounds (OVOCs) included acrolein, acetone, methyl ethyl ketone, and methyl t-butyl ether, and accounted for over 50% of the total VOC concentration (TVOCs). The intensive emissions of VOCs played a significant role in local ozone formation, leading to consecutive ozone pollution events. During the observation, the daily ozone concentration met the Grade I standard for 21 days and the Grade II standard for 4 days, according to the Ambient Air Quality Standards (GB3095-2012), with daytime peaks reaching 130 ppb.
From June 9 to 16, there was a continuous period of high temperatures, with peaks surpassing 35 °C. According to the Grade of the Heatwave (GB/T 29,457–2012) classification, the scenario can be categorized as an extreme heatwave event (denoted as Extreme period in Figure 3). In contrast, the periods from June 1 to 5 and June 24 to 29 experienced temperature peaks below 30 °C, which was categorized as normal temperature events (denoted as Normal period in Figure 3). Extreme heatwave coincided with a notable increase in ozone pollution, with concentrations rising from 74.14 ppb to 105.51 ppb, representing an increase of over 30% (Figure 3). While the average daytime levels of NO2 remained consistent across both scenarios, TVOCs significantly increased during the heatwave, climbing from 14.02 ppb to 18.47 ppb. Bio-VOCs emissions, particularly isoprene, exhibited a strong response to elevated temperatures, with peak concentrations nearly doubling compared to the Normal events, reaching as high as 2.86 ppb on certain days.
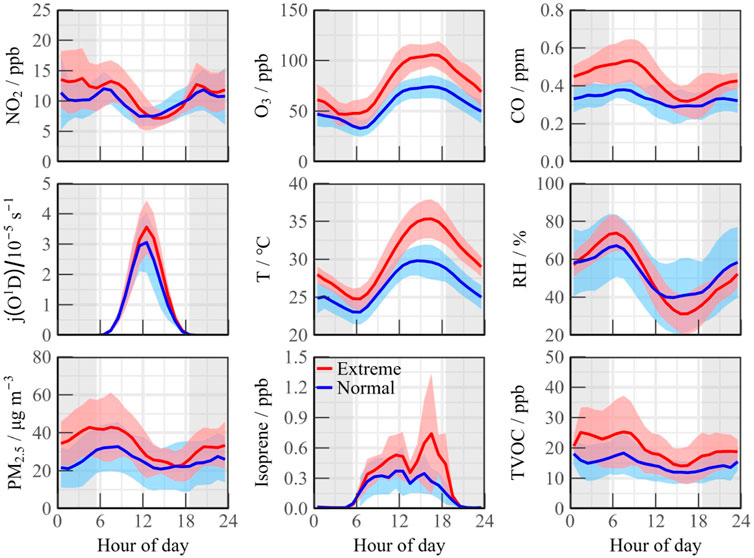
Figure 3. Diurnal variation of pollutant concentrations within Extreme and Normal scenarios, respectively.
3.2 VOC compositions and ozone production efficiency
Given the elevated VOC emissions during heatwaves, the influence of extreme temperatures on the chemistry process of VOC was examined, utilizing temperature as a key variable. The relationship was evaluated through VOC concentrations, hydroxyl reactivity (kOH), ozone formation potential (OFPs), and secondary organic aerosol formation potential (SOAFPs) to characterize the theoretical generation of secondary pollution generation in diurnal time (8:00–18:00, Figure 4). The total OH reactivity indicates the reciprocal of the OH radical’s lifetime. The OFP for each individual VOC species is determined by multiplying the measured concentration with its maximum incremental reactivity (MIR), and then aggregating the values across all VOC types. Notably, OVOCs were excluded from this analysis due to incomplete measurements.
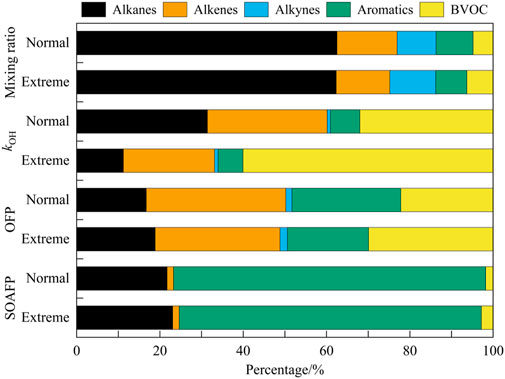
Figure 4. VOC concentrations, reactivity (kOH), ozone formation potential (OFPs), and secondary organic aerosol formation potential (SOAFPs) were described during different scenarios (8:00–18:00).
In terms of relative contribution, alkanes consistently represented the largest share of VOC concentrations, accounting for approximately 62.50% (except for OVOCs). However, the OH reactivity for alkanes decreased significantly, with a reduction of 11.21% during Extreme events and 31.42% during normal scenarios. The increased reactivity observed during the heatwave was primarily influenced by active species, particularly biogenic and anthropogenic alkenes. Despite constituting only 5% of VOCs concentration, isoprene displayed a marked response to elevated temperatures, increasing the contribution to kOH from 32.00% to 60.04%, which also correlated with a higher ozone formation potential. In contrast, aromatics contributed only around 5% to overall VOC reactivity, differing from findings in cities such as Guangzhou and Shanghai, which suggests a limited local use of solvents and chemical manufacturing sources (Tan et al., 2019; Yu et al., 2020). Nevertheless, aromatics displayed significant ozone formation potential and accounted for over 70% of secondary organic aerosol formation potential (SOAFP).
3.3 Modeled OH reactivity and composition
Given the pronounced pollution characteristics observed during heatwaves, the influnence of extreme temperatures on atmospheric oxidative capacity was examined using temperature as a variable. A box model was employed to quantify key parameters related to atmospheric oxidant sources and sinks, specifically total kOH and P (ROx) (Figure 5). Due to diurnal variations in meteorological dilution conditions, OH reactivity was found to be lowest in the afternoon and highest during morning traffic peaks, aligning with observed temporal trends (Tan et al., 2019; Zhang et al., 2024). Higher reactivity levels (ranging from 10 to 30 s-1) was observed in heatwaves, and the proportions of total OH consumption by inorganic species CO and NOx were 21.16% and 19.89%, respectively, indicating a significant contribution of anthropogenic emissions to radical chain termination. Organic species accounted for approximately 60% of the total reactivity, with OVOCs contributing 30.98%. The proportion of kAVOCs remained consistent with observations during normal temperatures, while a more pronounced contribution from unmeasured species to kOVOCs, suggesting the potential influence of unknown photochemical processes activated by elevated temperatures.
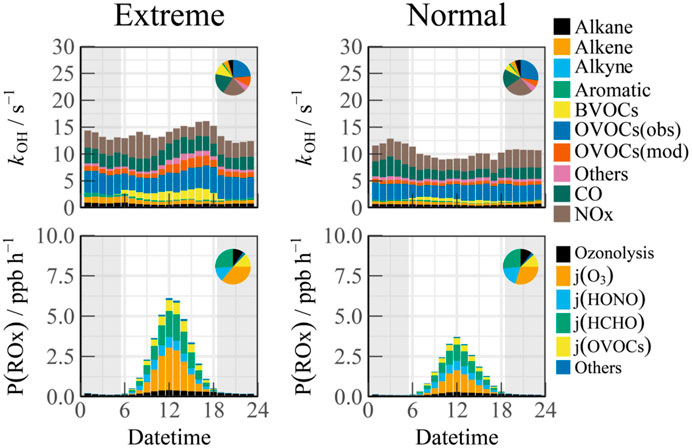
Figure 5. Diurnal variations of reactivity and radical sources from box model outputs across different periods.
Considering that photolysis reactions are the primary drivers of radical chemistry, the budget analysis concentrated exclusively on daytime conditions (08:00–18:00). During Normal scenario, the daytime peak of P (ROx) can reach 3.71 ppb/h, which is typical of the summer and autumn seasons in China (Guo et al., 2024; Tan et al., 2024; Tan et al., 2021; Yang et al., 2021). Photolysis reactions accounted for a substantial 86.90% of the total radical production in diurnal time. Among these, the photolysis of O3 and HONO were particularly significant in generating OH radicals, contributing approximately 29.72% and 18.58% to the total primary sources of radicals, respectively. The photolysis of HCHO and other OVOCs emerged as important primary sources of hydroperoxyl (HO2) and peroxy radicals (RO2), contributing 26.58% and 12.09% to P (ROx), respectively. Alkene ozonolysis also played a role in the generation of OH, HO2, and RO2 radicals, yielding an average production rate of 0.22 ppb/h during the daytime.
During heatwave events, the peak primary radical source increased significantly, showing a 64.69% rise compared to normal temperatures, reaching 6.11 ppb/h. Ozone photolysis emerged as the dominant contributor to P (ROx), accounting for 35.76% of the total, which is comparable to that from the photolysis of aldehydes and ketones (collectively contributed to 38.63%).
4 Discussion
4.1 Temperature dependence of oxidation
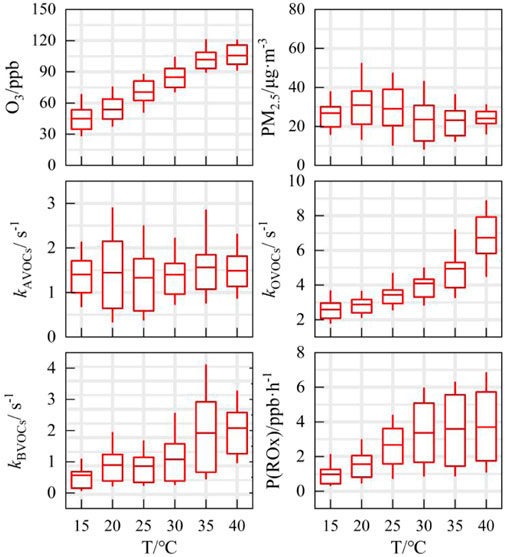
Given the specific impact of extreme heatwaves on ozone pollution, the ozone formation process was reconstructed across the entire temperature range (Figure 6). The species concentration and reactivity are both in the daytime range, when j (O1D) is greater than 1.0 × 10⁻⁶ s-1, thereby eliminating the daytime and nighttime effects. Ozone concentrations revealed a strong positive correlation with temperature, with levels increasing from approximately 45 ppb to around 110 ppb, indicating no apparent threshold for this trend. In contrast, PM2.5 concentrations exhibited a different pattern, peaking between 15°C and 25 °C and subsequently declining at higher temperatures, showing less significant responsiveness.
Compared to concentrations of specific components, changes in the reactivity of VOCs, denoted as kVOCs, provide valuable insights into the active photochemistry occurring under high-temperature conditions. Previous research highlighted the intricate interplay between anthropogenic activities and vegetation during heatwave events (Li et al., 2024). VOC reactivity was segmented into three main categories: anthropogenic, biogenic, and aldehyde/ketone oxygenated VOCs. The response of kBVOCs to temperature fluctuations is particularly noteworthy. As temperatures surpass 30 °C, the average kBVOCs escalates to around 2 s-1, while the reactivity of anthropogenic VOCs (kAVOCs) remains relatively stable, indicating a heightened level of activity in biogenic VOC chemistry under elevated temperatures. In the presence of intense photochemical conditions induced by prolonged heatwaves, VOCs interact with OH radical to generate peroxy radicals and other OVOCs, leading to an elevation in kOVOCs from 2.5 s-1 to approximately 6.5 s-1 (Figure 6). The typical tracer for anthropogenic OVOCs (acetone) exhibited a distinct temperature dependency, featuring a pronounced peak during the high-temperature period, which reached a maximum of 16 ppb (Supplementary Figure S4). Consequently, heatwaves trigger an overall increase in the emissions of VOCs originating from both natural and anthropogenic sources, with more prominent contributions from bio-alkenes and OVOCs.
4.2 O3-NOx-VOCs sensitivity
Based on the discussion provided, the pollution event described can be characterized as a “heatwave-ozone” co-occurring extreme event, triggered by high temperatures, low humidity meteorological conditions, and intense radiation. The heatwave accentuated the contributions to VOCs emissions, leading to heightened levels of oxidizing parameters such as radical sources, reactivity, and ozone formation potential. This scenario is likely to exacerbate the co-occurrence of heatwaves and ozone extremes. Despite ongoing reductions in anthropogenic VOC emissions with the current precursor composition (as the constant kAVOCs in Figure 6), the impact of high temperatures significantly enhanced natural VOC emissions (as the elevated kBVOCs in Figure 6), counteracting the benefits derived from emission reductions. Therefore, enhanced control of anthropogenic VOCs and reactive OVOCs is crucial during heatwave events.
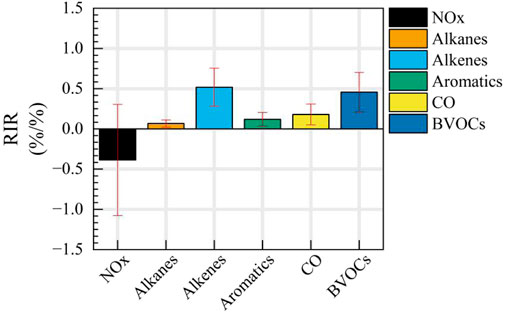
To effectively control ozone-formation precursors, it is essential to mitigate the increase in biogenic VOC emissions triggered by high temperatures. The study utilized the RIR analysis to quantify ozone responses to individual precursors, focusing on NOx and VOCs (as shown in Figure 7). Apart from CO and NOx, the research specifically examined isoprene and anthropogenic VOCs, such as alkanes, alkenes, and aromatics. It was observed that due to a higher proportion of chain-terminating reactions, the chemistry of NOx did not yield positive benefits, as indicated by a daytime average RIRNOx of −0.39, suggesting that NOx reduction has a detrimental impact on ozone control. Conversely, reducing anthropogenic VOCs demonstrated systemic positive effects, with a corresponding daily average RIRAVOCs of 0.71, indicating that a 1% reduction in anthropogenic VOCs results in a 0.71% decrease in ozone concentration. Among the different types of anthropogenic VOCs, controlling alkenes exhibited the most significant effect on ozone reduction, with a daytime average RIR above 0.5. Regulating aromatics, alkanes, and CO also had a positive impact on ozone control, with RIR values ranging from 0.067% to 0.18%/%.
The substantial emissions of biogenic VOCs exacerbated by extreme high temperatures underscore the significant control effect on ozone pollution, as elucidated by the quantitative results discussed in Section 4.1. A growing body of research underscores the importance of biogenic isoprene in contributing to ozone pollution in urban areas during the summer months, with global emissions estimated to be around 600 Tg C annually (Guenther et al., 2006). Li et al. determined through modeling that natural emissions enhance ozone pollution by increasing both temperature sensitivity and concentration levels. In future high emission scenarios, such as ssp370 and ssp585, this trend is expected to intensify the concurrent occurrence of “heatwave-ozone” extreme events (Li et al., 2024). From a practical control perspective, choosing plants with low alkene emissions in urban planning could serve as a potential method for managing ozone pollution. Such an approach not only addresses the reduction of biogenic VOC emissions but also enhances urban green spaces, promoting overall environmental health. Furthermore, Song et al. have developed an effective and environmentally friendly photocatalyst designed for the efficient removal of isoprene (Song et al., 2024). When the residence time is increased by 10 s, the photocatalytic rate of isoprene is improved to 79%, and its feasibility for pollution control in various regions has been demonstrated. Simultaneously, new strategies for the synergistic control of primary radical sources (P (ROx)) and reaction chain length (ChL) emerge as additional methods to reduce ozone levels (Liang et al., 2024; Lu et al., 2023). By integrating these approaches, we can develop a more comprehensive framework for ozone pollution management that considers both biogenic emissions and innovative technological solutions.
4.3 Impact of temperature effects on emission reduction
Long-term observational data on ozone and its precursors in China have revealed a noteworthy trend in the reactivity ratio of VOCs to NOx (VOCR/NOxR), which aligns closely with the normalized ozone levels. The relationship suggests that lowering the reactivity ratio serves as an optimal pathway for controlling ozone pollution (Wang et al., 2023). In this context, VOCR (kVOCs) is viewed as the primary production term for radical chemistry, while NOxR (kNOx) represents the corresponding consumption term.
The impact of temperature on emissions reduction was further investigated utilizing the VOCR/NOxR parameter, as depicted in Figure 8A. Within the temperature range of 15°C–30 °C, the reactivity ratio exhibited no significant generation trend, fluctuating between 2.17 and 2.31. The inflection point for the VOCR/NOxR trend was observed at 30 °C. Notably, during periods of extreme high temperatures, the increase in ozone production rate (P(O3)) mirrored the temperature dependence of reactivity ratio (Figures 8A,B). The peak of P(O3) reached approximately 20 ppb/h, aligning with the synchronous change in ozone concentration.

Figure 8. Temperature effect on precursor reduction as indicated by (A) VOCR/NOxR, (B) P(Ox) and (C) ozone change (ΔO3).
Global warming and the greenhouse effect further complicate the heatwave issue, as the increase in greenhouse gases such as CO2 traps more heat in the atmosphere, leading to rising temperatures. The persistent warming trend not only accelerates ozone production but also amplifies the chemical reactivity of VOCs, making pollution control more challenging. By focusing on reducing the reactivity ratio, effective strategies can be developed to manage and control ozone levels in the atmosphere. From a pollution control perspective, regulating temperature by 1 °C reduces VOCR/NOxR by 0.12, thereby slowing the efficiency of the OH-HO2-RO2 radical cycle and inhibiting local ozone formation. Sensitivity tests under extreme temperature control scenarios demonstrate that the regulation of temperature consistently produces positive outcomes (as shown in Figure 8C). Within the temperature range of −10 to +10 °C, pollution control effects are sustained, though warming exacerbates adverse effects. By adopting a multifaceted approach that integrates temperature regulation and emission control, significant strides can be made towards improving air quality and protecting public health from the harmful effects of ozone pollution. Therefore, implementing measures such as limiting high energy consumption and using artificial rainfall to mitigate extreme heat can simultaneously lower VOC emission intensity and reactivity, facilitating the effective implementation of policies aimed at controlling ozone pollution.
5 Conclusion
In June 2024, Xuzhou experienced severe ozone pollution, with concentrations reaching the Grade I standard for 21 days and the Grade II standard for 4 days, peaking at 130 ppb. An OBM analysis was conducted to explore the characteristics of ozone pollution under extreme temperatures, establishing a link between heatwaves and atmospheric oxidative capacity. This study elucidates the ozone formation mechanisms and the sensitivity of O3-NOx-VOCs, providing insights for refining ozone pollution control policies in the context of global warming. Key findings are as follows.
1. During the pollution episode, ozone concentrations showed a strong positive correlation with temperature. Heatwave events led to increased VOC emissions, elevated levels of oxidizing parameters such as radical sources, reaction reactivity, and ozone formation potential, thus likely to exacerbate the co-occurrence of heatwaves and ozone extremes.
2. Despite ongoing reductions in anthropogenic VOCs emissions under the current precursor composition, high temperatures enhanced an overall increase in both biogenic and anthropogenic VOC emissions, with biogenic alkenes and anthropogenic OVOCs being particularly notable. Sensitivity tests on enhanced controls revealed that reducing NOx has a significant adverse effect on ozone while VOCs reduction gaining positive benefits, particularly in controlling alkenes with daytime RIR values averaging above 0.5.
3. The pollution shows high temperature sensitivity, with a 1 °C decrease in temperature reducing VOCR/NOxR by 0.12, thereby increasing emission reduction benefits. Mitigating extreme heat through measures such as limiting high-energy consumption and using artificial rainfall, can simultaneously reduce the intensity and reactivity of VOC emissions, aiding in the smooth implementation of ozone pollution control.
In future heatwave scenarios, preemptive mitigation measures should be taken, particularly by selecting low-alkene-emitting plants and strengthening the control of anthropogenic OVOC emissions.
Data availability statement
The raw data supporting the conclusions of this article will be made available by the authors, without undue reservation.
Author contributions
GZ: Conceptualization, Writing–original draft, Writing–review and editing, Formal Analysis. XY: Formal Analysis, Writing–original draft, Writing–review and editing. HY: Conceptualization, Writing–review and editing. CF: Data curation, Writing–review and editing. CM: Funding acquisition, Writing–review and editing. SS: Writing–review and editing. HC: Writing–review and editing. SW: Writing–review and editing. KS: Writing–review and editing. XL: Conceptualization, Funding acquisition, Writing–review and editing.
Funding
The author(s) declare that financial support was received for the research, authorship, and/or publication of this article. This work was supported by the National Natural Science Foundation of China (61905003), the Open Bidding for Selecting the Best Candidates for Scientific and Technological Research Projects in Hefei (2023SGJ027), and the Natural Science Foundation of Jiangsu Province (Grants No. BK20240335).
Conflict of interest
The authors declare that the research was conducted in the absence of any commercial or financial relationships that could be construed as a potential conflict of interest.
Publisher’s note
All claims expressed in this article are solely those of the authors and do not necessarily represent those of their affiliated organizations, or those of the publisher, the editors and the reviewers. Any product that may be evaluated in this article, or claim that may be made by its manufacturer, is not guaranteed or endorsed by the publisher.
Supplementary material
The Supplementary Material for this article can be found online at: https://www.frontiersin.org/articles/10.3389/fenvs.2024.1496584/full#supplementary-material
References
Cardelino, C. A., and Chameides, W. L. (1995). An observation-based model for analyzing ozone precursor relationships in the urban atmosphere. J. Air and Waste Manag. Assoc. 45, 161–180. doi:10.1080/10473289.1995.10467356
Chen, T., Wang, T., Xue, L., and Brasseur, G. (2024). Heatwave exacerbates air pollution in China through intertwined climate-energy-environment interactions. Sci. Bull. 69, 2765–2775. doi:10.1016/j.scib.2024.05.018
Chen, T. S., Xue, L. K., Zheng, P. G., Zhang, Y. N., Liu, Y. H., Sun, J. J., et al. (2020). Volatile organic compounds and ozone air pollution in an oil production region in northern China. Atmos. Chem. Phys. 20, 7069–7086. doi:10.5194/acp-20-7069-2020
Edwards, P. M., Brown, S. S., Roberts, J. M., Ahmadov, R., Banta, R. M., deGouw, J. A., et al. (2014). High winter ozone pollution from carbonyl photolysis in an oil and gas basin. Nature 514, 351–354. doi:10.1038/nature13767
Edwards, P. M., Young, C. J., Aikin, K., deGouw, J., Dubé, W. P., Geiger, F., et al. (2013). Ozone photochemistry in an oil and natural gas extraction region during winter: simulations of a snow-free season in the Uintah Basin, Utah. Atmos. Chem. Phys. 13, 8955–8971. doi:10.5194/acp-13-8955-2013
Feng, C., Rao, Y., Li, H., Sun, R., Meng, Q., and Deng, G. (2023). Analysis of ozone pollution characteristics and precursor cooperative control strategy in Xuzhou City. Acta Sci. Circumstantiae 43, 325–332.
Griffith, S. M., Hansen, R. F., Dusanter, S., Stevens, P. S., Alaghmand, M., Bertman, S. B., et al. (2013). OH and HO2 radical chemistry during PROPHET 2008 and CABINEX 2009-Part 1: measurements and model comparison. Atmos. Chem. Phys. 13, 5403–5423. doi:10.5194/acp-13-5403-2013
Guenther, A., Karl, T., Harley, P., Wiedinmyer, C., Palmer, P. I., and Geron, C. (2006). Estimates of global terrestrial isoprene emissions using MEGAN (model of emissions of gases and aerosols from nature). Atmos. Chem. Phys. 6, 3181–3210. doi:10.5194/acp-6-3181-2006
Guo, J., Zhang, G., Hu, R., Xie, P., Hu, C., Cai, H., et al. (2024). Local radical chemistry driven ozone pollution in a megacity: a case study. Atmos. Environ. 318, 120227. doi:10.1016/j.atmosenv.2023.120227
Hofzumahaus, A., Rohrer, F., Lu, K., Bohn, B., Brauers, T., Chang, C.-C., et al. (2009). Amplified trace gas removal in the troposphere. Science 324, 1702–1704. doi:10.1126/science.1164566
Huang, J., Pan, X., Guo, X., and Li, G. (2018). Health impact of China's Air Pollution Prevention and Control Action Plan: an analysis of national air quality monitoring and mortality data. Lancet Planet Health 2, e313–e323. doi:10.1016/s2542-5196(18)30141-4
Li, K., Jacob, D. J., Liao, H., Zhu, J., Shah, V., Shen, L., et al. (2019). A two-pollutant strategy for improving ozone and particulate air quality in China. Nat. Geosci. 12, 906–910. doi:10.1038/s41561-019-0464-x
Li, M., Huang, X., Yan, D., Lai, S., Zhang, Z., Zhu, L., et al. (2024). Coping with the concurrent heatwaves and ozone extremes in China under a warming climate. Sci. Bull. 69, 2938–2947. doi:10.1016/j.scib.2024.05.034
Liang, W., Yu, H., Xu, H., Wang, Z., Li, T., Feng, Y., et al. (2024). Probing into ozone production through photochemistry of organic peroxyl radicals: implications for source control. J. Geophys. Res. Atmos. 129. doi:10.1029/2023jd040124
Lu, K., Zhou, H., Lee, J., Nelson, B., and Zhang, Y. (2023). Ozone mitigations beyond the control of nitrogen oxides and volatile organic compounds. Sci. Bull. 68, 1989–1992. doi:10.1016/j.scib.2023.07.051
Lu, K. D., Guo, S., Tan, Z. F., Wang, H. C., Shang, D. J., Liu, Y. H., et al. (2019). Exploring atmospheric free-radical chemistry in China: the self-cleansing capacity and the formation of secondary air pollution. Natl. Sci. Rev. 6, 579–594. doi:10.1093/nsr/nwy073
Lu, X., Hong, J., Zhang, L., Cooper, O. R., Schultz, M. G., Xu, X., et al. (2018). Severe surface ozone pollution in China: a global perspective. Environ. Sci. and Technol. Lett. 5, 487–494. doi:10.1021/acs.estlett.8b00366
Meng, X., Jiang, J. K., Chen, T. S., Zhang, Z. K., Lu, B. Q., Liu, C., et al. (2023). Chemical drivers of ozone change in extreme temperatures in eastern China. Sci. Total Environ. 874, 162424. doi:10.1016/j.scitotenv.2023.162424
Qin, K., Rao, L., Xu, J., Bai, Y., Zou, J., Hao, N., et al. (2017). Estimating ground level NO2 concentrations over central-eastern China using a satellite-based geographically and temporally weighted regression model. Remote Sens. 9, 950. doi:10.3390/rs9090950
Rao, Y., Feng, C., Deng, G., Sun, R., Li, H., Meng, Q., et al. (2023). Chemical composition characteristics and analysis of PM_(2.5) in Xuzhou from 2019 to 2021. Environ. Monit. China 39, 158–168.
Rohrer, F., Lu, K., Hofzumahaus, A., Bohn, B., Brauers, T., Chang, C.-C., et al. (2014). Maximum efficiency in the hydroxyl-radical-based self-cleansing of the troposphere. Nat. Geosci. 7, 559–563. doi:10.1038/ngeo2199
Song, B. Y., Wang, Z. C., Ma, W., Zhou, W. S., Tang, Q., Bao, X. L., et al. (2024). Photocatalytic oxidation mechanism of isoprene over titanium oxide by UV-Vis lights. J. Catal. 430, 115362. doi:10.1016/j.jcat.2024.115362
Stockwell, W. R., Kirchner, F., Kuhn, M., and Seefeld, S. (1997). A new mechanism for regional atmospheric chemistry modeling. J. Geophys. Research-Atmospheres 102, 25847–25879. doi:10.1029/97jd00849
Sun, Y., Yin, H., Lu, X., Notholt, J., Palm, M., Liu, C., et al. (2021). The drivers and health risks of unexpected surface ozone enhancements over the Sichuan Basin, China, in 2020. Atmos. Chem. Phys. 21, 18589–18608. doi:10.5194/acp-21-18589-2021
Tan, Z., Feng, M., Liu, H., Luo, Y., Li, W., Song, D., et al. (2024). Atmospheric oxidation capacity elevated during 2020 spring lockdown in chengdu, China: lessons for future secondary pollution control. Environ. Sci. Technol. 58, 8815–8824. doi:10.1021/acs.est.3c08761
Tan, Z., Fuchs, H., Lu, K., Hofzumahaus, A., Bohn, B., Broch, S., et al. (2017). Radical chemistry at a rural site (Wangdu) in the North China Plain: observation and model calculations of OH, HO2 and RO2 radicals. Atmos. Chem. Phys. 17, 663–690. doi:10.5194/acp-17-663-2017
Tan, Z., Lu, K., Jiang, M., Su, R., Wang, H., Lou, S., et al. (2019). Daytime atmospheric oxidation capacity in four Chinese megacities during the photochemically polluted season: a case study based on box model simulation. Atmos. Chem. Phys. 19, 3493–3513. doi:10.5194/acp-19-3493-2019
Tan, Z., Ma, X., Lu, K., Jiang, M., Zou, Q., Wang, H., et al. (2021). Direct evidence of local photochemical production driven ozone episode in Beijing: A case study. Sci. Total Environ. 800, 148868. doi:10.1016/j.scitotenv.2021.148868
Tan, Z. F., Lu, K. D., Jiang, M. Q., Su, R., Dong, H. B., Zeng, L. M., et al. (2018). Exploring ozone pollution in Chengdu, southwestern China: a case study from radical chemistry to O3-VOC-NOx sensitivity. Sci. Total Environ. 636, 775–786. doi:10.1016/j.scitotenv.2018.04.286
Trebs, I., Bohn, B., Ammann, C., Rummel, U., Blumthaler, M., Koenigstedt, R., et al. (2009). Relationship between the NO2 photolysis frequency and the solar global irradiance. Atmos. Meas. Tech. 2, 725–739. doi:10.5194/amt-2-725-2009
Wang, W., Li, X., Cheng, Y., Parrish, D. D., Ni, R., Tan, Z., et al. (2023). Ozone pollution mitigation strategy informed by long-term trends of atmospheric oxidation capacity. Nat. Geosci. 17, 20–25. doi:10.1038/s41561-023-01334-9
Wang, W., Parrish, D. D., Li, X., Shao, M., Liu, Y., Mo, Z., et al. (2020). Exploring the drivers of the increased ozone production in Beijing in summertime during 2005–2016. Atmos. Chem. Phys. 20, 15617–15633. doi:10.5194/acp-20-15617-2020
Yang, X., Lu, K., Ma, X., Liu, Y., Wang, H., Hu, R., et al. (2021). Observations and modeling of OH and HO2 radicals in Chengdu, China in summer 2019. Sci. total Environ. 772, 144829. doi:10.1016/j.scitotenv.2020.144829
Yin, H., Liu, C., Hu, Q., Liu, T., Wang, S., Gao, M., et al. (2021a). Opposite impact of emission reduction during the COVID-19 lockdown period on the surface concentrations of PM2.5 and O3 in Wuhan, China. Environ. Pollut. 289, 117899. doi:10.1016/j.envpol.2021.117899
Yin, H., Lu, X., Sun, Y., Li, K., Gao, M., Zheng, B., et al. (2021b). Unprecedented decline in summertime surface ozone over eastern China in 2020 comparably attributable to anthropogenic emission reductions and meteorology. Environ. Res. Lett. 16, 124069. doi:10.1088/1748-9326/ac3e22
Yu, D., Tan, Z. F., Lu, K. D., Ma, X. F., Li, X., Chen, S. Y., et al. (2020). An explicit study of local ozone budget and NOx-VOCs sensitivity in Shenzhen China. Atmos. Environ. 224, 117304. doi:10.1016/j.atmosenv.2020.117304
Zhang, G., Hu, R., Xie, P., Hu, C., Liu, X., Zhong, L., et al. (2024). Intensive photochemical oxidation in the marine atmosphere: evidence from direct radical measurements. Atmos. Chem. Phys. 24, 1825–1839. doi:10.5194/acp-24-1825-2024
Keywords: ozone pollution, heatwave, oxidation, RIR, VOC emissions
Citation: Zhang G, Yu X, Yin H, Feng C, Ma C, Sun S, Cheng H, Wang S, Shang K and Liu X (2024) Heatwave-amplified atmospheric oxidation in a multi-province border area in Xuzhou, China. Front. Environ. Sci. 12:1496584. doi: 10.3389/fenvs.2024.1496584
Received: 14 September 2024; Accepted: 31 October 2024;
Published: 13 November 2024.
Edited by:
Jun Zhou, Jinan University, ChinaReviewed by:
Dan Dan Huang, Shanghai Academy of Environmental Sciences, ChinaHongwei Xiao, Shanghai Jiao Tong University, China
Copyright © 2024 Zhang, Yu, Yin, Feng, Ma, Sun, Cheng, Wang, Shang and Liu. This is an open-access article distributed under the terms of the Creative Commons Attribution License (CC BY). The use, distribution or reproduction in other forums is permitted, provided the original author(s) and the copyright owner(s) are credited and that the original publication in this journal is cited, in accordance with accepted academic practice. No use, distribution or reproduction is permitted which does not comply with these terms.
*Correspondence: Hao Yin, aGFvLnlpbkB2YW5kZXJiaWx0LmVkdQ==; Xiaoyan Liu, bGl1eHlAYWhtdS5lZHUuY24=
†These authors have contributedequally to this work
 Guoxian Zhang
 Xingyu Yu2†