 Zhiping Yu
 Xin Feng
- College of Economics and Management, Nanjing Forestry University, Nanjing, Jiangsu, China
Green credit financing (GCF) is a specialized financial service offered by banks, aimed at incentivizing borrowers to engage in environmentally sustainable investments, and thus promote sustainable development. It is worth noting that in the practical economic environment, the ability of enterprises to adapt their production and green investment decisions to unforeseen market demand is critical for their green credit financing. This paper investigates a joint production and green investment optimization problem of manufacturers financed through GCF under uncertain demand. Only the interval bound of the demand are known. The problem is initially formulated as a min-max regret model to maximize robustness. Based on problem characterizations, an optimal joint production and green investment decision is proposed. To determine the effectiveness of the proposed decision, computational experiments are conducted on real-world instances. Besides, sensitivity analysis is conducted to derive managerial insights on the implementation of GCF under uncertain demand.
1 Introduction
In the past decades, global warming has led to a series of economic, social and ecological problems that constantly threaten the human living environment (Cai et al., 2020). The increasing carbon emissions have accelerated global warming, causing widespread concern among the government and the public (Dou et al., 2019). In the face of environmental protection and sustainable development issues caused by global warming, it has become increasingly important to control or reduce carbon emissions (Nagurney and Yu, 2012; Liu, 2023). Many governments and the public sector have taken positive actions to help limit carbon emissions, such as enacting laws and regulations to enforce carbon emissions limits, creating carbon cap-and-trade mechanisms, establishing carbon offset systems, levying carbon taxes, encouraging low-carbon investments, and guiding enterprises to transform into green technologies (Song and Leng, 2012). One of the important means to reduce carbon emissions is to incentivize firms to make green technology transitions by providing them with green credit financing.
Green credit financing (GCF) is a financial service provided by banks to encourage borrowers to make green investments and achieve sustainable development (An et al., 2021). It can significantly reduce carbon emissions and other environmental pollution, and promote industrial and economic development (Wang et al., 2022). Unlike other financing models, this financing is subject to rigid constraints on carbon emissions. The prerequisite for obtaining a loan is that the borrower must apply for the loan for green investment, undertake green transformation and upgrading, and ensure that it meets pre-established environmental standards (An et al., 2021). Compared with the traditional credit financing model, on the one hand, the interest rate of green credit financing is lower, which greatly reduces the repayment pressure of loans and alleviates the financial difficulties of enterprises; on the other hand, previous studies have found that green credit financing can promote the transformation of enterprise green technology, optimize enterprise capacity structure to promote economic growth, and achieve a win-win situation of ecological and economic benefits (Chen et al., 2021). Hence, GCF is considered to be a bridge between economy and environment (Ji et al., 2021).
Although GCF reduces the environmental impact of corporate operations, the uncertain demand environment in the process of business operation poses great challenges to capacity, loan, and green investment decisions. For instance, Karabuk and Wu designed a strategic capacity planning model to study the impact of uncertainty on enterprise capacity decisions, and they observed that capacity uncertainty induces more capacity expansion, while demand uncertainty leads to higher levels of outsourcing (Karabuk and Wu, 2003). Im, Kang and Shon constructed a panel data model to study the impact of uncertainty on the target capital structure and financing decision of enterprises, the results showed that the increase of uncertainty reduces the debt tax shield and increases the potential financial distress cost (Im et al., 2020). Kaczmarek pointed out that the investment decision of enterprises depends on the future economic situation, which is determined by many factors that are difficult to predict and determine (Kaczmarek, 2015). Therefore, if enterprises want to promote green technology transformation by introducing GCF, they must fully consider the uncertainty of demand and deal with it. For the demand in the real world, it is usually difficult to be certain due to some accidental factors such as the product market prospects, green technology investment level and carbon emission reduction level. In other words, production and green investment decisions often have to be made under uncertain environments, which increases the complexity of the enterprise production and operation. Most existing studies deal with uncertainties by assuming that the demand obeys a given probability distribution based on a large amount of historical data. However, for the fluctuations in the business environment or the development of new green technologies, even the probability distribution of product demand in some extreme cases is unavailable. Hence, we apply the robust approach to address such an uncertain demand environment. Specifically, this paper structures the uncertain demand through interval scenarios, where the product demand can vary within a specified range defined by lower and upper bounds. The educated guess of the product demand is represented by its lower and upper bounds.
In the academic area, though there are abundant studies exploring the production and operation strategies of enterprises supported by green credit, few of them focus on the uncertain demand, especially considering the uncertain demand under interval scenarios. Considering the uncertainty demand under interval scenarios will make our model more realistic. In this paper, we introduce the min-max regret theory to construct a robust optimization decision model for the evolutionary characteristics of enterprises facing uncertain risks, while considering the carbon emission constraint mechanism brought by green credit. This paper can provide a new perspective for the study of green credit and enterprise greening transition. Based on the above background, we mainly study the following questions: (1) How to build a risk-resistant decision-making system for firms’ production and green technology inputs based on uncertain demand supported by green credit? (2) What is the optimal strategy for firms’ production and green technology input decisions supported by green credit? (3) What is the pathway of green credit to support the promotion of green transformation of enterprises?
To explore the above problems, this paper further analyzes the structural characteristics of the problem based on the regret value theory and robust optimization theory on the basis of establishing the uncertain model of demand information, explores the relevant properties of the optimal production and green technology input decisions, and narrows the search space of the optimal strategy under the uncertain environment, so as to reduce the complexity of the problem. The relevant influencing factors of the optimal decision-making are also analyzed to condense the relevant conclusions on the production and green technology input of enterprises based on uncertain demand under the support of green credit.
Our essential contributions are reflected in the following three aspects. First, a new robust model for the optimal joint production and green investment decision that considers interval demand data is formulated to minimize the maximum regret on the enterprise revenue function. The model can hedge against demand uncertainty especially even the probability distribution of demand cannot be obtained. Second, based on the establishment of a model for uncertain demand information, this paper delves into the worst-case scenarios under uncertainty, establishes the mapping relationship between maximum regret and optimal decisions for production and green technology investment, and subsequently identifies the optimal strategy that minimizes the maximum regret. Third, based on the conclusions derived from relevant research, this paper conducted numerical experiments and sensitivity analyses, yielding corresponding management insights. The relevant regulatory authorities should establish appropriate carbon emission caps based on both favorable and unfavorable environmental conditions to optimally leverage the GCF in stimulating enterprises to engage in green production and invest in green technologies. To maximize the incentive effectiveness of GCF, various governmental strategies, including discounted loans, flexible repayment schedules, and other forms of subsidies or incentives, should be cautiously explored to better facilitate the implementation of green credit policies.
2 Literature review
This study is related to the literature in two research streams: (1) Production and Operation Management considering green finance under deterministic scenario; (2) Production and Operation Management considering green finance under uncertain environments. This section briefly reviews the research of the above two fields and explains the differences between our research and previous literature.
2.1 Under deterministic scenario
This study focuses on GCF, which belongs to the category of green finance. Therefore, we first review the literature on production and operation management considering green finance under deterministic scenario.
Some studies have analyzed green finance in conjunction with the green production behavior of firms. For instance, Lv, Fan and Lee examined the impact of green credit policy on firms’ green productivity using a double difference model and found that the implementation of green credit can significantly increase the green productivity of heavy polluters (Lv et al., 2023). Based on the context of transition insurance and green credit services, Liu et al. constructed a dynamic stochastic general equilibrium model covering the banking and insurance sectors, and they found that green credit incentives not only curb carbon emissions, but also increase the likelihood of producers’ energy transitions, which promotes low-carbon economic growth (Liu et al., 2023). Cui, Wang and Wang established an evolutionary game model including four players: government, financial institutions, enterprises and consumers, and used simulation methods to analyze the influence of each parameter on the changes and development of green financial market. The results show that the integrity of the green financial system has a positive impact on sustainable development and clean production (Cui et al., 2020). In addition, related studies have mainly focused on considering the impact of carbon emission caps brought about by green finance on enterprises’ operational decisions (Zhang and Xu, 2013; Feng et al., 2022; Lee and Yoon, 2022). At the same time, some studies have also treated carbon cap as a penalty mechanism for profit function, that is, if the enterprise exceeds the pre-established carbon emission cap in production and operation, it will get a certain profit penalty, and the expected profit of the enterprise will be reduced (An et al., 2021). As seen, the above literature has focused more on green production under green finance but has not considered possible investments in green technologies.
Other studies have considered both green production and green technology input decisions of firms under green finance policies. For example, Chen et al. integrated green credit policy with business decision-making and innovation behavior into a unified analytical framework to explore how to guide enterprises to carry out green production and low-carbon technological innovation (Chen et al., 2022). Wang and Wang suggested that upgrading industrial structure through green production and increasing investment in green innovation are the key influential paths to accelerate green transformation (Wang and Wang, 2023). Zhang studied the causal effect of green credit policy on green production and revisited the Porter hypothesis. By categorizing R&D into environmentally induced R&D and production R&D, it was found that green credit policy significantly increased green total factor productivity growth (Zhang, 2021). Tian et al. argued that green credit can guide the flow of funds from energy-consuming and highly polluting industries to technologically advanced emerging industry sectors, thus supporting the development of green industries and curbing emissions from polluting industries (Tian et al., 2022). Liu, Xia and Lee pointed out that green credit optimizes corporate debt financing by alleviating financing constraints, reducing debt costs and extending debt maturity structure, drives green technological innovation and encourages enterprises to carry out green production (Liu et al., 2024). In addition, relevant studies have analyzed carbon emission caps to green production and green technology investment, and they pointed out that with the support of green finance, enterprises can realize the unity of economic and environmental benefits through green production and increased investment in green technology (Bouchery et al., 2012; Yang et al., 2020; Li et al., 2022). All of the above studies are based on deterministic scenarios and do not consider the impact of uncertain environments on the production and operation management of enterprises.
2.2 Under uncertain environments
The general fluctuation of business environment is an important factor affecting the operation and management of enterprises. Many researchers have discussed manufacturers’ operational decisions under uncertain environments.
Some studies have mostly explored the research on firms’ production and green technology input decision-making based on the uncertainty of economic policy, monetary policy, product supply. For instance, Zhang and Kong introduced the condition of economic policy uncertainty to explore the relationship between green credit policy and firms’ green technology inputs, and found that economic policy uncertainty is negatively related to firms’ green technology inputs (Zhang and Kong, 2022). Based on the background that manufacturers are subject to supply uncertainty and financial constraints, Wu and Shang established a Stackelberg game model to study the equilibrium green credit financing problem in a green supply chain with government subsidies and supply uncertainty, and analyzed how subsidy interest rates, supply uncertainty, and supply correlation affect the financing decision of equilibrium green credits as well as green products’ R&D investment decision (Wu and Shang, 2021a). In addition, some scholars explored the impact of green credit policy on corporate production and green technology innovation behavior from the perspectives of climate policy uncertainty environment and overall external uncertainty environment (Xu et al., 2021; Hoang, 2022; Du and Guo, 2023). The above-mentioned studies have paid more attention to the management of business production operations in various types of uncertain environments, but have ignored the demand uncertain environment that is directly related to the core business of a company.
Regardless of how other uncertainties change, they ultimately need to be reflected through market demand. And the uncertainty of demand directly determines how companies make production plans, inventory strategies, and sales forecasts (Zhang et al., 2018; Zhang et al., 2022; Liao et al., 2019). Under such a setting, other studies have explored firms’ production and green technology input decisions in environments with uncertain demand information. Assuming that demand is uncertain and dependent on certain green investments, and that such uncertain demand obeys an associated probability distribution, Cohen, Lobel and Perakis extended the current understanding of the pricing newsvendor model, incorporated external influences from the government, and quantified how uncertainty in demand affects corporate production and green technology investment (Cohen et al., 2016). An et al. compared the optimal operational decisions and profit levels of both supply chain parties under green credit financing and commercial credit financing by considering a manufacturer with carbon emission limitations as well as financial constraints in a demand uncertainty scenario. They found that under relatively strict carbon emission policies, manufacturers can set appropriate green investment ranges and realize win-win situations with suppliers (An et al., 2021). Wang, Zou and Geng discussed green technology investment decisions in a decentralized supply chain under demand uncertainty, they found that providing corresponding incentives can optimize supply chain operation decisions and better guide retailers to participate in green technology investment (Wang et al., 2021). Wu and Shang established a Stackelberg game to study the information leakage and optimal green operation decision of supply chain under uncertain demand, the results showed that if suppliers disclose demand information, they will invest more in green product development (Wu and Shang, 2021b). The above literature considers the impact of green credit on firms under uncertain demand, but all of them are based on probability distributions to portray demand uncertainty. Unlike them, this paper considers describing the demand uncertainty environment through interval scenarios.
3 Methodology
3.1 Preliminary
This paper studies a single-period revenue maximization problem for a financially constrained manufacturer who sells a class of products to the market. The problem entails the following assumptions:
• There is a two-stage decision-making process for the manufacture to maximize its revenue under uncertain demand. The first stage decision is choosing appropriate financing channel to obtain the loan for production, and the second is making decisions on production quantity q and green investment K.
• The manufacturer can obtain a green loan called GCF from a bank which requires the manufacturer to meet the carbon emission constraint;
• The demand of the product cannot be learned in advance, but varies uniformly within a closed interval
• The unit price and unit production cost of the product is assumed to be p and c respectively. Then the sales and the production cost of the manufacturer is
• The manufacturer’s initial carbon emission per unit of production quantity is denoted as C. Then the final carbon emission after green investment is
• The bank offers the manufacturer GCF only if his carbon emissions do not exceed a certain carbon cap T, i.e.,
Because of uncertain demand, we adopt a robust approach to find a green production and finance decision that minimizes the maximal deviation from the optimum under all possible scenarios. To identify the performance of a robust decision, a criterion called min-max regret is widely adopted which seeks a decision closing to the optimal one by bounding the magnitude of missed opportunities. More concretely, for a green production decision under a determined finance channel, which includes production quantity q and green investment K, the corresponding revenue under a scenario s is denoted as
Define the scenario maximizing the regret of decision
The following technical lemma is useful in analysis of the main result.
Lemma 1. For a given function
Lemma 2. For any positive real number
We omit the proof of Lemma one and 2, since they can be easily proved by quadratic-root formula and extremum principle.
Lemma 3. For any positive real numbers
Proof.
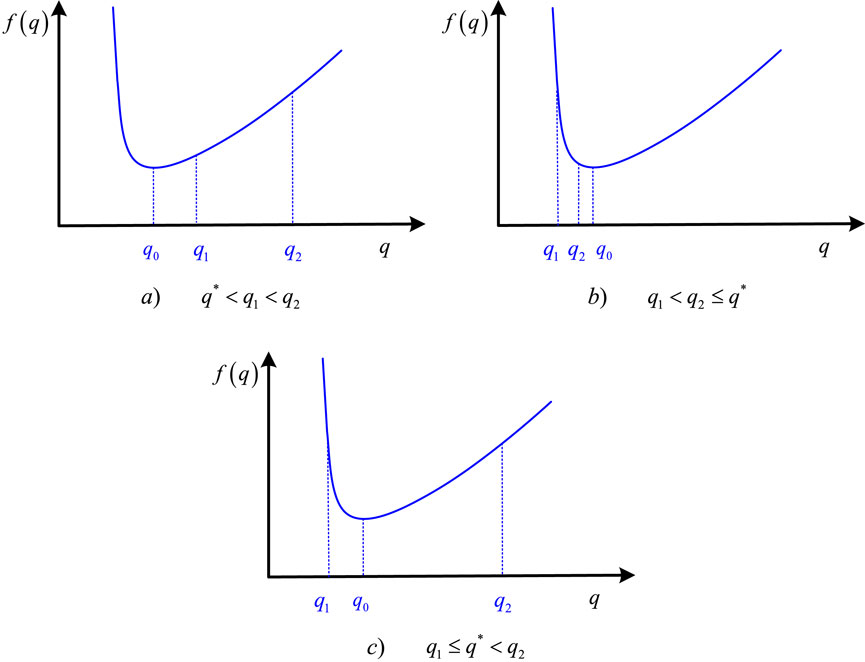
Figure 1. Illustration of
Lemma 4. For given function
Proof. Because
If
If
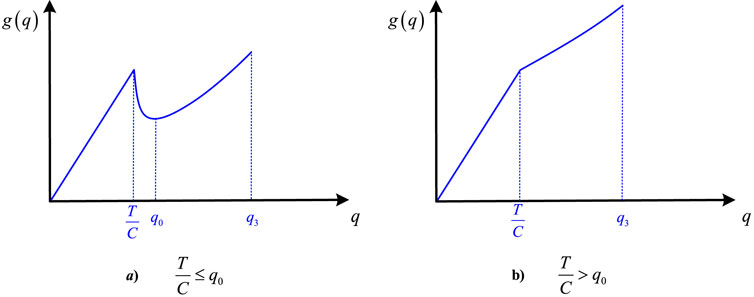
Figure 2. Illustration of
3.2 Decisions of GCF under deterministic scenario
We first analysis the optimal production and green investment decisions of GCF under a deterministic scenario s. Denote the optimal production and green investment decisions with the maximal revenue under scenario s as
Note that the optimal production quantity cannot exceeds the demand under scenario s, i.e.,
Consider the carbon emission constraint
Otherwise
In conclusion, according to Equations 6, 7,
Because the optimal production quantity
Lemma 5. When
Proof. According to Equation 8, if the demand under scenario s is
Otherwise
According to Equations 10, 11, the lemma is proved.
Lemma 6. When
Proof. If the demand under scenario s is
Otherwise
According to Equations 13, 14, the lemma is proved.
The relationship between
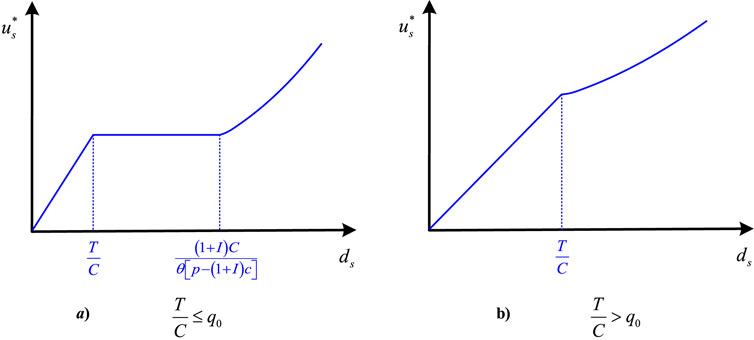
Figure 3. The relationship between
Lemma 7. The optimal revenue
Based on the above analysis, we can determine the optimal production and green investment decisions of GCF under deterministic scenario s as follows:
Theorem 1. The optimal production and green investment decisions of GCF under deterministic scenario s can be calculated in Equation 15 as
3.3 Decisions of GCF under uncertain environment
While for the uncertain environments where the demand is uncertain but lies in an interval
Similar as that pointed out in Section 4,
Because we cannot learn the exact value of
Lemma 8. When
and.
1) if
2) Otherwise
Proof. According to Equation 17 when
The subscript “1” of
According to Lemma 7,
In order to minimize the maximum regret
Lemma 9. When
which increases with
Proof. According to Equation 17, when
The subscript “2” of
The regret of the production decision q under scenario s when
Because
which is decreasing with
which increases with
In conclusion, once a production decision is determined under uncertain environment, if the production quantity is less than the actual demand, i.e.,
Theorem 2. The robust production and green investment decisions of GCF with minimal maximum regret under uncertain environment can be calculated in Equations 27, 28 as
Proof. According to Lemma 8, 9, when
Similarly, when
Otherwise, when
As shown in Figure 6A, if
Otherwise
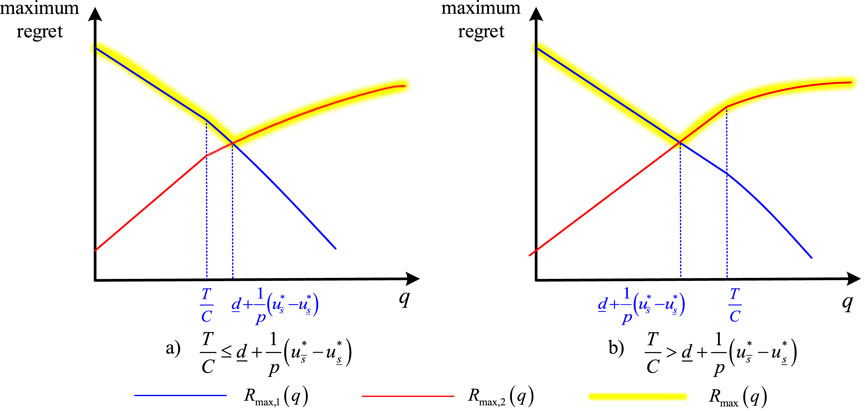
Figure 4. Illustration of
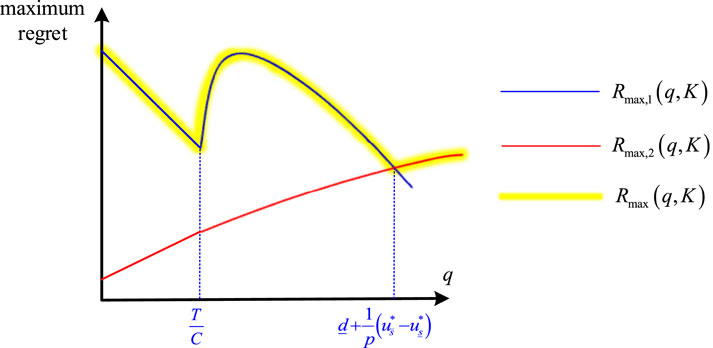
Figure 5. Illustration of
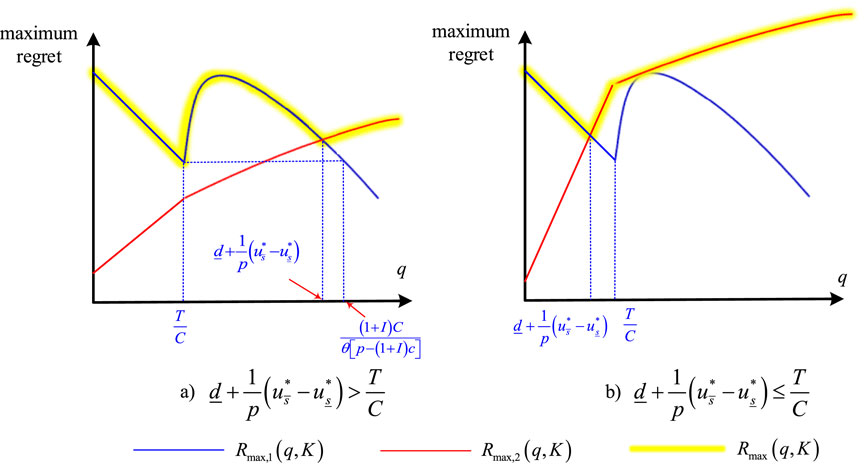
Figure 6. Illustration of
4 Further analysis
4.1 Decisions analysis
According to Theorem 2, when
In order for GCF to play a positive role in the green transformation of the manufacturing industry, we discuss the robust production and green investment decisions of GCF from the following six cases.
Case 1. The safe yield does not exceed the dual safe yield., i.e.
Case 1.1.
Because
Case 1.2.
According to Lemma 5,
According to Equations 29, 30,
According to Theorem 2,
Case 1.3.
According to Lemma 5,
According to Equations 31, 32,
According to Theorem 2, only when
Case 1.4.
Because
Case 2. The safe yield is larger than the dual safe yield., i.e.
Case 2.1.
Because
Case 2.2.
According to Lemma 6,
Hence,
According to Theorem 2, only when
Case 2.3.
Because
Table 1 summarizes the results of the above six cases. According to Table 1, when
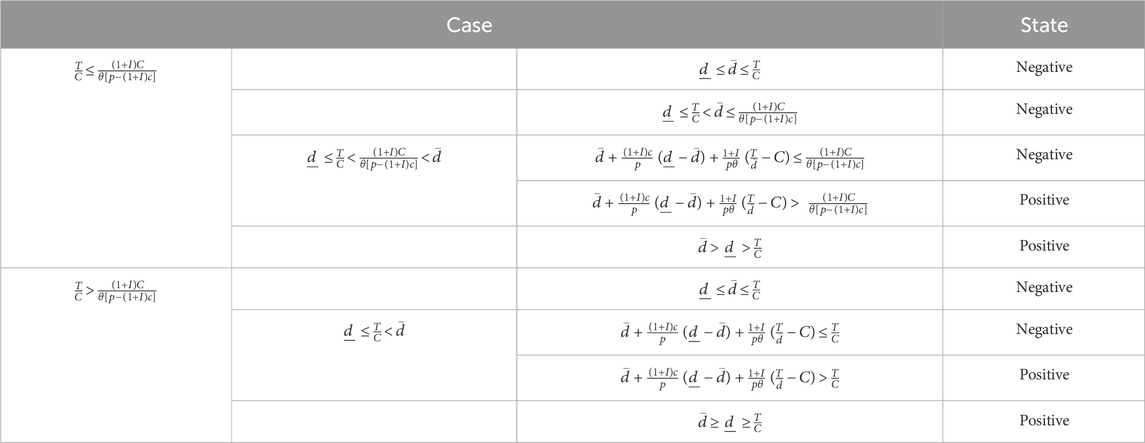
Table 1. Analysis of influencing factors of optimal production and green investment decisions of GCF under uncertain environment.
4.2 Managerial insights
Observing the expressions on the right-hand side of the greater-than symbol in Equation 35,
A detailed analysis of the promotion of green production and green technology investment in manufacturing companies by GCF under favorable and unfavorable environmental conditions is conducted as follows.
When considering the carbon emission cap T in accordance with Equation 35, it is worth noting that GCF plays a crucial role in promoting green transformation when
While in the favorable environment, GCF effectively prompts green transformation when
Similarly, concerning the manufacturer’s initial carbon emission per unit of production quantity
As for the interest rate I in accordance with Equation 35, given that
Similarly, as for production cost c and the unit carbon emission reduction rate
5 Numerical results
In the previous section, we characterize the optimal production and green investment decisions of GCF for the manufacturer under deterministic scenario and uncertain environment. Next, in this section, we conduct numerical analysis to further analyze the performance of the strategy.
5.1 Instance generation
In order to make numerical experiments more convincing, we use real-world data to do numerical analysis. We selected a listed power generation company in China, which invested in carbon capture and storage technology to reduce carbon emissions. Firstly, as pivotal recipients of green financial policies, state-owned enterprises (SOEs) exhibit green credit financing behaviors that directly mirror the effectiveness of policy implementation. By examining how SOEs leverage green credit under uncertain demand conditions to make decisions regarding green production and green technology investments, we can assess the impetus provided by green financial policies for the green transformation of SOEs. Secondly, SOEs generally possess robust information disclosure systems and comprehensive data records, facilitating easier access to research data with high reliability. This aids in drawing more precise conclusions when analyzing green credit financing behaviors. Finally, SOEs occupy a significant position in the Chinese economy, and their green credit financing behaviors are broadly representative. Selecting SOEs as research cases aids in deriving conclusions and recommendations that are more widely applicable to other types of enterprises, thereby providing theoretical references and practical guidance for optimizing and promoting green financial policies and enhancing policy implementation efficiency. The instance generation is summarized in Table 2.
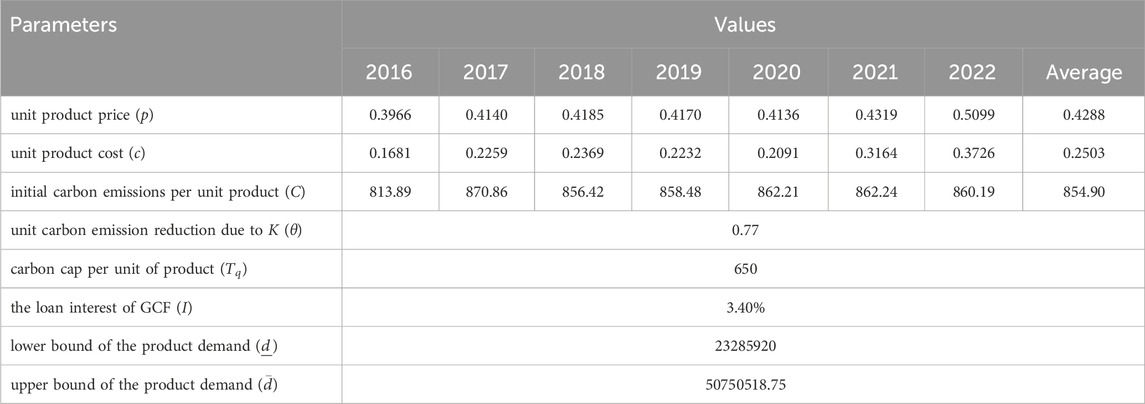
Table 2. Parameters of instances.
The unit price and unit production cost of the product parameters are adapted from the company’s Annual Reports. The relevant data are as follows: p = 0.3966, 0.4140, 0.4185, 0.4170, 0.4136, 0.4319, 0.5099, 0.4288 and c = 0.1681, 0.2259, 0.2396, 0.2232, 0.2091, 0.3164, 0.3726, 0.2503. The manufacturer’s initial carbon emission per unit of production quantity is based on the annual Environmental, Social and Governance Report, which implies C = 813.89, 870.86, 856.42, 858.48, 862.21, 862.24, 860.19, 854.90.
As for the value of θ, we refer to some related studies on CCS technology investment and An et al. (An et al., 2021). In their study, the green investment cost is 100 million yuan/year, and the unit carbon emission reduction due to green improvement is set 77 g CO2/kWh. Therefore, we set the per-unit carbon emission reduction after green input to be θ = 0.77. Besides, we set the carbon cap per unit of product
Finally, the demand of the product in our study is uncertain, but varies uniformly within a closed interval
5.2 Strategy evaluation
5.2.1 Comparative analysis of robust strategy and experience strategy under uncertain environment
In Section 3, we determine the robust strategy (RS) of GCF with minimal maximum regret under uncertain environment. Meanwhile, in the face of uncertain demand environment, the enterprise can also choose the experience strategy (ES) that considers the demand as the upper and lower bounded mean based on the specific production situation as well as the historical product demand.
In order to assess the performance of the proposed robust strategy, experiments are conducted on the enterprise’s 2016-2022 as well as average year instances within the demand interval [23285920, 50750518.75] to compare and analyze the robust strategy as well as the experience strategy. Because Theorem 2 provides the

Table 3. Regret value experiments for 2016-2022 and average year instances.
Besides, we can observe from column 5-6 in Table 3 and Figure 7 that
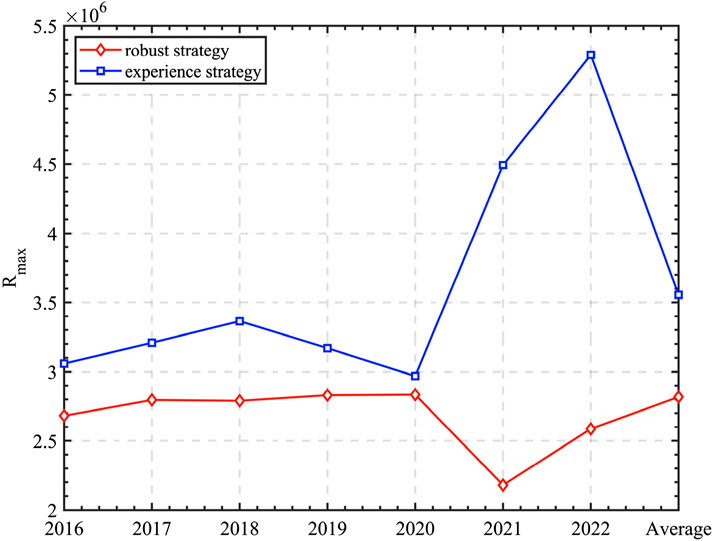
Figure 7. The minimal maximum regret value of the robust strategy and experience strategy under uncertain environment.
To evaluate the quality of robust strategy solution, the indicator
5.2.2 Comparative analysis of robust strategy revenue and optimal revenue under deterministic scenario
Next, we restrict the decision to the deterministic scenario, and take the full information setting as well as consider the case where the product demand information is deterministic. Assume that the firm’s product demand is the mid-point of the demand interval scenario, i.e.,
Under the deterministic demand, we compute
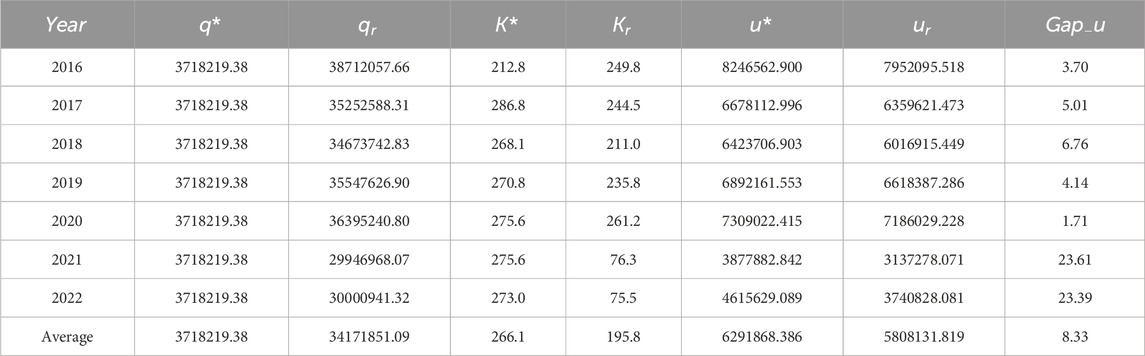
Table 4. Revenue experiments for 2016-2022 and average year instances.
Column 1 of Table 4 denotes the year. Columns 2-5 present the values of
Besides, the indicator
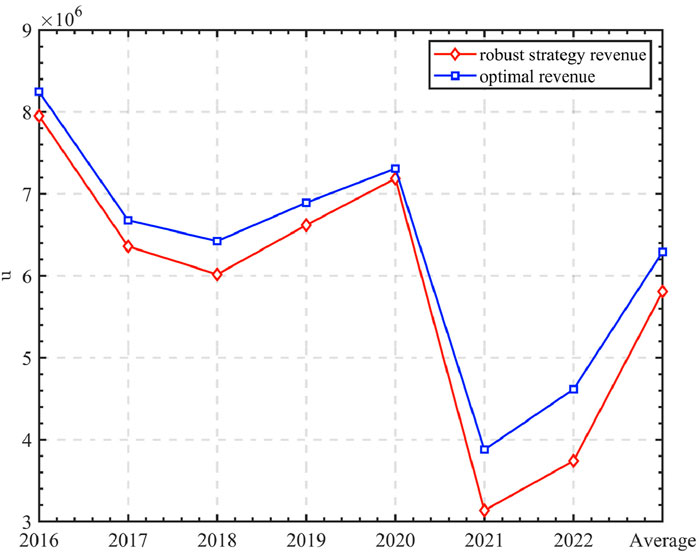
Figure 8. The revenue of the robust strategy and the mid-point scenario under deterministic environment.
5.3 Sensitivity analysis
Since robust strategy can always output near-optimal solutions under uncertain environments and deterministic scenarios, we further investigate to conduct the sensitivity analysis. Because the fluctuations of
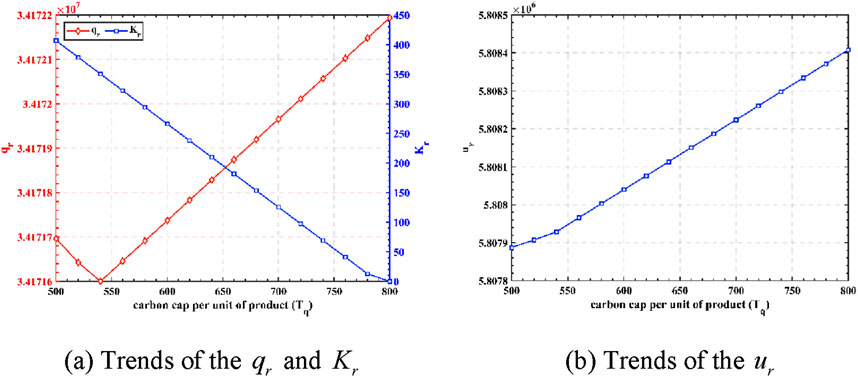
Figure 9. The impact of green credit carbon constraints on decision-making and revenues. (A) Trends of the
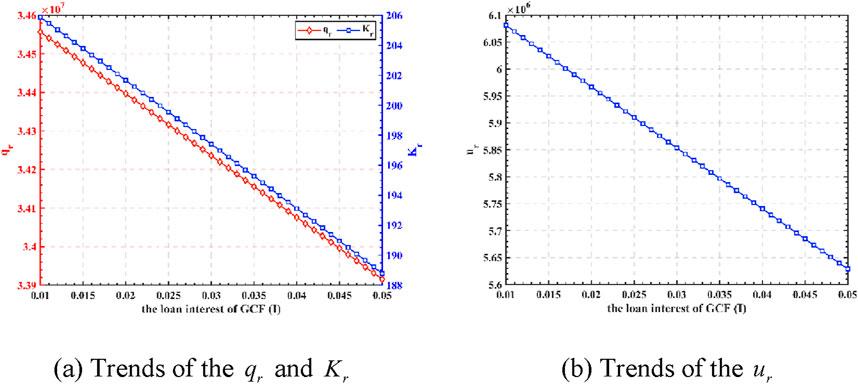
Figure 10. The impact of green credit interest rates on decision-making and revenues. (A) Trends of the
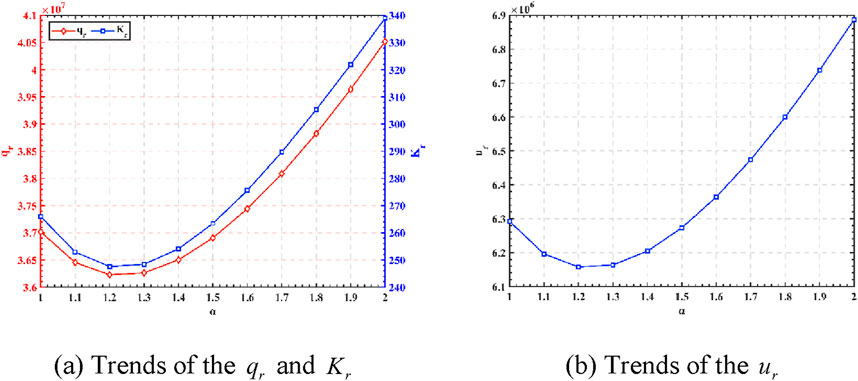
Figure 11. The impact of green credit on decision-making and revenues under the fluctuation of demand interval. (A) Trends of the
Firstly, we consider the case of
Next, we consider the case of green credit interest rate I ∈ [0.01, 0.05]. According to Figure 10, it can be seen that the green credit interest rate is negatively related to the manufacturer’s optimal production decision, optimal green technology investment decision, and revenues. The lower green credit interest rate means the more favorable lending provided by the bank, the smaller the investment cost of green and low-carbon technology that the manufacturer has to bear, and then the manufacturer tends to increase the investment in green and low-carbon technology. Hence, GCF with lower interest rates is always beneficial in encouraging manufacturing firms to invest in green technologies. It is more urgent to explore strategies such as government discounted loans, flexible repayment options, and other government incentives or subsidies to minimize loan interest rates.
Finally, we liberalize the restriction on the demand information interval and adopt a setting where the demand information fluctuates according to the alpha coefficient. That is, d = [37018219.38 *1/α, 37018219.38 *α]; α ∈ [1, 2].
Figure 11 shows that the ups and downs of the manufacturer’s production decisions, green technology investment decisions and revenues in response to fluctuations in the demand interval. As the degree of fluctuation in the demand interval rises, the manufacturer’s production, green technology investment, and revenues all increase significantly. This is because under the current carbon emission constraints and strong market demand, enterprises are more willing to apply for green credits for green production and increase green technology inputs in order to increase their market share.
6 Conclusion
This paper analyzes a critical issue in joint decision-making for enterprise production and green technology investment under uncertain demand environments, while simultaneously considering carbon emission constraints. The problem is formulated as a robust min-max regret model aimed at achieving maximum total revenue, seeking an optimal trade-off between production and green technology investment. To optimize the solution to this problem, a robust optimization algorithm is proposed that characterizes uncertain demand through interval scenarios and introduces a min-max regret criterion to find an approximate optimal solution within an acceptable revenue range.
The proposed algorithm is tested using real-world instances. The results demonstrate that, under uncertain environments, our robust optimization algorithm exhibits superior robustness compared to experience methods. It effectively handles the risks associated with uncertainty in demand information and reflects the effectiveness of the strategy. Besides, in deterministic scenarios, our robust optimization algorithm not only demonstrates strong risk resistance but also guarantees revenue under average conditions. Therefore, implementing robust optimization techniques in uncertain environments to formulate robust optimization strategies against the uncertain risks involved in enterprises’ production and green technology investment decision-making processes represents an optimal approach.
The present study offers the following managerial insights: (1) The financial support provided by green credit, coupled with carbon emission constraints, exerts significant influence on firms’ production decisions and investments in green technologies. On one hand, green credit policies alleviate financial distress for enterprises. On the other hand, enterprises also confront pressures stemming from the carbon emission constraints imposed by green credit. Consequently, under the dual support and constraint of green credit, enterprises are incentivized to advance further towards green transformation and development. (2) Sensitivity analysis reveals that enterprises are more inclined to opt for green credit for financing green technology investments and operations under stricter carbon emission caps, lower interest rates, and robust market demands. Hence, it is imperative for governments to collaborate with financial institutions in designing the terms of green credit, including carbon emission constraints and interest rates, and to guide the market accordingly. This will encourage enterprises to actively leverage green credit to empower their production processes and thereby achieve green transformation.
The limitations of this paper are as follows: Firstly, in this study, the manufacturer’s decisions are limited to a single decision cycle, whereas in reality, multi-period decisions are often interconnected, the selection of empirical cases remain to be further enriched and expanded. Besides, the paper does not classify enterprises based on their production scale and level of greenness. Therefore, in future research, we will categorize enterprises prior to investigating the uncertainty risks involved in production and green technology investment decision-making processes across different enterprise types. Thirdly, we recognize that the implementation effects of green credit policies vary across different industries, regions, and enterprises. Therefore, in subsequent research, we plan to conduct a deeper analysis of these variations and their underlying causes. By collecting and analyzing more relevant data, combined with field research and expert interviews, we aim to uncover the implementation effects and influencing factors of green credit policies in various contexts. These limitations will simultaneously serve as directions for further research in this paper.
Data availability statement
The original contributions presented in the study are included in the article/supplementary material, further inquiries can be directed to the corresponding author.
Author contributions
ZY: Conceptualization, Data curation, Investigation, Methodology, Software, Validation, Writing–original draft. XF: Formal Analysis, Funding acquisition, Project administration, Resources, Supervision, Visualization, Writing–review & editing.
Funding
The author(s) declare that financial support was received for the research, authorship, and/or publication of this article. This study is funding by the Key Project of Philosophy and Social Science Research in Colleges and Universities in Jiangsu Province (No. 2023SJZD020).
Conflict of interest
The authors declare that the research was conducted in the absence of any commercial or financial relationships that could be construed as a potential conflict of interest.
Publisher’s note
All claims expressed in this article are solely those of the authors and do not necessarily represent those of their affiliated organizations, or those of the publisher, the editors and the reviewers. Any product that may be evaluated in this article, or claim that may be made by its manufacturer, is not guaranteed or endorsed by the publisher.
References
An, S., Li, B., Song, D., and Chen, X. (2021). Green credit financing versus trade credit financing in a supply chain with carbon emission limits. Eur. J. Oper. Res. 292, 125–142. doi:10.1016/j.ejor.2020.10.025
Bouchery, Y., Ghaffari, A., Jemai, Z., and Dallery, Y. (2012). Including sustainability criteria into inventory models. Eur. J. Oper. Res. 222, 229–240. doi:10.1016/j.ejor.2012.05.004
Cai, W., Song, X., Zhang, P., Xin, Z., Zhou, Y., Wang, Y., et al. (2020). Carbon emissions and driving forces of an island economy: a case study of Chongming Island, China. J. Clean. Prod. 254, 120028. doi:10.1016/j.jclepro.2020.120028
Chen, C., Zhang, Y., Bai, Y., and Li, W. (2021). The impact of green credit on economic growth—the mediating effect of environment on labor supply. PLoS One 16, e0257612. doi:10.1371/journal.pone.0257612
Chen, Z., Zhang, Y., Wang, H., Ouyang, X., and Xie, Y. (2022). Can green credit policy promote low-carbon technology innovation? J. Clean. Prod. 359, 132061. doi:10.1016/j.jclepro.2022.132061
Cohen, M. C., Lobel, R., and Perakis, G. (2016). The impact of demand uncertainty on consumer subsidies for green technology adoption. Manag. Sci. 62, 1235–1258. doi:10.1287/mnsc.2015.2173
Cui, H., Wang, R., and Wang, H. (2020). An evolutionary analysis of green finance sustainability based on multi-agent game. J. Clean. Prod. 269, 121799. doi:10.1016/j.jclepro.2020.121799
Dou, G., Guo, H., Zhang, Q., and Li, X. (2019). A two-period carbon tax regulation for manufacturing and remanufacturing production planning. Comput. Ind. Eng. 128, 502–513. doi:10.1016/j.cie.2018.12.064
Du, Y., and Guo, Q. (2023). Green credit policy and green innovation in green industries: does climate policy uncertainty matter? Financ. Res. Lett. 58, 104512. doi:10.1016/j.frl.2023.104512
Feng, Y., Geng, Y., Zhao, G., and Li, M. (2022). Carbon emission constraint policy in an OEM and outsourcing remanufacturer supply chain with consumer preferences. Int. J. Environ. Res. Public Health 19, 4653. doi:10.3390/ijerph19084653
Hoang, K. (2022). How does corporate R&D investment respond to climate policy uncertainty? Evidence from heavy emitter firms in the United States. Corp. Soc. Responsib. Environ. Manag. 29, 936–949. doi:10.1002/csr.2246
Im, H. J., Kang, Y., and Shon, J. (2020). How does uncertainty influence target capital structure? J. Corp. Financ. 64, 101642. doi:10.1016/j.jcorpfin.2020.101642
Ji, L., Jia, P., and Yan, J. (2021). Green credit, environmental protection investment and debt financing for heavily polluting enterprises. PLoS One 16, e0261311. doi:10.1371/journal.pone.0261311
Kaczmarek, J. (2015). Risk and uncertainty in the investment decisions. ref 1, 145–156. doi:10.12988/ref.2015.51216
Karabuk, S., and Wu, S. D. (2003). Coordinating strategic capacity planning in the semiconductor industry. Oper. Res. 51, 839–849. doi:10.1287/opre.51.6.839.24917
Lee, D.-H., and Yoon, J.-C. (2022). Decisions on pricing, sustainability effort, and carbon cap under wholesale price and cost-sharing contracts. Sustainability 14, 4863. doi:10.3390/su14084863
Li, J., Lai, K. K., and Li, Y. (2022). Remanufacturing and low-carbon investment strategies in a closed-loop supply chain under multiple carbon policies. Int. J. Logist.-Res. Appl. 27, 170–192. doi:10.1080/13675567.2022.2056156
Liao, H., Deng, Q., and Shen, N. (2019). Optimal remanufacture-up-to strategy with uncertainties in acquisition quality, quantity, and market demand. J. Clean. Prod. 206, 987–1003. doi:10.1016/j.jclepro.2018.09.167
Liu, F., Xia, Z., and Lee, C.-C. (2024). Does green credit benefit the clean energy technological innovation and how? The policy catering behavior of enterprises. J. Clean. Prod. 444, 141256. doi:10.1016/j.jclepro.2024.141256
Liu, H., Liu, Z., Zhang, C., and Li, T. (2023). Transformational insurance and green credit incentive policies as financial mechanisms for green energy transitions and low-carbon economic development. Energy. Econ. 126, 107016. doi:10.1016/j.eneco.2023.107016
Liu, J. (2023). Path analysis of energy economic management standardization in the context of carbon neutralization and carbon peak. Front. Ecol. Evol. 11, 1155401. doi:10.3389/fevo.2023.1155401
Lv, C., Fan, J., and Lee, C.-C. (2023). Can green credit policies improve corporate green production efficiency? J. Clean. Prod. 397, 136573. doi:10.1016/j.jclepro.2023.136573
Nagurney, A., and Yu, M. (2012). Sustainable fashion supply chain management under oligopolistic competition and brand differentiation. Int. J. Prod. Econ. 135, 532–540. doi:10.1016/j.ijpe.2011.02.015
Song, J., and Leng, M. (2012). “Analysis of the single-period problem under carbon emissions policies,” in Handbook of newsvendor problems (Springer, New York: Int. Ser. Oper. Res. Manag. Sci.), 297–313. doi:10.1007/978-1-4614-3600-3_13
Tian, C., Li, X., Xiao, L., and Zhu, B. (2022). Exploring the impact of green credit policy on green transformation of heavy polluting industries. J. Clean. Prod. 335, 130257. doi:10.1016/j.jclepro.2021.130257
Wang, C., and Wang, L. (2023). Green credit and industrial green total factor productivity: the impact mechanism and threshold effect tests. J. Environ. Manage. 331, 117266. doi:10.1016/j.jenvman.2023.117266
Wang, C., Wang, Z., Zheng, L., Lu, S., Li, X., Rong, Y., et al. (2022). Strategies for spatial analysis of carbon emissions from human-social systems: a framework based on energy consumption and land use. Front. Ecol. Evol. 10, 990037. doi:10.3389/fevo.2022.990037
Wang, C., Zou, Z., and Geng, S. (2021). Green technology investment in a decentralized supply chain under demand uncertainty. Sustainability 13, 3752. doi:10.3390/su13073752
Wu, J., and Shang, J. (2021a). Green credit financing equilibrium under government subsidy and supply uncertainty. Sustainability 13, 12917. doi:10.3390/su132212917
Wu, J., and Shang, J. (2021b). Optimal green operation and information leakage decisions under government subsidy and supply uncertainty. Sustainability 13, 13514. doi:10.3390/su132413514
Xu, H., Chen, L., Li, Q., and Yang, J. (2021). A multi-attribute decision method under uncertainty environment conditions—the green supplier evaluation perspective. Int. J. Environ. Res. Public Health 18, 344. doi:10.3390/ijerph18010344
Yang, W., Pan, Y., Ma, J., Yang, T., and Ke, X. (2020). Effects of allowance allocation rules on green technology investment and product pricing under the cap-and-trade mechanism. Energy Policy 139, 111333. doi:10.1016/j.enpol.2020.111333
Zhang, B., and Xu, L. (2013). Multi-item production planning with carbon cap and trade mechanism. Int. J. Prod. Econ. 144, 118–127. doi:10.1016/j.ijpe.2013.01.024
Zhang, D. (2021). Green credit regulation, induced R&D and green productivity: revisiting the Porter Hypothesis. Int. Rev. Financ. Anal. 75, 101723. doi:10.1016/j.irfa.2021.101723
Zhang, D., and Kong, Q. (2022). Credit policy, uncertainty, and firm R&D investment: a quasi-natural experiment based on the Green Credit Guidelines. Pac-Basin. Financ. J. 73, 101751. doi:10.1016/j.pacfin.2022.101751
Zhang, J., Deng, L., Liu, H., and Cheng, T. C. E. (2022). Which strategy is better for managing multi-product demand uncertainty: inventory substitution or probabilistic selling? Eur. J. Oper. Res. 302, 79–95. doi:10.1016/j.ejor.2021.11.055
Keywords: green credit, carbon emission, robust optimization, min-max regret, uncertain demand
Citation: Yu Z and Feng X (2025) Optimal joint production and green investment decisions of green credit financing under uncertain demands. Front. Environ. Sci. 12:1488448. doi: 10.3389/fenvs.2024.1488448
Received: 30 August 2024; Accepted: 18 December 2024;
Published: 22 January 2025.
Edited by:
Jiachao Peng, Wuhan Institute of Technology, ChinaReviewed by:
Otilia Manta, Romanian Academy, RomaniaWeifeng Gong, Qufu Normal University, China
Wei Li, Shanghai Academy of Social Sciences, China
Copyright © 2025 Yu and Feng. This is an open-access article distributed under the terms of the Creative Commons Attribution License (CC BY). The use, distribution or reproduction in other forums is permitted, provided the original author(s) and the copyright owner(s) are credited and that the original publication in this journal is cited, in accordance with accepted academic practice. No use, distribution or reproduction is permitted which does not comply with these terms.
*Correspondence: Xin Feng, ZmVuZ3hpbjkwQG5qZnUuZWR1LmNu