- 1School of Architecture and Art Design, Hebei University of Technology, Tianjin, China
- 2School of Architecture and Art Design, Hebei University of Technology, Key Laboratory of Healthy Human Settlements in Hebei Province, Tianjin, China
- 3School of Economics, Capital University of Economics and Business, Beijing, China
- 4Jiangxi University of Finance and Economics, School of Design and Art, Nanchang, China
The development of mining cities has led to changes in land use and the evolution of landscape patterns. Constructing an ecological security evaluation system can reflect the ecological security status of mining city areas and provide planning references for these cities. This study, based on Heihe City’s land use data from 1980 to 2020, systematically analyzes the spatial and temporal evolution characteristics of land use, landscape patterns, and landscape ecological security levels by constructing a land use transfer matrix and calculating landscape pattern indices and landscape ecological security indices. The results show that: 1) Forest land is the main type of land use in Heihe City, accounting for over 50% of the total area. Land use changes primarily occurred between 2000–2010 and 2010–2020, with the spatial pattern characterized by overall stability and localized dramatic shifts, mainly involving the conversion of forest land to farmland and unused land. 2) From 1980 to 2020, the landscape ecological security pattern in Heihe City improved. Landscape diversity and landscape contagion increased, while landscape fragmentation, the largest patch area, and the average patch area decreased. Land use was optimized overall, but the trend of forest fragmentation became noticeable. 3) Between 1980 and 2020, the landscape ecological security level in Heihe City improved significantly. Driven by ecological restoration policies, the ecological security level in the southern region greatly improved, while the spatial pattern continued to show a trend of lower security in the south and higher security in the north. Specifically, the area proportions of low-security and relatively low-security areas increased by 6.23% and 9.55%, respectively. The spatial clustering of landscape ecological security levels is evident, with high-high value clustering mainly in the north and low-low value clustering mainly in the south. It is necessary to further promote ecological protection in the north to ensure the ecological barrier function, while strengthening ecological restoration in the south to improve ecological security levels. Additionally, continuous macro-policy regulation is needed to maintain long-term ecological security in Heihe City. The ecological security level of mining city landscapes is influenced by economic dependence, policy constraints, and environmental issues. This study can provide guidance for planning improvements in the study area and other mining cities.
1 Introduction
1.1 Background
With the rise of mining cities, China introduced relevant policies to align with global standards. Since 1978, the global coal industry has gone through four stages: the first stage, from 1978 to 1992, was a period of deepening reform in the coal industry, during which developed countries began comprehensive adjustments and restructuring, promoting the construction of township coal mines and achieving rapid increases in coal production. During this time, a large number of mining cities emerged, while developing countries were still in the preparatory phase of resource development (Li et al., 2002). The second stage, from 1993 to 2001, was marked by coal industry reform aimed at poverty alleviation. In developing countries like China, the number of small coal mines decreased from over 80,000 in 1998 to around 22,000 b y 2001. During this period, industrial and mining land use in China significantly decreased, leading to notable changes in land use patterns, while developed countries were experiencing the growth phase of mining city development (Fan et al., 2005). The third stage, from 2002 to 2011, focused on the sustainable and healthy development of the coal industry, with efforts to build a new coal industry system and transform the economic development model (Zhou and Tang, 2004). During this time, awareness grew about the limitations resource depletion posed to urban development, leading to explorations of sustainable development strategies for mining cities. As global coal production reached its designed capacity, the comprehensive regional development of mining cities improved, and their scale expanded. The fourth stage, from 2012 to the present, has been characterized by a focus on high-quality development in the coal industry, with policymakers worldwide emphasizing the ecological security of mining cities. Over these 4 decades, the planning and development of mining cities have become a key focus of research in global land-use and spatial planning (Liu Y. et al., 2023).
1.2 Related work
Mining cities refer to cities or regions where the mining industry is the dominant economic driver (Liu X. et al., 2023). Mining activities have significant impacts on the environment, leading to ecological issues such as large-scale land subsidence and a decline in biodiversity due to long-term exploitation (Shi and Xiang, 2023). These environmental problems result in land-use changes that pose challenges to the sustainable development of these cities (Mardonova and Han, 2023). However, there are several gaps in the current research on mining cities: First, in terms of research content, scholars primarily focus on ecological restoration strategies in mining cities, particularly on water ecosystem management and vegetation restoration techniques, but there is a lack of systematic analysis of the evolution of landscape ecological security patterns in the context of land-use and spatial planning (Feng et al., 2023; Li Q. et al., 2023; Xu et al., 2023; Zhao et al., 2023). Second, from the research perspective, insufficient attention has been given to mining cities as resource-depleted urban areas, especially those with rich mining resources and significant ecological importance, such as Heihe City (Wei et al., 2023)., which remains under-researched. Exploring the long-term evolution of landscape ecological security patterns in mining cities can deepen our understanding of the ecological security dynamics of these cities and advance knowledge of the comprehensive management of ecological degradation. It also provides a scientific basis for assessing the effectiveness of ecological restoration efforts. Therefore, conducting long-term research on the landscape ecological security patterns of mining cities is essential for guiding ecological protection and restoration efforts.
Land-use change refers to alterations in the types, functions, or characteristics of land use within a specific region or area. Such changes directly influence the structure and patterns of landscapes (Zhang J. et al., 2023). The landscape pattern index method is commonly used to assess and describe the characteristics of landscape patterns in a given area or region. Previous research has often employed this method for quantitative studies on the landscape pattern changes of urban land-use types (Ye et al., 2022). However, in studies focusing on mining cities, which are resource-depleted urban areas, most research leans towards qualitative planning, and there is relatively little quantitative research using landscape indices (Dong et al., 2023; Gao et al., 2024). Li Baojie and others conducted a landscape pattern analysis of mining areas using the optimal analysis grain size, revealing that changes in regional land-use landscape patterns are the result of the combined effects of natural and human factors. Their analysis of the spatiotemporal evolution of landscape patterns in the Jiawang mining area based on the optimal grain size provides a new method for the quantitative assessment of land-use rationality and scientific validity (Li et al., 2016) Although some scholars have studied landscape patterns in mining cities, most of these studies focus on short-term dynamic landscape patterns over a few specific years, without addressing the dynamic changes over a period of nearly 40 years (Dong et al., 2023; Luo et al., 2023; Wu et al., 2014; Wu et al., 2021). This paper selects a time frame that covers key periods of land policy reform and mining culture development in China, making the study of landscape pattern evolution in mining cities within this context more representative.
Ecological security assessment is the foundation and premise of ecological security research. It is the process of evaluating the health status of a specific region or ecosystem and its potential to withstand external impacts (Lv et al., 2024). This process reflects the degree to which human beings are protected from ecological damage and environmental pollution, playing a crucial role in maintaining the ecological balance of the Earth and supporting the development of mining cities. The ecological security of mining cities refers to the ability of their natural, artificial, and complex ecosystems to maintain their normal structure and function while also recovering from external pressures and stresses. As cities driven by mining activities, the ecosystems of mining cities are more fragile and complex than those of traditional cities. Currently, research on the ecological security of mining cities focuses more on establishing evaluation mechanism models and selecting evaluation indicators, with little attention paid to the relationship between ecological security and land-use change. This gap makes it difficult to guide the management and regulation of ecological security effectively (Li Z. et al., 2023; Yang and Ye, 2023; Yao et al., 2023; Zhao et al., 2024). By conducting ecological security assessments of mining cities, the impact of different land-use practices on the ecosystem can be evaluated, thus informing land-use planning and management to achieve sustainable utilization of land resources and protection of the ecological environment in mining cities (Chen and Ma, 2023; Li X. et al., 2023). This study combines the analysis of landscape pattern evolution with ecological security assessments in mining cities based on land-use change. The methodology primarily uses quantitative analysis, supplemented by qualitative analysis, to make the results of the ecological security assessment more convincing.
1.3 Objectives and contributions
Based on the above, this study selected Heihe City in Heilongjiang Province, China, as the research subject through data pre-selection, as it provided the most representative data results (Yang et al., 2022). Heihe City has a relatively low level of mining development and is still in its early stages, but it is rich in various mineral resources. As a typical mining city in northern China and a forestry city, Heihe boasts abundant forest resources and serves as a natural ecological barrier for the “granary of Northeast China,” giving it significant ecological importance. During its development, Heihe faces common challenges of resource-dependent cities, such as the over-exploitation of natural resources and ecological degradation. This study used land-use data from five periods—1980, 1990, 2000, 2010, and 2020—to conduct a detailed assessment of the landscape pattern evolution and ecological security of Heihe from 1980 to 2020. Methods employed include land-use transition matrices, landscape pattern indices, landscape ecological security assessments, and spatial autocorrelation analysis. The research aims to answer two specific questions.
(1) How did the landscape patterns of Heihe change across different spatial and temporal dimensions during the 4 decades of policy turbulence from 1980 to 2020?
(2) How did these changes in landscape patterns affect the ecological security of the mining city across different spatial and temporal dimensions from 1980 to 2020?
Addressing these questions will provide policy insights for improving the ecological security of similar mining cities in China and offer a reference for studying the ecological security of mining cities in other countries and regions.
2 Materials and methods
2.1 Study area overview
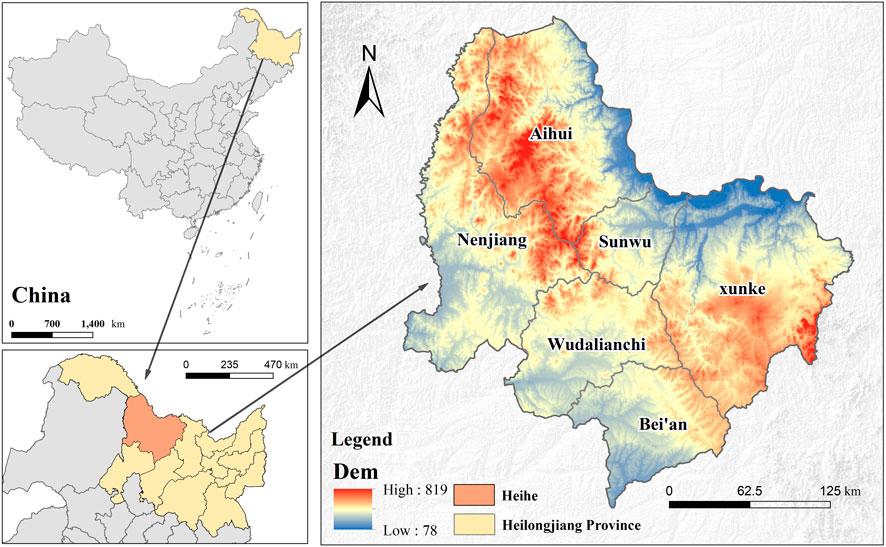
Heihe City is located in the northern part of Heilongjiang Province (47°42′–51°03′N, 124°45′–129°18′E), at the eastern end of the Greater Khingan Range and the northern part of the Lesser Khingan Range, with a total area of 6,872,600 hm2 (Figure 1). The terrain within the city features rolling mountains and valleys, with higher elevations in the northwest gradually sloping down towards the southeast, forming a landscape that runs from the northwest to the southeast. Heihe has a cold temperate continental monsoon climate, characterized by high temperatures and strong winds in spring, simultaneous heat and rain in summer, sharp temperature drops in autumn, and cold, dry winters. The seasons are distinct, with long winters and short summers. According to the results of Heihe City’s third national land survey, the current land-use types in Heihe include 2.1879 million hm2 of arable land, 10,300 hm2 of orchards, 3.2125 million hm2 of forest land, 160,800 hm2 of grassland, 858,400 hm2 of wetlands, 75,300 hm2 of urban, village, and industrial land, 51,900 hm2 of transportation land, and 116,300 hm2 of water areas and water conservancy facilities.
Heihe City is located in the key metallogenic belt of the Greater and Lesser Khingan Ranges, with extremely rich mineral resources and vast development potential. A total of 95 types of minerals have been discovered within the city’s jurisdiction, accounting for 68.35% of the 139 types found in the entire province. There are verified reserves of 38 types, which make up 40.86% of the 93 types identified in the province. These include one type of energy mineral, 20 types of metal minerals, and 17 types of non-metal minerals. Heihe holds the province’s largest reserves for 26 types of minerals, including copper, gold, lead, zinc, tungsten, perlite, pumice, and shale used for cement production, while coal ranks sixth. Additionally, the city has over 140 million tons of marble reserves. The primary minerals being developed and utilized are coal, iron, copper, lead, zinc, molybdenum, gold, silver, and mineral water. However, Heihe City is currently facing several challenges. Some mines are approaching closure due to resource depletion, large-scale mine development is insufficient, and the costs of land and forest requisition are high, all of which have slowed the pace of mining development. As Heihe’s mineral resources gradually become exhausted, problems such as environmental degradation and difficulties in sustaining economic development have become increasingly prominent (Wei et al., 2023).
2.2 Research methodology
2.2.1 Data source and preprocessing
The land use data in this article is derived from the national land use type remote sensing monitoring spatial distribution data provided by the Resource and Environment Science and Data Center of the Chinese Academy of Sciences (http://www.resdc.cn) (accessed on 3 February 2024), with a spatial resolution of 30 m × 30 m. The unified spatial reference coordinate system is the Krasovsky_1940_Albers coordinate system, including land use data for five periods: 1980, 1990, 2000, 2010, and 2020. The comprehensive accuracy of land use type evaluation in this dataset exceeds 90%.
Based on the “Current land use classification” (GB/T 21,010–2017) and considering the landscape characteristics of Heihe City, the landscape types in Heihe City are classified into seven categories: arable land, forest land, grassland, water bodies, urban and rural residential land, industrial and mining land, and unused land. Urban and rural residential land includes commercial and service land, industrial and mining storage land, residential land, public management and public service land, special land, and transportation and transportation land. Considering the spatial resolution of the image data and the precision of information extraction, other construction land in urban and rural areas, industrial and mining land, and residential land, including factory areas, large industrial areas, quarries, etc., are uniformly classified as industrial and mining land.
2.2.2 Landscape pattern indices
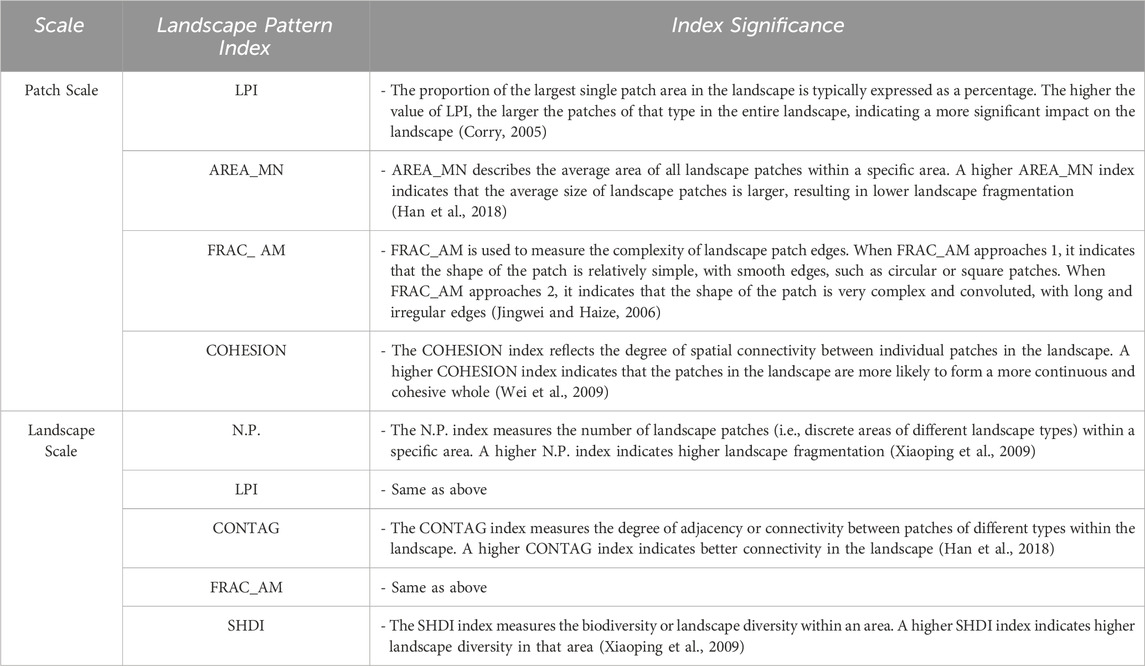
Landscape pattern indices can highly condense landscape spatial pattern information, reflecting its structural composition and spatial configuration characteristics (Han et al., 2018; Jingwei and Haize, 2006; Lu et al., 2012). Based on principles of landscape ecology, nine landscape indices were selected for calculation: at the patch scale level, the indices include LPI, AREA_MN, FRAC_AM, and COHESION; at the landscape scale, the indices include N.P., CONTAG, LPI, FRAC_AM, and SHDI (Table 1).
2.2.3 Landscape ecological security index
(1) Selection of Landscape Ecological Security Index
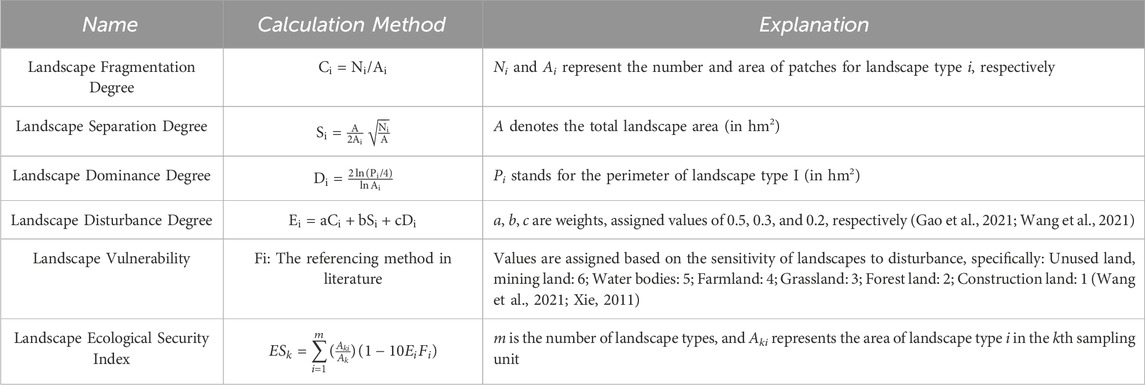
The Landscape Ecological Security Index construction method based on landscape disturbance and vulnerability has been widely applied in many studies (Feng et al., 2016; Nitschke and Innes, 2008; Sheng et al., 2018; Sun and Chen, 2017; Zhang et al., 2019). Landscape disturbance represents the degree of disturbance to different landscape ecosystems (Zhang et al., 2019), calculated by weighting landscape fragmentation, isolation, and dominance (Zhang et al., 2019). Landscape fragmentation describes the continuity and integrity of natural or anthropogenic landscapes, typically referring to the degree of fragmentation or isolation between different landscape elements (such as forests, grasslands, water bodies, etc.) within an area (Qing et al., 2007). Landscape isolation refers to the spatial distance and degree of isolation between different landscape types within a region (Jin and Hu, 2003). Landscape dominance is usually determined by comparing the coverage area of different landscape types (Cheng et al., 2005; Daqing et al., 2005; Jiang et al., 2002; Lohbeck et al., 2016). Existing research considers landscape fragmentation as the most important factor in landscape disturbance, followed by isolation and dominance, thus assigning values of 0.5, 0.3, and 0.2 (Gao et al., 2021; Wang et al., 2021), rrespectively. Landscape vulnerability represents the degree of change in landscape use types after disturbance (Wang et al., 2021). Based on existing research (Wang et al., 2021) and the actual situation of the study area, values were assigned as follows: urban and rural residential land is the most stable, assigned a value of 1; forests and grasslands are mostly located far from residential areas and relatively stable, assigned values of two and 3, respectively; farmland is susceptible to human disturbance, assigned a value of 4; water bodies, located close to residential and farmland areas, are greatly disturbed by human activities, assigned a value of 5; unused land and industrial and mining areas represent the most fragile ecosystems, assigned a value of 6. Using ArcGIS 10.3, the study area was divided into 1 km × 1 km grids, and each grid’s Landscape Ecological Security Index was calculated. Finally, the Landscape Ecological Security Index for the study area was obtained through Kriging interpolation (Table 2).
(2) Determination of Landscape Ecological Security Standards.
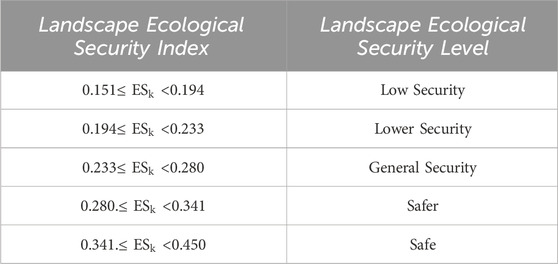
To reflect the spatiotemporal differences in the landscape ecological security index of the study area, reference to existing research results and combined with the actual distribution of the landscape ecological security index in the study area (Gao et al., 2021; Wang et al., 2021), the natural breakpoint method is adopted to divide the landscape ecological security level of the study area into five grades. The classification intervals for other years are standardized based on the classification intervals for the reference year (Table 3). To make the landscape ecological security pattern map more intuitive, each level of landscape ecological security is further divided into three equal parts while maintaining the same level intervals.
2.2.4 Spatial autocorrelation analysis
Global spatial autocorrelation can reveal whether geographic phenomena exhibit spatial clustering and is often characterized using Moran’s I (HuaLin, 2008). Local spatial autocorrelation reflects the degree of correlation between a geographic phenomenon or attribute in a local area unit within a larger region and the same phenomenon or attribute in adjacent local area units, and is often represented using LISAi indices (HuaLin, 2008). The calculation formulas are as follows (Equations 1, 2).
(1) Global Spatial Autocorrelation:
In the equation, n represents the total number of sample points for variable x; xi and xj denote the observed values of a certain attribute in areas i and j, respectively;
(2) Local Spatial Autocorrelation:
The LISAi does not have a fixed range of values. A LISAi value greater than 0 indicates spatial clustering of similar values around the area unit, manifested as high-high or low-low clustering. A LISAi value less than 0 indicates spatial clustering of dissimilar values, manifested as high-low or low-high clustering.
3 Results
3.1 Land use change analysis
3.1.1 Analysis of land use structural changes
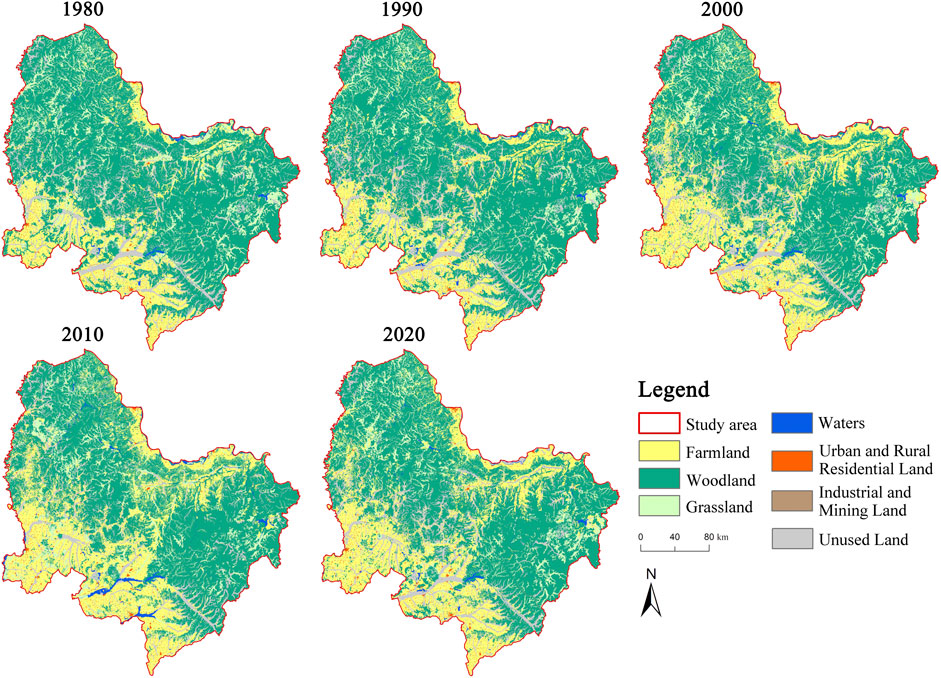
Between 1980 and 2020, forest land, cultivated land, grassland, and unused land were the primary land-use types in Heihe City. Among them, forest land accounted for the largest area, though it steadily decreased over time, while the area of cultivated land and industrial mining land continuously expanded. The total area of industrial/mining land increased 32-fold, from 180.27 hm2 in 1980 to 5,775.10 hm2 in 2020. Spatially, forest land was widely distributed across various parts of Heihe City, with southern forest areas gradually being converted into farmland. Industrial and mining land was mainly concentrated in the southern and southwestern regions. Water bodies were primarily located in the southern part of the study area, while cultivated land was mainly distributed in the southwest and northeast. Unused land was more scattered, primarily dispersed in the southwestern part of the study area (Table 4; Figure 2).
3.1.2 Analysis of land use transfer changes
Between 1980 and 2020, the mutual conversion among cultivated land, forest land, grassland, and unused land was the main direction of land use type transitions in the study area. During these 40 years, 3,924.13 hm2 of forest land were converted to cultivated land, primarily in the southern and northeastern parts of the study area. Additionally, 2,064.5 hm2 of grassland were converted to cultivated land, distributed throughout various parts of Heihe City. This indicates that, alongside mining development, Heihe City has increasingly emphasized the sustainability of agriculture and the ecological environment. Faced with the driving force of urban construction and development, 154.09 hm2 of cultivated land were converted to urban and rural residential construction land, along with 84.45 hm2 of forest land and 55.04 hm2 of grassland, with the main conversion areas located in the southwestern part of Heihe City. It was observed that the degree of land use transfer for industrial and mining land was relatively low, with only a small portion converted to cultivated land. The main reason for this is Heihe City’s strong reliance on mineral resources, and the long-term environmental impacts caused by mining activities, which make it difficult for industrial and mining land to be repurposed for other uses in the short term after mining operations have ceased (Supplementary Table S1; Figure 3).
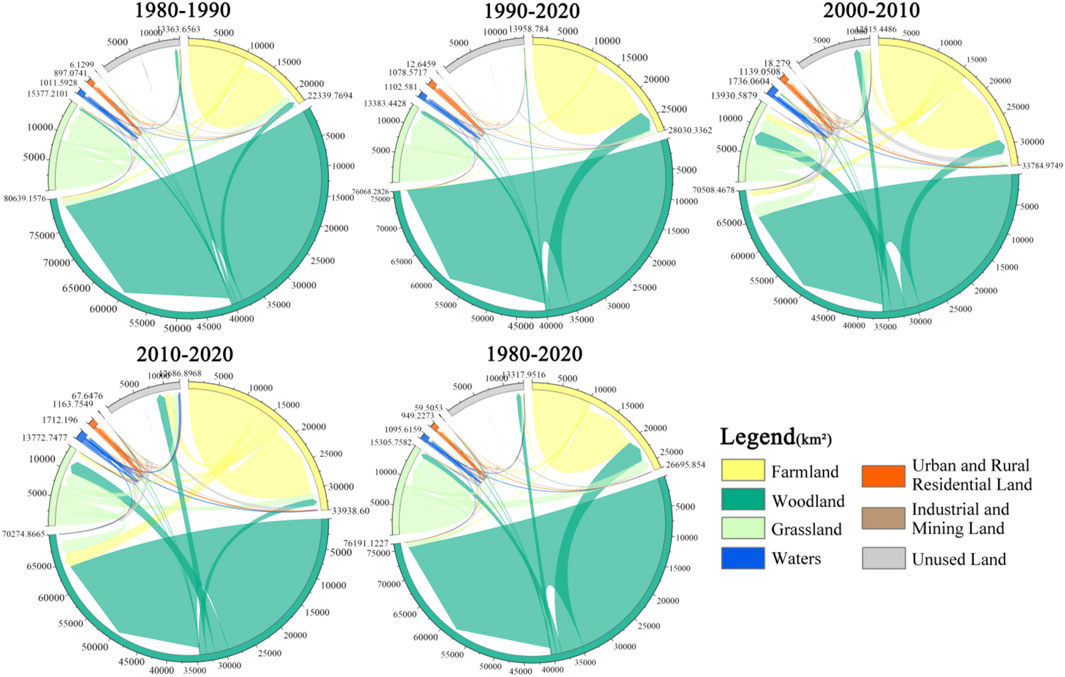
Figure 3. The land use transfer patterns vary across different land categories in the study area over different years.
From the perspective of different land use periods, the main land use transitions occurred between 2000–2010 and 2010–2020. During 2000–2010, driven by the national policies of returning farmland to forest and grassland, along with the development of Heihe City’s forestry industry, the primary land transitions involved forest land. A total of 2,560.98 hm2 of forest land was converted to cultivated land, 2,534.68 hm2 to grassland, and 1,192.94 hm2 to unused land. During the same period, 1,156.12 hm2 of cultivated land were converted to forest land, while grassland and unused land contributed 2,444.57 hm2 and 1,465.97 hm2, respectively, to forest land (Supplementary Table S4; Figure 3). In the period between 2010 and 2020, the most significant land transitions involved water bodies, with 1,124.71 hm2 of water area being converted to other land types, while only 573.73 hm2 of other land were converted to water bodies. During this period, the water area was reduced by half, primarily transitioning into cultivated land and unused land. This reduction suggests potential over-extraction and processing of water resources, leading to their depletion and conversion into cultivated land. Additionally, the failure of ecological restoration attempts in areas affected by mining development may have resulted in the transformation of water bodies into unused land (Supplementary Table S5; Figure 3).
Overall, from 1980 to 2020, the changes in cultivated and forest land were the most significant, with a scattered spatial distribution. The general trend shows forest land undergoing the most notable transformations. The land use pattern exhibited significant changes in the northeastern and southwestern regions, while the northwestern and southeastern areas remained relatively stable (Supplementary Table S1; Figure 3).
3.2 Landscape pattern change analysis
3.2.1 Patch scale change analysis
Regarding patch contagion (COHESION), the patch indices for various land-use types were all close to 100, indicating a high degree of connectivity among the landscape patches, forming a relatively continuous and cohesive whole. However, the patch cohesion for urban and rural construction land and industrial and mining land was relatively low, though it gradually increased from 1980 to 2020. The primary reason for this increase is that Heihe City has vigorously developed its mining industry from 1980 to 2020, attracting a large number of mining-related industries and services, which led to the concentration of economic activities and, consequently, the focused distribution of industrial and mining land and urban-rural construction land. Additionally, the Heihe City government’s “General Land Use Plan for Heihe City (2006–2020)”(https://www.heihe.gov.cn/hhs/c102620/202012/c11_225272.shtml) (accessed on 8 October 2024) mandated adjustments in the scale of construction land, further enhancing the cohesion of urban-rural construction land and industrial and mining land (Figure 4).
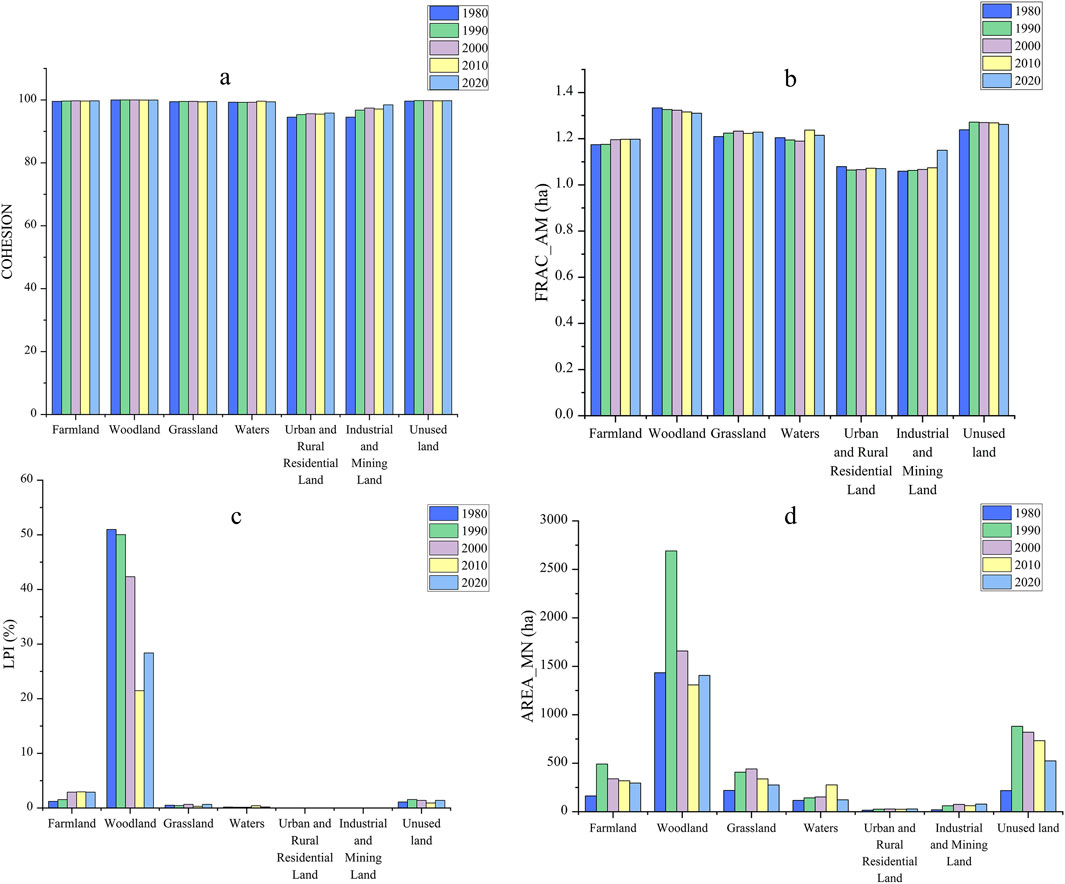
Figure 4. Changes in patch scale landscape pattern indices from 1980 to 2020. (A) Changes in cohesion landscape pattern index from 1980 to 2020. (B) Changes in FRAC_AM landscape pattern index from 1980 to 2020. (C) Changes in the LPI landscape pattern index from 1980 to 2020 (D) changes in AREA_MN landscape pattern index from 1980 to 2020.
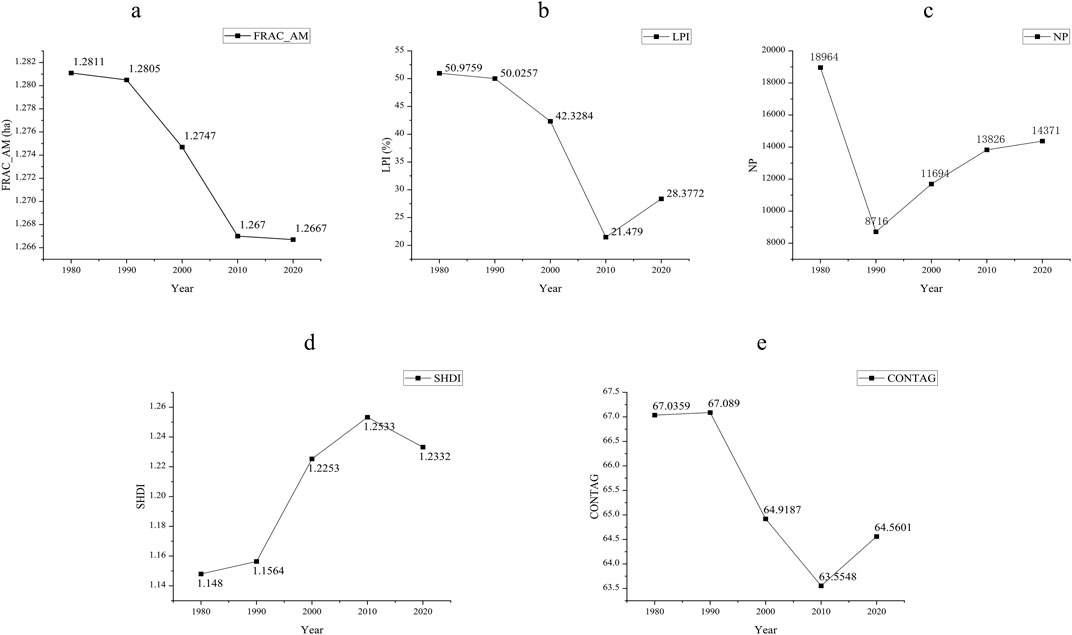
Figure 5. Changes in Landscape Pattern Index at the landscape Scale from 1980 to 2020. (A) 1980–2020 FRAC_AM Landscape Pattern Index Changes. (B) 1980–2020 LPI Landscape Pattern Index Changes. (C) 1980–2020 N.P. Landscape Pattern Index Changes. (D) 1980–2020 SHDI Landscape Pattern Index Changes. (E) 1980–2020 CONTAG Landscape Pattern Index Changes.
In terms of area-weighted average patch fractal dimension (FRAC_AM), forest land and unused land exhibited relatively high values, close to 1.3. In contrast, the area-weighted average patch fractal dimensions for other land-use types were more balanced, hovering around 1.2 and 1.1. This indicates that the shapes of patches for forest land and unused land are relatively complex with jagged edges, while the patches for other land types have simpler shapes with smoother edges. By 2020, the area-weighted average patch fractal dimension for industrial and mining land had increased, mainly influenced by Heihe City’s ecological restoration policies. Human interference has caused changes in the shapes of these industrial and mining areas. The “General Planning for Mineral Resources in Heilongjiang Province (2016–2020)” (https://www.hlj.gov.cn/hlj/c108411/202110/c00_31181663.shtml) (accessed on 8 October 2024) proposed land reclamation in mining areas, which effectively addresses ecological issues in these regions, resulting in more complex shapes for industrial/mining land. Furthermore, the rugged terrain of Heihe City, characterized by rolling mountains and intersecting valleys, has contributed to the increasing complexity of the boundaries of industrial and mining land as mineral extraction deepens, which is another reason for the rise in the fractal dimension of these patches (Figure 4).
In terms of the largest patch index (LPI), forest land has consistently been the dominant landscape type in Heihe City. However, from 1990 to 2020, the LPI area of forest land gradually decreased, while the LPI area of cultivated land gradually increased. This shift can be attributed to Heihe City being primarily a forestry-based economy during this period, where economic development was closely tied to forest resources. As urban development progressed, activities such as deforestation and mining caused the originally continuous forest land to be fragmented into smaller patches of residential land, industrial and mining land, and unused land, resulting in spatial fragmentation (Figure 4).
Regarding average patch area (AREA_MN), forest land had the largest AREA_MN, indicating the lowest degree of landscape fragmentation. This is because forest land accounted for 60% of the original land-use types in Heihe City, and resource extraction in mining areas was concentrated in regions planned by the Heihe City government. As a result, forest areas that were either undeveloped or minimally impacted by development were often retained on the periphery of mining zones or in difficult-to-develop areas, leading to relatively concentrated patches of forest land. The AREA_MN of forest land peaked in 1990 and subsequently began to decline, mirroring the trend of increasing fragmentation in unused land and cultivated land during the same period. This indicates that after 1990, the process of urban integration contributed to the increased fragmentation of forest land, cultivated land, and unused land.
3.2.2 Analysis of landscape-level changes
In terms of the area-weighted average patch fractal dimension (FRAC_AM), the study area showed a gradual decline from 1980 to 2020, decreasing by 0.02 over this period, indicating that the landscape in the study area has become simpler and the edges have become smoother. Regarding the largest patch index (LPI), the area of dominant landscapes in the study area gradually decreased from 1990 to 2010, but began to increase again from 2010 to 2020. This suggests a decline in the status of forest land as a dominant landscape, although it has somewhat recovered due to support from the return-to-forest policy. Concerning the number of patches (NP), there was a decline in the number of patches from 1980 to 1990, reaching a minimum value, indicating an increase in landscape connectivity in Heihe City in 1990, which enhanced the overall resilience of the landscape to disturbances. After 1990, the number of patches began to rise gradually, suggesting an increasing degree of landscape fragmentation in Heihe City. In terms of landscape diversity (SHDI), there has been an upward trend in landscape diversity in the study area since 1990. This increase is primarily associated with the rise in grassland area during the ecological restoration process, as well as the expansion of urbanization leading to an increase in the area of built-up and unused land. Regarding landscape contagion (CONTAG), the contagion index in the study area began to decline from 1990, dropping by 4% by 2010. This indicates that during this period, the degree of adjacency or connectivity between different patch types in the landscape of Heihe City weakened, while the extent of human activities affecting the natural landscape increased, coinciding with a gradual rise in urbanization levels.
3.3 Landscape ecological security pattern evolution
3.3.1 Overall analysis of landscape ecological security pattern
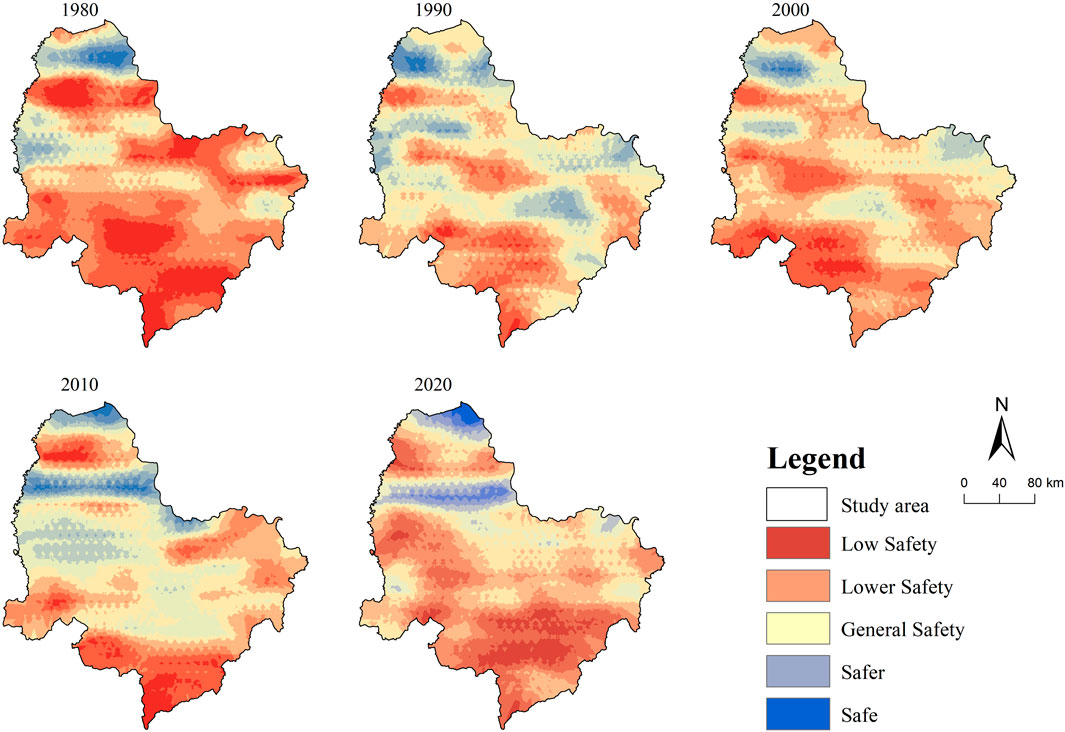
From a general perspective, between 1980 and 2020, the spatial distribution of landscape ecological security levels in the study area showed a trend of being lower in the south and higher in the north. Over time, the overall landscape ecological security pattern has shown improvement. Specifically, in 1980, the proportions of low-security and relatively low-security areas in the study area were 28.37% and 36.03% respectively, mainly concentrated in the southern part with a fragmented landscape of agricultural land, forests, urban and rural construction land, and unused land. Areas classified as relatively safe and safe were primarily located in the north and east, covering 12.08% of the area, predominantly composed of forests with more intact land use. Overall, the ecological security level of Heihe City was relatively low in 1980. By 2020, the proportions of low-security and relatively low-security areas had decreased to 22.14% and 26.48% respectively, showing increases of 6.23% and 9.55%. This improvement was particularly notable in areas such as Aihui District, Wudalianchi City, and Bei’an City, likely due to integrated planning of agricultural land and controlled zoning for mineral development (Figure 6).
From 1980 to 1990, the ecological security levels in the study area continued to exhibit a pattern of lower levels in the south and higher levels in the north, but the ecological security in the low-security and relatively low-security areas in the southern and central regions improved. The proportion of low-security and relatively low-security areas decreased from 64.40% in 1980 to 41.11% in 1990, indicating an improvement in the ecological environment of Heihe City during this period, with an overall increase in landscape ecological security. From 1990 to 2000, the ecological security levels in the study area gradually shifted from the pattern of lower in the south and higher in the north to one of lower in the central region and higher in the surrounding areas. The environmental quality of Sunwu County improved, while that of Wudalianchi City and Nenjiang County deteriorated. From 2000 to 2010, the ecological security levels in the study area saw an overall improvement, forming a landscape ecological pattern of lower in the central region and higher in the surrounding areas, with particularly improved environmental quality in Wudalianchi City, where most areas were classified as relatively safe or safe. However, from 2010 to 2020, with the accelerated urbanization process, the ecological quality of Heihe City declined, and the overall ecological security level decreased. This decline was especially prominent in the central and southern regions, where areas classified as safe transitioned to relatively low-security areas, primarily due to an increase in unused land and a reduction in landscape restoration capacity (Figure 6).
3.3.2 Spatial autocorrelation analysis of landscape ecological security index
From 1980 to 2020, the global spatial autocorrelation indices for the five periods were 0.892, 0.992, 1.029, 1.038, and 1.103, all of which passed the significance test at p = 0.01. This indicates that the ecological security index exhibits spatial clustering. Spatially, two extremes in Heihe City’s ecological security index were observed, with relatively few areas showing high-low or low-high clustering. Most areas exhibited no significant correlation, with local spatial autocorrelation primarily characterized by high-high value clustering and low-low value clustering.
In 1980, the clusters of ecological security indices were relatively scattered, with low-low value clusters appearing around the periphery. By 1990 and 2000, the spatial distribution of ecological security in Heihe City became more stable. Locally, high-high value clusters were mainly concentrated in the northern and eastern regions, indicating a relatively good level of ecological security in these areas. Meanwhile, the low-low value clusters around the edges gradually expanded southward, reflecting a decline in ecological security in the southern region, with a growing risk of ecological degradation. The spatial autocorrelation results for the ecological security index suggest that the northern and eastern regions, where forests are distributed, acted as ecological barriers, effectively maintaining the environment. In contrast, the central and southern regions, due to the development of industrial, mining, and urban construction land, experienced more frequent human disturbances, making the ecosystems more fragile. During the 2010 and 2020 periods, the area of high-high value clusters in the northern region became more stable, while the low-low value clusters in the central region shifted entirely to the south. This was due to the central region’s unused land patches gradually forming larger, more regular patches under proper urban planning, reducing ecological damage in the surrounding areas. However, urban and rural construction in the southern region began to impact the environment, highlighting the need for future attention to ecosystem restoration and protection in this area (Figure 7).
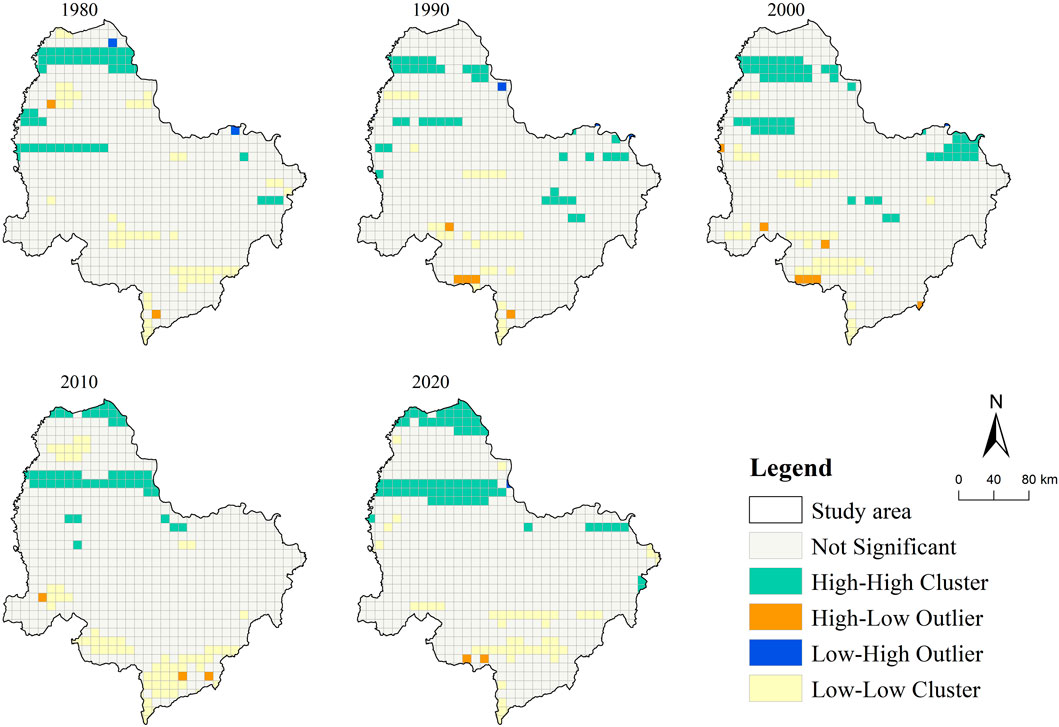
Figure 7. Local spatial autocorrelation map of ecological security index in the study area from 1980 to 2020 (p = 0.01)
4 Discussion
4.1 Nsights on landscape pattern index
4.1.1 Screening and analysis of landscape pattern index
Evaluating the spatial pattern changes of mining cities using landscape pattern indices is meaningful and necessary because it can provide a reference for policymakers in planning mining cities (Wei et al., 2009). In selecting landscape pattern indices, covering every aspect in practical applications is optional. Landscape pattern indices serve repetitive purposes, and only a few indices are needed to fully meet the requirements of pattern analysis, reflecting the characteristics of landscape patterns in the study area. Therefore, this study screened landscape factors, and nine indices representing landscape fragmentation, aggregation, and diversity were selected for calculation.
Compared to the study by Ya et al., which only analyzed the spatial changes of the landscape from a temporal perspective (Ya-Hui et al., 2021), this study further divided landscape indices into patch-level and landscape-level analyses. It described the changes in landscape patterns of different land types in the study area over different time dimensions and the overall landscape pattern changes in the study area over different time dimensions, providing a comprehensive analysis from macro and micro perspectives, making the results more scientifically sound. From the results of landscape pattern analysis, it can be observed that human disturbances significantly impact the spatial pattern of a mining city.
4.1.2 Analysis of landscape pattern index results
Based on the analysis of landscape pattern indices, the landscape pattern of Heihe City has been primarily influenced by economic dependence, policy restrictions, and environmental issues.
From the patch scale perspective, significant changes were observed in the average patch area (AREA_MN) and the largest patch index (LPI) for forest land between 1980 and 2020. However, other landscape patterns showed little variation. This is mainly because the forestry industry holds an important position in the economic structure of Heihe City. The forestry industry is one of Heihe’s traditional sectors, with abundant forest resources, particularly high-quality timber such as red pine and white birch. The city has actively developed industries related to timber processing, non-timber forest product development, and forest tourism. With the growing awareness of sustainable development and ecological protection, Heihe City has gradually promoted the sustainable use of forest resources and the conservation of its forest resources in recent years. Over the past 40 years, mining activities and land use policies in Heihe City have been subject to strict government regulation and oversight. The local government has controlled the area of forest land, effectively increasing its extent by implementing afforestation projects on reclaimed farmland and unused land in various forest farms. Consequently, the changes in the landscape pattern of forest patches have been the most significant.
From the landscape scale perspective, the landscape diversity index of Heihe City showed an upward trend from 1980 to 2020, while other indices displayed a downward trend. This pattern is closely related to the mining policies, ecological restoration policies, and urbanization processes implemented in Heihe City. The city is rich in mineral resources, with a diverse range of types distributed across various patches, which facilitates economic diversification. Under this model of mining development, Heihe City has experienced significant changes in its economic structure, which has also influenced the updating and alteration of the landscape pattern. Additionally, due to the transformation of the industrial structure, the local government has adopted policies for the redevelopment and reuse of abandoned mining areas or extraction sites. This involves converting mined-out land into green spaces, parks, wetlands, or other forms of urban land. For instance, the Xigangzi coal mining area in Heihe City has combined mine environmental restoration with farmland occupation and compensation projects to transform industrial wasteland into fertile land. This has enriched the types of landscape patches within the city, thereby increasing landscape diversity. At the same time, Heihe City has initiated ecological restoration projects aimed at restoring ecosystems in mining areas through vegetation recovery, soil remediation, and water body management. These efforts have diversified the landscape structure of damaged areas and increased the complexity of the ecosystem. Furthermore, with the acceleration of the urbanization process, the government has expanded land types for various uses, such as commercial zones, residential areas, industrial districts, and transportation facilities. This urbanization process has clarified the boundaries between different land uses, increasing the number and variety of landscape patches and enhancing overall landscape diversity.
4.2 Ecological security evaluation insights
4.2.1 Optimization insights for ecological security evaluation
Due to the adoption of different standards, the results of landscape ecological security assessment of mining cities obtained from different research objects can only present conclusions partially consistent with those of previous studies (Chen and Ma, 2023). Scholars typically combined ecological security assessment with evaluation model studies in previous research. For instance, Yin et al. combined landscape ecological security assessment with the PSR model (Yin et al., 2012); While Zhang et al. integrated ecological security assessment with the Pressure-State-Response framework (Zhang R. et al., 2023). However, due to differences in evaluation objects and evaluation models, the scientific validity of the assessment results cannot be guaranteed. Additionally, evaluation criteria have become one of the controversial issues in landscape ecological security assessment results. For example, Wang et al. constructed an ecological security evaluation system through the evaluation of ecosystem service importance and ecological sensitivity, mainly using the Analytic Hierarchy Process (AHP) combined with expert questionnaires to obtain evaluation criteria, leading to highly subjective conclusions (Zhou et al., 2022). In this study, however, theoretical models were not relied upon, and all research was based on the land use changes in Heihe City from 1980 to 2020. In constructing ecological evaluation criteria, quantitative research methods were adopted, and the landscape ecological security assessment results obtained by calculating landscape pattern indices reduced the subjectivity and errors introduced by expert scoring methods.
Moreover, this study did not use a single ecological security evaluation system. Still, it supplemented the landscape ecological security assessment results through spatial autocorrelation analysis of landscape ecological security spaces, helping to deepen the understanding of the spatial characteristics and dynamic changes of ecosystems, thereby better assessing the health status of ecosystems and guiding ecological protection and management efforts. Spatial autocorrelation analysis of landscape ecological security spaces was used to examine the overall analysis of landscape ecological security indices, validating the feasibility of the ecological security assessment results.
4.2.2 Ecological regulation measures in ecological security areas
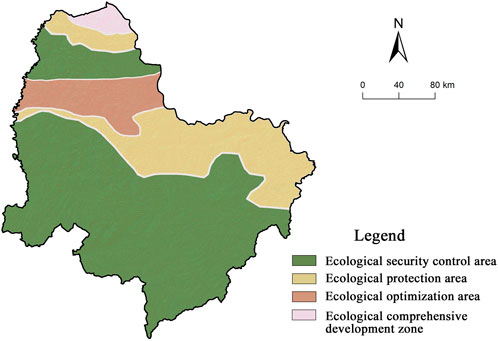
Considering the economic development characteristics and natural environment conditions of Heihe City, and based on the 2020 ecological security evaluation results, corresponding management measures are proposed according to the different ecological security levels and characteristics, in order to reduce ecological security risks to a controllable range. The division of ecological functional areas from the perspective of sustainable development in mining cities has not yet been proposed for Heihe City (Shi and Xiang, 2023). This study, based on Heihe City’s ecological security index and higher-level planning, uses methods such as overlaying current land use data, DEM data, and administrative boundaries, along with spatial interpolation analysis, to divide Heihe City into four functional areas: the ecological security control area for mining cities, ecological protection area, ecological optimization area, and ecological comprehensive development area (Figure 8) (Song et al., 2023).
In the low and relatively low ecological security areas of Heihe City, there is a phenomenon of low-low value clustering, which is highly sensitive to human interference (Song et al., 2023). These clusters appear in agricultural and forested lands, where the ecological security status is poor, and serious ecological degradation and related issues are present. This region has been designated as the ecological security control area for mining cities. The total area of this control area is 4,308,956 hm2, accounting for 64.52% of the total area. Key areas include the central and southern parts of Nenjiang County, Wudalianchi City, and Bei’an City, as well as the northern part of Nenjiang County and the central region of Aihui District. In this area, ecological regulation efforts should focus on reversing the trend of ecological retrogression, with particular attention to post-development land quality protection and soil restoration. Conservation and rehabilitation measures should be implemented to protect agricultural and forested lands. By constructing ecological corridors and restoring ecological nodes and barrier points, all development activities that could cause pollution should be prohibited, minimizing the impact of human activities on the existing ecological environment (Zhang et al., 2017; Zhang et al., 2018; Zhang et al., 2024; Li Q. et al., 2023).
The general ecological security area of Heihe City is in a state of ecological alert, where both low-high and high-low value clustering phenomena occur, indicating that the area is sensitive to human interference. Although the ecological environment has been partially damaged, it still retains some capacity for self-recovery (Feng et al., 2023). This region has been classified as the ecological security protection area for mining cities, mainly distributed in the northern parts of Xunke County, Sunwu County, and the northern part of Aihui District, covering an area of 15,948 hm2. The dominant landscape types in this area include degraded unused land (bare rock), large expanses of high-vegetation-cover paddy fields, and human-disturbed forested areas (shrubland) and farmland. Therefore, priority should be given to protecting the degraded unused land and forested areas in this area, preventing the expansion of land use driven by the pursuit of economic gains, and reducing unreasonable human development activities. For the degraded unused land in this area, measures such as land leveling, increasing green cover, and prohibiting further development should be taken to maintain ecological security levels (Wei et al., 2023). As for the human-disturbed forested areas, strict implementation of the “Grain for Green” project should be enforced to prevent the over-expansion of farmland for economic development purposes.
The relatively safe areas of Heihe City are regions with strong resilience to disturbances, exhibiting high-high or high-low value clustering. These areas have an intact ecological structure and a high level of ecological security. This region has been designated as the ecological optimization area for mining cities, primarily located in Aihui District, covering a total area of 6,419 hm2. The dominant landscape type in this area is undisturbed forestland, which can serve as an ecological barrier and support sustainable regional developments (Wei et al., 2023). Therefore, it is essential to continue promoting active forestland protection policies, implementing the “Grain for Green” and “Wetland Restoration” policies, and intensifying efforts to protect the forested landscape in this area (Feng et al., 2023). Human activity should be minimized to reduce negative impacts, and unreasonable agricultural practices such as deforestation for farming must be strictly limited. These measures will help maintain the natural ecological succession of Heihe City while balancing social, ecological, and economic benefits.
The safe areas in Heihe City are areas with strong self-recovery capabilities, where high-high value clustering is evident. These areas have the highest level of ecological security and can accommodate moderate development. This region has been designated as the ecological comprehensive development area, located in the northern part of Aihui District, covering a total area of 1,326 hm2. Although this area enjoys a high level of ecological security, it also faces significant environmental pressures. In the course of development, efforts should leverage the concentration of forestland to enhance infrastructure development, promote the clustering of the forestry industry, and prioritize the advancement of modern forestry. Additionally, it is important to vigorously develop the service sector, accommodate industrial transfers from central cities, and manage population transfers from restricted and prohibited development areas. This approach aims to prevent ecological degradation caused by blind development.
4.3 Limitations and future directions of the study
This study provides important insights into Chinese mining cities’ ecological protection and planning development. The assessment results are a scientific basis for government agencies to formulate ecological protection policies and plans. For mining cities at different stages of development, this study can help determine development strategies and propose appropriate ecological protection measures to ensure the sustainable development of landscape ecological security in mining cities. Despite rigorous data processing and indicator selection, the choice of landscape pattern index, the accuracy of remote sensing data, and the determination of ecological evaluation criteria may all affect the assessment results. To further improve the accuracy of the assessment, future research could consider increasing the analysis of ecological risk assessment to validate the accuracy of the results. While this study analyzed the spatiotemporal dynamics of ecological security levels in the study area and explored their spatial correlations, it did not investigate the driving factors affecting ecological security levels. In the future, it is necessary to conduct a quantitative analysis of the driving factors behind ecological security changes, investigate land use conflicts, and perform multi-scenario simulations and predictions. This will help develop systematic strategies that focus on improving the ecological environment baseline, formulating reasonable spatial layouts, and planning for tourism development to enhance the ecological security status of the research area and promote the sustainable and coordinated development of geological parks and regional ecosystem safety. Furthermore, the ecological regulation measures and planning development strategies proposed in this paper are framed from a policy planning perspective; specific measures need to be implemented through the establishment of an ecological security framework.
5 Conclusion
In this study, for the first time in its kind, the ecological security level of mining cities is integrated with the development strategies of mining cities.Based on the land use data from Heihe, Heilongjiang, from 1980 to 2020, this study analyzed the spatial pattern changes in Heihe using landscape pattern indices. By constructing a landscape ecological assessment system and conducting spatial autocorrelation analysis, the ecological security level of Heihe from 1980 to 2020 was determined. The results of this study are also applicable to mining cities worldwide that are in similar stages. Compared to other studies, this research adopts a “dual evaluation index,” making the constructed ecological security assessment system more comprehensive and the assessment results more objective. The main research conclusions are as follows.
(1) This article reveals the spatiotemporal evolution of land use in Heihe City from 1980 to 2020. Through land use data and land transfer matrices, the study found that over the 40 years, the spatial pattern of land use exhibited overall stability with significant local changes. By 2020, the current land use in Heihe City primarily consists of arable land, forest land, and unused land. Arable land and forest land have gradually shifted towards unused land. This trend indicates that during the urbanization process, mineral exploitation can lead to land degradation.
(2) Using Fragstats 4.2 software, four patch-level indices (AREA_MN, COHESION, FRAC_AM, LPI) and five landscape-level indices (FRAC_AM, LPI, NP, SHDI, CONTAG) were calculated to analyze the spatiotemporal dynamics of the landscape pattern in Heihe City from 1980 to 2020. The study found that over these 40 years, at the patch scale, except for forest land, other patches experienced severe fragmentation, had simpler shapes, and smoother edges. The patches of various land use types showed a high degree of cohesion, with forest land and arable land being the dominant landscapes in the study area. At the landscape scale, the overall landscape diversity in Heihe City increased, while landscape fragmentation and contagion decreased, indicating an optimization of the landscape pattern. Therefore, in future planning, attention should continue to be paid to the connectivity of Heihe City’s landscape spatial pattern.
(3) Spatial autocorrelation analysis was conducted to assess and analyze the ecological security level of Heihe City and its spatiotemporal evolution characteristics from 1980 to 2020. During this period, the overall ecological security index of Heihe City showed an upward trend, but the ecological security index in the southern region remained low. Additionally, the landscape ecological security index displayed spatial clustering, mainly characterized by high-high value clusters and low-low value clusters. High-high value clusters were primarily located in the northern forested areas of the study region, while low-low value clusters were mainly found in the southern mixed land use areas. Therefore, the government of Heihe City should focus on the ecological security of the southern region and take proactive measures to improve it.
(4) Based on the ecological security index, the urban ecological security space of Heihe City was regulated by dividing the city into mining urban ecological security control areas, ecological protection areas, ecological optimization areas, and comprehensive ecological development areas, corresponding to low and lower security areas, general ecological security areas, relatively secure areas, and secure areas, respectively. The ecological security control area focuses on reversing the trend of ecological retrogression. The ecological protection area emphasizes protecting the degraded unused land and forest land within the area. The ecological optimization area promotes active forest protection and ecological policies, while the comprehensive ecological development area aims to improve infrastructure construction and promote industrial diversification. The research results contribute to maximizing ecological and economic benefits in mining cities, promoting the sustainable development of such cities, enriching the theoretical framework, and guiding similar mining cities.
Data availability statement
The original contributions presented in the study are included in the article/Supplementary Material, further inquiries can be directed to the corresponding author.
Author contributions
YS: Conceptualization, Data curation, Investigation, Methodology, Software, Validation, Writing–original draft, Writing–review and editing. XF: Data curation, Methodology, Supervision, Writing–original draft, Writing–review and editing. HC: Conceptualization, Data curation, Investigation, Methodology, Software, Writing–original draft. YK: Conceptualization, Formal Analysis, Methodology, Writing–original draft. MS: Conceptualization, Data curation, Investigation, Methodology, Writing–original draft.
Funding
The author(s) declare that financial support was received for the research, authorship, and/or publication of this article. This research was funded by “The Art and Science Planning Foundation of Tianjin, grant number A16038”, “The Social Science Foundation of Hebei, grant number HB17YS015”, “The outcomes of the first-class curriculum’s Innovative Design A’s in Tianjin Municipality.” and “The Industry -Education Cooperation and Education project of the Ministry of Education grant number 221003711084739”.
Acknowledgments
We sincerely thank the two reviewers for their careful review of this article, which has greatly improved its rigor. We are also very grateful to Mr. Zhang Qingtai from Guangxi Arts University for providing technical guidance for this paper. Additionally, on a personal note, I would like to deeply thank Mr. Xia Xusheng for his companionship and support, and for the encouragement he has given me throughout my three years of graduate study. I sincerely hope that he can continue to accompany me throughout my academic career.
Conflict of interest
The authors declare that the research was conducted in the absence of any commercial or financial relationships that could be construed as a potential conflict of interest.
Publisher’s note
All claims expressed in this article are solely those of the authors and do not necessarily represent those of their affiliated organizations, or those of the publisher, the editors and the reviewers. Any product that may be evaluated in this article, or claim that may be made by its manufacturer, is not guaranteed or endorsed by the publisher.
References
Chen, L., and Ma, Y. (2023). Ecological risk identification and ecological security pattern construction of productive wetland landscape. Water Resour. Manag. 37, 4709–4731. doi:10.1007/s11269-023-03574-1
Cheng, J., Wu, Z., and Liu, P. (2005). Study on the change of agriculture landscape pattern based on GIS--A case study from Maping Town. Chin. J. eco-agriculture 13, 184–186.
Corry, R. C. (2005). Characterizing fine-scale patterns of alternative agricultural landscapes with landscape pattern indices. Landsc. Ecol. 20, 591–608. doi:10.1007/s10980-004-5036-8
Daqing, L., Junbin, Z., and Yushan, Z. (2005). Study on heterogeneity and diversity of landscape ecosystem for slopeland vegetation. Res. Soil Water Conservation 12, 163–165.
Dong, J., Guo, Z., Zhao, Y., Hu, M., and Li, J. (2023). Coupling coordination analysis of industrial mining land, landscape pattern and carbon storage in a mining city: a case study of Ordos, China. Geomatics Nat. Hazards and Risk 14. doi:10.1080/19475705.2023.2275539
Fan, J., Sun, W., and Fu, X. (2005). Problems, reasons and strategies for sustainable development of mining cities in China. J. Nat. Resour. 20, 68–77.
Feng, J., Guo, L., and Li, X. (2016). Analysis of ecological vulnerability in yuyang district based on landscape pattern. Res. Soil Water Conservation 23, 179–184. doi:10.13869/j.cnki.rswc.2016.06.023
Feng, L., Zhang, P., Zhang, M., Liu, H., and Wang, Y. (2023). Strategies and practical paths for ecological restoration and comprehensive management in yulin coal mining area in the new era. Northwest. Geol. 56, 19–29. doi:10.12401/j.nwg.2023087
Gao, B.-P., Li, C., Wu, Y.-M., Zheng, K.-J., and Wu, Y. (2021). Landscape ecological risk assessment and influencing factors in ecological conservation area in Sichuan-Yunnan provinces, China. Ying yong sheng tai xue bao = J. Appl. Ecol. 32, 1603–1613. doi:10.13287/j.1001-9332.202105.018
Gao, K., Yang, X., Wang, Z., Lai, F., Zhang, H., Shi, T., et al. (2024). Sensing the multi-scale landscape functions heterogeneity by big geodata from parcel to urban agglomerations-a case of the Greater Bay Area, China. Int. J. Digital Earth 17. doi:10.1080/17538947.2024.2304073
Han, Y., Guo, X., Jiang, Y., Rao, L., Sun, K., and Yu, H. (2018). Correlation analysis between cultivated land quality and landscape pattern index in south hilly areas. Jiangsu J. Agric. Sci. 34, 1057–1065. doi:10.3969/j.issn.1000-4440.2018.05.013
HuaLin, X. I. E. (2008). Regional eco-risk analysis of based on landscape structure and spatial statistics. Acta Ecol. Sin. 28, 5020–5026.
Jiang, W., Jiang, Z., Liu, A., Yu, Y., and Wang, Y. (2002). Analysis on the spatial pattern dynamic of forest landscape in Anji Mountainous District, Zhejiang province. J. Fujian Coll. For. 22, 150–153. doi:10.1324/j.cnki.jfcf.2002.02.015
Jin, W., and Hu, B. (2003). Discussion on several indices assessing landscape dispersion. Ying yong sheng tai xue bao = J. Appl. Ecol. 14, 314–316. doi:10.13287/j.1001-9332.2003.0071
Jingwei, W., and Haize, W. (2006). Application of landscape index in landscape pattern based on damaike wetland nature reserve in anshan. Res. Soil Water Conservation 13, 230–233. doi:10.13203/j.whugis20140269
Li, B., Qu, A., and Ji, Y. (2016). Landscape pattern analysis for mining area based on optimal grain size. Geomatics Inf. Sci. Wuhan Univ. 41, 939–945.
Li, Q., Ai, F., Wang, X., Ma, Y., Liu, L., Zhu, Z., et al. (2023a). Theoretical analysis and practical exploration on ecological restoration of mines with multi-source solid wastes: example from yulin city, shaanxi province. Northwest. Geol. 56, 70–77. doi:10.12401/j.nwg.2023093
Li, T., Sun, C., and Pang, Y. (2002). Study on countermeasures to realize sustainable development for mining aress. China Soft Sci. 0, 16–19.
Li, X., Ai, Z., Yang, Z., Yao, Y., Ren, Z., Hou, M., et al. (2023b). Ecological risk assessment and restoration area identification of Pengyang County on the basis of the landscape pattern and function. Environ. Monit. Assess. 195, 998. doi:10.1007/s10661-023-11596-w
Li, Z., Li, Y., Li, W., and Xue, M. (2023c). Study on the construction of ecological security pattern in kunming based on MSPA and MCR model. J. Ecol. Rural Environ. 39, 69–79. doi:10.19741/j.issn.1673-4831.2022.0211
Liu, X., Li, L., and Yang, Y. (2023a). Development status of coal mining in China. J. South. Afr. Inst. Min. Metall., 123, 19–27. doi:10.17159/2411-9717/1506/2023
Liu, Y., Huang, C., and Zhang, L. (2023b). The spatio-temporal patterns and driving forces of land use in the context of urbanization in China: evidence from nanchang city. Int. J. Environ. Res. public health 20, 2330. doi:10.3390/ijerph20032330
Lohbeck, M., Bongers, F., Martinez-Ramos, M., and Poorter, L. (2016). The importance of biodiversity and dominance for multiple ecosystem functions in a human-modified tropical landscape. Ecology 97, 2772–2779. doi:10.1002/ecy.1499
Lu, C., Qi, W., Li, L., Sun, Y., Qin, T.-T., and Wang, N.-N. (2012). Applications of 2D and 3D landscape pattern indices in landscape pattern analysis of mountainous area at county level. Ying yong sheng tai xue bao = J. Appl. Ecol. 23, 1351–1358. doi:10.13287/j.1001-9332.2012.0182
Luo, L., Xie, H., Guan, Z., and Wei, P. (2023). Evolution of green space pattern and its ecosystem services change in mining cities: a case study of xuzhou city. Resour. Environ. Yangtze Basin 32, 1686–1697. doi:10.11870/cjlyzyyhj202308012
Lv, L., Guo, W., Zhao, X., Li, J., Ji, X., and Chao, M. (2024). Integrated assessment and prediction of ecological security in typical ecologically fragile areas. Environ. Monit. Assess. 196, 286. doi:10.1007/s10661-024-12453-0
Mardonova, M., and Han, Y. S. (2023). Environmental, hydrological, and social impacts of coal and nonmetal minerals mining operations. J. Environ. Manag. 332, 117387. doi:10.1016/j.jenvman.2023.117387
Nitschke, C. R., and Innes, J. L. (2008). Integrating climate change into forest management in South-Central British Columbia: an assessment of landscape vulnerability and development of a climate-smart framework. For. Ecol. Manag. 256, 313–327. doi:10.1016/j.foreco.2008.04.026
Qing, H., Ranghui, W., and Shixin, W. U. (2007). Spatial- temporal dynamic changes of landscape fragmentation in the upper reaches of tarim river. J. Arid Land Resour. Environ. 21, 73–77. doi:10.1348/j.cnki.jalre.2007.09.001
Sheng, X., Zhou, W., Cao, Y., and Cheng, L. (2018). Analysis of landscape vulnerability in youyu county based on landscape pattern and ecological sensibility. J. Northwest For. Univ. 33, 167–174. doi:10.3969/j.issn.1001-7461.2018.04.28
Shi, B., and Xiang, Z. (2023). Suitability evaluation of underground space development in coal mining cities in Henan province. J. Min. Sci. Technol. 8, 714–724. doi:10.19606/j.cnki.jmst.2023.05.013
Song, W., Gu, H.-H., Song, W., Li, F.-P., Cheng, S.-P., Zhang, Y.-X., et al. (2023). Environmental assessments in dense mining areas using remote sensing information over Qian?an and Qianxi regions China. Ecol. Indic. 146, 109814. doi:10.1016/j.ecolind.2022.109814
Sun, C., and Chen, F. (2017). Assessment on ecological health of landscape of the CoastalWetlands in the mouth of the yalu river. Wetl. Sci. 15, 40–46. doi:10.13248/j.cnki.wetlandsci.2017.01.006
Wang, Q., Tang, F., Li, Y., Huang, J., and Bai, X. (2021). Spatio-temporal differentiation of landscape pattern evolution and its ecological security in karst areas: a case study of trough valley in northeast Guizhou Province. Acta Ecol. Sin. 41, 7273–7291. doi:10.5846/stxb202004160913
Wei, Q. I., Yan-bo, Q. U., Hong-yi, L. I. U., and Le, L. I. (2009). Selection of representative landscape pattern indexes and land use division. China Land Sci. 23, 33–37. doi:10.13708/j.cnki.cn11-2640.2009.01.006
Wei, X., Lin, L., Feng, X., Wang, X., Kong, D., Lin, K., et al. (2023). Construction of ecological security pattern and quantitative diagnosis of ecological problems in Shenmu City. Acta Ecol. Sin. 43, 82–94. doi:10.5846/stxb202204120969
Wu, J., Chen, P., Wen, C.-X., Fu, S.-F., and Chen, Q.-H. (2014). Ecological risk assessment of land use based on exploratory spatial data analysis (ESDA): a case study of Haitan Island, Fujian Province. Ying yong sheng tai xue bao = J. Appl. Ecol. 25, 2056–2062. doi:10.13287/j.1001-9332.20140425.004
Wu, Z., Lei, S., Yan, Q., Bian, Z., and Lu, Q. (2021). Landscape ecological network construction controlling surface coal mining effect on landscape ecology: a case study of a mining city in semi-arid steppe. Ecol. Indic. 133, 108403. doi:10.1016/j.ecolind.2021.108403
Xiaoping, L. I. U., Xia, L. I., Yimin, C., Yan, Q. I. N., Shaoying, L. I., and Minghui, C. (2009). Landscape expansion index and its applications to quantitative analysis of urban expansion. Acta Geogr. Sin. 64, 1430–1438.
Xie, H. (2011). Spatial characteristic analysis of land use eco-risk based on landscape structure:a case study in the Xingguo County, Jiangxi Province. China Environ. Sci. 31, 688–695.
Xu, Q., Qin, K., Lu, F., Kang, H., and Hou, H. (2023). Observational study on the change of vegetation carbon sink in cities with depleted coal resources in transition:Xuzhou as an example. J. China Coal Soc. 48, 2916–2924. doi:10.13225/j.cnki.jccs.cn22.1674
Ya-Hui, H., Sun, W.-B., Fu, Y., and Yang, Y. (2021). Landscape pattern of built-up land in a typical mining city, Datong, Shanxi, China from 1986 to 2018. Ying yong sheng tai xue bao = J. Appl. Ecol. 32, 1614–1622. doi:10.13287/j.1001-9332.202105.011
Yang, K., Hou, H., Li, Y., Chen, Y., Wang, L., Wang, P., et al. (2022). Future urban waterlogging simulation based on LULC forecast model: a case study in Haining City, China. Sustain. Cities Soc. 87, 104167. doi:10.1016/j.scs.2022.104167
Yang, W., and Ye, H. (2023). Identification of ecological networks in the Guangdong-Hong Kong-Macao Greater Bay Area based on habitat quality assessment. Acta Ecol. Sin. 43, 10430–10442. doi:10.20103/j.stxb.202211173329
Yao, C., He, Y., Cheng, J., Zhang, T., Pan, H., and Ma, H. (2023). Evaluation of ecological security pattern and optimization suggestions in Minjiang River Basin based on MCR model and gravity model. Acta Ecol. Sin. 43, 7083–7096. doi:10.20103/j.stxb.202209062546
Ye, X., Dong, L., Lv, L., and Shang, Y. (2022). Spatiotemporal evolution law and driving force of mining city patterns. Environ. Sci. Pollut. Res. 29, 10291–10307. doi:10.1007/s11356-021-16488-5
Yin, J., Qiu, D., and Pan, J. (2012). Ecological security assessment of land use in small towns based on PSR model A case study of 22 towns of tongnan. J. Southwest China Normal Univ. Nat. Sci. Ed. 37, 126–130. doi:10.13718/j.cnki.xsxb.2012.02.015
Zhang, J., Liesch, T., Chen, Z., and Goldscheider, N. (2023a). Global analysis of land-use changes in karst areas and the implications for water resources. Hydrogeology J. 31, 1197–1208. doi:10.1007/s10040-023-02650-5
Zhang, K., Lin, N., Xu, D., Yu, D., and Zou, C. (2018). Research advance on ecological security in China: assessment models and management measures. J. Ecol. Rural Environ. 34, 1057–1063. doi:10.11934/j.issn.1673-4831.2018.12.001
Zhang, M., Yu, L., Zhang, H., and Jing, Z. (2017). Assessment of the ecological security of water environment in Henan based on PSR Model. Ecol. Sci. 36, 49–54. doi:10.14108/j.cnki.1008-8873.2017.05.007
Zhang, Q., Jia, B., Li, T., and Li, W. (2024). Research on the sustainability of greening process in the Mu Us Sandy Land based on the spatiotemporal stability of ecological land. Plos One 19 19, e0292469. doi:10.1371/journal.pone.0292469
Zhang, R., Wang, C., and Xiong, Y. (2023b). Ecological security assessment of China based on the Pressure-State-Response framework. Ecol. Indic. 154, 110647. doi:10.1016/j.ecolind.2023.110647
Zhang, Y., Qu, J., Liang, X., Li, D., and Tian, Z. (2019). New method of constructing landscape ecological vulnerability index and rationality verification. Sci. Surv. Mapp. 44, 129–136. doi:10.16251/j.cnki.1009-2307.2019.11.019
Zhao, J., Yu, Q., Xu, C., Ma, J., Liu, W., Sun, W., et al. (2023). Integrated approach for ecological restoration and ecological spatial network optimization with multiple ecosystem functions in mining areas. Ecol. Indic. 156, 111141. doi:10.1016/j.ecolind.2023.111141
Zhao, Y., He, L., Bai, W., He, Z., Luo, F., and Wang, Z. (2024). Prediction of ecological security patterns based on urban expansion: a case study of Chengdu. Ecol. Indic. 158, 111467. doi:10.1016/j.ecolind.2023.111467
Zhou, D., and Tang, J. (2004). Economy development of mining cities of China:data and analysis. China Ind. Econ., 43–51. doi:10.19581/j.cnki.ciejournal.2004.03.006
Keywords: ecological security assessment, Heihe city, land use, landscape pattern, mining city
Citation: Shi Y, Fan X, Chen H, Kao Y and Sun M (2024) Landscape pattern evolution and ecological security assessment based on land use changes in mining cities: a case study of Heihe city. Front. Environ. Sci. 12:1488439. doi: 10.3389/fenvs.2024.1488439
Received: 30 August 2024; Accepted: 31 October 2024;
Published: 18 November 2024.
Edited by:
Sérgio António Neves Lousada, University of Madeira, PortugalReviewed by:
Duanqiang Zhai, Tongji University, ChinaBiao Liu, China University of Geosciences, China
Copyright © 2024 Shi, Fan, Chen, Kao and Sun. This is an open-access article distributed under the terms of the Creative Commons Attribution License (CC BY). The use, distribution or reproduction in other forums is permitted, provided the original author(s) and the copyright owner(s) are credited and that the original publication in this journal is cited, in accordance with accepted academic practice. No use, distribution or reproduction is permitted which does not comply with these terms.
*Correspondence: Xiaoxiao Fan, MjAxMzExNkBoZWJ1dC5lZHUuY24=
 Yu Shi
 Xiaoxiao Fan
 Haonan Chen
 Yuhan Kao
 Meiqi Sun