- 1Department of Civil Engineering, MIT Muzaffarpur, Muzaffarpur, India
- 2Motihari College of Engineering Motihari, Bihar, India
The Burhi Gandak River, a significant tributary of the Ganga River and a vital water source in Bihar, India, is facing critical water quality degradation due to rapid population growth, urbanization, and industrial activities. This study conducts a detailed water quality assessment of the river, focusing on the effects of these anthropogenic factors across different locations, seasons, and industrial zones. Water samples were collected and analyzed for key parameters, including pH, total dissolved solids (TDSs), total hardness (TH), biological oxygen demand (BOD), and dissolved oxygen (DO). The results indicate significant spatial and temporal variations, with water quality deteriorating notably in areas like Samastipur and Khagaria, where industrial and urban activities are more concentrated. For instance, BOD levels increased from 7.5 mg/L to 9.5 mg/l as the river flows through urban Samastipur, signaling a decline in water quality. Additionally, sugar mills located along the river contribute to higher pollution levels during operational months, especially in Lauria and Sugauli. Seasonal analysis shows that the lean season experiences the highest levels of degradation, while monsoon floods increase suspended solids due to sediment inflow. These findings emphasize the urgent need for improved regulation of industrial discharge and urban waste management to protect the water quality of the Burhi Gandak River and the livelihoods dependent on it.
1 Introduction
Rivers are a vital source of water for drinking, industrial, and irrigation purposes (Prakash et al., 2020). The River Ganga is one of the most important rivers in India, having agricultural, industrial, transportation, tourism, mythological, and ecological significance (Trivedi, 2010). In India, the northern plain is developed by the Ganga River and its tributaries, and it serves approximately 330 million people in India (India-WRIS, 2010). Bihar is one of the states situated in the northern plain of India. In Bihar, there are many important tributaries of the Ganga River, like Gandak, Kosi, Sone, Burhi Gandak, and Ghagara (Sinha and Friend 1994). The Burhi Gandak River is a tributary of the Ganga River. It is also known as ‘Sikrahna’ in Bihar and is one of the tributaries that completely flows in Bihar (Singh et al., 2018). It originates from Chautarwa Chaur near Bishambharpur in the district of West Champaran, Bihar (Kumar, 2020). Burhi Gandak passes through the districts of West Champaran, East Champaran, Muzaffarpur, Samastipur, and Khagaria. The last district of Burhi Gandak is Khagaria, where it joins the River Ganga near Gogri Jamalpur. The total length of Burhi Gandak is 580 km, and its catchment area is 12,021 sq. km (Mishra, 2018). Originating from the Himalayas, it carries a substantial load of detritus. Through this stretch, the river exhibits consistent sinuosity, indicating its mature stage. Its primary source of water is rainfall, with the monsoon season in September bringing heavy precipitation, leading to seasonal floods nearly every year (Philip and Gupta, 2008). Masan, Balor, Pandai, Sikta, Tilawe, and Tiur are the left tributaries, and Dhanauti, Kohra, and Danda are the right tributaries of the Burhi Gandak River (Kumar, 2018). Sinha and Dayal (1980) have shown through the study that the Burhi Gandak River has changed its course many times in history. The river’s reliance on robust physicochemical characteristics of water underscores the critical importance of preserving water quality, making it a matter of utmost significance (Verma, 2018a; 2018b).
In recent decades, many cities and towns, like Motihari and Muzaffarpur, have developed along the banks of the Burhi Gandak. The population in these towns is growing rapidly. The population of Muzaffarpur and Motihari districts is approximately 4.8 million and 5 million, respectively (Village and Town Directory, 2011). The population density of these areas is more than 1200 persons/km2. So, because of this, urban activities are also increasing. Industries in these cities and towns are growing rapidly. These regions are fertile lands, and the water of Burhi Gandak is being used for irrigation purposes. These areas have agriculture-based industries such as litchi processing, sugar industry and dairy, manufacturing industries such as leather and textile, food processing industry, engineering and metal works, and chemical industries (Muzaffarpur- District Industrial Potential Survey, 2011). Due to urbanization and industrial growth, huge amounts of wastewater are being generated and polluting the river water. Pollution of rivers presents a growing challenge in India, as noted by Bhargava (1987). Like many others, the Ganga River faces contamination primarily from human sewage, animal waste, agricultural runoff, population growth, toxic waste, and industrial pollutants, as highlighted by Bhardwaj et al. (2010). This pollution poses significant threats to both human health and biodiversity, as emphasized by Lantzy and Mackenzie (1979), Nriagu (1979), and Ross (1994). Rivers can be tainted by degradable substances such as organic matter (e.g., flowers and wood) and non-degradable materials, including plastics, electronic waste, and metals. Understanding the physical and chemical attributes of river water is essential for evaluating its quality and determining its suitability for various purposes, such as public water supply, agriculture, and industry, as outlined by Dwivedi and Pathak (2007).
Researchers like Kumar and Mishra (2015) and Sharma and Choudhary (2014, 2016) have conducted studies on the water quality of the Burhi Gandak River. A study of the tributaries of Ganga along with Burhi Gandak shows a pH value of 7.1–8.7 and a DO of 0.7–10.7 (India-WRIS, 2010). Ali and Roy (2024) investigated the impact of the Muzaffarpur City land change on the urban runoff and the water quality of Burhi Gandak. These studies do not deal with the impact of urbanization and industrialization on various water quality parameters. Kumar (2020) has conducted a hydrobiological study on the Burhi Gandak River near the urban area of Samastipur. Furthermore, the limited regions of the rivers were considered in all these studies. The present study investigates the water quality in different regions of the Burhi Gandak River. In addition, the impact on the water quality of Burhi Gandak by urbanization and industrialization is investigated. The findings from this paper will contribute to a deeper understanding of the water quality challenges faced by the Burhi Gandak River. By identifying critical factors influencing degradation, particularly in urbanized and industrialized areas, this study lays the groundwork for informed policy decisions and more effective management strategies. Future research can be built on this foundation to establish real-time water quality monitoring systems and develop predictive models to anticipate seasonal variations, especially during lean seasons. Moreover, this research can guide local authorities in prioritizing pollution control measures, enhancing community awareness, and fostering sustainable practices to preserve the river’s water quality. Additionally, these insights may serve as a reference for addressing water quality challenges in other tributaries of the Ganga River and beyond, encouraging further collaborative efforts to improve the ecological health of the region’s waterways.
2 Materials and methods
2.1 Study area
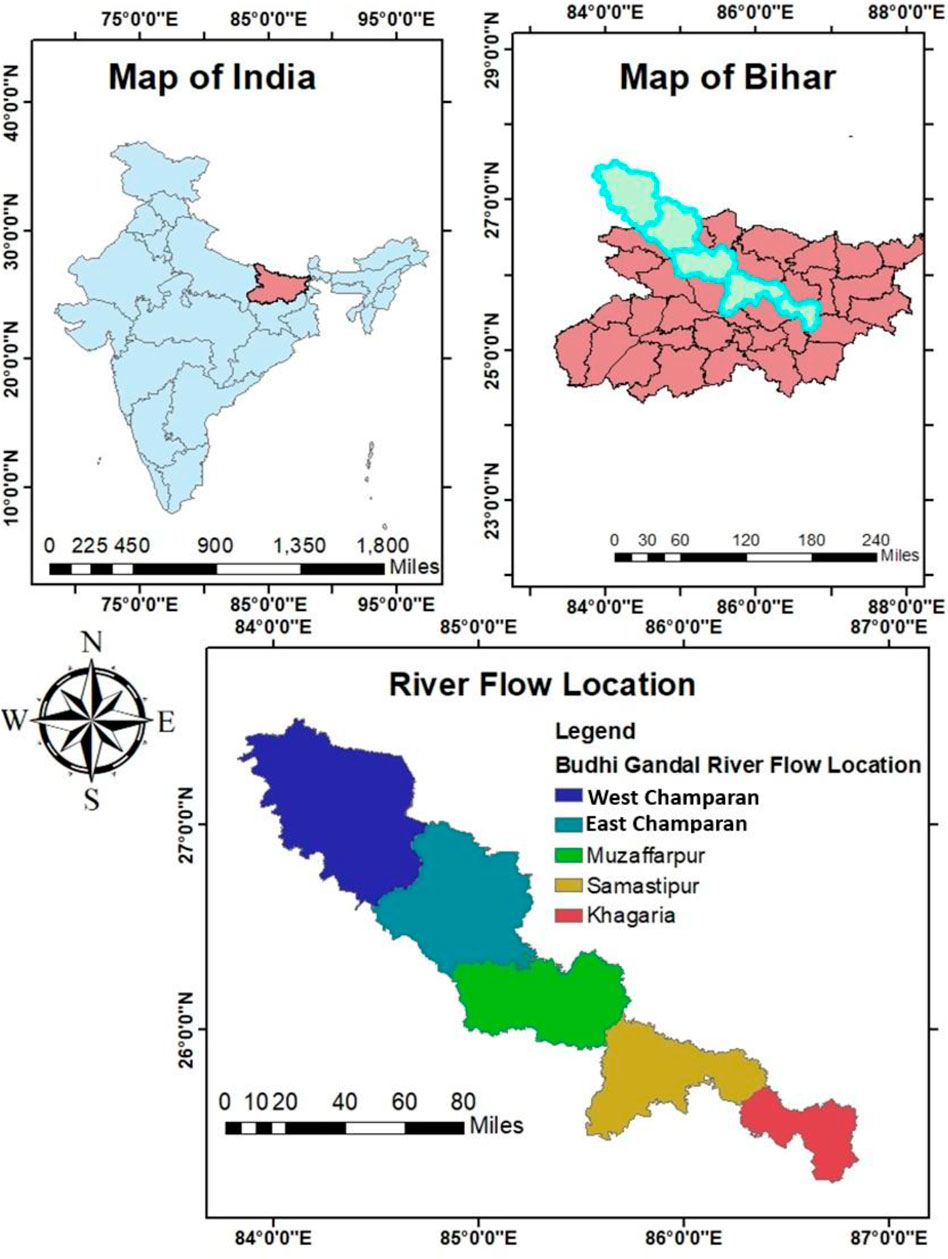
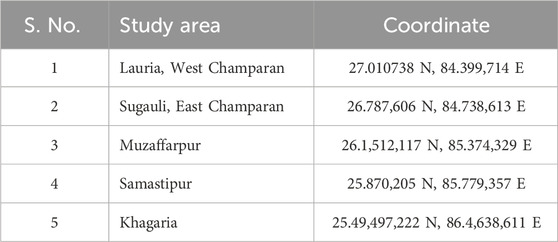
As mentioned earlier, Burhi Gandak originates from the West Champaran District and meets Ganga in the Khagaria District. Considering this, five places were selected to collect the water quality data of the Burhi Gandak River. These places are near Lauria, Sugauli, Muzaffarpur, Samastipur, and Khagaria. Figure 1 shows the map of the places from where water quality data were collected. The coordinates of the places are shown in Table 1. Burhi Gandak originates from the district of West Champaran. So, Lauria, a small town from West Champaran, which is on the bank of the Burhi Gandak River, was selected for the study. It is approximately 28 km from the district headquarters and is one of the important Buddhist archaeological sites. The next location selected on the downstream side was Sugauli. It is situated in East Champaran. Both Lauria and Sugauli are famous for the sugar industry.
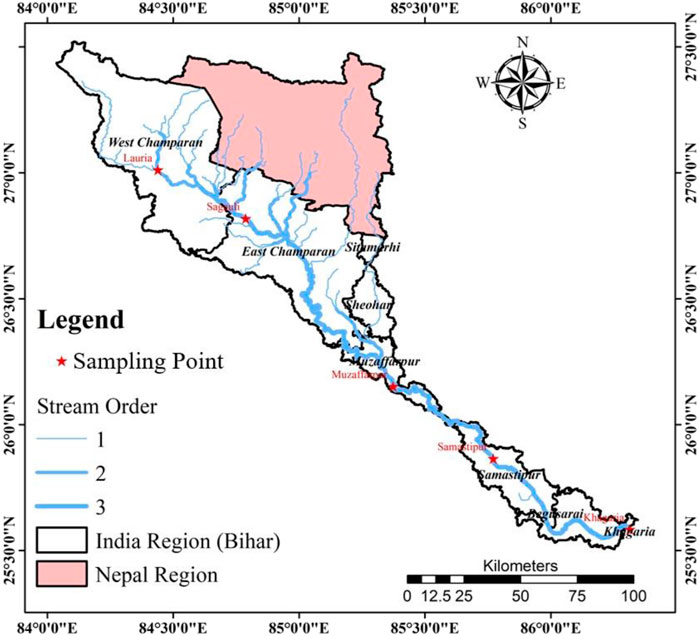
The next sites selected for study were Muzaffarpur and Samastipur. Both are significant cities in North Bihar. As per the 2011 census of India, the population of Muzaffarpur City is more than three lakh, and the population density is 13,285 persons per sq km. Both Muzaffarpur and Samastipur are important from the industrial activity point of view. The last location selected in the study is Khagaria. Burhi Gandak meets the Ganga River in the district of Khagaria. Considering this, the last location was selected. Figure 2 illustrates the delineated watershed of the Burhi Gandak River, incorporating the hierarchical stream ordering and designated data collection points. The stream order classification effectively highlights the hydrological network’s structure, while the marked data collection sites provide critical reference points for subsequent spatial and hydrological analyses within the watershed.
2.2 Geomorphological and hydrological details
The Burhi Gandak River displays various geomorphic features, including point bars, oxbow lakes, meander scars, and abandoned channels. In the middle and downstream sections, notable features include river terraces, point bars, floodplain deposits, and natural levee deposits. The river channel becomes shallower as it flows upstream but deepens downstream. The Burhi Gandak River exhibits pronounced meandering characteristics, particularly in Samastipur and Begusarai districts. Throughout these areas, the river channel frequently divides and reunites downstream, creating an anastomosing channel pattern. In the proximal, middle, and distal sections, the slope gradients of the Burhi Gandak River measure 69.0, 12.0, and 8.60 cm/km, respectively (Singh and Singh, 2005). The valley width ranges from 20 to 800 m, being narrowest in the proximal part and widest in the distal part.
The annual rainfall data of the study regions considered in this study is presented in Figure 2. The rainfall data presented in this study are from 1971 to 2022. It can be observed that the average annual rainfall for all the locations considered in this study is more than 1000 mm. It indicates that a sufficient amount of rainfall is obtained in the catchment area of Burhi Gandak. Most of the rainfall in this region occurs during the monsoon season. The annual average rainfall data from 1971 to 2020 show that West Champaran receives the maximum rainfall among all the locations selected. West Champaran is located in the Tarai region of the Himalayas. This increases the rainfall in this region. These data further show that Samastipur is getting a relatively lesser amount of rainfall among the sites considered. However, rainfall data from 2019 to 2022 show that the average annual has decreased for all the locations. However, Muzaffarpur has the highest reduction in rainfall. It has become a place with the lowest rainfall among all the considered locations. It is difficult to estimate the possible cause of it with limited data. However, recently, the highest growth in industrialization and urbanization has taken place in Muzaffarpur City among all the selected cities. This might be one of the major causes of the reduction in rainfall.
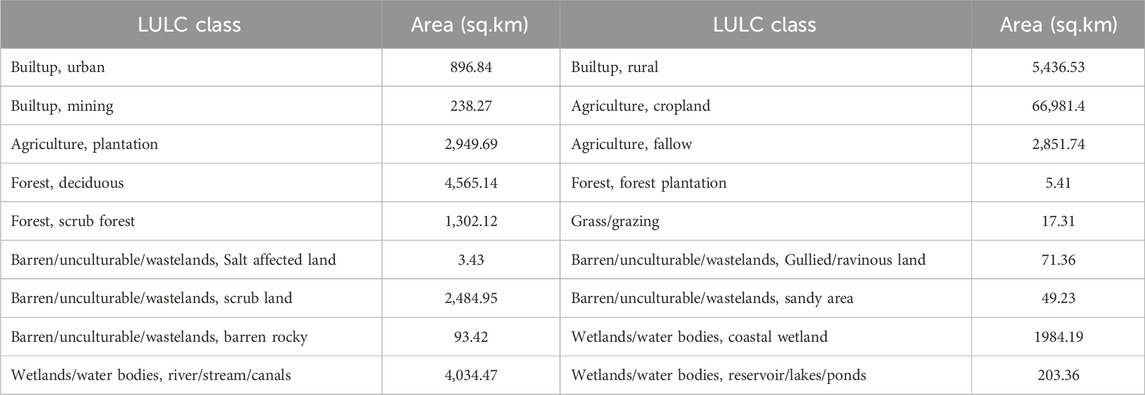
The land use land cover (LULC) map for the study area was generated using ArcGIS, leveraging satellite imagery and a digital elevation model (DEM) for enhanced spatial accuracy. After preprocessing the imagery, supervised classification was employed to delineate key land cover types, including agricultural, forest, urban, and water bodies. The integration of DEM data provided critical topographical context, refining land classification, particularly in areas with varied elevations. This synergy of LULC and DEM in ArcGIS enabled precise spatial analysis, which is essential for environmental and topographical assessments. Figure 3 shows the LULC map of Bihar. The LULC map indicates the land and its utilization, like forest area, crop area, and urban area. It can be observed in Figure 4 that most of the regions have similar rainfall patterns. Table 2 shows the area of the different LULC classes. It shows that agricultural cropland covers the highest area. The district, except for West Champaran, through which Burhi Gandak flows, has mainly cropland or buildup area. The northern part of West Champaran is covered with forest areas.
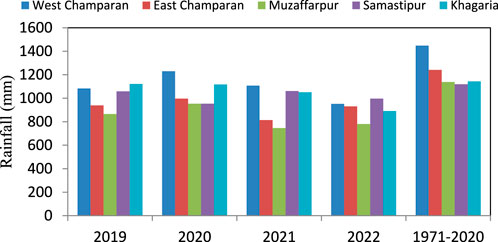
Figure 4. Rainfall data for different districts from 1971 to 2022 (MOES, 2010; DES, 2022).
To understand the impact of urbanization, industrial activities, and location on the water quality of the Burhi Gandak River, data related to geomorphology and hydrology were collected from the available literature and the official government websites of the government of Bihar and India after this water quality-related data were collected. For this purpose, results from the laboratory tests and data from the literature were used. The water quality data of Lauria, Sugauli, and Muzaffarpur were obtained from the laboratory test results, while data of Samastipur and Khagaria were obtained from the available literature. The data obtained from the literature were confirmed through the laboratory test performed on the sample obtained from the mentioned location through random sampling.
3 Results and discussion
As mentioned earlier, to evaluate the impact of different conditions like location, industrialization, urbanization, and season’s water quality, data were collected from the direct testing of the water sample or the literature available. The impact of these factors is discussed in the following section.
3.1 Impact of location
The variations in the pH, total dissolved solids (TDSs), total hardness (TH), biological oxygen demand (BOD), and dissolved oxygen (DO) for different locations are presented in Figure 5. It can be observed that all these water quality parameters vary significantly from one location to another. The pH value of the water is 7.1, while it is 7.8 for Lauria and Khagaria (Fig, 4a), with Samastipur exhibiting the highest pH levels. Furthermore, TDS and BOD are also highest in Samastipur (4b, 4d). For Lauria and Khagaria, TDS values are almost in a similar range, but Sugauli and Muzaffarpur show relatively high TDS values. TH for all locations is in the range of 113–144 mg/L (4d). The variation in the DO value, as presented in Figure 5E, shows that the DO of water in Lauria, Sugauli, and Muzaffarpur is around 8. However, in Samastipur and Khagaria, it decreases to around 7. All the places have good DO levels. The presence of DO is important for aquatic life. So, the present condition of DO indicates that Burhi Gandak is satisfactory from the aquatic life point of view. Furthermore, we can conclude that the quality of the river water heavily depends on the local conditions. So, there is always a requirement for local control of human activities to improve or maintain the quality of water.
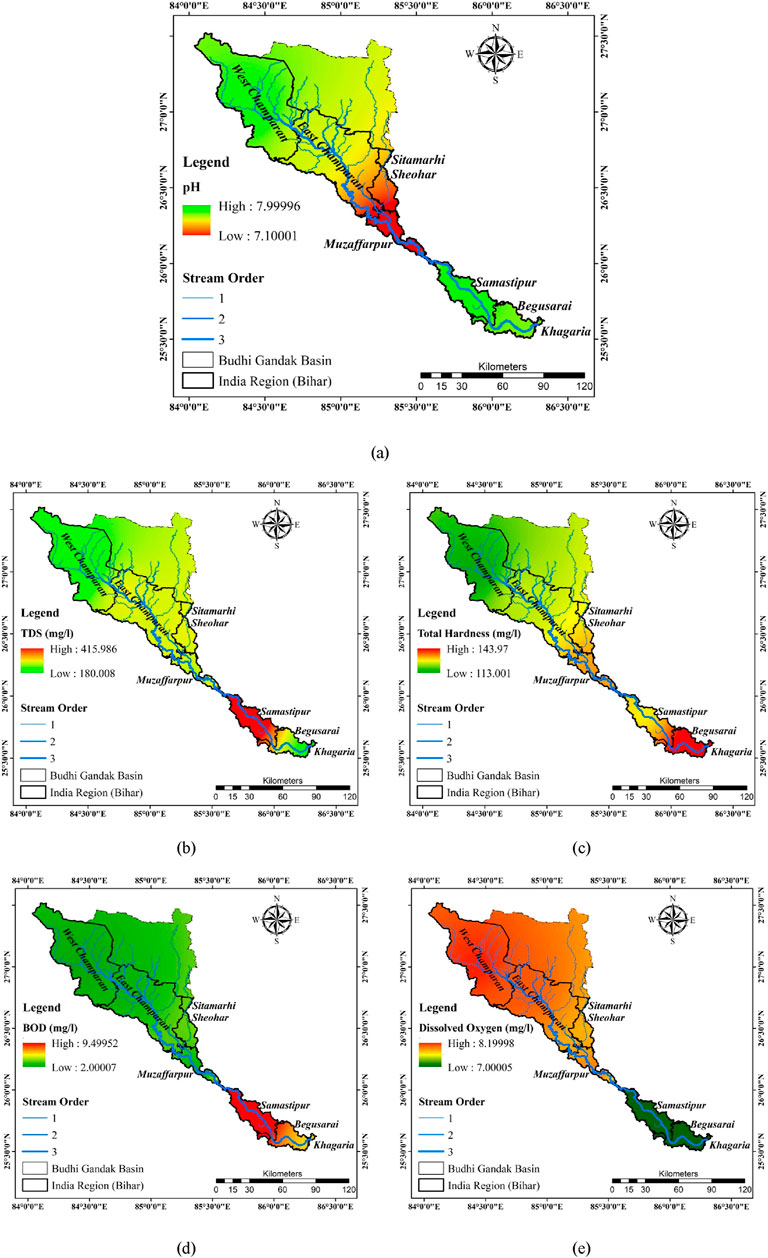
Figure 5. River water quality at different locations (Sharma and Choudhary, 2016; Kumar and Mishra, 2015), (A) variation in pH in different locations, (B) variation in TDS in different locations, (C) variation in TH in different location, (D) variation in BOD on different location, and (E) variation in DO on different location.
The impact of the industry on the water quality of rivers can be understood by comparing the results shown in Figures 6, 7. Figure 6 shows the result of the water quality of Sugauli, and Figure 7 shows the water quality results of Lauria. Both of the places have sugar plants near the banks of the Burhi Gandak River. Sugar plants do not operate for the full year. They start in November and close in March. So, to understand the impact of the industry on the water quality of the river, water samples were collected and tested during the operational and shutdown seasons of the industry. It can be observed for both places that degradation in water quality took place when the industry was running. The quality parameters of water are within permissible limits in all cases. However, it can be concluded from Figures 6, 7 that due to industrial activity, water quality is affected. There is a requirement for proper supervision of these industries so that they maintain the quality of the water coming from their effluent treatment plants.
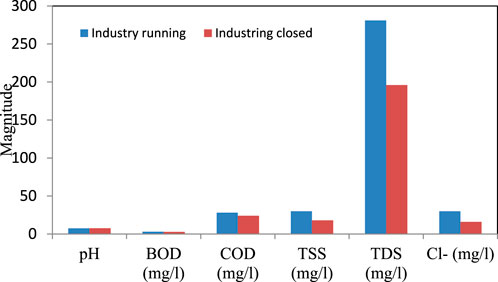
Figure 6. Variation in different parameters for closed and running industry for river water near Sugauli.
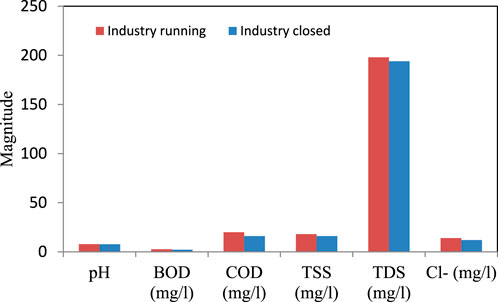
Figure 7. Variation in different parameters for closed and running industry for river water near Lauria.
3.2 Impact of urbanization
The impact of urbanization can be understood by comparing the results of water quality presented in Figures 8–10. Figure 8 indicates the water quality of the river for all the seasons collected from the entry point of Samastipur City. Figure 9 shows the water quality for all the seasons of the river collected from the midpoint of the city, while Figure 10 shows the water quality for all the seasons at the endpoint of the city. It can be observed that the water quality is degraded at the end of the city to the entry point. The BOD of the water at the entry point in summer was 7.5 and has increased to 9.5 at the exit point of the city. A similar trend can be observed for the monsoon and winter seasons. Currently, water quality at the entry and exit points of the city is satisfactory. However, Samastipur and other cities in Bihar are growing rapidly. Different industrial activities are also increasing in these cities. So, there is a requirement for proper supervision of the quality of water and human activities in such cities or towns.
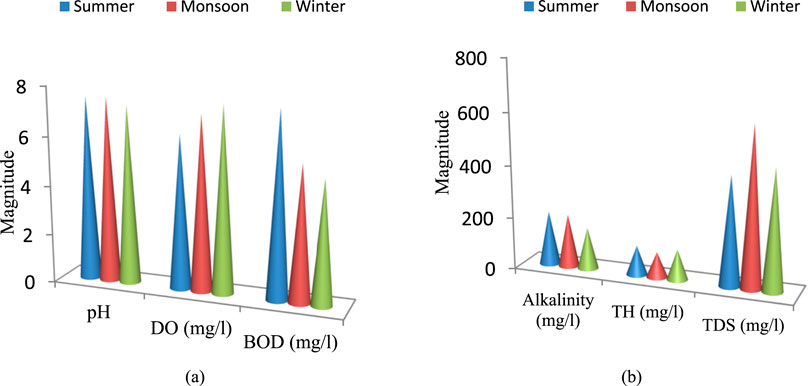
Figure 8. Variation in the different parameters in (A) and (B) for river water at the entry point of Samastipur (Kumar and Prasad, 2022).

Figure 9. Variation in the different parameters in (A) and (B) for river water at the midpoint of Samastipur (Kumar and Prasad, 2022).
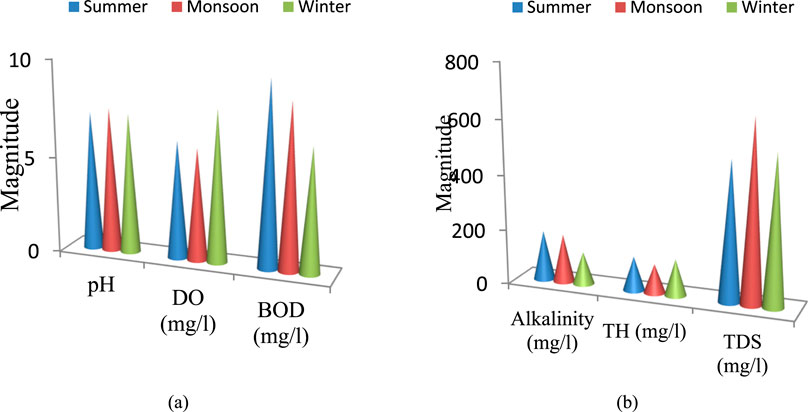
Figure 10. Variation in the different parameters in (A) and (B) for river water at the exit point of Samastipur (Kumar and Prasad, 2022).
3.3 Impact of duration/season
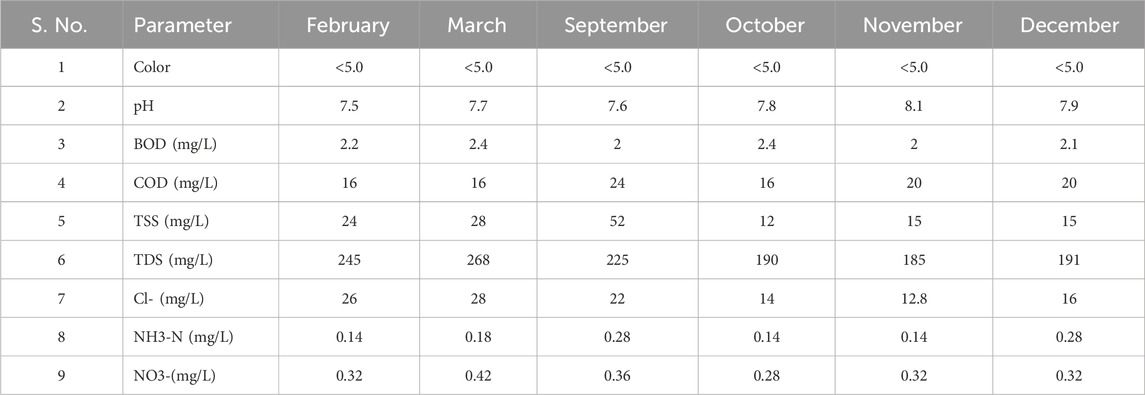
Table 3 shows the quality of water collected from Burhi Gandak near Sugauli in different months. In North Bihar, heavy rainfall occurs mainly during the monsoon season, which starts from mid-June and remains till mid-September. During this time, flood conditions occur in all the rivers of North Bihar, and it remains till September. Considering this, the results of post- and pre-monsoon are presented in Table 3. It can be observed that the other quality of water is not changing except the amount of the TSSs. During flood conditions, huge amounts of sediments get mixed in the water. Due to this, the total suspended solids increased during the monsoon season, i.e., in September.
The quality of the Burhi Gandak River is influenced by several key pollutants, including the following:
a. Organic matter: the high BOD levels, especially around urban areas like Samastipur, suggest the presence of organic pollutants. These may originate from untreated or poorly treated domestic sewage, agricultural runoff, and effluent discharges from sugar plants.
b. Suspended solids: the monsoon season significantly increases the TSSs due to soil erosion and sediment transport from upstream areas. Industrial discharges, particularly those from sugar plants, can also contribute to suspended solids when not properly managed.
c. Chemical pollutants: fertilizers and pesticides from agricultural runoff are a significant source of nitrates and phosphates in the river. Industrial effluents containing chemicals, especially during the operational season of sugar mills, contribute to TDSs and may carry other pollutants like heavy metals or chemical residues.
d. Pathogenic microorganisms: urbanization leads to higher contamination with pathogenic microorganisms, as seen in areas with inadequate sewage treatment. These pollutants can compromise the biological health of the river, affecting its suitability for drinking, agriculture, and aquatic life. Anthropogenic activities play a crucial role in degrading the water quality of the Burhi Gandak River. The activities that are possibly affecting the quality of water can be summarized below.
e. Industrial discharges: the sugar plants located near the banks of the river, such as those in Sugauli and Lauria, release industrial effluents, particularly during their operational season (November to March). Despite effluent treatment plants, there is still a noticeable degradation in water quality when these industries are active. The discharge from sugar mills adds organic matter, chemicals, and suspended solids to the river, affecting overall water quality.
f. Urbanization and domestic sewage: rapid urbanization in cities like Samastipur has led to the discharge of untreated or partially treated domestic wastewater into the river. The increase in BOD levels as the river flows through urban areas indicates the contribution of organic pollutants from human activities, including sewage and waste disposal.
g. Agricultural runoff: agricultural activities in the region contribute to the river’s pollution, especially during the rainy season when runoff carries fertilizers, pesticides, and other chemicals into the river. This runoff increases the levels of dissolved solids and chemical pollutants such as nitrates and phosphates, contributing to the nutrient loading of the river and potential eutrophication.
h. Land use changes and deforestation: land use changes, including deforestation and soil erosion, contribute to sediment deposition in the river, particularly during the monsoon season. This results in increased TSS levels and turbidity, as shown by the higher TSS values during the post-monsoon period.
4 Conclusion
Based on the data collected from the laboratory analyses and relevant literature, the impact of different parameters, location, industrialization, and urbanization, on the water quality of the Burhi Gandak River was investigated. Based on analysis, the following major conclusions can be drawn.
• The quality of the river varies from location to location and heavily depends on the local conditions.
• The water quality gets degraded due to industrial activities. There is a requirement for the supervision of these industries so that the quality of water remains within the desirable limits.
• The urbanization of cities along the bank of the Burhi Gandak River significantly influences the water quality of the river. So, there is a requirement for the supervision of the water quality of rivers near cities and towns as well as the human activities occurring in these cities.
• The impact of the season on water quality is temporary. The Burhi Gandak River is mainly influenced during the monsoon season, which lasts for 2–3 months. So, the impact is for a short duration.
Data availability statement
The raw data supporting the conclusions of this article will be made available by the authors, without undue reservation.
Author contributions
AP: writing–original draft. AR: writing–review and editing. VK: writing–review and editing. AK: writing–review and editing. NK: Writing-review and editing.
Funding
The author(s) declare that no financial support was received for the research, authorship, and/or publication of this article.
Conflict of interest
The authors declare that the research was conducted in the absence of any commercial or financial relationships that could be construed as a potential conflict of interest.
Publisher’s note
All claims expressed in this article are solely those of the authors and do not necessarily represent those of their affiliated organizations, or those of the publisher, the editors, and the reviewers. Any product that may be evaluated in this article, or claim that may be made by its manufacturer, is not guaranteed or endorsed by the publisher.
References
Ali, A. M., and Roy, L. B. (2024). Muzaffarpur city land changes and impact on urban runoff and water quality of the river Burhi Gandak. Int. J. Environ. Sci. Technol. 21, 2071–2082. doi:10.1007/s13762-023-05008-2
Bhardwaj, V., Singh, D. S., and Singh, A. K. (2010). Water quality of the chhoti Gandak River using principal component analysis, Ganga plain, India. Sci. 119, 117–127. doi:10.1007/s12040-010-0007-8
Bhargav, D. S. (1987). Nature and the Ganga. Envi. Conserv. 14 (4), 307–318. doi:10.1017/S0376892900016829
DES (2022). Directorate of Economics and Statistics, district-wise rainfall data of Bihar. Available at: https://dse.bihar.gov.in/rainfall.htm.
Dwivedi, S. L., and Pathak, V. (2007). Studies of water quality of Mandakini River in Chitrakoot for irrigation purposes. Ind. J. Envi. Prot. 27, 761–764.
India-WRIS (2010). “Ganga Basin report,” in India-WRIS. Available at: https://www.india-wris.nrsc.gov.in.
Kumar, M. (2018). A geomorphic study of Burhi Gandak drainage basin in Muzaffarpur district. Int. J. Res. Eng., IT Soci. Sci. 8 (8), 323–329.
Kumar, N., and Mishra, Y. (2015). Effect of sewage and limnobioloy of Burhi Gandak River near Samastipur urban area. Int. J. Bio. Sci. 9 (1), 8–12.
Kumar, S. (2020). Hydrobiological study of Burhi Gandak River near the urban area at Samastipur (Bihar). Int. J. Environ. Sci. 11 (1), 5–10. doi:10.53390/ijes.v11i1.2
Kumar, S. (2020). Hydrobiological study of Burhi Gandak River near the urban area at Samastipur (Bihar). Int. J. Envi. Sci. 11 (1), 6–10. doi:10.53390/ijes.v11i1.2
Kumar, S., and Prasad, J. (2022). Water quality of Burhi Gandak River near Samastipur town, Bihar. Int. J. Bio. Sci. 13 (1), 8–13.
Lantzy, R. J., and Mackenzie, F. T. (1979). Atmospheric trace metals global cycles and assessment of man’s impact. Geochimica Cosmochimica Acta 43, 511–525. doi:10.1016/0016-7037(79)90162-5
Mishra, D. K. (2018). Revisiting Burhi Gandak breach at begampur in Samastipur district of Bihar-1986. Dialogue 19 (3), 70–83.
MOES (2010). Ministry of earth science, 110 Years (1901-2010) monthly rainfall data series for districts, states and met sub-divisions and all India. Available at: https://www.imdpune.gov.in/library/public/e-book110.pdf
Muzaffarpur-District Industrial Potential Survey (2011). District census handbook, directorate of census operations Bihar village and town directory.
Nriagu, J. O. (1979). Global inventory of natural and anthropogenic emissions of trace metals to the atmosphere. Nature 279, 409–411. doi:10.1038/279409a0
Philip, G., and Gupta, R. P. (2008). Channel pattern transformation of the Burhi-Gandak river, Bihar, India: a study based on multidata sets. Geocarto Int. 8 (3), 47–51. doi:10.1080/10106049309354419
Prakash, S., Kumar, A., Prakash, S., and Mishra, B. K. (2020). A survey of the fish fauna of Rapti River, Balrampur (U.P.), India. Int. J. Bio. Innov. 2 (1), 76–81. doi:10.46505/IJBI.2020.2110
Sharma, D., and Choudhary, S. K. (2014). Evaluation of water quality index for assessment of water quality of the Budhi Gandak River at Khagaria, Bihar. Pollut. Res. 33 (4), 81–86.
Sharma, D., and Choudhary, S. K. (2016). A comparative assessment of water quality index of surface (river) water and groundwater along the Budhi Gandak belt using correlation analysis at Khagaria (Bihar). Ecoscan 10 (1and2), 7–12.
Singh, D. S., and Singh, I. B. (2005). Facies architecture of the Gandak megafan, Ganga plain, India. Paleontological Soc. Ind. 2, 125–140.
Singh, D. S., Tiwari, A. K., and Gautam, P. K. (2018). “The Burhi Gandak: most sinuous river,” in The Indian rivers. Editor D. S. Singh (Singapore: Springer Hydrogeology. Springer). doi:10.1007/978-981-10-2984-4_17
Sinha, R., and Friend, P. F. (1994). River systems and their sediment flux, Indo-Gangetic plains, Northern Bihar, India. Sedimentology 41 (4), 825–845. doi:10.1111/j.1365-3091.1994.tb01426.x
Sinha, S. N., and Dayal, N. (1980). Geomorphological and sedimentological study of a part of lower Ganga basin, district Begusarai. Bihar. J. Geo. l Soc. Ind. 21, 348–353.
Trivedi, R. C. (2010). Water quality of the Ganga River – an overview. Aquatic Eco. Health and Mang 13 (4), 347–351. doi:10.1080/14634988.2010.528740
Verma, A. K. (2018a). Unsustainable agriculture, environmental ethics, and ecological balance. HortFlora Res. Spectr. 7 (3), 239–241.
Verma, A. K. (2018b). Ecological balance: an indispensable need for human survival. J.Expi. Zool. Ind. 21 (1), 407–409.
Keywords: water quality, urbanization, industrialization, Burhi Gandak, Ganga
Citation: Priyadarshee A, Rahul AK, Kumar V, Kumar A and Kumar N (2024) Spatial variation in water quality of the Burhi Gandak River: a multi-location assessment. Front. Environ. Sci. 12:1487469. doi: 10.3389/fenvs.2024.1487469
Received: 28 August 2024; Accepted: 28 October 2024;
Published: 11 November 2024.
Edited by:
Jahangeer Jahangeer, University of Nebraska-Lincoln, United StatesReviewed by:
Shamshad Ahmad, District Water Testing Laboratory Jal Nigam, IndiaAditya Kapoor, Indian Institute of Technology Roorkee, India
Copyright © 2024 Priyadarshee, Rahul, Kumar, Kumar and Kumar. This is an open-access article distributed under the terms of the Creative Commons Attribution License (CC BY). The use, distribution or reproduction in other forums is permitted, provided the original author(s) and the copyright owner(s) are credited and that the original publication in this journal is cited, in accordance with accepted academic practice. No use, distribution or reproduction is permitted which does not comply with these terms.
*Correspondence: Atul Kumar Rahul, YXR1bGNpdmlsLmlpdGJodUBnbWFpbC5jb20=
 Akash Priyadarshee
 Atul Kumar Rahul
 Vijay Kumar
 Ashish Kumar
 Niraj Kumar2