 Shangbo Li
 Yong Chen*
94% of researchers rate our articles as excellent or good
Learn more about the work of our research integrity team to safeguard the quality of each article we publish.
Find out more
ORIGINAL RESEARCH article
Front. Environ. Sci., 09 January 2025
Sec. Land Use Dynamics
Volume 12 - 2024 | https://doi.org/10.3389/fenvs.2024.1481186
This article is part of the Research TopicThe Sustainable Management of Land SystemsView all 24 articles
The overlap and irrational distribution of Production-Living-Ecological Spaces (PLES) has disrupted traditional urban-rural development patterns and impeded regional integration. This study, focusing on the Yangtze River Delta region, introduces a PLES framework and constructs a classification system based on multitemporal land use data. The CA-Markov model was employed to simulate land use changes for the years 2030 and 2040. By quantifying and analyzing the number, distribution, and transitions of PLES categories, the study identifies spatial and temporal patterns and evaluates the coupling coordination of the various PLES components. The key findings are as follows: (1) The proportion of Production-Living Space (PLS) increased from 9
The spatial organization and distribution of Production-Living-Ecological Spaces (PLES) emerged from prolonged human activities. Consequently, refining the configuration and distribution of PLES is vital and aligns with the evolving developmental path of human society (Liu, 2016). In recent decades, China has witnessed significant urban growth, paralleled by substantial challenges in managing spatial development and maintaining environmental sustainability. The development of PLES has been shaped by global factors such as climate change, biodiversity loss, and ecological degradation. This global-to-local shift in sustainable development paradigms necessitates a focused academic exploration into the logical and balanced structuring of PLES. Such structuring must address complex ecological and environmental changes while fulfilling the growing material needs of human populations (Yang, 2020).
The concept of PLES is pivotal to spatial planning, yet its application in research, especially in international contexts, remains limited. Globally, investigations into PLES often rely on classical Western theories such as spatial zoning (Buck, 1943), ribbon cities (Blayney-Dyett, 1980), and idyllic cities (Short, 2006). These studies primarily concentrate on analyzing and improving regional functions. In contrast, the discourse in China is more comprehensive. In 2012, the Chinese government emphatically declared the need to optimize the spatial development pattern of the nation’s territory, aiming to promote a development paradigm characterized by intensive and efficient production spaces, livable and moderate living spaces, and pristine and beautiful ecological spaces (Huang et al., 2017). Consequently, the PLES concept has rapidly become a central theme in land science, urban planning, and related disciplines within China. Despite its prominence, the definition of PLES has been elusive, particularly in the face of evolving dynamics in spatial planning. This ambiguity has led to multiple challenges, including a gap between theoretical frameworks and practical implementation, which makes the application of PLES a subject of debate (Kong et al., 2021).
The current research on PLES primarily concentrates on theoretical connotations, identification, and classification. Scholars are dedicated to enhancing and expanding the theoretical implications of PLES. Systematic studies in classification and identification typically involve analyzing spatial representations. These two research aspects are interconnected and collaboratively contribute to theoretical advancement. This process has led to two primary research paradigms: the first emphasizes “Land” focusing on its essential characteristics and functions (Bian et al., 2016; Yue and Zhang, 2007). For instance, Liu et al. (2017) proposed a PLES division concept based on the “bottom-up, functional hierarchy” principle, taking into account existing land use conditions and analyzing their balance. This approach provides a scientific foundation for planning and optimizing PLES decision-making. Concurrently, some scholars have developed a series of value volume accounting functions derived from the value function of land ecosystem services, thereby enhancing the methodology for assessing PLES (Zhang et al., 2017; Liu et al., 2016; Li and Fang, 2016). The second paradigm focuses on “Space” examining PLES performance across various scales and its distinctions Wei et al. (2021); Hong et al. (2023). For example, Hu et al. (2016) analyzed PLES from different regional perspectives, including urban and rural contexts, emphasizing distinguishing PLES functions across regions rather than applying a generalized approach. Additionally, Fu et al. (2022b) used a coupled coordination degree model to delineate PLES at the national level and investigated changes and evolutionary patterns in PLES across 336 cities from 2000 to 2020. Conversely, Li et al. (2021) selected specific temporal nodes to conduct an in-depth analysis of changes in Coupled Coordination Degree (CCD) at the regional level. The extensive use of multi-source big data has significantly enhanced the precision of PLES research methodologies and techniques. For example, Fu et al. (2022a) utilized remote sensing, Points of Interest (POI), and nocturnal illumination data, along with advanced algorithms such as convolutional neural networks (CNN), machine learning, and random forests, to proficiently identify and categorize the spatial functions of PLES within urban environments. Their research demonstrates that models incorporating multi-source data and machine learning substantially improve classification outcomes and increase predictive accuracy.
Driven by the intensifying spatial reform of land and evolving demands, numerous scholars have conducted studies from the perspectives of multifunctional land use Li and Wu (2022); Du et al. (2022) and ecological service system functions (Liang et al., 2022). The study sought to elucidate the transformation process of PLES and its coupling mechanism. It aimed to uncover the spatial and temporal evolutionary characteristics and the coupling and coordination relationships of regional PLES, while also conducting an in-depth analysis of its driving factors and ecological impacts. Gong et al. (2023) developed a county-level Productive-Living-Ecological Framework evaluation system utilizing integrated coordination and spatial autocorrelation models, with counties as the evaluation unit. They quantitatively analyzed the PLES of counties in Jiangsu Province and suggested relevant optimization strategies. Liu et al. (2022) forecasted the progression of the coupled PLES coordination degree in the Daqing River Basin, informed by land use dynamics, and examined the effects under various development scenarios. Concurrently, they analyzed the effects of different spatial configurations on sustainable urban development. Hong et al. (2023) investigated the determinants of PLES in Changfeng County by utilizing the land transfer matrix, center of gravity migration, and geographic factor detection models, identifying policy regulation as the primary influence. While these studies have established a quantitative scientific foundation for the regularity and characterization of PLES through the classification and identification of various scenarios, the current research predominantly emphasizes the analysis of spatial variability within a single time frame. The efficacy of this method is significantly contingent upon the quality of data collection. It lacks integrated forecasting and analysis across various temporal intervals, urban cluster scales, and models. This constrains our thorough comprehension of the optimization of regional spatial configuration and its interplay with sustainable urban development, thereby influencing the formulation and execution of strategies.
This study aims to examine the spatial and temporal evolution of PLES in the Yangtze River Delta (YRD), a region characterized by rapid industrialization and urbanization. The growing overlap and irrational distribution of PLES pose significant challenges to regional integration and sustainable development. To address these issues, we propose a novel PLES function scale, categorizing PLES into four distinct types: Ecological-Production Space (EPS), Production-Ecological Space (PES), Production-Living Space (PLS), and Purely Ecological Space (ES). Using coupled spatial autocorrelation analysis and the CA-Markov model, this study provides a comprehensive spatial analysis of PLES utilization in the YRD, aiming to uncover spatial development patterns and offer strategic recommendations for optimizing the spatial layout, which will contribute to sustainable urban growth and regional integration (Figure 1).
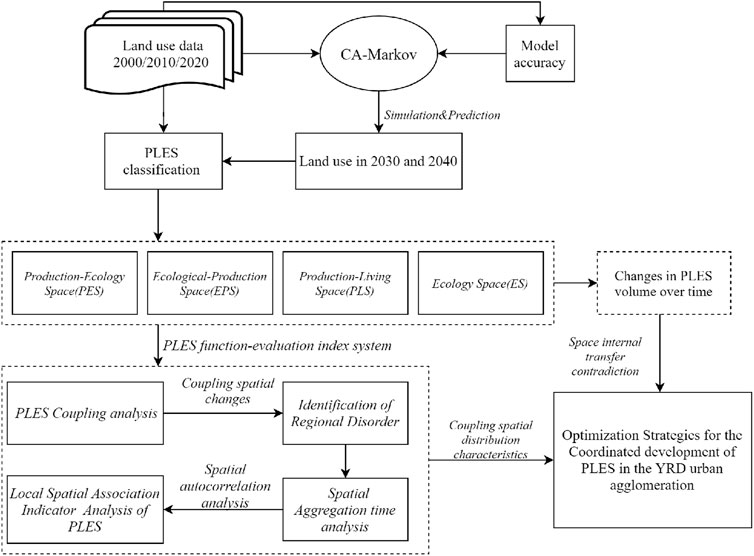
Figure 1. Research framework.
The following objectives direct our research: quantifying and analyzing changes in the number and distribution of PLES categories over time, evaluating the spatial patterns and coupling coordination of these spaces, and proposing actionable strategies based on our findings. By addressing these objectives, this study will improve our understanding of the complex interplay between urban development and environmental management in one of the world’s most dynamic regions.
The YRD region consists of four provinces: Jiangsu, Zhejiang, Anhui, and one city, Shanghai. This region spans 358,000 km2; and includes 41 cities. The YRD region, located in the lower reaches of the Yangtze River in eastern China and along the coasts of the Yellow Sea and East China Sea, has numerous ports (Figure 2). This region has been highly developed since ancient times and is characterized by a subtropical monsoon climate. With a population of approximately 230 million and an urbanization rate of over 75
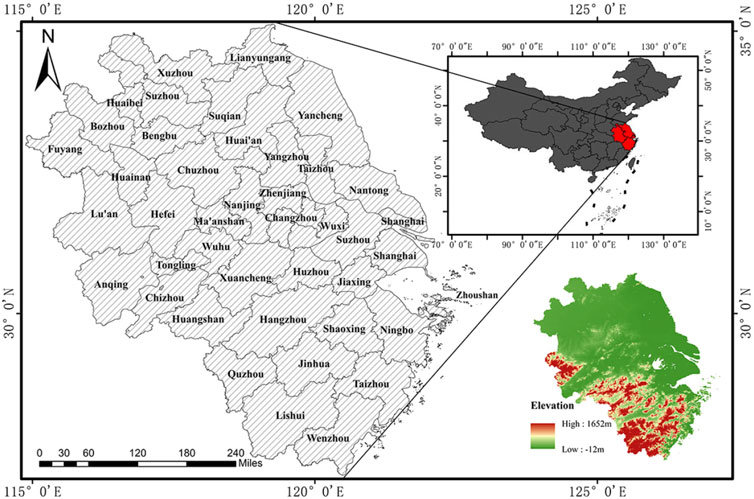
Figure 2. Overview map of the research area.
Since the early 21st century, large areas of arable land, wetlands, mudflats, and water bodies have been developed, resulting in significant changes in the number and distribution of various species. This development has intensified resource and environmental tensions in the region, with territorial space development reaching unsustainable levels. Urban expansion requires extensive land and natural resources, leading to significant encroachment of production and living areas on ecological spaces. This encroachment has caused ecological degradation, impeded economic development, and hindered regional integration efforts. To implement the strategy of ecological priority and green development, it is crucial to optimize the land space pattern and resolve spatial conflicts in the YRD region. Consequently, strict land use regulations must be enforced to govern development and optimize land resource utilization.
The land use and land cover change (LUCC) data for 2000, 2010, and 2020 were obtained from the Resource and Environment Data Center of the Chinese Academy of Sciences and the Geospatial Data Cloud Platform. The data had a spatial resolution of 30 m. These data were primarily derived from annual Landsat TM remote sensing images. The images were interpreted using a remote sensing monitoring classification system, which categorizes land use into six main categories: arable land, forest land, grassland, water areas, urban and rural industrial and residential land, and unused land. The accuracy of the interpreted data exceeded 90
Moreover, the relationship between LUCC data and remote sensing data is critical, as remote sensing images serve as the foundational data source for LUCC analysis, enabling accurate and consistent land use classification across different periods. These datasets were processed using ArcGIS 10.7 software to construct a fundamental database of the PLES spatial land patterns in the YRD region. All vector data were converted to surface grids in GCS WGS 1984, yielding 30
Given that PLES encompasses multidimensional characteristics, including spatial scale, functional complexity, and a broad range of effects, and that a single space often possesses one or multiple functions (such as the coexistence of production, living, and ecological functions), this paper, building on comprehensive academic research into the in-depth categorization of PLES, innovatively classifies the land resources of the YRD region according to a system of six major land categories. This detailed and systematic classification (as shown in Table 1) aims to provide a more precise and comprehensive analysis of the land use patterns in the region.
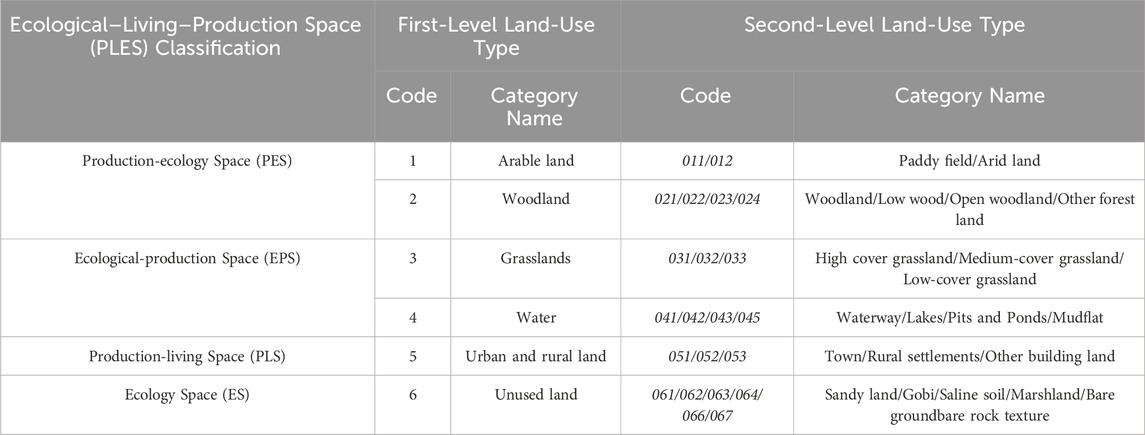
Table 1. PLES land use classification system for the YRD region.
Land use dynamics refers to the change rate of land use types and their spatial distribution within a given region and period (Liu et al., 2018) (Equation 1):
where k is the land motion attitude of the study area, Pa and Pb denote the area of land type in the first and last years of the study, respectively, and t represents the number of years in the study period. However, k could not sufficiently characterize the direction and amount of PLES transfer. Therefore, this study introduces a land transfer matrix. The land transition matrix (LTM) serves as a tool for describing land use change, recording the transition between different types of land over time and can be used to analyze the trend of land use change (Equation 2).
where P represents the land area, n represents the land use type, and I and j denote the land use type at the beginning and end of the study, respectively.
In this study, the CA-Markov model was used to simulate the PLES of the YRD in 2030 and 2040, based on the known PLES data of the YRD region in 2000 and 2020. The CA-Markov model is a mathematical model that describes the evolution of stochastic systems using meta-cellular automata (meta-CA) and Markov processes. In this model, each meta-cell can exist in one of a finite number of states (Sang et al., 2011), with the probability of transfer determined by the state of the adjacent beta cell to i (Equations 3, 4).
This study adopted a point-by-point acquisition strategy to reduce errors caused by the large time span. First, based on the land use data from 2000 to 2010, the land use data for 2020 were predicted, and the predicted data were then compared with the actual data. The model’s prediction accuracy reached at least 85
The functional indicators of PLES are based on the characteristics of the six major land types, and, drawing from existing research results (Bunce et al., 1996), the principle of multifunctional land type grouping was proposed. The PES, EPS, PLS, and ES were categorized according to their PLES utilization values. The production function (PF), living function (LF), and ecological function (EF) were assigned scores based on their PLES utilization values, with each land use type having its dominant function, and a full score of 5. For example, ES had ecology as its dominant function, and thus the ecological function was assigned a score of 5. Another example is PLS, where the dominant functions include production and living, in line with the composite nature of the land use. Therefore, both the production and living functions were assigned a score of 4 (as shown in Table 2).
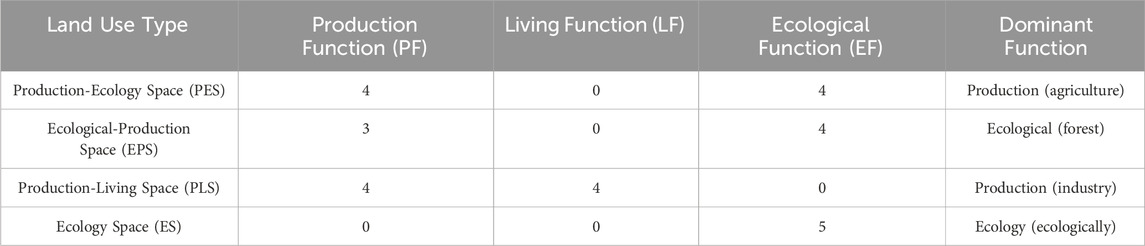
Table 2. PLES functional scoring scale.
Coupling coordination (CD) and coupling coordination degree (CCD) are physics-based concepts that quantify the interdependence between two entities, which describe the interactions and feedback between multiple subsystems and how they coordinate to achieve the overall goal (Shi et al., 2020). This model was used in this study to calculate the coupling coordination degree of PLES in the YRD region, according to the following Equation 5:
where CD is the coupling degree of PLES in the YRD region, with a value range of [0,1], and
where T represents the comprehensive coordination index, CCD is the coupling coordination of PLES,
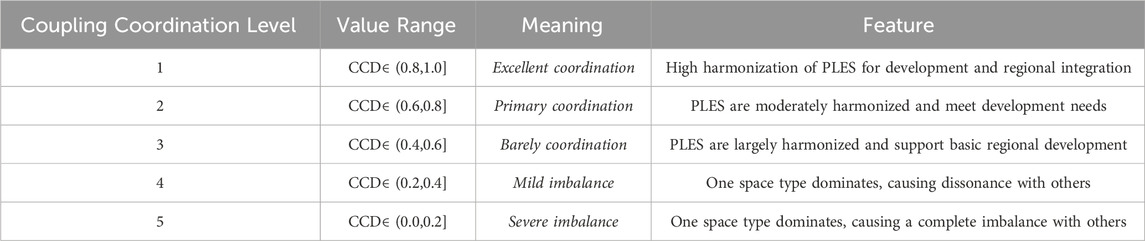
Table 3. Classification table of the CCD.
The spatial distribution of PLES has distinctive features due to the large time span and large area of the spatial regional extent. Moran’s I was used to analyze the spatial separation characteristics of CCD in the YRD region in the years 2000, 2010, 2020, 2030, and 2040, and their differences. Spatial autocorrelation is commonly used to evaluate correlations within similar regions, and is considered the most important factor when analyzing spatial correlation (Jackson et al., 2010). Moran’s I has been frequently employed in global spatial autocorrelation for spatial autocorrelation calculations, according to Equation 8:
Local spatial autocorrelation is the study of the degree of autocorrelation between local regions, and is typically computed by Anselin Local Moran’s I, according to Equation 9:
When measured between [0, 1], Moran’s I index indicates that geographic units with similar attributes in the geographic space are clustered together. When measured between [1, 0], Moran’s I index indicates that geographic units with dissimilar attributes in geographic space are clustered together. The I index of Moran is close to 0, and when Moran’s I index is close to zero, attributes in a geographic space are randomly distributed, and spatial autocorrelation does not exist.
In this study, a point-by-point method was employed to simulate land use for the years 2000, 2010, and 2020, using known land use data as a reference. The model’s performance was assessed by comparing the simulated land use data with the actual land use data from these years. The agreement between the simulated and actual data was quantified using the Kappa coefficient, which measures the level of accuracy and consistency. The Kappa coefficients for the years 2000, 2010, and 2020 were 0.982, 0.887, and 0.903, respectively, indicating a strong to very good agreement between the simulated and actual land use patterns. These Kappa values suggest that the simulation model is highly reliable. Additionally, the overall simulation accuracy exceeded 88
The Kappa coefficient ranges from −1 to 1, with values above 0.81 indicating very strong agreement, and those between 0.61 and 0.80 indicating strong agreement. The high Kappa values in this study underscore the model’s reliability and accuracy in replicating historical land use patterns. Additionally, the overall simulation accuracy exceeded 88
Comparing Figure 3; Table 4, it is evident that the PLS expanded by 11618.75 km2 reflecting a 37
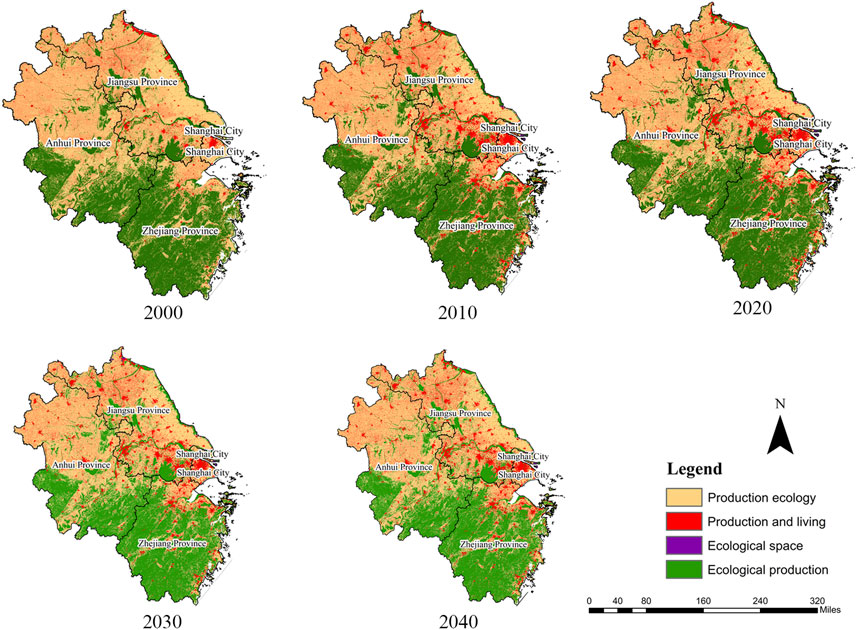
Figure 3. Changes in area of PLE space from 2000 to 2040.
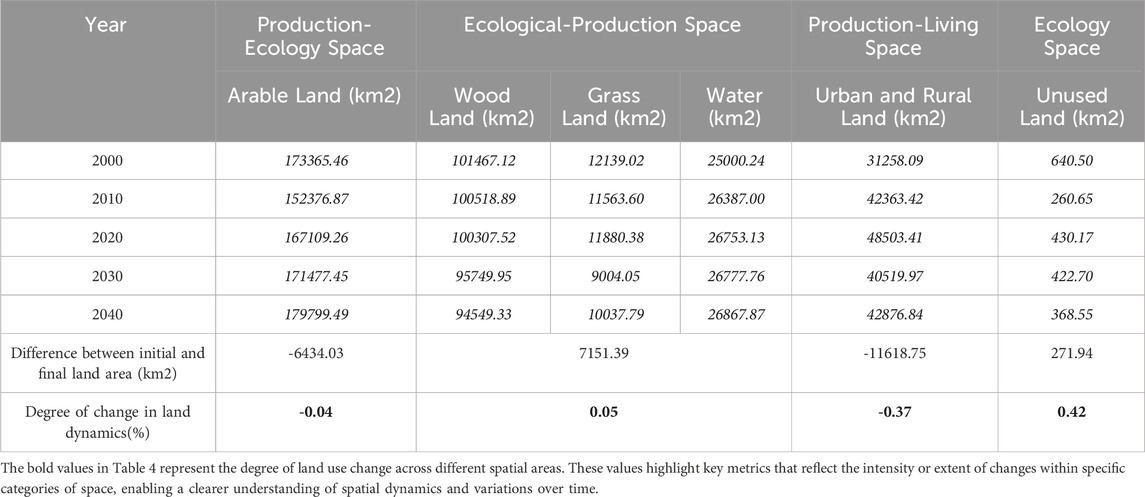
Table 4. Change in PLE area (km2) in the YRD area from 2000 to 2040.
To enable a comprehensive analysis of PLES dynamics over various time frames, the interval from 2000 to 2040 was segmented into five 10-year periods. As shown in Figure 4, urbanization and economic development from 2000 to 2010 resulted in a substantial expansion of PLS and a notable decline in PES. These changes led to significant ecological and environmental challenges. However, post-2010, with the national government’s intensified focus on land management, a substantial number of land policies were introduced and implemented. These measures effectively decelerated urbanization rates. Moreover, with the emergence of concepts such as ecological civilization, low-carbon cities, and green cities, government officials and urban planners increasingly focused on ecological construction and protection. Consequently, ES and EPS have maintained stability throughout the subsequent three periods. In summary, the most significant shifts in PLE space occurred primarily during the 2000–2010 period. After this initial phase, the magnitude of changes progressively stabilized, setting the stage for ongoing stable development in the future.
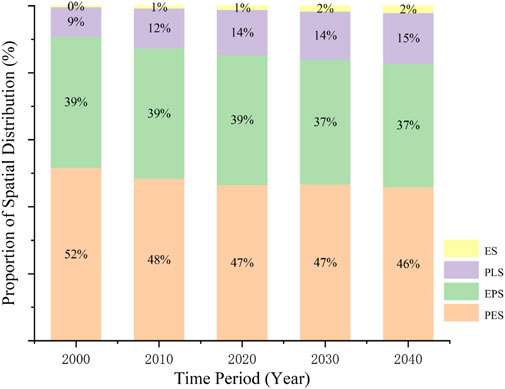
Figure 4. Percentage of PLE space area, 2000 to 2040.
To gain further insight into the direction and extent of PLE conversion, we created land transfer Sankey diagrams for each time period (Figure 5). In the early years, a substantial amount of ES and PES was converted into PLS to meet urban construction demands. However, in later years, the conversion rate slowed with the adoption of sustainable and high-quality urban development concepts. A modest amount of ES was consistently converted into EPS and PES across all periods, with the conversion volume fluctuating from 8.172 km2; in 2000–2010 to 57.75 km2; in 2030–2040, showing an upward trend. This indicates that urban planners and government agencies have increasingly prioritized ecological protection, integrated ecological concepts into urban design, and aimed to create more livable, healthy, and sustainable urban environments through relevant policies and planning adjustments.
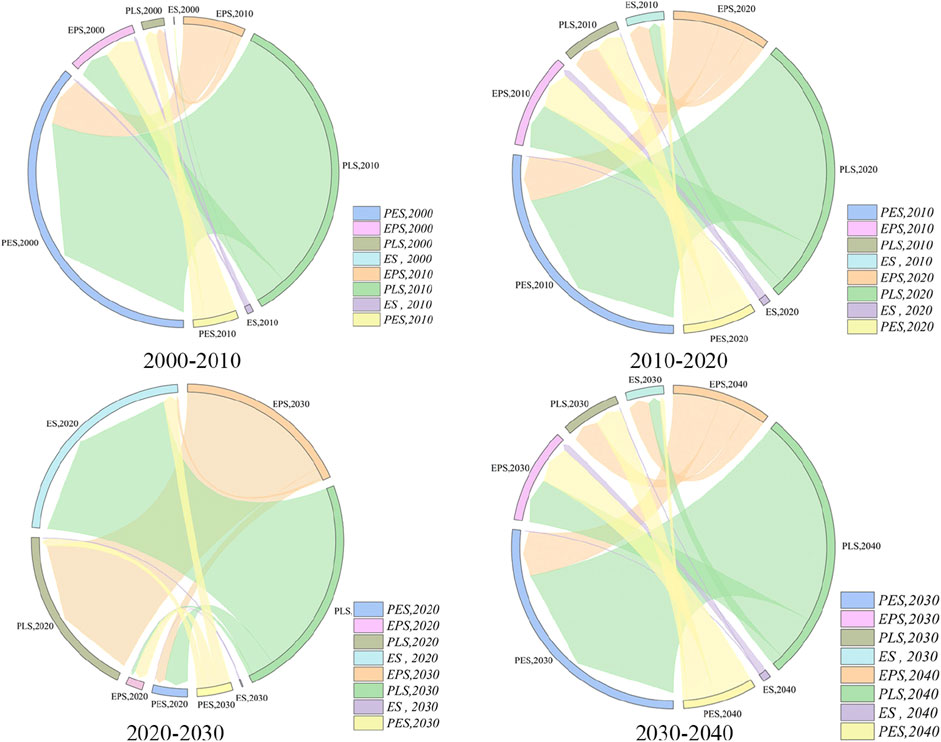
Figure 5. Land transfer chord diagram 2000–2040.
The CCD of PLES in the YRD region was evaluated from 2000 to 2040 utilizing a functional score table. During the study period, the CCD of PLES in the YRD region was initially characterized by mild dysfunction, which subsequently evolved to a state of marginal coordination. This progression denotes an upward trajectory from localized to more widespread conditions, with a spatial distribution pattern characterized by higher values in the east and lower values in the west, as depicted in (Figure 6). In the early part of the study period, most areas in Jiangsu and Anhui provinces demonstrated high coordination levels, achieving second-level coordination status. In contrast, much of Zhejiang Province and Shanghai Municipality recorded lower CCDs, indicating poor coordination and classified under third-level coordination. Notably, from 2000 to 2020, 73.1
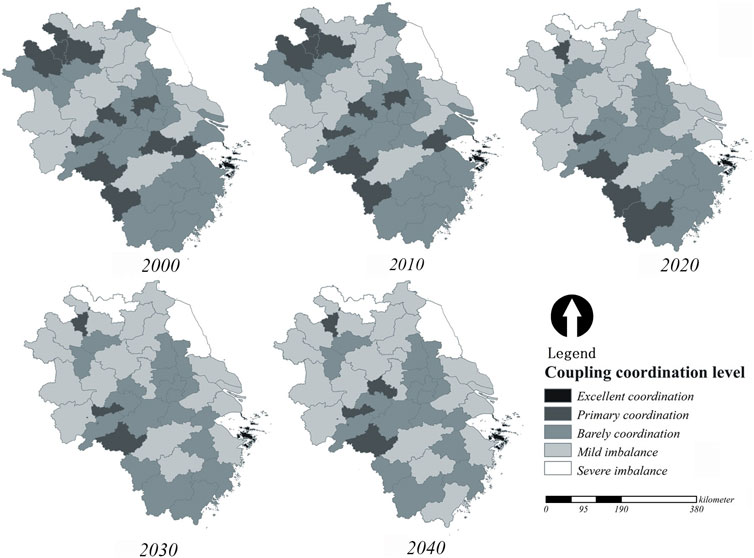
Figure 6. Changes in the spatial distribution of CDs and CCDs, 2000–2040.
To investigate the time series of functional coupling within the PLES in the YRD region, we generated box-and-line plots for each period to examine functional anomalies. Figure 7 illustrates that the peak CCD values during each time interval are recorded in Yancheng and Xuzhou, whereas the minimal values are noted in Tongling, Zhoushan, Zhenjiang, and Huangshan. The distribution indicates that cities with the highest CCD values are primarily located in the northern region. In contrast, those with the lowest values are in the central and southern areas. This is due to the extensive wetland regions in Yancheng and Xuzhou, with Yancheng designated as an “international wetland city.” These cities gain advantages from rigorous land and ecological management practices. This strict management fosters well-coordinated PLES functional coupling in these cities. In contrast, central cities with low CCD values experience poor PLES functional coupling due to uneven land distribution resulting from topographical variations. Zhoushan City, consisting of disjointed islands, encounters considerable difficulties in attaining integrated PLES functions.
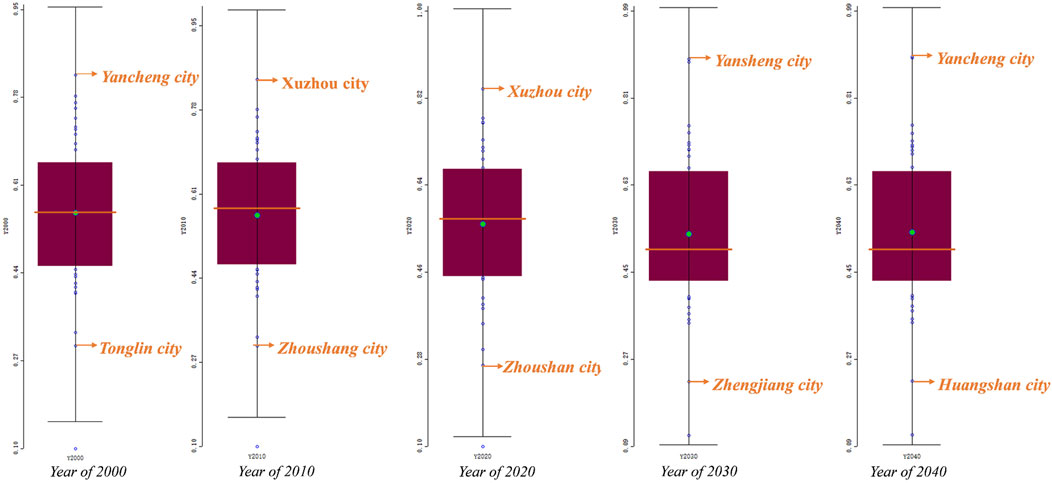
Figure 7. CCD Outliers boxplot.
The spatial autocorrelation of PLES functional CCDs in the YRD region from 2000 to 2040 was analyzed using Geoda software, as illustrated in (Figure 8). The global Moran’s I index demonstrated a consistently positive value throughout the study period, indicating a spatial positive correlation among regional PLES CCDs, reflecting a clustering effect within the YRD region. This index initially declined, followed by an uptick and another decline from 2000 to 2040. The spatial positive correlation was strongest in 2000, but weakened in 2020, reflecting a reduction in spatial clustering during that period. This pattern is primarily attributed to the varying development and urbanization processes across cities in the YRD region. From 2000 to 2020, as PLES functions developed, there was a reduction in the differences in coupling coordination between cities, leading to a downward trend in the index. However, from 2020 to 2040, changes in policy and urban development strategies led to an initial increase, followed by a subsequent decrease in the index.
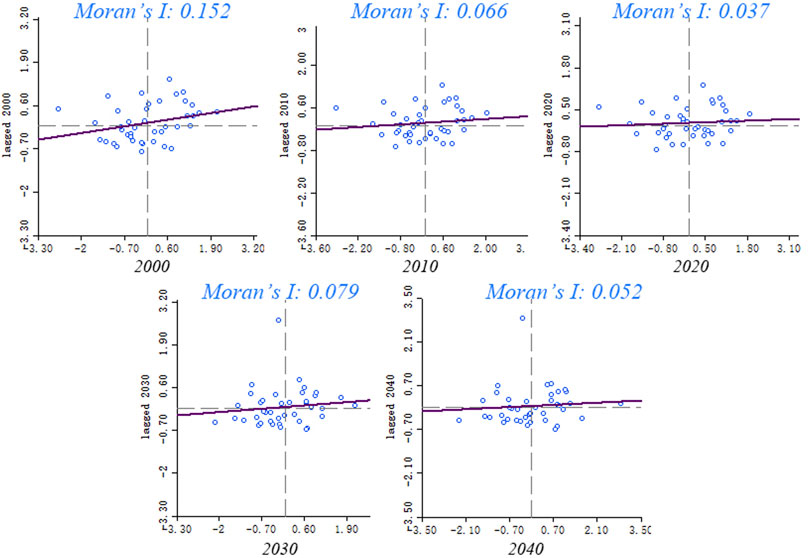
Figure 8. Change in Moran’s I index, 2000–2040.
To investigate the phenomenon of spatial clustering more thoroughly, we generated LISA maps to illustrate local spatial autocorrelation (Figures 9, 10). The clustering results predominantly demonstrate H-H and L-L types, indicating a notable degree of spatial variation within the YRD region. In general, the H-H cluster is concentrated in the northeastern part of the region, particularly in the cities of Lianyungang, Suqian, and Huai’an. These cities serve as hubs of elevated values, and their surrounding areas also exhibit similar value levels. In contrast, the L-L cluster is predominantly located in the west-central region, encompassing Tongling, Chizhou, and Wuhu cities, with the surrounding areas exhibiting relatively low values. This pattern indicates that coupling and coordinated development are more prominent in the northern part of the region compared to the central and southern areas. The distribution pattern may be described as a “northern agglomeration and southern dispersion,” suggesting a degree of spatial polarization. An analysis of the topography reveals that the northern YRD region is comprised of plains with extensive wetlands and ecological spaces. The plains and wetlands in the northern region constrain urban expansion, contributing to the prevalence of H-H clusters. Conversely, the hilly terrain in the central and western areas also hinders urban development, leading to a higher prevalence of L-L clusters. Additionally, the lower level of economic development hinders the implementation of environmental protection policies, leading to more L-L clusters.
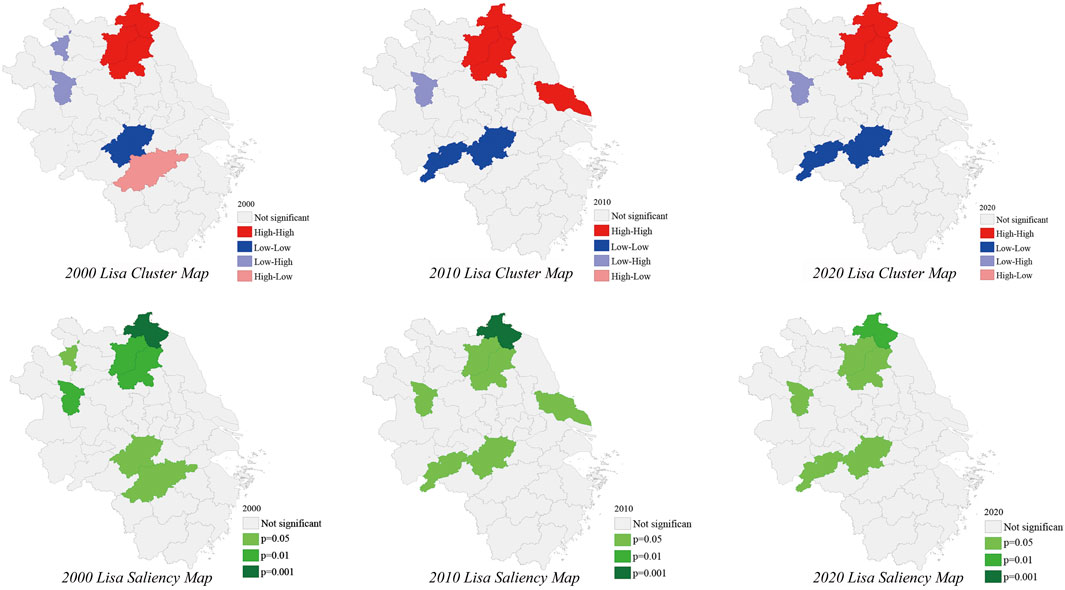
Figure 9. Lisa cluster distribution map from 2000 to 2020.
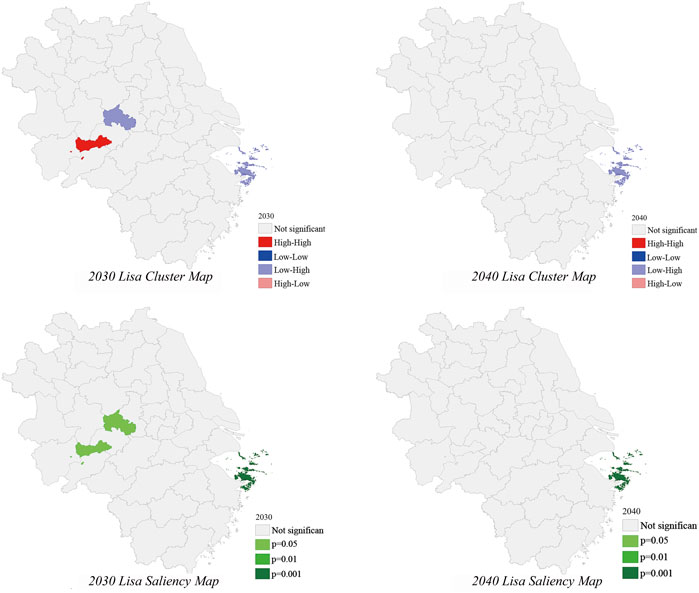
Figure 10. Lisa cluster distribution map from 2030 to 2040.
The proliferation of PLS in the YRD region during the study period impeded the robust development of the regional economy and society. Yang et al. (2020) made similar observations, concluding that the spatial proliferation of PLS hinders the functionality of rural PLES, thus obstructing socio-economic advancement. Moreover, Wu et al. (2021) examined PLES in the Guangdong-Hong Kong-Macao Greater Bay Area, which shares similarities with the YRD region in terms of geographical extent and economic conditions, and reached analogous conclusions.
These findings are consistent with observations in the YRD region, where rapid urbanization has significantly increased the proportion of secondary and tertiary industries. This shift has led to a steady decline in the output value of the primary industry. Concurrently, the growth of secondary and tertiary industries has created numerous employment opportunities in urban areas, drawing a significant portion of the rural population into the cities. To accommodate the increased production and living needs resulting from the population surge, this has caused the rapid and unregulated expansion of PLS (Fu et al., 2022b).
Additionally, Dong et al. (2021) emphasized in their study of land use conflicts in Jinan that the scarcity of land resources poses a significant challenge to sustainable regional development. Similarly, in the YRD region, the influx of people into urban areas has heightened the demand for various resources, particularly land. These resources are relatively limited, and the inability to effectively manage land supply and demand has inevitably hindered urban development. As a result, the unequal allocation of land resources has widened the divide between urban and rural regions, heightened social stratification, and amplified social inequities. This has resulted in intensified social conflicts, a deterioration in quality of life, and ultimately impeded healthy socio-economic development.
During the study period, the proportion of ES in the YRD region remained relatively stable, with only minimal fluctuations. This stability can be primarily attributed to the fact that ES often includes areas such as mudflats and hilly or mountainous regions, which are difficult and costly to develop. Despite this relative stability in area, the functionality of ecological spaces has declined, resulting in a reduction in the quality of ecological services and the loss of biodiversity. This, in turn, directly jeopardizes the safety of human habitats.
A substantial corpus of research has emphasized the significance of ecological functions in urban development. For example, Ollerton (2017) explored the importance of ecological functions within urban ecology, while Brown and Kliskey, (2008) and colleagues examined the impacts of coupled socio-ecological systems. Their findings suggest a positive correlation between social productivity and biological values.
Previous studies have demonstrated that ecological space in the YRD region is encountering considerable difficulties. As the core city of the YRD region, Shanghai catalyzes regional socio-economic development, frequently leading to the degradation of the ecological functions of adjacent cities. As a result, the simultaneous goals of economic growth and ecological preservation have not been balanced, hindering the establishment of a sustainable ecological economy.
As an essential urban resource, ecological space provides a variety of values and is integral to the urban ecosystem. Ensuring the stability of ecological space is vital to preserving its functions. The effective management and stabilization of ecological spaces can provide suitable habitats for diverse species, thus safeguarding biodiversity (Savage and Warde, 1993). Furthermore, it can enhance urban ecosystems, improve the residential environment, and elevate overall urban quality. Additionally, ecological space serves as a water conservation zone, regulates precipitation runoff, reduces urban flooding hazards, strengthens the city’s ecological resilience, and promotes the sustainable development of human society.
The coupling analysis and spatial autocorrelation findings indicate that the PLES functional CCD in the YRD region exhibits spatial unevenness, characterized by marked variations in coordination levels and substantial regional disparities. The coordination of PLES functions is higher in economically developed coastal regions, whereas it is poorer in non-coastal and some inland regions with weaker economic development. Notably, Shanghai exhibits lower coordination compared to surrounding regions, which is attributed to spatial imbalances arising from higher urbanization levels and a larger share of PLS. The coupling coordination is better in the eastern coastal regions compared to the western inland regions. This disparity pertains to the diminished impact of urban agglomerations and the developmental divide among areas.
Extensive research has been conducted to address the issue of developmental imbalance. Unbalanced economic development is widely recognized as a principal cause of regional development disparities (Van and Ushakov, 2020). For instance, Etherington and Jones (2009), Savage and Warde (1993), and others have analyzed the consequences of unbalanced spatial development and concluded that it leads to uneven income distribution, which triggers social conflicts and hampers sustainable societal development. Secondly, excessive reliance on resource development and neglect of environmental protection in some regions have caused ecological degradation, hindering sustainable economic development. Ultimately, uneven regional development adversely affects the realization of national development strategies and objectives, hinders inter-regional collaboration and resource allocation, and obstructs the establishment of a cohesive development framework.
Therefore, it is crucial to enhance internal collaboration, improve regional industrial linkages, accelerate the flow and sharing of resources, and leverage the radiative influence of central cities to address unbalanced development and reduce the development gap (Qin et al., 2024).
Numerous scholars have studied the spatial distribution and clustering trends of PLES. For instance, Fu et al. (2022b) analyzed PLES in China and identified a spatial trend of “high in the south and low in the north,” attributing this to significant ecological damage and population density. Building on this, Yang et al. (2020) recognized substantial economic disparities as a major contributing factor and advocated for differentiated sustainable development strategies.
The study period reveals a spatial clustering effect of PLES coupling coordination in the YRD region, marked by a “north clustering and south dispersing” trend. Compared to previous studies, the main factors contributing to this difference include topographic features as well as ES degradation. The northern part of the region is characterized by flat terrain, suitable for urban development, and is covered with extensive wetlands and other ecological spaces, resulting in predominantly H-H agglomeration areas. In contrast, the central and southern parts are mountainous and hilly with rugged terrain, making development challenging and resulting in predominantly L-L agglomeration areas.
Subsequent analysis utilizing the coupled coordination model indicates that the eastern region demonstrates markedly elevated coordination levels relative to the western region, illustrating a spatial pattern of “high in the east and low in the west.” This phenomenon can be ascribed to multiple factors: First, coastal cities exhibit significant economic development, elevated urbanization, and strong PLES governance and management capabilities. Second, due to its intricate topography, the western region encounters difficulties in PLES development and management. Lastly, the eastern region, primarily composed of central cities, benefits from substantial urban collaboration capabilities, resulting in enhanced collaborative governance.
As economic inequality persists, the agglomeration effect and spatial disparities in the YRD region are likely to exacerbate. This phenomenon hinders regional collaboration and development, obstructing the attainment of sustainable and balanced growth. Consequently, it is essential to formulate and implement policies and strategies to improve regional cooperation and address existing disparities, thus fostering coordinated and sustainable development throughout the region.
The connection between PLES and sustainable development is demonstrated by achieving a cohesive equilibrium among economic efficiency, social equity, and environmental conservation through scientific land resource management (Lin et al., 2020). Initially, optimizing the spatial distribution of production activities supports sustained economic growth, reduces environmental pollution, and boosts resource efficiency by appropriately positioning industrial, agricultural, and service sectors. Secondly, spatial planning aims to enhance the quality of life and social welfare by thoughtfully allocating residential areas, public amenities, and transportation infrastructure. Furthermore, eco-spatial initiatives focus on protecting the natural environment and providing ecosystem services such as improving air quality and managing water resources, which are crucial for environmental sustainability (Addanki and Venkataraman 2017). Effective integration of PLES is key to optimizing spatial configurations. The development of green and ecological corridors promotes the integrity of ecological networks, enhancing spatial multi-functionality and flexibility, and enabling the coexistence of human activities with the natural environment. As urbanization progresses rapidly, scientific spatial planning must address urban expansion and related spatial pressures by establishing urban growth boundaries to prevent sprawl and protect vital farmland and natural areas (Duan et al., 2021). Inter-regional coordination is crucial for achieving sustainable development on a larger scale, requiring collaborative planning and management of productive, residential, and ecological spaces across regional boundaries.
Despite advances in PLES theory and its application, challenges persist in evaluating the sustainability impacts of spatial configurations and implementing effective strategies across different policy and economic contexts (Jiang and Liu, 2020). This gap primarily stems from a disconnect between theory and practice in applying PLES, requiring adaptations to the specific economic, social, and environmental characteristics of each region, thereby increasing the complexity of the research. Additionally, PLES research necessitates an interdisciplinary approach involving urban planning, environmental science, and economics, which demands diverse knowledge bases and efficient collaborative frameworks (Zhang and Zhu, 2015). Empirical research faces challenges due to the lengthy duration of case studies and regional variations, which limit the generalizability of findings. Current methodologies may not fully capture the complex impacts of PLES implementation. While technologies like GIS and remote sensing provide powerful tools for spatial analysis, their application in policymaking and planning presents significant challenges. To gain a deeper understanding of the specific impacts and potential benefits of PLES in sustainable development, future research must prioritize methodological innovation, interdisciplinary collaboration, and expanded empirical investigations.
Policy guidelines, national strategies, and regional development objectives influence socio-economic development and dictate the trajectory and speed of PLES evolution. Effective land use policy is essential for the coordinated development of PLES and is a pivotal element in attaining sustainable development goals in China (Lin et al., 2022; Liang et al., 2022). This paper consolidates prior research and incorporates land use forecasts for 2030 and 2040, utilizing the CA-Markov model to recommend strategies and actions consistent with future development trajectories. The predictive model suggests that coupling coordination in the YRD will enhance, regional disparities will diminish, and sustainable development capacity will be augmented. This study proposes three optimization strategies to achieve this objective:
First, the spatial configuration of PLES in the YRD region requires optimization (Duan et al., 2018). Geographic and economic factors have engendered considerable east-west disparities in PLES structure. Consequently, land development and utilization must conform to reasonable constraints, advancing ES, PES, and EPS judiciously while safeguarding urban ecosystems and environments. Urban development boundaries must be rigorously regulated in the western region to avert unrestrained expansion while protecting food security. In the eastern region, ecological protection principles and efficient urban land management mechanisms are crucial for facilitating high-quality urban development.
Secondly, the composite functions of PLES in the YRD region require examination. The distribution of PLES in the YRD is markedly concentrated and demonstrates composite functions. Consequently, stringent regulation of urban construction land necessitates the exploration of rational PLES composite functions. This involves leveraging the capabilities of these functions in urban environments, optimizing the coordination of PLES coupling, and enhancing spatial utilization efficiency to foster the sustainable development of PLES in urban agglomerations.
Finally, it is crucial to improve the collaborative capabilities of urban agglomerations in the YRD region and to utilize central cities as catalysts for regional development. The main aim of the integrated development strategy for the YRD city cluster is to promote regional coordination, with Shanghai acting as the central city in this initiative. Utilizing the central city’s impact on adjacent regions is essential for improving PLES coupling coordination. Relocating certain labor-intensive industries from Shanghai to the western region can promote its development and improve regional PLES coupling and coordination. Furthermore, bolstering internal collaboration, improving regional industry connections, and expediting resource sharing will facilitate the achievement of economic integration objectives in the YRD region.
This study developed a PLES classification system tailored to the urban and rural land use characteristics in China, utilizing the CA-Markov model and spatial autocorrelation analysis for a comprehensive quantitative analysis and long-term simulation of the dynamic evolution and coupling characteristics of PLES in the YRD region. The findings reveal spatial development disparities across the region and propose targeted optimization strategies and specific recommendations for its spatial configuration. These contributions significantly enhance the theoretical framework for regional development and land use, introducing innovative methodologies and providing a solid scientific basis for land management, spatial planning, and policy development in the YRD and similar regions. This work offers crucial practical guidance to promote sustainable and harmonious regional growth. Key findings of the study are as follows:
1. Changes in PLES: The most significant rate of land alteration occurred between 2000 and 2010, driven by urbanization and development. After 2010, the rate of land change decelerated. The volume of PLS experienced annual growth, while ES remained relatively stable. Further research indicates that the increase in PLS volume was primarily driven by EPS and PES.
2. Coupling Results: The coordination of PLES functions in the study area is insufficient. However, improvements in land management and economic conditions have gradually shifted from mild dislocation to minimal coordination. The development trend shows an upward trajectory, transitioning from a “point to surface” model, with a spatial distribution pattern of “high in the east and low in the west.
3. Spatial Autocorrelation Results:The CCD of PLES demonstrates positive spatial correlation over various periods, with fluctuations in Moran’s I index. The region exhibits spatial heterogeneity, primarily marked by H-H and L-L clusters. The distribution, shaped by topographical and natural geographic factors, shows a “northern agglomeration and southern dispersion trend.
4. Rational Allocation of PLES: The rational allocation of PLES is essential for promoting socio-economic and sustainable development. To enhance PLES, it is crucial to formulate policies and strategies for spatial optimization and management, refine the spatial configuration of PLES in the YRD to avert harmful land expansion, augment the composite functions of PLES to elevate land use efficiency, and bolster collaboration within urban agglomerations to promote regional sustainable development.
This study addresses deficiencies in previous PLES research, particularly in categorizing urban cluster size and function. It highlights the need for additional, comprehensive research across diverse scales and regions, particularly in urban agglomerations. The proposed methods and models offer a robust reference for analogous spatialtemporal analyses and forecasts in other regions.
While the study achieves high accuracy in simulating land use patterns, uncertainties remain in future projections due to model assumptions, input data precision, and the omission of certain dynamic driving factors, such as socioeconomic and climate influences. Incorporating these additional factors and improving input data quality in future research could further enhance the reliability of land use simulations.
Furthermore, the methods and conclusions presented in this study hold significant application potential. Future research could explore the adaptability of the PLES framework and simulation methods in other regions with varying land use characteristics. Expanding the scope to larger spatial scales or integrating it into crossregional planning and management could provide valuable guidance for optimizing territorial space and promoting sustainable development.
The original contributions presented in the study are included in the article/supplementary material, further inquiries can be directed to the corresponding author.
SL: Conceptualization, Data curation, Formal Analysis, Investigation, Methodology, Software, Supervision, Writing–original draft, Visualization, Writing–review and editing. YC: Funding acquisition, Project administration, Resources, Validation, Visualization, Writing–review and editing. QH: Funding acquisition, Resources, Writing–review and editing.
The author(s) declare that financial support was received for the research, authorship, and/or publication of this article. This work was supported by the National Natural Science Foundation of China (42201251), Zhejiang University of Science and Technology Youth Science Foundation (2023QN013).
The authors would like to gratefully acknowledge the reviewers and the members of the editorial team who helped to improve this paper through their thorough review.
The authors declare that the research was conducted in the absence of any commercial or financial relationships that could be construed as a potential conflict of interest.
All claims expressed in this article are solely those of the authors and do not necessarily represent those of their affiliated organizations, or those of the publisher, the editors and the reviewers. Any product that may be evaluated in this article, or claim that may be made by its manufacturer, is not guaranteed or endorsed by the publisher.
Addanki, S. C., and Venkataraman, H. (2017). Greening the economy: a review of urban sustainability measures for developing new cities. Sustain. Cities Soc. 32, 1–8. doi:10.1016/j.scs.2017.03.009
Bian, Z., Cheng, X., Yu, M., Cui, W., and Shi, S. (2016). Functional equilibrium analysis of the “three lives” space in the shenfu connecting belt. China Agric. Resour. Zoning 37, 84–92. doi:10.7621/cjarrp.1005-9121.20161213
Blayney-Dyett, T. (1980). The land use and urban development impacts of beltways (Department of Transportation).
Brown, G., and Kliskey, A. A. (2008). Social–ecological hotspots mapping: a spatial approach for identifying coupled social–ecological space. Landsc. urban Plan. 85, 27–39. doi:10.1016/j.landurbplan.2007.09.007
Buck, R. C. (1943). Partition of space. Am. Math. Mon. 50, 541–544. doi:10.1080/00029890.1943.11991447
Bunce, R. G. H., Barr, C. J., Clarke, R. T., Howard, D. C., and Lane, A. M. J. e. a. (1996). Land classification for strategic ecological survey. J. Environ. Manag. 47, 37–60. doi:10.1006/jema.1996.0034
Dong, G., Ge, Y., Jia, H., Sun, C., and Pan, S. (2021). Land use multi-suitability, land resource scarcity and diversity of human needs: a new framework for land use conflict identification. Land 10, 1003. doi:10.3390/land10101003
Du, W., Wang, Y., Qian, D., and Lyu, X. (2022). Process and eco-environment impact of land use function transition under the perspective of “production-living-ecological” spaces—case of haikou city, China. Int. J. Environ. Res. Public Health 19, 16902. doi:10.3390/ijerph192416902
Duan, W., He, B., Chen, Y., Zou, S., Wang, Y., Nover, D., et al. (2018). Identification of long-term trends and seasonality in high-frequency water quality data from the yangtze river basin, China. PLOS ONE 13, e0188889. doi:10.1371/journal.pone.0188889
Duan, W., Maskey, S., Chaffe, P. L. B., Luo, P., He, B., Wu, Y., et al. (2021). Recent advancement in remote sensing technology for hydrology analysis and water resources management. Remote Sens. 13, 1097. doi:10.3390/rs13061097
Etherington, D., and Jones, M. (2009). City-regions: new geographies of uneven development and inequality. Reg. Stud. 43, 247–265. doi:10.1080/00343400801968353
Fu, J., Bu, Z., Jiang, D., and Lin, G. (2022a). Identification and classification of urban ples spatial functions based on multisource data and machine learning. Land 11, 1824. doi:10.3390/land11101824
Fu, J., Bu, Z., Jiang, D., Lin, G., and Li, X. (2022b). Sustainable land use diagnosis based on the perspective of production–living–ecological spaces in China. Land Use Policy 122, 106386. doi:10.1016/j.landusepol.2022.106386
Gong, Z., Yuan, Y., Qie, L., Huang, S., Xie, X., Zhong, R., et al. (2023). Spatiotemporal differentiation and coupling coordination relationship of the production–living–ecological function at county scale: a case study of jiangsu province. Land 12, 2027. doi:10.3390/land12112027
Hong, T., Liang, N., and Li, H. (2023). Study on the spatial and temporal evolution characteristics and driving factors of the “production–living–ecological space” in changfeng county. Sustainability 15, 10445. doi:10.3390/su151310445
Hu, W., Wang, L., and Shu, M. (2016). Thoughts on the delineation of “three life spaces” in the preparation of urban and rural planning. Urban Plan., 21–26. doi:10.11819/cpr20160504a
Huang, J., Lin, H., and Qi, X. (2017). Research progress on three-life space for national land space optimization. Prog. Geogr. Sci. 36, 378–391. doi:10.18306/dlkxjz.2017.03.014
Jackson, M. C., Huang, L., Xie, Q., and Tiwari, R. C. (2010). A modified version of moran’s i. Int. J. Health Geogr. 9, 33–10. doi:10.1186/1476-072x-9-33
Jiang, M., and Liu, Y. (2020). Discrimination of spatial connotation and spatial scope of “three life”. Urban Dev. Res. 27, 43–48.
Kong, D., Chen, H., and Wu, K. (2021). The evolution of the evolution of Production-Living-Ecological space, eco-environmental effects and its influencing factors in China production-living-ecological space, eco-environmental effects and its influencing factors in China. J. Nat. Resour. 36, 1116–1135. doi:10.31497/zrzyxb.20210503
Li, C., and Wu, J. (2022). Land use transformation and eco-environmental effects based on production-living-ecological spatial synergy: evidence from shaanxi province, China. Environ. Sci. Pollut. Res. 29, 41492–41504. doi:10.1007/s11356-022-18777-z
Li, G., and Fang, C. (2016). Quantitative identification and analysis of urban ecological-productive-living space functions. J. Geogr. 71, 49–65. doi:10.11821/dlxb201601004
Li, J., Sun, W., Li, M., and Meng, L. (2021). Coupling coordination degree of production, living and ecological spaces and its influencing factors in the yellow river basin. J. Clean. Prod. 298, 126803. doi:10.1016/j.jclepro.2021.126803
Liang, T., Du, P., Yang, F., Su, Y., Luo, Y., Wu, Y. e. a., et al. (2022). Potential land-use conflicts in the urban center of chongqing based on the “production–living–ecological space” perspective. Land 11, 1415. doi:10.3390/land11091415
Lin, G., Jiang, D., Fu, J., Cao, C., and Zhang, D. (2020). Spatial conflict of production–living–ecological space and sustainable-development scenario simulation in yangtze river delta agglomerations. Sustainability 12, 2175. doi:10.3390/su12062175
Lin, G., Jiang, D., Fu, J., and Zhao, Y. (2022). A review on the overall optimization of production–living–ecological space: theoretical basis and conceptual framework. Land 11, 345. doi:10.3390/land11030345
Liu, C., Xu, Y., Sun, P., Liu, J., 刘佳, , Yueqing, X., et al. (2016). Progress and prospects of multi-functionality of land use research. Prog. Geogr. 35, 1087–1099. doi:10.18306/dlkxjz.2016.09.004
Liu, F., Qin, T., Girma, A., Wang, H., Weng, B., Yu, Z., et al. (2018). Dynamics of land-use and vegetation change using ndvi and transfer matrix: a case study of the huaihe river basin. Pol. J. Environ. Stud. 28, 213–223. doi:10.15244/pjoes/82900
Liu, J., Liu, Y., and Li, Y. (2017). Classification evaluation and spatial-temporal pattern analysis of “three living spaces” in China. J. Geogr. Sci. 72, 1290–1304. doi:10.11821/dlxb201707013
Liu, Q., Yang, D., and Cao, L. (2022). Evolution and prediction of the coupling coordination degree of production–living–ecological space based on land use dynamics in the daqing river basin, China. Sustainability 14, 10864. doi:10.3390/su141710864
Liu, Y. (2016). On the logical structure, check and balance mechanism and development principle of three life spaces. Hubei Soc. Sci. 36, 5–9. doi:10.3969/j.issn.1003-8477.2016.03.002
Liu, Y., and Zhang, X. (2020). Transformation and generalization of the concept of “yangtze river delta”: research of modern regional economy. J. Finance Econ. 46, 94–108. doi:10.16538/j.cnki.jfe.2020.04.007
Ollerton, J. (2017). Pollinator diversity: distribution, ecological function, and conservation. Annu. Rev. Ecol. Evol. Syst. 48, 353–376. doi:10.1146/annurev-ecolsys-110316-022919
Qin, J., Duan, W., Zou, S., Chen, Y., Huang, W., and Rosa, L. (2024). Global energy use and carbon emissions from irrigated agriculture. Nat. Commun. 15, 3084. doi:10.1038/s41467-024-47383-5
Sang, L., Zhang, C., Yang, J., Zhu, D., and Yun, W. (2011). Simulation of land use spatial pattern of towns and villages based on ca–markov model. Math. Comput. Model. 54, 938–943. doi:10.1016/j.mcm.2010.11.019
Savage, M., and Warde, A. (1993). Cities and uneven economic development. Urban Sociol. Capitalism Mod., 34–62. doi:10.1007/978-1-349-22991-8_3
Shi, T., Yang, S., Zhang, W., and Zhou, Q. (2020). Coupling coordination degree measurement and spatiotemporal heterogeneity between economic development and ecological environment–empirical evidence from tropical and subtropical regions of China. J. Clean. Prod. 244, 118739. doi:10.1016/j.jclepro.2019.118739
Van, H. T., and Ushakov, D. (2020). Analysis of economic imbalances under the conditions of regional agrarian markets’ integration. E3S Web Conf. EDP Sci. 175, 13034. doi:10.1051/e3sconf/202017513034
Wei, C., Lin, Q., Yu, L., Zhang, H., Ye, S., and Zhang, D. (2021). Research on sustainable land use based on production–living–ecological function: a case study of hubei province, China. Sustainability 13, 996. doi:10.3390/su13020996
Wu, J., Zhang, D., Wang, H., and Li, X. (2021). What is the future for production-living-ecological spaces in the greater bay area? a multi-scenario perspective based on dee. Ecol. Indic. 131, 108171. doi:10.1016/j.ecolind.2021.108171
Yang, W. C. (2020). Research progress on spatial planning for adaptation to climate change: content and methods. Prog. Plan. Res. 28.
Yang, Y., Bao, W., and Liu, Y. (2020). Coupling coordination analysis of rural production-living-ecological space in the beijing-tianjin-hebei region. Ecol. Indic. 117, 106512. doi:10.1016/j.ecolind.2020.106512
Yue, J., and Zhang, X. (2007). Discussion on land use classification in China. Arid. Zone Geogr. 26, 78–88. doi:10.3321/j.issn:1000-6060.2003.01.014
Zhang, H., Xu, E., and Zhu, H. (2017). Ecological-living-productive land classification system in China. J. Resour. Ecol. 8, 121–128. doi:10.5814/j.issn.1674-764x.2017.02.002
Keywords: production-living-ecological space, Yangtze River Delta, sustainable development, CA-Markov model, land use simulation, spatial layout optimization
Citation: Li S, Chen Y and Huang Q (2025) Spatial allocation and sustainable development: a study of production-living-ecological spaces in the Yangtze River Delta. Front. Environ. Sci. 12:1481186. doi: 10.3389/fenvs.2024.1481186
Received: 15 August 2024; Accepted: 20 December 2024;
Published: 09 January 2025.
Edited by:
Sérgio António Neves Lousada, University of Madeira, PortugalReviewed by:
Weili Duan, Chinese Academy of Sciences (CAS), ChinaCopyright © 2025 Li, Chen and Huang. This is an open-access article distributed under the terms of the Creative Commons Attribution License (CC BY). The use, distribution or reproduction in other forums is permitted, provided the original author(s) and the copyright owner(s) are credited and that the original publication in this journal is cited, in accordance with accepted academic practice. No use, distribution or reproduction is permitted which does not comply with these terms.
*Correspondence: Yong Chen, Y2hlbnlvbmdAenVzdC5lZHUuY24=
Disclaimer: All claims expressed in this article are solely those of the authors and do not necessarily represent those of their affiliated organizations, or those of the publisher, the editors and the reviewers. Any product that may be evaluated in this article or claim that may be made by its manufacturer is not guaranteed or endorsed by the publisher.
Research integrity at Frontiers
Learn more about the work of our research integrity team to safeguard the quality of each article we publish.