- 1School of Economics and Management, Xi’an University of Technology, Xi’an, China
- 2College of International Studies, National University of Defence Technology, Nanjing, China
- 3Yellow River Conservancy Commission, Zhengzhou, China
The ecological protection and high-quality development of the provinces along the Yellow River Basin have become a major national strategy in China. However, the synergistic development of the environment and industry within the basin still faces numerous challenges. Research studies on the synergistic evolution of industry with the environment are important to guide future development of the provinces. This paper combines panel data from eight provinces in the Yellow River Basin from 2011 to 2020, utilizes the Entropy Weight TOPSIS method to evaluate the growth index of subsystems, and then employs the L-V model to measure the interaction force and synergistic degree of the environmental and industrial subsystems in the provinces along the Yellow River Basin. Finally, it simulates the synergistic evolution paths of each province under different scenarios. The study shows that: 1. From 2011 to 2020, the synergy effects in the upper and middle reaches of the Yellow River Basin exhibited an upward trend, while the synergy effects in the lower reaches demonstrated a downward trend. In the upper reaches, the shift was from mild non-synergy to mild synergy, in the middle reaches from mild non-synergy to strong synergy, and in the lower reaches from strong synergy to strong non-synergy. 2. The development model in the upper and middle reaches transitioned from a weakly beneficial relationship between industry and the environment to a mutually beneficial symbiotic model. In contrast, the lower reaches shifted from a mutually beneficial symbiotic model to a state of weak industrial benefits and strong environmental harm, ultimately reaching a state where both industry and the environment mutually harmed each other. 3. According to the forecast of industrial and environmental synergy for the next 30 years, Qinghai, Inner Mongolia, Ningxia, and Shanxi provinces would benefit the most from adopting a mutually beneficial symbiotic model. However, as the development of a symbiotic model requires more external support and incurs higher costs, it is essential for each province to select its development model based on its own economic conditions. Based on this, this paper provides a theoretical basis for the development of the environment and industry in the provinces along the Yellow River Basin.
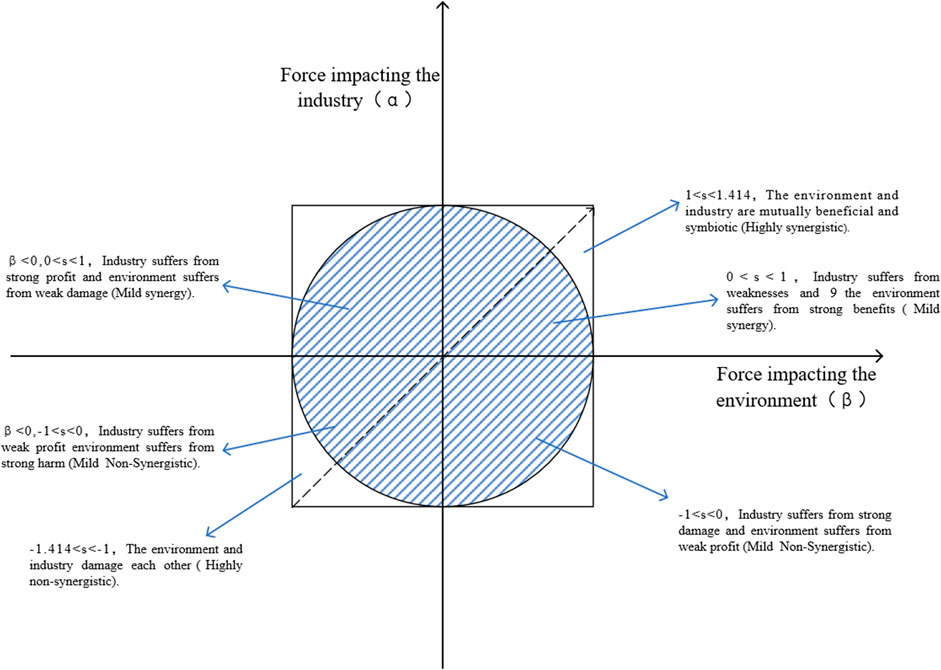
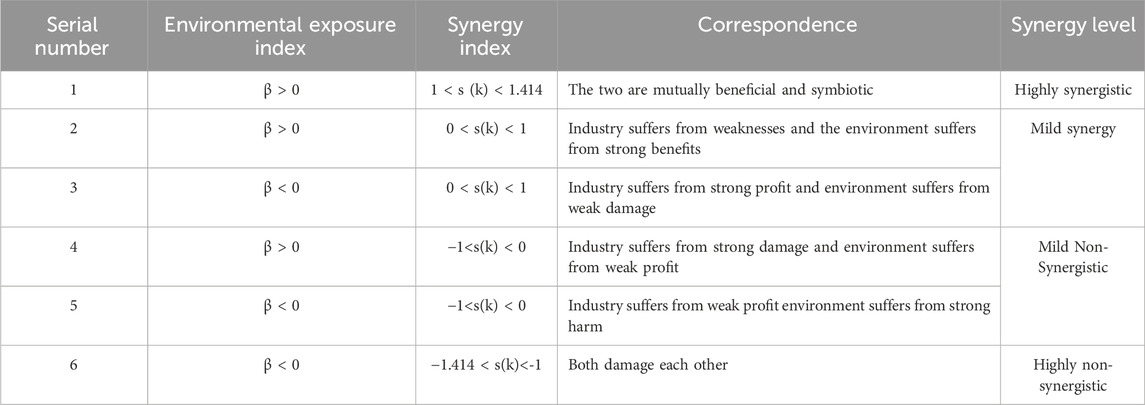
GRAPHICAL ABSTRACT | Explanation of the Classification of the Synergy Level Between Industry and Environment.
1 Introduction
Green development has garnered significant attention from major global organizations since its inception and has emerged as a prevailing trend through proactive implementation by various countries. In 2012, the World Bank underscored that green development necessitates environmentally sustainable and socially inclusive economic growth to facilitate the coordinated development of socio-economic and ecological environments (Cui et al., 2021) (Cui et al., 2021). The successful convening of the United Nations Climate Conference in 2021 further propelled the global “dual carbon” strategy, accentuating the critical role of green industries as a key driver of economic growth in this century. Consequently, nations worldwide have increasingly prioritized the advancement of green industries. The European Union reaffirmed its commitment to a green development agenda, emphasizing the reduction of fossil fuel consumption, the expansion of renewable energy generation, and the promotion of low-carbon energy solutions. Similarly, the United Kingdom announced a green industrial revolution plan, pledging £12 billion in national funding to enhance offshore wind capacity (Long et al., 2021) (Long et al., 2021). In this context, the joint development of environment and industrial sectors has become an urgent issue necessitating attention, sparking extensive scholarly discussion (Murphy and Gouldson, 2020; Asgharnejad et al., 2021) (Murphy and Gouldson, 2020; Asgharnejad et al., 2021). In recent years, the Chinese government has clearly stated its commitment to building an ecological civilization, emphasizing the ecological transformation of industries to achieve harmony between industry and the environment. However, China continues to confront numerous challenges in environmentand industrial development as conflicts arise between industrial layout and environment sustainability. Therefore, investigating the synergistic development of the environment and industry is of paramount importance for advancing China’s green development agenda.
In 2019, President Xi emphasized at the symposium on environment and high-quality development in the Yellow River Basin that these efforts have become a major national strategy (Sun et al., 2022). The Yellow River Basin is vital for both ecological security and socio-economic development. First, it acts as an important ecological barrier for China, housing several national parks and ecological function areas, and possesses abundant natural resources. Second, it is a key economic zone featuring significant agricultural production areas such as the Hetao Irrigation District that contribute over one-third of the nation’s grain and meat supply (Song, 2021). Additionally, the basin is rich in energy and raw materials, including coal, oil, natural gas, and non-ferrous metals. Third, the Yellow River Basin is a critical area for combating poverty. Its economic and social development lags behind that of the southeastern coastal regions, resulting in a higher concentration of impoverished populations. Therefore, promoting high-quality development in the Yellow River Basin and addressing issues such as housing and employment that affect local residents is an essential task for the provinces in the region. Despite progress, the Yellow River Basin faces significant challenges in environment and industrial development. These include a frag environment and a bottleneck in industrial transformation (Wei et al., 2020) (Wei et al., 2022). The conflict between resource development and environment has intensified as industrial production scales often exceed the environment’s carrying capacity (Feng et al., 2021) (Feng et al., 2021). Additionally, the prevailing industrial development model does not align with environment standards. Leading industries are heavily reliant on resource endowment, and this dependence, combined with large-scale inefficient resource exploitation, has severely damaged the environment (Gong et al., 2021) (Gong et al., 2022). Persistent issues such as water scarcity, conflicts between industrial layout and environmental, and ecosystem degradation have blurred the boundaries between the environment subsystem and the industrial development subsystem in the Yellow River Basin. Therefore, there is an urgent need for synergy between environment and industrial development in the region.
Given the gap between stated goals and actual conditions, a critical question emerges: What is the path for the coordinated development of the environment and industry in the Yellow River Basin? Their development is inherently evolutionary and exists within a complex synergistic system. The relationship between these two areas is not simply a division of labor; it involves dynamic interactions. Synergistic evolution emphasizes mutual enhancement and conflict mitigation between subsystems. In contrast, sustainable development focuses on the long-term viability and health of the entire system. Clarifying these differences will help readers better understand the unique contributions of your study within the context of sustainable development. Examining these interactions from a synergistic evolution perspective can offer deeper insights into the relationship between industrial and environmental development in the Yellow River Basin.
This study is grounded in synergistic theory and constructs a composite system for environmental and industrial development in the Yellow River Basin. It clarifies the mechanisms of synergistic evolution under both internal and external interactions. The entropy weight-TOPSIS method is utilized to evaluate the levels of industrial development, environmental, and environmental capacity. Additionally, the L-V model is employed to calculate the natural growth rates and interaction forces of industrial and environmental development, while also analyzing their synergistic effects. Furthermore, this study predicts the trends of synergistic development between the environment and industry in the provinces of the Yellow River Basin over the next 30 years under various development models.
2 Literature review
The theory of synergy emerged as a distinct discipline in the 1960s, when German physicist Haken (1977) (Haken, 1977) abstracted and generalized it from a set of laser theories. Haken’s seminal works, “Synergetics” (1977) and “Advanced Synergetics” (1983), laid the foundational theoretical framework for the field. The core focus of synergetics is to investigate how open systems can form ordered structures or exhibit unique organizational properties through synergistic interactions while exchanging matter and energy with their external environment. Building upon Haken’s framework, subsequent scholars have further refined and expanded the definition of synergistic development. For instance, Mattessich (1992) (Mattessich, 1992) described synergy as “a mutually beneficial and positive relational pattern established by two or more organizations to achieve common goals.”
In the field of economic management, many experts and scholars have also given the definition of synergistic evolution from different perspectives: Fox (1993) (Fox, 1993) believes that synergistic evolution is a way for one party to change the adaptive choices of the other party, which in turn affects the average adaptability of both parties; Malerba (2006) (Malerba et al., 2007) argues that synergistic evolution is the study of changes in interactions and adaptations between two or more subjects that coexist, emphasizing that synergistic evolution must have a continuous interactive causal relationship; Faber and Frenken (2009) (Faber and Frenken, 2009) argue that synergistic evolution also applies to policy making, and that subjects and environments are subject to co-evolutionary thinking.
In the realm of empirical research on synergistic evolution, current scholars focus on analyzing the composition and interconnections of subsystems within the synergistic system. They simulate the evolutionary processes of these systems using the analytical framework of the Haken model, incorporating established theories from physics, chemistry, sociology, and other disciplines (Weiss et al., 1995; Bressloff, 1995; Kelso, 2021) (Weiss et al., 1995; Bressloff, 1995; Kelso, 2021). Quantitative analyses of synergistic development often employ mathematical modeling techniques. A review of the literature reveals that scholars utilize various methodologies, including the chemical reaction approach to particle concentration (McGraw et al., 2024) (McGraw et al., 2024), social network analysis to assess associations among social entities (Gonzalez et al., 2014) (Gonzalez et al., 2014), evolutionary analyses of inter-species competition (Cooper et al., 2021) (Cooper et al., 2021), and synergistic modeling of composite systems. Ecological mathematical methods, particularly the Logistic model, are commonly applied (Sun et al., 2022) (Sun and Shuai, 2022). However, this model is primarily suited for predicting outcomes of biological competition experiments under controlled laboratory conditions, making it challenging to forecast interspecific competitive relationships in natural environments. Consequently, numerous improved models have emerged, such as the Hallam model (Hallam et al., 1983) (Hallam et al., 1983), the Smith model (Jaffe, 2017) (Jaffé, 2017), and the Lotka-Volterra model (Liu et al., 2022) (Liu and Zhao, 2022). The Lotka-Volterra interspecific competition model (LVM), which extends the Logistic model, is widely utilized in ecological studies. Originally designed to describe interactions among biological populations, the L-V model is also well-suited for investigating the synergistic development of the environment and industry. For instance, industrial growth relies on natural resources, while environmental health is affected by industrial activities. This model effectively illustrates both competition and cooperation between environmental resources and industrial development. By adjusting model parameters, researchers can analyze the impact of various industrial activities on the environment and the reciprocal effects of environmental measures on industry. Compared with other models, the L-V model captures the dynamic interactions between the environment and industry, making it particularly suitable for describing the feedback mechanisms within complex ecological and economic systems. Therefore, this paper employs the L-V model to study the synergistic evolution of the environment and industry.
Currently, research on the synergistic development of the environment and industry is limited, with even fewer studies addressing their synergistic evolution. Most existing research focuses on the interactions between these two domains (Cole M. A., 2000; Gokmenoglu Ketc, 2015; Kyriakopoulou E. and Xepapadeas A., 2013) (Cole, 2000; Gokmenoglu et al., 2015; Kyriakopoulou and Xepapadeas, 2013). Regarding the impact of industry on the environment, scholars suggest that optimizing industrial chain structures and refining the division of labor can enhance the sustainability of regional economic development and improve environmental (Sauer et al., 2022; Bergendahl, 2018) (Sauer et al., 2022; Bergendahl et al., 2018). For instance, Cherniwchan J (2012) (Cherniwchan, 2012) demonstrated through a simple two-sector economic environmental model that changes in industrial structure, particularly industrialization, significantly influence sulfur emissions during the study period. Leeuw et al. (2001) (de Leeuw et al., 2001), using European cities as examples, empirically found that industrial agglomeration contributes to air pollution. In contrast, literature on the impact of the environment on industry primarily focuses on environmental regulation. Scholars argue that environmental factors stimulate industrial innovation and drive changes and upgrades in industrial structure (Sakr et al., 2011; Park et al., 2016) (Sakr et al., 2011; Park et al., 2016). For instance, Feng et al. (2022) (Feng et al., 2022) found that carbon trading policies can promote technological innovation, which in turn enhances regional industrial structures.
In summary, the existing literature on the synergistic development of the environment and industry is relatively limited. Few studies have thoroughly elaborated on the mechanisms of synergistic evolution or explored the deeper connotations of synergistic development between these two domains. Most research has primarily focused on the interaction between industry and the environment with few scholars conducting quantitative systematic measurements and analyses grounded in the concept of synergistic evolution. Additionally, existing studies often examine broader contexts, such as all of China or specific regions, while the Yellow River Basin remains underexplored. Given that the Yellow River Basin is a crucial watershed ecosystem and resource base in China, research on its synergistic development holds significant importance for advancing the industrial-environmental synergy in the country.
This article aims to expand the application of the L-V model by constructing a synergistic evolution model that incorporates variable industrial growth rates and environmental capacity coefficients. It empirically tests the dynamic processes of synergistic evolution between the environment and industry, offering a unique perspective on the complex evolution of these two systems. Furthermore, the study summarizes the symbiotic and differential changes observed in environmental and industrial evolution. Through simulation, we predict the future trajectories of industrial and environmental evolution in the Yellow River Basin under different scenarios, thereby providing a synergistic development model to facilitate positive interactions between the environment and industry.
3 Study area
The Yellow River Basin serves as a critical ecological security barrier in China. It encompasses 12 national key ecological function areas and nearly 100 water-related protected zones. Significant ecological barriers, including the Tibetan Plateau, the Loess Plateau-Chuan-Yunnan ecological barrier, and the Northern Sand Control Belt, are located within or traverse the Yellow River Basin (Wang and Gao, 2018) (Wang and Gao, 2018). As a vital ecological corridor linking the Qinghai-Tibet Plateau, the Loess Plateau, and the North China Plain, the basin plays a crucial role in maintaining ecological security for the North China Plain and the Yellow and Huaihai Plains. Moreover, the Yellow River Basin is China’s primary grain-producing region and serves as an important production base for grains, cotton, oil, and livestock products. It is also a key energy production area and a significant economic zone in the country (Wang et al., 2021) (Wang et al., 2021). In 2019, the total agricultural output value of the nine provinces and regions within the basin exceeded 2.15 trillion yuan, accounting for 33% of the nation’s total agricultural output for that year. The upper reaches are rich in hydropower resources, the middle reaches contain substantial coal deposits, and the lower reaches are endowed with oil and natural gas resources, collectively earning the basin the designation of China’s “energy basin.” Additionally, the Yellow River Basin holds an important strategic position for national unity and stability (Jiang et al., 2021) (Jiang et al.).
4 Research methodology and data sources
4.1 Research methodology
4.1.1 Entropy weight TOPSIS method
The entropy weight method is used to objectively determine the weights of evaluation indices based on the amount of information provided by each index. The smaller the entropy value, the larger the weight assigned. The TOPSIS method approximates the ideal solution by calculating the relative closeness through the positive and negative ideal solutions and their distances, and ranks the options based on the magnitude of the values. Compared to other evaluation methods, the advantage of the entropy weight-TOPSIS method lies in its full consideration of the importance of each attribute, avoiding the influence of subjectivity and uncertainty, thereby improving decision-making accuracy and reliability. Additionally, it can handle attributes with negative values, making it applicable in a broader range of scenarios. Referring to the studies by Korkmaz (2008) (Korkmaz, 2008) and Biswas et al. (2019) (Biswas and Sarkar, 2019), this paper adopts the entropy weight-TOPSIS method for comprehensive evaluation, with the specific steps detailed in Equations 1–11.
1. Standardization of indicator data:
Positive indicators:
Inverse indicators:
2. Solve for the proportion of each indicator in each sample, i.e., the variability of the indicator:
3. Calculate the information entropy of each indicator:
4. Determine the weights of each indicator:
5. Construct the weighted normalization matrix of evaluation indices:
6. Determine the positive ideal solution (
denotes the most preferred solution value and the least preferred solution value obtained by the jth indicator at the ith object.
7. Calculate the distance of the evaluation index from the positive and negative ideal solutions:
8. Calculate the relative closeness:
The relative closeness indicates the difference between the evaluated object and the ideal state, and its value is between 0 and 1.
4.1.2 Lotka-Volterra evolutionary model
The Lotka-Volterra model was first proposed by Lotka, an ecologist, and Volterra, a mathematician (Chiang, 2012) (Chiang, 2012), to model the relationship between populations in the biological world. Later, the Lotka-Volterra model was applied to social and economic systems, following the same logistic pattern. When two populations interact with each other, and taking into account the role of environmental influences, the growth equation for the symbiotic evolution of the two populations is Equation 12:
The population densities of the two populations in year t are
In this paper, we construct the L-V model of environment-industry with the Equation 13:
Where:
From (14) and (15), we get:
By solving the above L-V model, we can obtain α and β. From α and β, we can find the index: the industry is impacted by environmental forces
4.2 Indicator system and data sources
4.2.1 Indicator system construction
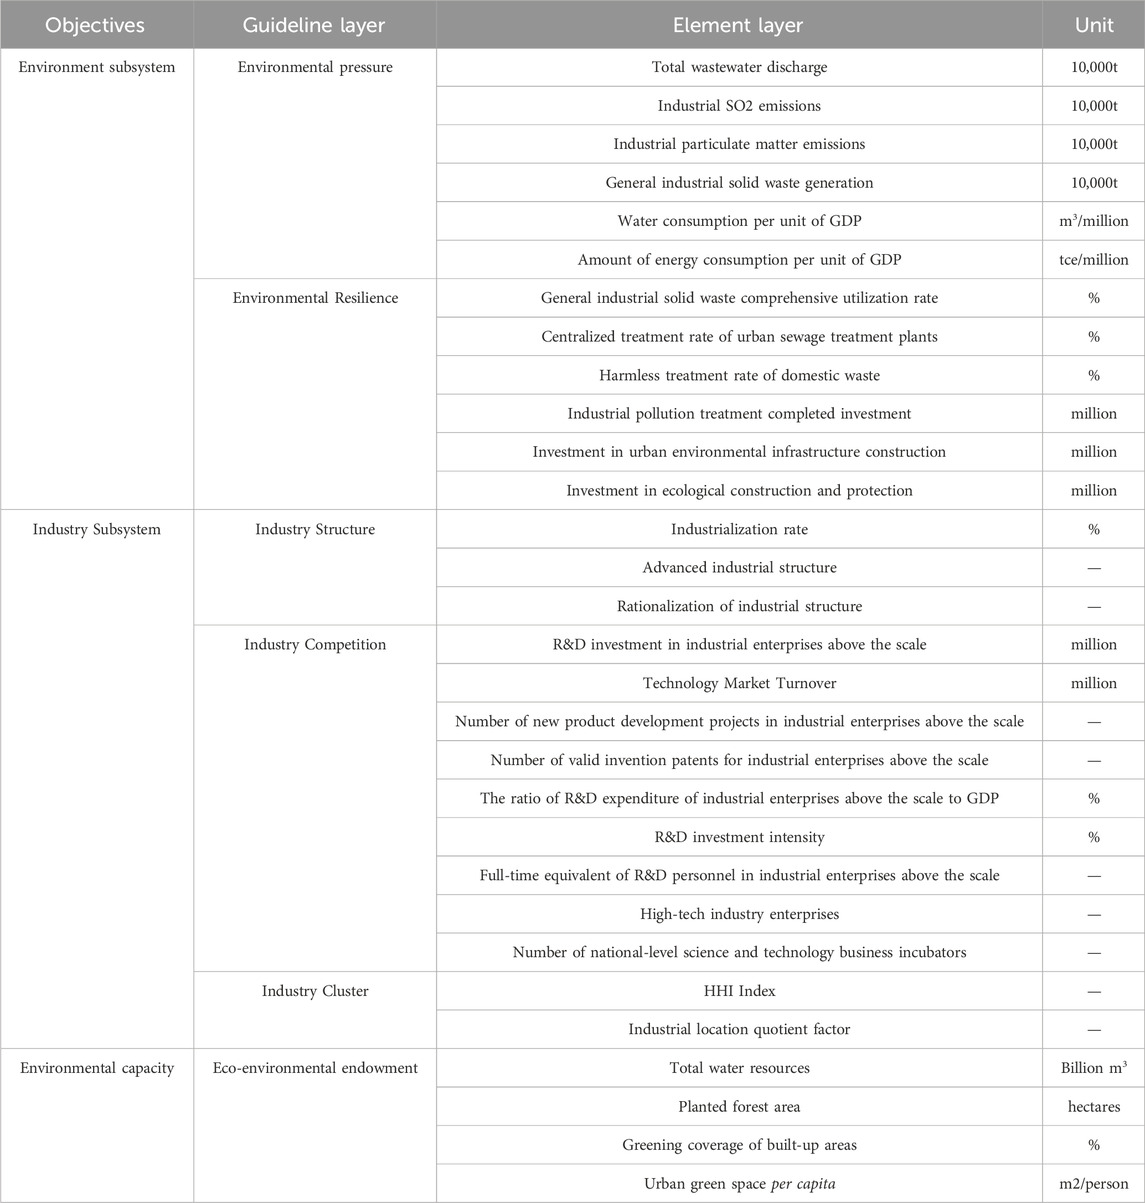
To calculate the basic indices, such as F(t), E(t), and C in the L-V model, it is essential to construct an index system for measuring the levels of industrial development, environmental, and environmental capacity within the industrial-environment composite system, as outlined in Table 2.
The rationale for selecting each element in this index system is as follows. when developing the indicator system for the environmental subsystem, two key dimensions must be considered: environmental pressure and environmental governance. Environmental pressure indicators include total wastewater discharge, which reflects the extent of industrial pollution in water bodies; industrial SO2 emissions, which indicate the levels of major air pollutants and their direct impact on air quality; industrial particulate matter emissions, which significantly affect human health and highlight the severity of air pollution; total industrial solid waste generation, which demonstrates the effects of solid waste on land and the ecological environment; water consumption per unit of GDP, which assesses the efficiency of industrial water usage; and energy consumption per unit of GDP, which reflects energy use efficiency and the sustainability of the economic structure. Environmental governance indicators include the comprehensive utilization rate of industrial solid waste, which measures the effectiveness of resource recovery and indicates the success of environmental management; the concentration rate of urban sewage treatment plants, which evaluates sewage treatment capacity and reflects the operational efficiency of treatment facilities; the harmless treatment rate of municipal solid waste, which ensures proper waste disposal to mitigate environmental burdens; investment in industrial pollution control, which reflects the execution and funding of governance policies; investment in urban environmental infrastructure, which affects the capacity and effectiveness of environmental governance; and investment in ecological construction and protection, which demonstrates the commitment to ecological preservation and aids in assessing long-term environmental management efforts.
The indicator system for the industrial subsystem focuses on three main areas: industrial structure, competition, and agglomeration. Indicators of industrial structure include the industrialization rate, which reflects the proportion of industry within the economy and the level of industrial development; industrial structure advancement, which assesses the transition to high-tech industries; and industrial structure rationalization, which analyzes the distribution of various industries to ensure effective resource allocation and coordinated development. For industrial competition, indicators such as R&D expenditure from large industrial enterprises reflect the emphasis on research and development and its direct impact on technological innovation. Other indicators include technical market transaction volume, which indicates the level of technology transfers and market activity; the number of new product development projects, demonstrating innovation capacity and market adaptability; the number of valid invention patents, representing innovative capabilities and technological barriers; R&D expenditure as a proportion of GDP, indicating national emphasis on innovation; R&D expenditure intensity, which assesses the depth of corporate investment in R&D; and the number of high-tech enterprises, revealing potential for industry competitiveness. Agglomeration indicators include the HHI index, which measures market concentration to gauge competition levels, and the industrial location quotient, which evaluates the rationality of industrial spatial distribution and agglomeration effects.
Environmental capacity is primarily determined by total water resources, which support both life and production and influence sustainable development; afforested area, which offers carbon sequestration benefits and helps mitigate climate change; green coverage in built-up areas, reflecting urban environmental quality and improving microclimates and air quality; and per capita urban park green space, which enhances residents’ quality of life and mental wellbeing. A comprehensive analysis of environmental capacity allows for the assessment of resource sustainability, providing scientific support for industrial development and environment, thereby promoting harmonious economic and environmental development.
4.2.2 Data source and processing
The Yellow River Basin traverses nine provinces and regions: Qinghai, Sichuan, Gansu, Ningxia, Inner Mongolia, Shaanxi, Shanxi, Henan, and Shandong. This study analyzes provincial data; however, since only Aba and Ganzi prefectures in Sichuan belong to the Yellow River Basin, their overall provincial impact is relatively minor. Therefore, to ensure the representativeness and validity of the research, the focus is primarily on the other eight provinces, which play a more significant role in the basin’s industrial development and ecological governance. This approach allows for a more accurate reflection of the synergies between the environment and industry within the Yellow River Basin.
This paper analyzes data from a 10-year period, specifically from 2011 to 2020. In the environmental subsystem, the indicators include total water resources, area of human-made forests, greening coverage rate of built-up areas, per capita green space in urban parks, completed investments in industrial pollution control, investments in urban environmental infrastructure, and investments in ecological construction and protection. For the industrial subsystem, data on R&D expenditure from large-scale industrial enterprises, technology market turnover, number of new product development projects from these enterprises, effective number of invention patents, R&D expenditure as a proportion of GDP, R&D expenditure intensity, and full-time equivalent R&D personnel are utilized. These data are sourced from the China Statistical Yearbook and local statistical yearbooks. Additionally, total wastewater discharge, industrial SO2 emissions, industrial particulate matter emissions, and total industrial solid waste generation are obtained from the China Environmental Statistical Yearbook. The comprehensive utilization rate of industrial solid waste, centralized treatment rate of urban sewage treatment plants, and harmless treatment rate of municipal solid waste are derived from the China Energy Statistical Yearbook. The number of high-tech enterprises is sourced from the China High-Tech Industry Statistical Yearbook, while the number of national science and technology business incubators is obtained from the Torch Center of the Ministry of Science and Technology of China.
5 Results and analysis
5.1 The results of measuring the composite system index of industry and environment in the yellow river basin
Based on the entropy weight-TOPSIS method, the results of measuring environment index E (t), industrial development level index F (t), and environmental capacity C (t) are shown in Table 3.
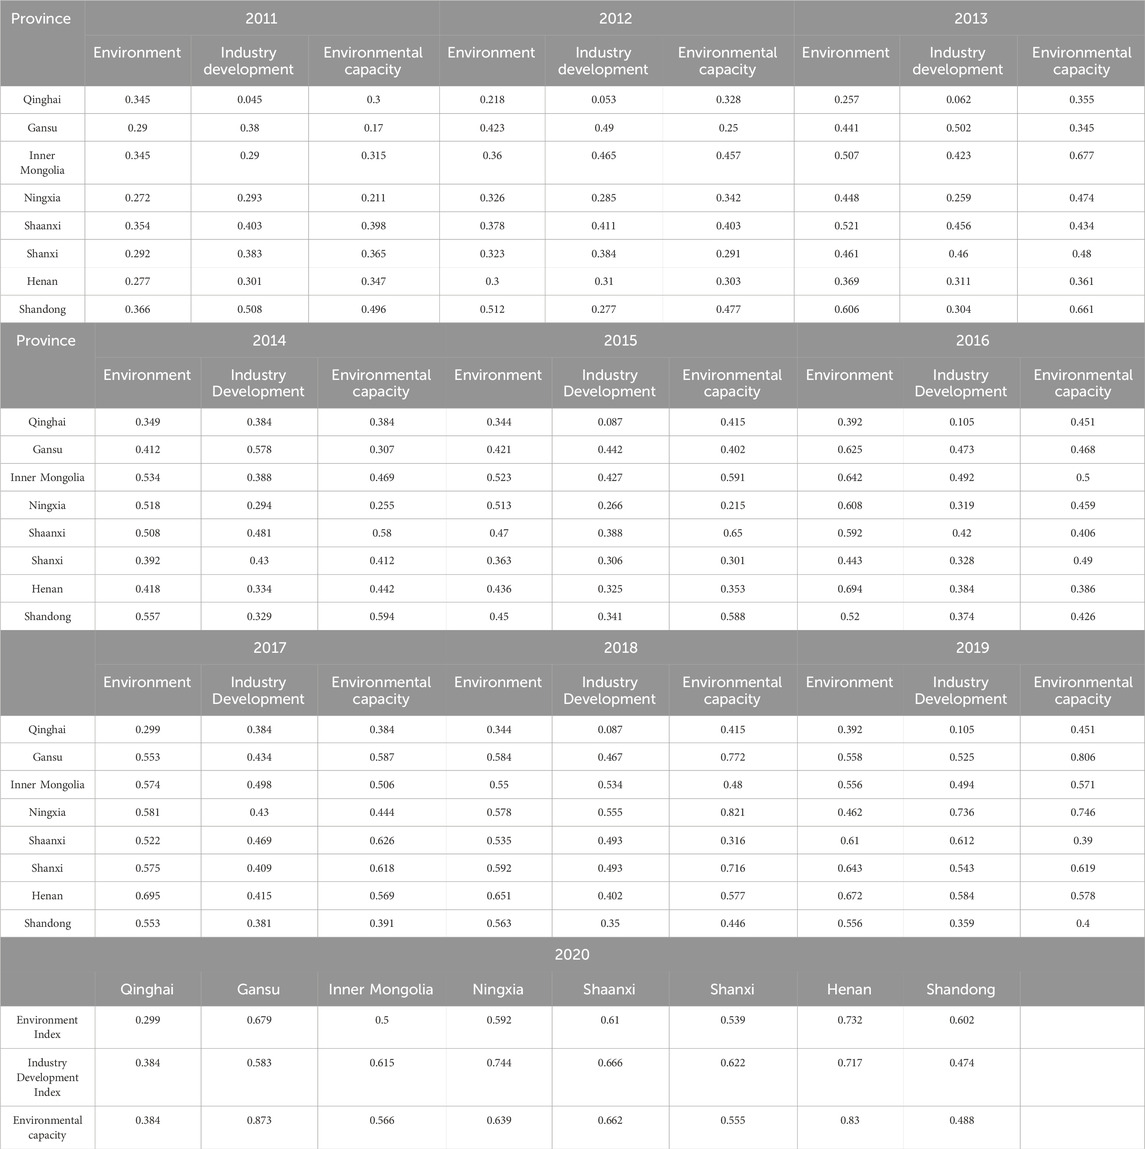
Table 3. Measurements of the basic indices of industry and environment in the Yellow River Basin from 2011 to 2020.
5.2 Results of natural growth rate and interaction of environmental system and industrial system
In this paper, we utilize Matlab and apply the Nelder-Mead Simlex method to solve the natural growth rate r1(t) of the environmental subsystem and r2(t) of the industrial subsystem by repeating the iterative calculations continuously, gradually approaching the optimal point (Table 4), and then bring in r1(t) and r2(t) and solve the interaction forces α and β (Table 5). Finally, we calculate the degree of synergy of each province in 2011–2020 through Equation 20 (Table 6).
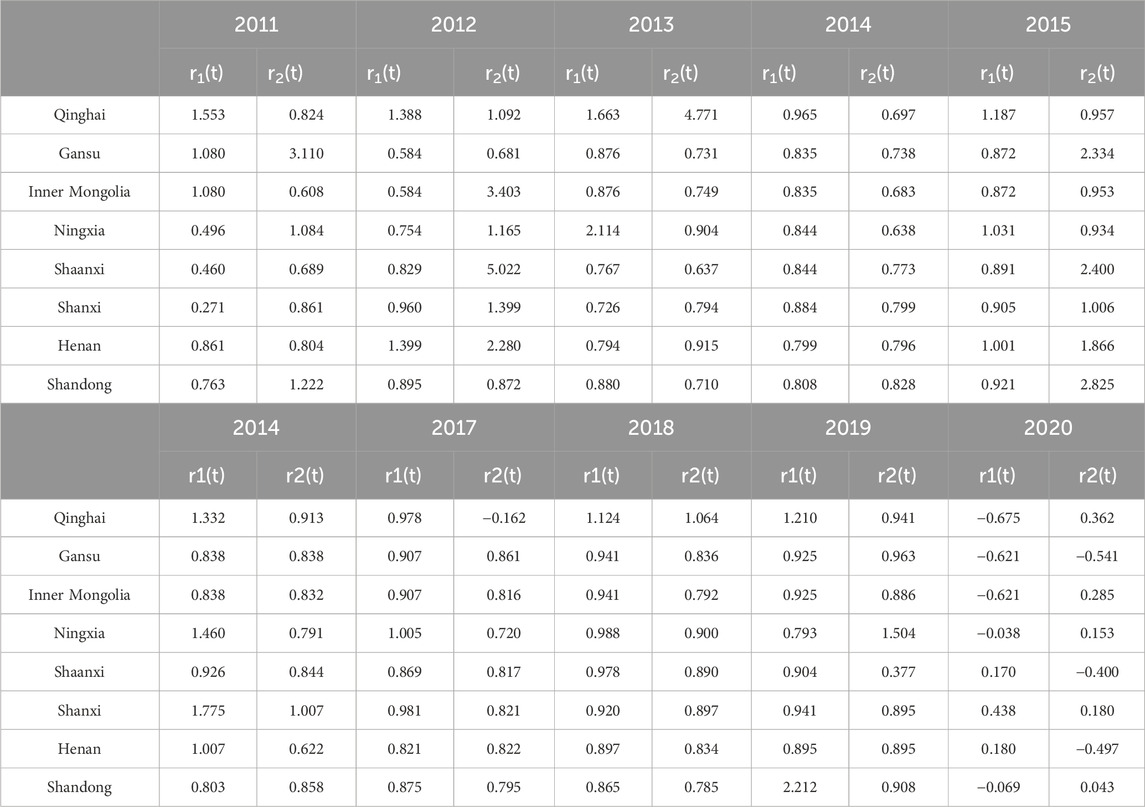
Table 4. Growth rate of subsystem development in the Yellow River Basin in the state of synergistic industrial and environmental development 2011–2020.
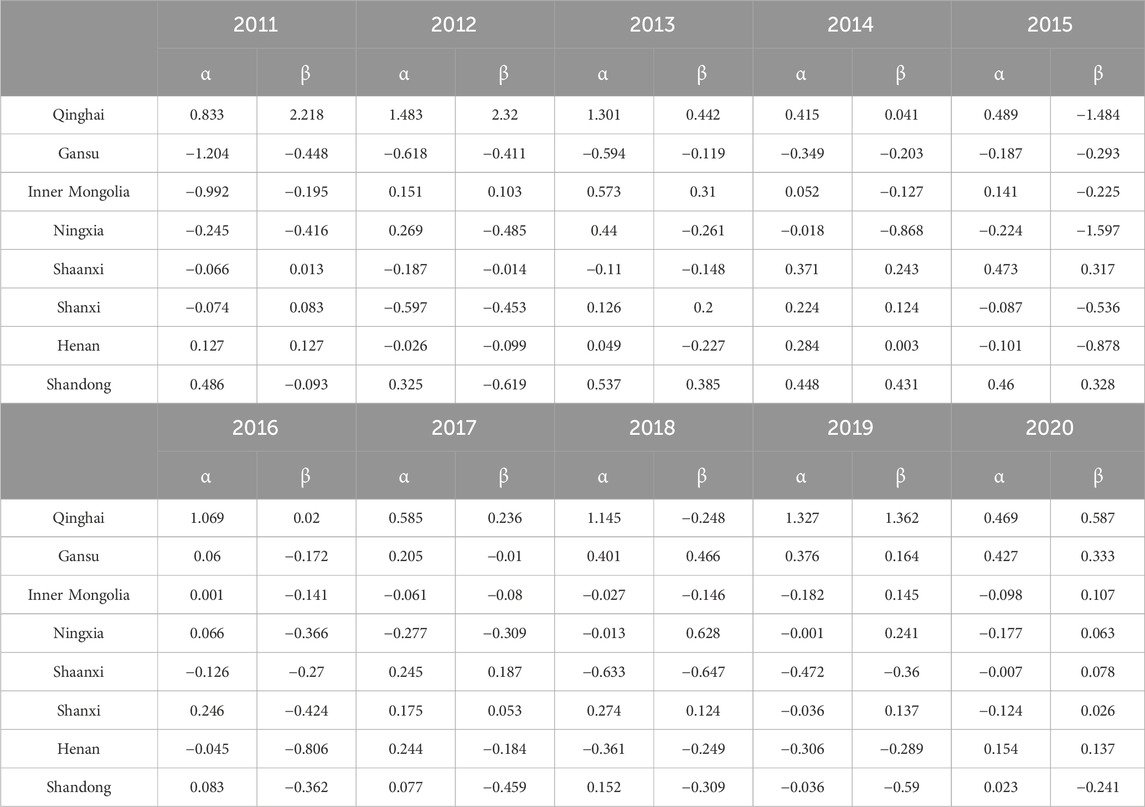
Table 5. Interaction forces between industry and environmental systems in the Yellow River Basin from 2011 to 2020.
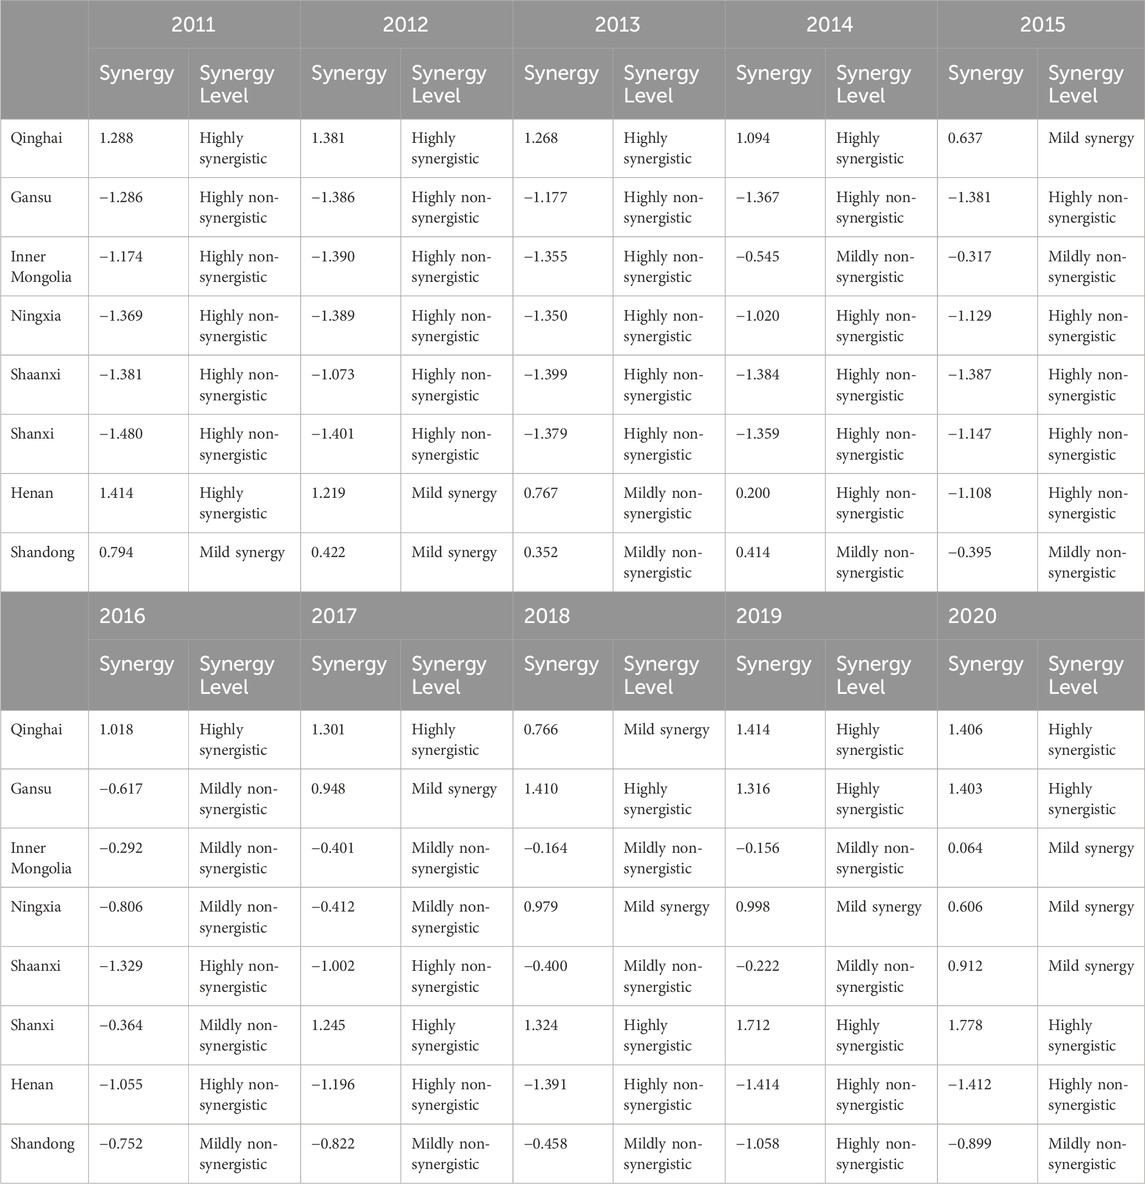
Table 6. Synergy between industry and environmental systems in the Yellow River Basin from 2011 to 2020.
In Qinghai Province, the average natural growth rate of the environmental subsystem is 1.0725, while the industrial subsystem exhibits an average growth rate of 1.1459. In Gansu Province, these rates are 0.7237 for the environment and 1.0551 for industry. Inner Mongolia shows an environmental growth rate of 0.9447 and an industrial growth rate of 0.8793. For Ningxia, the average natural growth rates are 0.7638 for the environment and 1.2049 for industry; in Shaanxi, they are 0.8297 and 1.2049, respectively. In Shanxi, the rates are 0.8801 for the environmental subsystem and 0.8659 for industry; in Henan, they are 0.8654 and 0.9337; and in Shandong, they are 0.8953 for the environment and 0.9846 for industry. The average annual growth rate of the environmental subsystem in the upper reaches of the Yellow River Basin is 0.87555, while the industrial subsystem grows at an average annual rate of 1.071225. In the middle reaches, the environmental subsystem averages 0.8549 while the industrial subsystem grows at 1.0354. In the lower reaches, the growth rates are 0.88035 for the environmental subsystem and 0.95915 for the industrial subsystem.
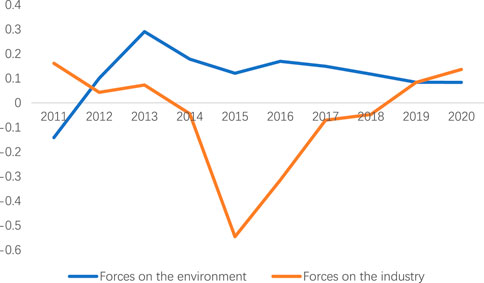
According to Table 5, the average force of the industry subsystem on the environment subsystem during the study period in the Yellow River Basin was 0.115, and the average force of the environment on the industry subsystem was −0.053.
From Figure 1, we can see that the force of the industrial system on the environmental system shows an increasing and then decreasing trend, and the force of the environmental system on the industrial system shows a decreasing and then increasing trend.
5.3 Analysis of measurement results
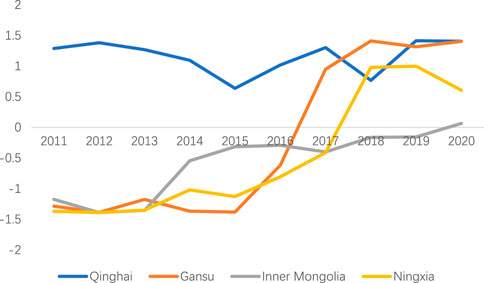
In terms of the time dimension, the four provinces in the upper reaches of the Yellow River Basin, except for Qinghai Province, show an overall upward trend (Figure 2). Combined with Table 6, it can be seen that the synergy between industry and environment in Qinghai Province has been in a synergistic state during the period of 2011–2020, and the change in the synergy degree is not significant from year to year. The synergy between industry and environment in Gansu Province is in an incremental state, and before 2016, it is in a highly non-synergistic state, and from 2016–2018, there is a great increase in the synergy, and it reaches a high synergy in 2018 and maintains. This is because that Gansu Province has been vigorously developing eco-industries since 2016 and has achieved certain results. Although the overall trend of industry-environment synergy in Inner Mongolia is on the rise, the increase is small, and by 2020, its synergy is at the lowest in the upstream provinces. It shifts from being highly non-synergistic to mildly synergistic, showing the largest increase between 2013 and 2014. The reason may be related to the fisheries ecological reform implemented in Inner Mongolia in 2013.
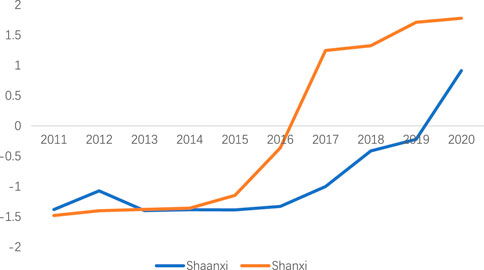
From Figure 3, we can see the two provinces located in the middle reaches of the Yellow River. In Shaanxi Province, industry and environment remained non-synergistic until 2020 and showed high non-synergy until 2017. This is mainly due to its role as a major coal and energy producer in China. The province’s industry relies heavily on heavy industries, with an unbalanced industrial structure, low competitiveness, and weak industrial agglomeration effects. Starting from 2015, Shaanxi Province created a characteristic industrial system and built industrial parks, so its synergy started to increase from 2016. Shanxi province was in a non-synergistic state until 2017, and from 2017, its industry and environment were in a synergistic state and reached a high level of synergy. As a typical coal province, Shanxi Province has been making great efforts to reform its industrial structure and has made great efforts to promote photovoltaic and wind power in energy consumption to reduce the consumption of traditional energy sources, and has achieved greater success.
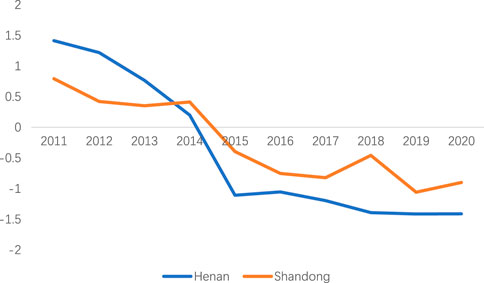
From Figure 4, we can see both provinces in the lower reaches of the Yellow River exhibit a decreasing trend in industry-environment synergy. In Henan Province, synergy decreased from high to high non-synergy between 2011 and 2020, and the largest drop occurred between 2014 and 2015. The main reasons are the weak foundation of primary industry and slow development, weak technological innovation ability of secondary industry, low industrial aggregation, resulting in insufficient development momentum, and low level of development of high-tech industry. The synergy between industry and environment in Shandong Province decreases from mild synergy in 2014 to mild non-synergy in 2020.
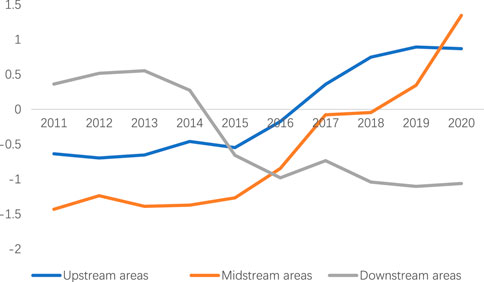
Combining Table 7; Figure 5 reveals a notable trend in the overall synergy within the Yellow River Basin. In the upper reaches, synergy has increased from −0.635 to 0.870, while the middle reaches have experienced an even more significant increase, from −1.06 to 0.947. Conversely, the lower reaches show a decline in synergy, dropping from 0.362 to −1.062. Since 2014, the environment’s impact on industry in the upper reaches has been positive, and both environmental and industrial forces have exhibited an upward trend. According to Table 1, the industrial development pattern was characterized by weak benefits alongside strong environmental harm, while from 2018 to 2020, a reciprocal symbiosis emerged between industry and the environment. In the middle reaches, the period from 2015 to 2016 was marked by weak favoring of industry and strong harm to the environment, shifting to reciprocal symbiosis from 2017 to 2020. In the lower reaches, a reciprocal symbiosis existed from 2011 to 2014; however, from 2014 to 2017, the industry was weakly benefited while the environment suffered strong harm. Lastly, from 2018 to 2020, the relationship shifted to one of mutual harm.
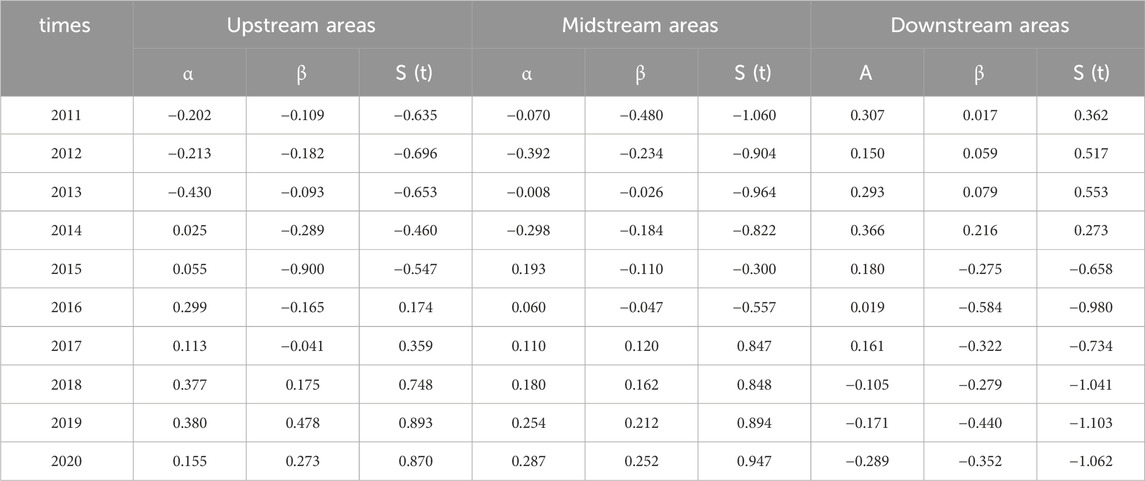
Table 7. Interaction forces and synergy between upstream, midstream and downstream of industrial and environmental systems in the Yellow River Basin from 2011 to 2020.
5.4 Simulation of synergistic evolutionary paths between industry and environment
To further investigate the influence of various interactions between industry and the environment in the Yellow River Basin on the evolution of these two systems during the process of synergistic evolution, this paper employs MATLAB software to simulate the interaction coefficients a21 and a12 between the environmental and industrial subsystems. This approach aims to elucidate the patterns of synergistic evolution across eight provinces. The parameters for both systems in 2020 are used as initial values, and a time span of 30 years is considered for the simulation. By adjusting the interaction coefficients a12 and a21, we simulate three distinct modes: the symbiotic mode, the environment-priority development mode, and the industry-priority development mode. The specific models employed are categorized in Table 8.
1. The mutual benefit symbiosis model posits that both systems can derive synergistic energy from one another during their development processes, enabling simultaneous growth of the environment and industry. While this mutual benefit facilitates development, the external environment imposes certain constraints on the system. After thorough consideration, the symbiotic model assigns a12 = 0.3 and a21 = 0.3, as illustrated in Figure 6.
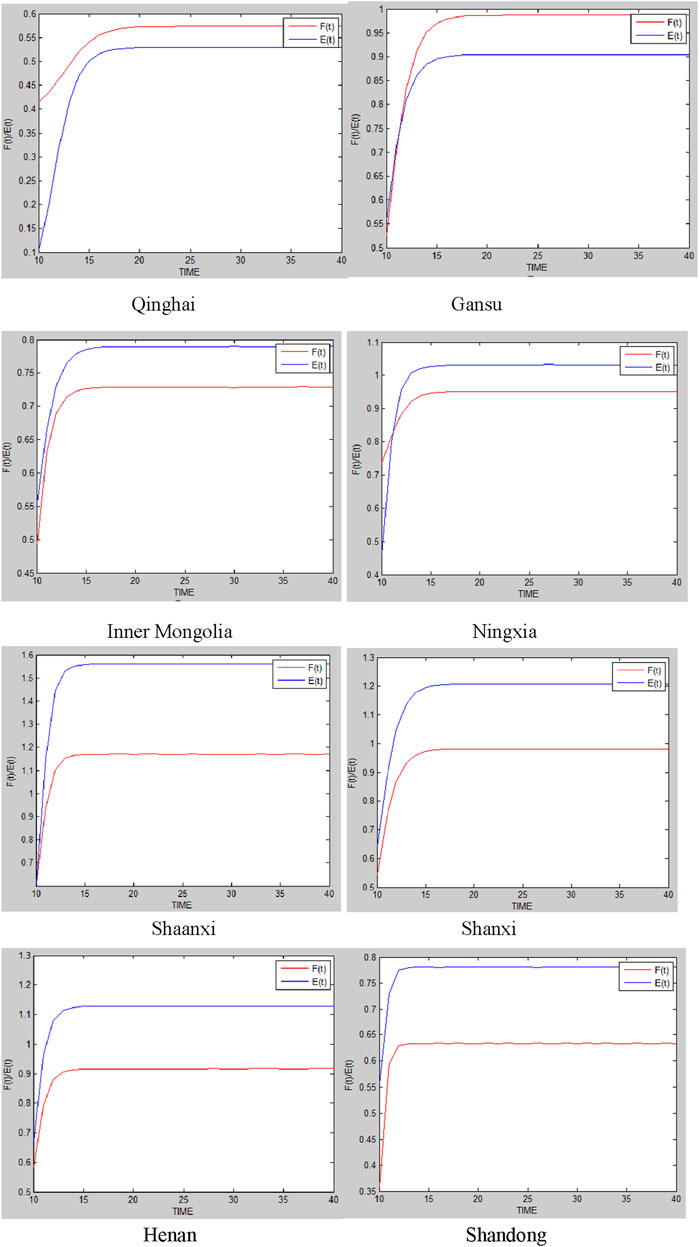
Figure 6. Development of industry and environment in symbiosis mode in the Yellow River Basin provinces, 2020–2050.
Under the reciprocal symbiosis model, Qinghai Province is projected to reach its optimum in 2030, featuring an industrial development index of 0.57 and an environment index of 0.52. Similarly, Gansu Province is expected to achieve its optimum by 2027, having an industrial development index of 0.99 and an environment index of 0.89, indicating that industrial development in both provinces will surpass environment efforts. Inner Mongolia is anticipated to reach its optimum in 2025, achieving an environment index of 0.79 and an industrial development index of 0.73. Ningxia is also expected to reach its optimum around 2025, having an environmental development index nearing one and an industrial development index of approximately 0.95. Shaanxi Province will attain its optimum in 2025, showing an industrial development index of 0.90 and an environmental development index of 1.15. Similarly, Shanxi Province is projected to reach its optimum in 2025, featuring an industrial development index of 0.95 and an environmental development index of 1.20. Both Henan and Shandong Provinces are expected to achieve their optimum by 2025, having an industrial development index of 0.90 and an environmental development index of 1.15. Shandong’s industrial development index is projected to be around 0.62, while its environmental development index is estimated at approximately 0.80.
2. Industry priority development mode focuses on enhancing industrial competitiveness and strengthening industrial clusters. During this process, a modern industrial system is established, and an industrial ecological development pattern takes shape. However, it also places a burden on the environment and leads to high resource consumption. Therefore, the value a12 = 0.5 and a21 = −0.1 is assigned. The specific situation in each province is shown in Figure 7.
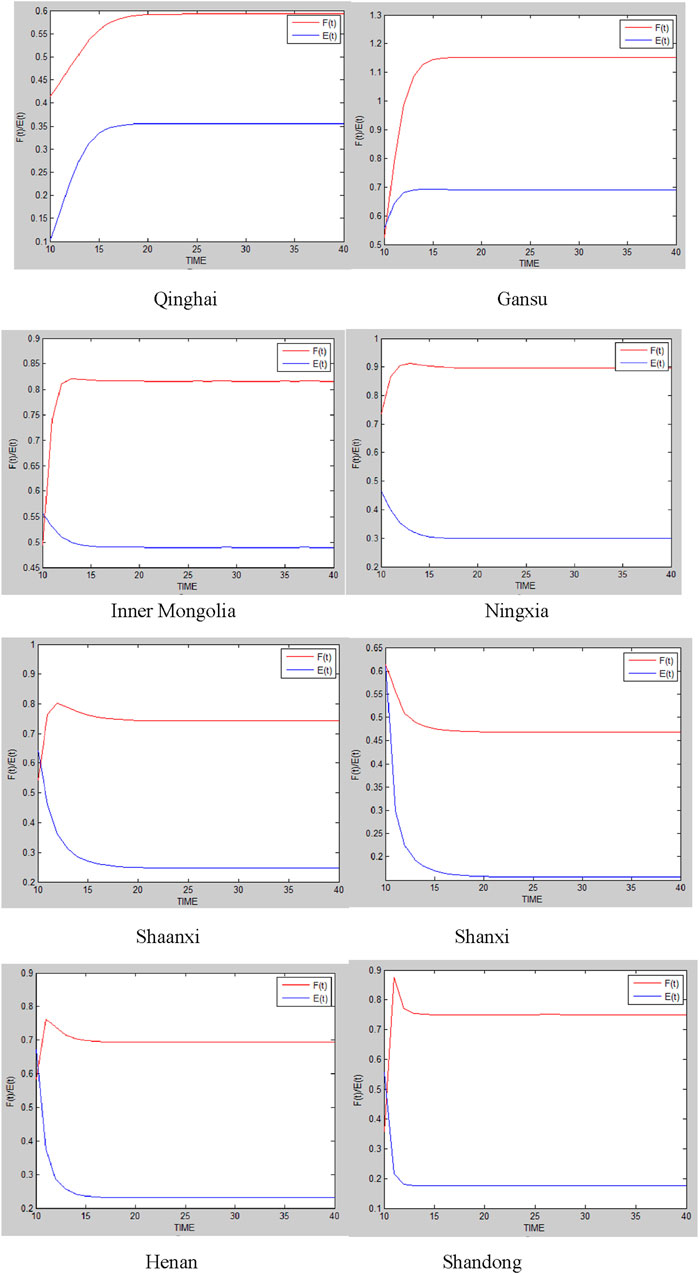
Figure 7. Industry and environment in the Yellow River Basin provinces in the industrial priority development model, 2020–2050.
Under the priority development mode of industry, both industry and environment in Qinghai Province show increasing development, and reach the optimal state around 2030, when the industrial development index is 0.6 and the environmental development index is 0.35. Gansu Province reaches the optimal state around 2025, when the industrial development index is 1.1 and the environmental development index is about 0.7. Inner Mongolia will reach the optimal state in 2025 with an industrial development index of 0.8 and an environmental development index of 0.5. Ningxia will reach the optimal state in 2025 with an industrial development index of 0.9 and an environmental development index of 0.3.
Shaanxi Province will reach the optimal state around 2025 with an industrial development index of 0.47 and an environmental development index of 0.05. Shanxi Province will reach the optimal state by 2025 with an industrial development index of 0.75 and an environmental development index of 0.25.
Henan Province will reach the optimal state around 2025 with an industrial development index of 0.7 and an environmental development index of 0.25. Shandong Province will reach the optimal state around 2025 with an industrial development index of 0.75 and an environmental development index of about 0.2.
3. Environmental priority development model focuses on addressing environmental pollution and improving environmental quality during the development process. It prioritizes protecting the environment, enhancing ecological conditions, and reducing resource consumption, even if it means sacrificing some industrial development. Therefore, we take a12 = −0.1, a21 = 0.5. The specific situation in each province is shown in Figure 8.
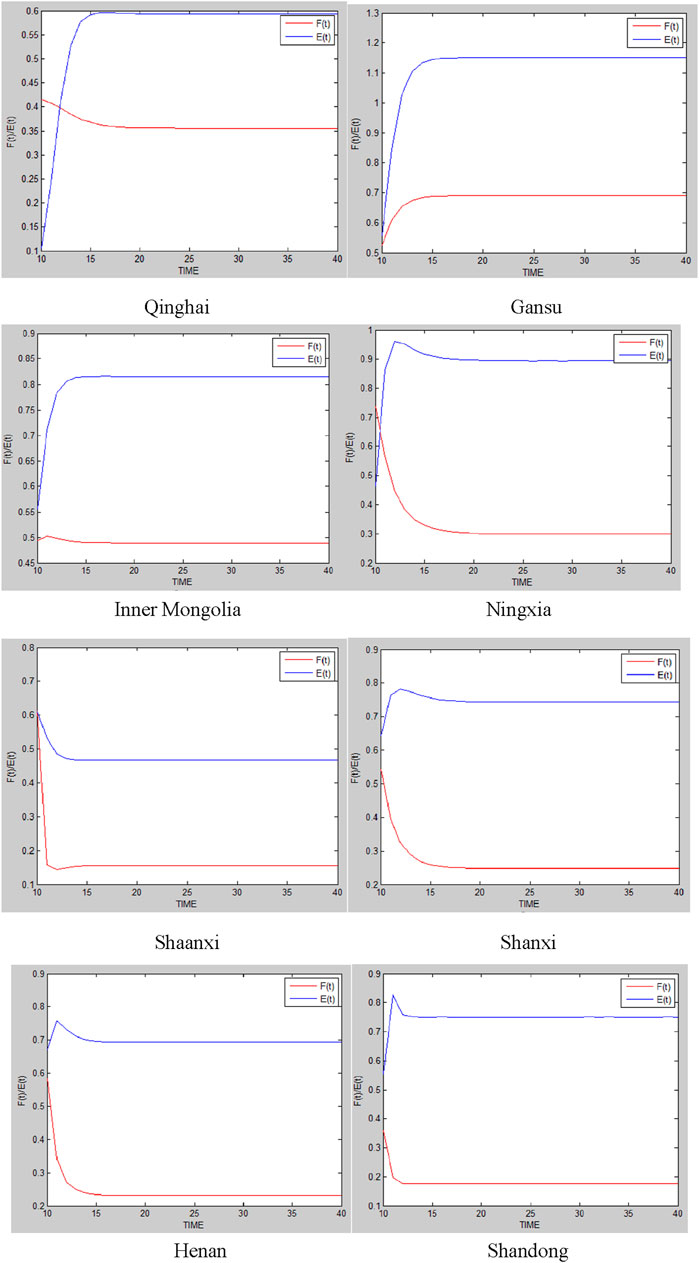
Figure 8. Development of industry and environment in the Yellow River Basin provinces in the environmental priority model, 2020–2050.
Under the environment-priority development model, Qinghai Province shows a decline in industrial growth alongside an increase in environmental metrics, having an industrial development index of 0.35 and an environmental development index of 0.60. Gansu Province is projected to reach its optimal state around 2025, displaying upward trends in both industrial and environmental indices, with values of 1.1 and approximately 0.70, respectively. In Inner Mongolia, environmental development is rising while industrial growth remains stable, showing no significant fluctuations. It is expected to reach optimal conditions by 2025, having an industrial development index of 0.80 and an environmental development index of 0.50.
In Ningxia, industrial development is increasing while environmental development is decreasing, and the optimal state is anticipated around 2025 with an industrial development index of 0.30 and an environmental development index of about 0.90. Shaanxi Province is expected to see a decline in both industrial development and environment, reaching its optimal state around 2025 with an industrial development index of 0.15 and an environmental development index of 0.45. Shanxi Province will achieve its optimal state before 2025, marked by increasing environmental metrics and declining industrial indices, with values of 0.25 for industrial development and 0.75 for environmental development.
In Henan Province, environmental indicators are declining while industrial metrics remain relatively unchanged with optimal conditions projected for around 2025; the industrial development index is expected to be approximately 0.25, and the environmental development index is 0.70. In Shandong Province, the optimal state is anticipated around 2025 with an environmental development index of 0.75 and an industrial development index of about 0.20.
In the three development models within the Yellow River Basin, each province exhibits distinct trends and characteristics. In the mutually beneficial model, Qinghai and Gansu are expected to have industrial development indices higher than their environment indices, indicating a priority on industrial growth, while Inner Mongolia and Ningxia show relatively strong levels of environment. In the industrial priority model, Qinghai and Gansu demonstrate significant industrial growth, but environment remains insufficient; Inner Mongolia and Ningxia have lower environmental indices, while Shaanxi and Shanxi face more prominent environmental issues. In the environmental priority model, Qinghai’s industrial development is expected to decline with an improvement in environment indices, while Gansu and Inner Mongolia show positive trends in environment. Ningxia, however, faces a reverse change between industry and environment, and although Henan and Shandong see improvements in environment indices, their industrial development remains sluggish. Overall, the expected performances of the provinces under different models reflect their trade-offs and balances in industrial and environmental development, providing important insights for future policy-making.
6 Conclusion
This paper draws on synergy theory to elucidate the mechanisms of synergistic evolution resulting from both internal and external interactions, constructing a composite system of environment and industrial development in the Yellow River Basin. Utilizing the entropy weight TOPSIS method, the study evaluates the levels of industrial development, environment, and environmental capacity. By measuring the natural growth rates and interaction forces of industrial and environmental development through the L-V model, the research calculates their synergy and predicts the developmental trends of provinces within the Yellow River Basin over the next 30 years. Empirical findings indicate the following:
1. From 2011 to 2020, synergy in the upper and middle reaches exhibited an upward trend, while synergy in the lower reaches declined. The upper reaches transitioned from mild non-synergy to mild synergy, the midstream progressed from mild non-synergy to high synergy, and the downstream shifted from high synergy to high non-synergy.
2. Throughout the study period, development models in the upper and middle reaches evolved from mutual harm to weak benefits for industry, accompanied by strong harm to the environment, ultimately reaching a mutually beneficial state. Conversely, the downstream model transitioned from mutual benefit to weak benefits for industry and strong harm to the environment, resulting in mutual damage.
3. In the mutually beneficial model, the industrial development indices for Qinghai and Gansu surpass their environment indices, indicating a prioritization of industrial growth, while Inner Mongolia and Ningxia maintain a balanced approach to environment. In the industrial priority model, Qinghai and Gansu display significant industrial growth but insufficient environment, whereas Inner Mongolia and Ningxia exhibit lower environmental indices with Shaanxi and Shanxi facing notable environmental challenges. In the environmental priority model, Qinghai experiences industrial decline alongside environmental improvement, Gansu and Inner Mongolia see enhancements in environment, Ningxia experiences contrasting changes between industry and environment, and both Henan and Shandong show improved environment indices but stagnant industrial development.
The innovations of this paper are as follows: 1. By constructing a co-evolution model with variable population growth rates and environmental carrying capacity, the applicability of the Lotka-Volterra (L-V) model is expanded, providing a unique perspective for revealing the complex evolutionary processes between the two systems. 2. Through simulation modeling, this paper predicts the evolutionary trajectories of industry and environment in the Yellow River Basin under different scenarios, offering a reference model for achieving positive interactions between the environment and industry. 3. This study focuses on the Yellow River Basin, a region of significant strategic importance, providing valuable insights for the green development of the environment and industry in other parts of China. However, this study has its limitations: 1. It does not consider external factors that may influence the relationship between industry and the environment, such as market fluctuations, economic conditions, and governance costs. 2. We observed that some literature studies the impact of agriculture on the environment from the perspective of the water-food-energy nexus, concluding that significant differences exist at different production stages. Water, food, and energy are interrelated and interdependent resources (Tafazzoli and Jamshidi, 2024) (Tafazzoli and Jamshidi, 2024). Agricultural production requires water and energy, and the supply of water often depends on the use of energy. By studying the relationships among these elements, we can better understand their effects on the environment and industry. Therefore, future research could consider incorporating the concept of the water-food-energy nexus into the L-V model to study the environmental impacts of production processes in different industries, which would aid in developing more effective policies.
Data availability statement
The original contributions presented in the study are included in the article/supplementary material, further inquiries can be directed to the corresponding author.
Author contributions
LW: Writing–original draft. HW: Formal analysis, Data curation, Writing–review and editing. WL: Writing–review and editing. WX: Supervision, Writing–review and editing.
Funding
The author(s) declare that no financial support was received for the research, authorship, and/or publication of this article.
Conflict of interest
The authors declare that the research was conducted in the absence of any commercial or financial relationships that could be construed as a potential conflict of interest.
Publisher’s note
All claims expressed in this article are solely those of the authors and do not necessarily represent those of their affiliated organizations, or those of the publisher, the editors and the reviewers. Any product that may be evaluated in this article, or claim that may be made by its manufacturer, is not guaranteed or endorsed by the publisher.
References
Asgharnejad, H., Khorshidi Nazloo, E., Madani, L. M., Hajinajaf, N., and Rashidi, H. (2021). Comprehensive review of water management and wastewater treatment in food processing industries in the framework of water-food-environment nexus. Compr. Rev. Food Sci. Food Saf. 20 (5), 4779–4815. doi:10.1111/1541-4337.12782
Bergendahl, J. A., Sarkis, J., and Timko, M. T. (2018). Transdisciplinarity and the food energy and water nexus: ecological modernization and supply chain sustainability perspectives. Resour. Conservation Recycl. 133, 309–319. doi:10.1016/j.resconrec.2018.01.001
Biswas, A., and Sarkar, B. (2019). Pythagorean fuzzy TOPSIS for multicriteria group decision-making with unknown weight information through entropy measure. Int. J. Intelligent Syst. 34 (6), 1108–1128. doi:10.1002/int.22088
Bressloff, P. C. (1995). Neural networks, lattice instantons, and the anti-integrable limit. Phys. Rev. Lett. 75 (5), 962–965. doi:10.1103/PhysRevLett.75.962
Cherniwchan, J. (2012). Economic growth, industrialization, and the environment. Resour. Energy Econ. 34 (4), 442–467. doi:10.1016/j.reseneeco.2012.04.004
Chiang, S. Y. (2012). An application of Lotka–Volterra model to Taiwan's transition from 200 mm to 300 mm silicon wafers. Technol. Forecast. Soc. Change 79 (2), 383–392. doi:10.1016/j.techfore.2011.05.007
Cole, M. A. (2000). Air pollution and ‘dirty’industries: how and why does the composition of manufacturing output change with economic development? Environ. Resour. Econ. 17, 109–123. doi:10.1023/a:1008388221831
Cooper, G. A., Frost, H., Liu, M., and West, S. A. (2021). The evolution of division of labour in structured and unstructured groups. Elife 10, e71968. doi:10.7554/elife.71968
Cui, X., Shen, Z., Li, Z., and Wu, J. (2021). Spatiotemporal evolutions and driving factors of green development performance of cities in the Yangtze River Economic Belt. Ecol. Inf. Int. J. ecoinformatics Comput. Ecol. (66), 66. doi:10.1016/j.ecoinf.2021.101476
de Leeuw, F. A. A. M., Moussiopoulos, N., Sahm, P., and Bartonova, A. (2001). Urban air quality in larger conurbations in the European Union. Environ. Model. and Softw. 16 (4), 399–414. doi:10.1016/s1364-8152(01)00007-x
Faber, A., and Frenken, K. (2009). Models in evolutionary economics and environmental policy: towards an evolutionary environmental economics. Technol. Forecast. Soc. Change, Evol. Methodol. Anal. Environ. Innovations Implic. Environ. Policy 76 (4), 462–470. doi:10.1016/j.techfore.2008.04.009
Feng, R., Lin, P., Hou, C., and Jia, S. (2022). Study of the effect of China’s emissions trading scheme on promoting regional industrial carbon emission reduction. Front. Environ. Sci. 10, 947925. doi:10.3389/fenvs.2022.947925
Feng, Y., Zhu, A., and Liu, W. (2021). Quantifying inter-regional payments for watershed services on the basis of green ecological spillover value in the Yellow River Basin, China. Ecol. Indic. 132 (December), 108300. doi:10.1016/j.ecolind.2021.108300
Fox, R. F. (1993). Review of stuart kauffman, the origins of order: self-organization and selection in evolution. Biophysical J. 65 (6), 2698–2699. doi:10.1016/s0006-3495(93)81321-3
Gokmenoglu, K., Azin, V., and Taspinar, N. (2015). The relationship between industrial production, GDP, inflation and oil price: the case of Turkey. Procedia Econ. Finance 25, 497–503. doi:10.1016/s2212-5671(15)00762-5
Gong, W., Zhang, H., Wang, C., Wu, B., Yuan, Y., and Fan, S. (2022). Analysis of urban carbon emission efficiency and influencing factors in the Yellow River Basin. Environ. Sci. Pollut. Res. 30 (6), 14641–14655. doi:10.1007/s11356-022-23065-x
Gonzalez, G. R., Claro, D. P., and Palmatier, R. W. (2014). Synergistic effects of relationship managers’ social networks on sales performance. J. Mark. 78 (1), 76–94. doi:10.1509/jm.11.0431
Haken, H. P. J. (1977). Synergetics. IEEE Circuits &Devices Mag. 28 (09), 412–414. doi:10.1088/0031-9112/28/9/027
Hallam, T. G., Clark, C. E., and Jordan, G. S. (1983). Effects of toxicants on populations: a qualitative approach II. First order kinetics. J. Math. Biol. 18 (1), 25–37. doi:10.1007/BF00275908
Jaffé, K. (2017). The “invisible hand” of economic markets can Be visualized through the synergy created by division of labor. Complexity 2017 (December), 1–10. doi:10.1155/2017/4753863
Jiang, L., Qiting Zuo, A. B. C., Junxia Ma, A. C., and Zhizhuo Zhang, A. (2021). Evaluation and prediction of the level of high-quality development: a case study of the Yellow River Basin, China. Ecol. Indic. 129, 107994. Available at: https://www.sciencedirect.com/science/article/pii/S1470160X21006592. doi:10.1016/j.ecolind.2021.107994
Kelso, J. A. S. (2021). The haken–kelso–bunz (HKB) model: from matter to movement to mind. Biol. Cybern. 115 (4), 305–322. doi:10.1007/s00422-021-00890-w
Korkmaz, M. (2008). Analysis of economic efficiency at forest enterprises with TOPSIS method. Opt. Eng. 47 (5), 525–534. doi:10.18182/tjf.38295
Kyriakopoulou, E., and Xepapadeas, A. (2013). Environmental policy, first nature advantage and the emergence of economic clusters. Regional Sci. Urban Econ. 43 (1), 101–116. doi:10.1016/j.regsciurbeco.2012.05.006
Liu, S., and Zhao, L. (2022). Development and synergetic evolution of the water–energy–food nexus system in the Yellow River Basin. Environ. Sci. Pollut. Res. 29 (43), 65549–65564. doi:10.1007/s11356-022-20405-9
Long, R., Li, H., Wu, M., and Li, W. (2021). Dynamic evaluation of the green development level of China's coal-resource-based cities using the TOPSIS method. Resour. Policy 74, 102415. doi:10.1016/j.resourpol.2021.102415
Malerba, F. (2007). “Innovation and the evolution of industries,” in Innovation, industrial dynamics and structural transformation: schumpeterian legacies. Editors U. Cantner,, and F. Malerba (Berlin, Heidelberg: Springer), 7–27. doi:10.1007/978-3-540-49465-2_2
Mattessich, M. (1992). Collaboration—what makes it work: a review of research literature on factors influencing successful collaboration. St. Paul, MN: Amherst H. Wilder Foundation.
McGraw, M. L., Addison, B., Clarke, R. W., Allen, R. D., and Rorrer, N. A. (2024). Synergistic dual-cure reactions for the fabrication of thermosets by chemical heating. ACS Sustain. Chem. and Eng. 12 (32), 11913–11927. doi:10.1021/acssuschemeng.4c01965
Murphy, J., and Gouldson, A. (2020). Environmental policy and industrial innovation: integrating environment and economy through ecological modernisation. Ecol. Mod. Read., 275–294. doi:10.4324/9781003061069-19
Park, J. M., Park, J. Y., and Park, H. S. (2016). A review of the national eco-industrial park development program in korea: progress and achievements in the first phase, 2005–2010. J. Clean. Prod. 114, 33–44. doi:10.1016/j.jclepro.2015.08.115
Sakr, D., Baas, L., El-Haggar, S., and Huisingh, D. (2011). Critical success and limiting factors for eco-industrial parks: global trends and Egyptian context. J. Clean. Prod. 19 (11), 1158–1169. doi:10.1016/j.jclepro.2011.01.001
Sauer, P. C., Silva, M. E., and Schleper, M. C. (2022). Supply chains' sustainability trajectories and resilience: a learning perspective in turbulent environments. Int. J. Operations and Prod. Manag. 42 (8), 1109–1145. doi:10.1108/ijopm-12-2021-0759
Song, J. (2021). Logic and path of high quality development “internal and external circulation” construction in the Yellow River Basin under the new development pattern. Contemp. Econ. Manag. 43 (07), 69–76. doi:10.13253/j.cnki.ddjjgl.2021.07.010
Sun, C., and Shuai, H. (2022). Research on the competitive and synergistic evolution of the water-energy-food system in China. J. Clean. Prod. 365 (September), 132743. doi:10.1016/j.jclepro.2022.132743
Sun, J., Cui, Y., and Zhang, H. (2022). Spatio-temporal pattern and mechanism analysis of coupling between ecological protection and economic development of urban agglomerations in the Yellow River Basin. J. Nat. Resour. 37 (07), 1673–1690. doi:10.31497/zrzyxb.20220702
Tafazzoli, P., and Jamshidi, S. (2024). Environment-food nexus in trout ponds: a developed index by combining grey water footprint and life cycle assessment. Int. J. Environ. Sci. Technol. 21, 8885–8900. doi:10.1007/s13762-024-05688-4
Wang, A., and Gao, C. (2018). Study on the relationship of spatio-temporal matching between water resources and economic development factors in the Yellow River Basin. Fresenius Environ. Bull. 27 (10), 6591–6597.
Wang, Q., Chen, J., Fu, W., and Tan, Q. (2021). Analysis of temporal and spatial differences and influencing factors of energy eco-efficiency in energy-rich area of the Yellow River Basin. Phys. Chem. Earth 121 (1), 102976. doi:10.1016/j.pce.2020.102976
Wei, W., Jin, C., Han, Y., Huang, Z., Tong, N., and Li, J. (2022). The coordinated development and regulation research on public health, ecological environment and economic development: evidence from the Yellow River Basin of China. Int. J. Environ. Res. Public Health 19 (11), 6927. doi:10.3390/ijerph19116927
Keywords: yellow river Basin, synergistic evolution, L-V model, industrial, environment
Citation: Wang L, Wei H, Luo W and Xue W (2024) Study on the synergistic evolution of environment and industry-a case study of provinces along the yellow river basin. Front. Environ. Sci. 12:1478224. doi: 10.3389/fenvs.2024.1478224
Received: 12 August 2024; Accepted: 28 October 2024;
Published: 12 November 2024.
Edited by:
Thomas Ramsey, China Three Gorges University, ChinaReviewed by:
Min An, China Three Gorges University, ChinaShervin Jamshidi, University of Isfahan, Iran
Buck Ryan, University of Kentucky, United States
Copyright © 2024 Wang, Wei, Luo and Xue. This is an open-access article distributed under the terms of the Creative Commons Attribution License (CC BY). The use, distribution or reproduction in other forums is permitted, provided the original author(s) and the copyright owner(s) are credited and that the original publication in this journal is cited, in accordance with accepted academic practice. No use, distribution or reproduction is permitted which does not comply with these terms.
*Correspondence: Hongyi Wei, Nzc5NjQ3NzMzQHFxLmNvbQ==
 Liangmin Wang
 Hongyi Wei2*