 Jinfang Wang1
 Zhilei Zhen
- 1College of Urban and Rural Construction, Shanxi Agricultural University, Taigu, Shanxi, China
- 2School of Arts Communication, Jinzhong College of Information, Taigu, Shanxi, China
Identifying and evaluating the ecological security pattern (ESP) of region can provide a solid foundation for optimizing regional ecosystem elements and improving regional ecological security. The PLUS model, InVEST model, and circuit theory were used to analyze the ecosystem services and ESP of the Shanxi section of the Yellow River Basin (SYRB) between 2005 and 2035. The findings revealed that 1) The total area of land use shift across categories between 2005 and 2020 was 6,080.99 km2, or 5.22% of the SYRB’s total area. Under the natural development scenario, the total land transfer area from 2020 to 2035 was predicted to be 4,605.10 km2. Among these, the tendency for construction and forest land was expanding, while the tendency for cultivated land, grassland, water area, and unused land was shrinking; 2) From 2005 to 2035, the SYRB’s water yield and soil conservation all decreased, while the habitat quality and carbon storage showed a declining tendency; 3) The ecological source increased from 35,767.00 km2 in 2005 to 39,931.00 km2 in 2035; the total length of the ecological corridors expanded from 2,792.24 km to 3,553.18 km between 2005 and 2035; the ecological pinch points increased from 27 in 2005 to 40 in 2035; the ecological barrier points increased from 21 in 2005 to 28 in 2035, which show that the ESP remained unstable; 4) According to the ecosystem service characteristics of the SYRB in 2020, an ESP of “one axis, two zones, four corridors, and multiple points” was constructed. This study could provide useful guidance for improving the spatial pattern of land use and maintaining ecosystem services.
1 Introduction
With the fast increase of urbanization and persistent economic growth, human alteration’s degree of nature has continuously expanded, leading to high-intensity land development and land use transformation (Tiando et al., 2021; Bengochea Paz et al., 2020; Wu et al., 2024). Human activities have changed the ecosystem process to obtain the required ecosystem services, resulting in a wide range of ecological crises, including ecosystem fragmentation (González et al., 2024), transformation (Newton et al., 2024), and degradation (Zhang et al., 2024b). Coordination of the interaction between ecological protection and economic growth, as well as the realization of “green development and promoting harmonious symbiosis between man and nature” are essential topics that must be addressed in the future (Chang et al., 2024; Doncaster and Bullock, 2024). The ecological security pattern (ESP) examines the connection between ecological processes and functions (Guo et al., 2024b; Zhao et al., 2024; Tian et al., 2024). The critical regions of ecological protection and restoration can be determined from a macro point of view to provide solutions for regional ecological security problems.
Ecosystem services are the advantages that ecosystems deliver to support and preserve human life and health. Ecosystem services include supplying, sustaining, regulating, and cultural services, which not only sustain human sustainable development but also ensure regional ecological security (Lautenbach et al., 2011; Baskent, 2020). Ecosystem services have trade-offs and synergies, which means that increasing one service may cause a drop in another, or both services may increase or decrease simultaneously (Bennett et al., 2009). According to research, ecosystem services trade-offs and synergies demonstrate high geographical variability (Rodríguez et al., 2006), with opposite states of trade-offs/synergies existing at both large and small scales. For example, studies on water conservation, carbon sequestration, and water yield at large scales demonstrate synergistic relationships, while at smaller scales, trade-off relationships are predominant (Li et al., 2017). Land use change is a major cause of ecosystem change, directly impacting ecosystem services by altering ecosystem types and patterns (Hasan et al., 2020; Gomes et al., 2021). Therefore, a correct understanding of the impact of land use on ecosystem services promotes reasonable land resource allocation and coordinated regional economic growth.
The Yellow River Basin (YRB) is both a significant ecological defense and a commercial zone in China. It is also one of the regions with the weakest development foundation and the most sensitive natural environment (Guo H. et al., 2024). For a long time, the YRB’s ecological system has been under tremendous strain as a result of population expansion, economic development, and urbanization. Ecological issues such as vegetation destruction, soil erosion, land desertification, and the decline of water conservation functions have become increasingly severe (Zuo et al., 2024; Liu et al., 2024). The YRB’s superior development and ecological preservation have been elevated to a national strategic priority in recent years (Chen et al., 2020). Balancing ecological conservation with high-quality development in the YRB is critical for establishing a new development pattern and paradigm.
Research on the ESP of the YRB has recently been initiated. For example, Qiu et al. (2021) developed an ecological security evaluation index system which based on pressure, governance, and environment, and the findings show a substantial association between urbanization and ecological security in the nine provinces along the YRB. Wei et al. (2022) built and optimized Jiziwan’s ESP in the YRB, forming an ESP of “two barriers, three corridors, and seven zones.” Huang et al. (2023) investigated the YRB’s lower reaches and developed an ESP of “one belt, one axis, two cores, two corridors, and four zones.” Zhang B. et al. (2024) constructed an ESP of the YRB and indicated that the top reaches are significantly safer than the middle and lower portions. Using distinct ecological sensitivity weights in different locations is more appropriate for constructing an ecological security index that reflects regional environmental differences. Shanxi Province, positioned in the YRB’s middle reaches, with complicated topography and sensitive temperature changes, is critical to YRB’s overall biological pattern. Although we previously constructed the ESP of the SYRB based on remote sensing ecological indices (Wang B. et al., 2024), there has been a lack of consideration for the different ecological services. Furthermore, there have been no reports on the construction of the ESP of the SYRB under future climate change scenarios.
In recent years, the construction and optimization of ESPs have developed a research model based on the “patch-corridor-matrix” theory, which encompasses the processes of “identifying ecological sources-establishing resistance surface-extracting ecological corridors.” Chen et al. (2024) identified the ecological sources of the Dongting Lake Basin and proposed strategies for constructing and optimizing the ESP. Luo et al. (2024) integrated the valuation of ecosystem services with the assessment of ecosystem health levels to construct an ESP for the Tacheng-Emin Basin. Shifaw et al. (2024) quantified the relationship between ecological security index and landscape structure, establishing the ESP for Fuzhou City. This study followed the aforementioned research model for ESP, focusing on the SYRB as the research subject, and employed the PLUS, Invest, and MSPA models to achieve the following objectives: 1) examine the spatiotemporal changes in land use in the SYRB from 2005 to 2035; 2) assess the four ecosystem services of water yield, habitat quality, soil conservation, and carbon storage, coupled with the MSPA model to maximize ecological sources selection; 3) establish of an ESP for 2020 and 2035, and propose optimized protection strategies. This study will provide a scientific basis for the high-quality development of the ecological environment in the YRB, as well as serve as a reference for the optimization of the ESP in other river basins.
2 Study area and data sources
2.1 Study area
The SYRB is situated in the midst of the YRB (110°14′-114°33′) and includes 11 cities and 86 counties, spanning an area of 114,600 km2 (Figure 1). The SYRB is a typical loess plateau with a variety of topographies, of which mountains and hills account for more than 80%, while the rest are plains and basins in the intermountain valleys. The research region experiences a moderate continental environment with four different seasons. The average temperature over the year is 10.0°C–11.5°C, and precipitation is concentrated from July to September, totaling 350–680 mm each year. Cultivated land covers the most ground, followed by forest land and grassland. Due to fast economic growth, the study area’s natural environment is very vulnerable and rapidly influenced by human activities (Wang J. et al., 2024).
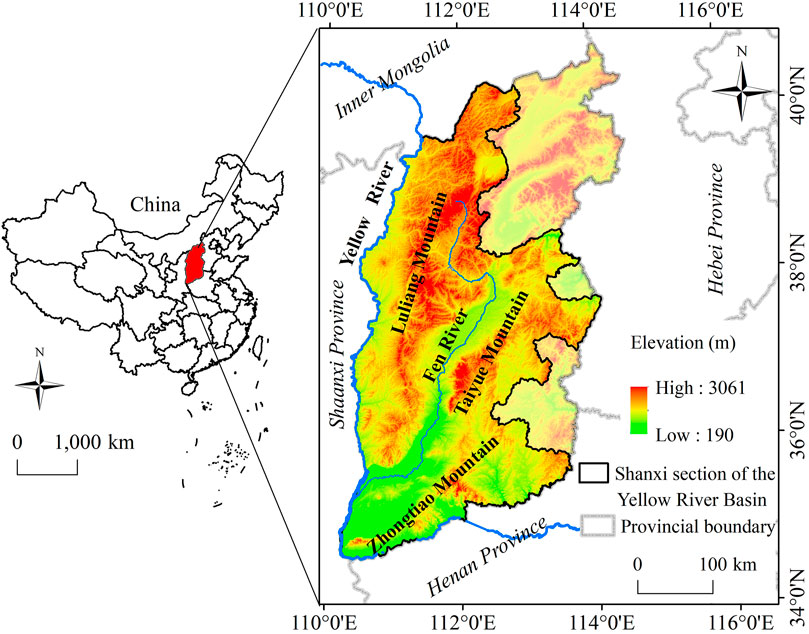
Figure 1. The location of the Shanxi section of the Yellow River Basin (SYRB).
2.2 Data sources
Precipitation, evaporation, and temperature data were obtained from the National Science and Technology Resource-Sharing Service platform (Table 1). The rainfall erosion factor was calculated based on the rainfall grid data. The depth of the root-restriction layer was selected from a soil depth map of 1 km in China. The soil data were collected from the Harmonized World Soil Database, which was created by the United Nations Food and Agriculture Organization and the Vienna International Institute for Applied Systems. The land use/land cover data came from the Chinese Academy of Sciences Resource and Environmental Science and Data Center. The data for the digital elevation model (DEM) were obtained from the geospatial data cloud. The gross domestic product (GDP) statistics came from the Resource and Environmental Science and Data Center of the Chinese Academy of Sciences. The distance between the road and the railway was calculated using the National Catalogue Service for Geographic Information’s basic geographic information vector data.
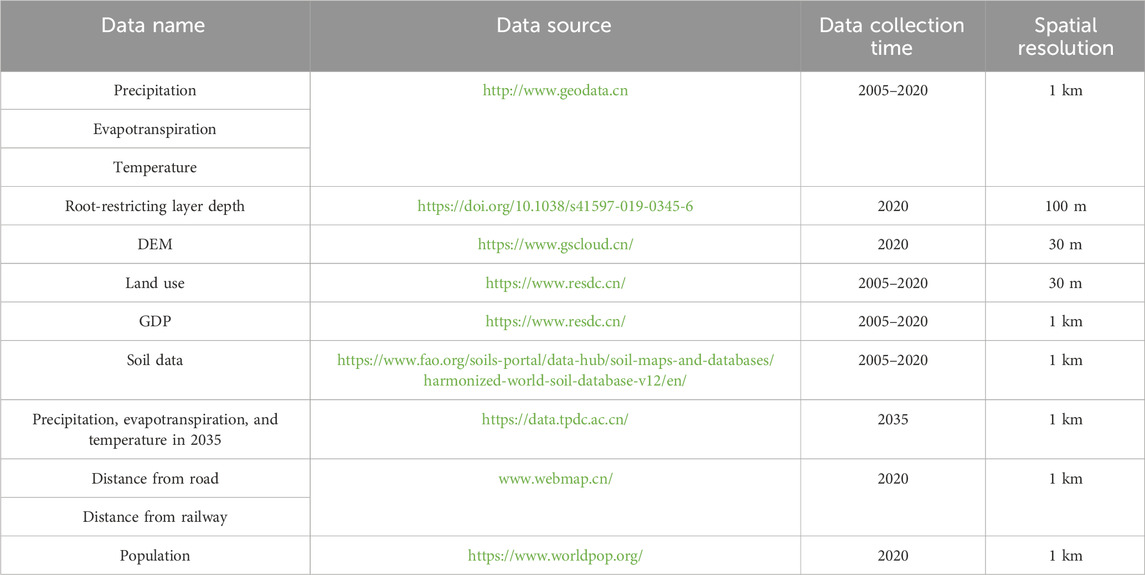
Table 1. Data sources.
2.3 Framework of this study
First, the driving factors—including the natural environment, social economy, and traffic accessibility—were chosen based on land use change between 2005 and 2020, and then the region’s land use in 2035 under an natural development scenario was predicted using the PLUS model (Figure 2). Second, the InVEST model was utilized to estimate the four typical ecosystem services for water yield, habitat quality, carbon storage, and soil conservation from 2005 to 2035. Through weighted superposition analysis, the ecosystem service evolution in the SYRB was determined. Third, the natural breakpoint method was utilized to identify the ecosystem service function, and the first three types of areas were chosen as the MSPA method’s core area to determine the SYRB’s ecological source. Then, the land use elevation, slope, and habitat quality were utilized to create the resistance surface. Finally, the circuit theory was utilized to extract ecological corridors, ecological pinch points, and ecological barrier points, construct the ESP, and determine the priority locations and measures for ecological protection and restoration.
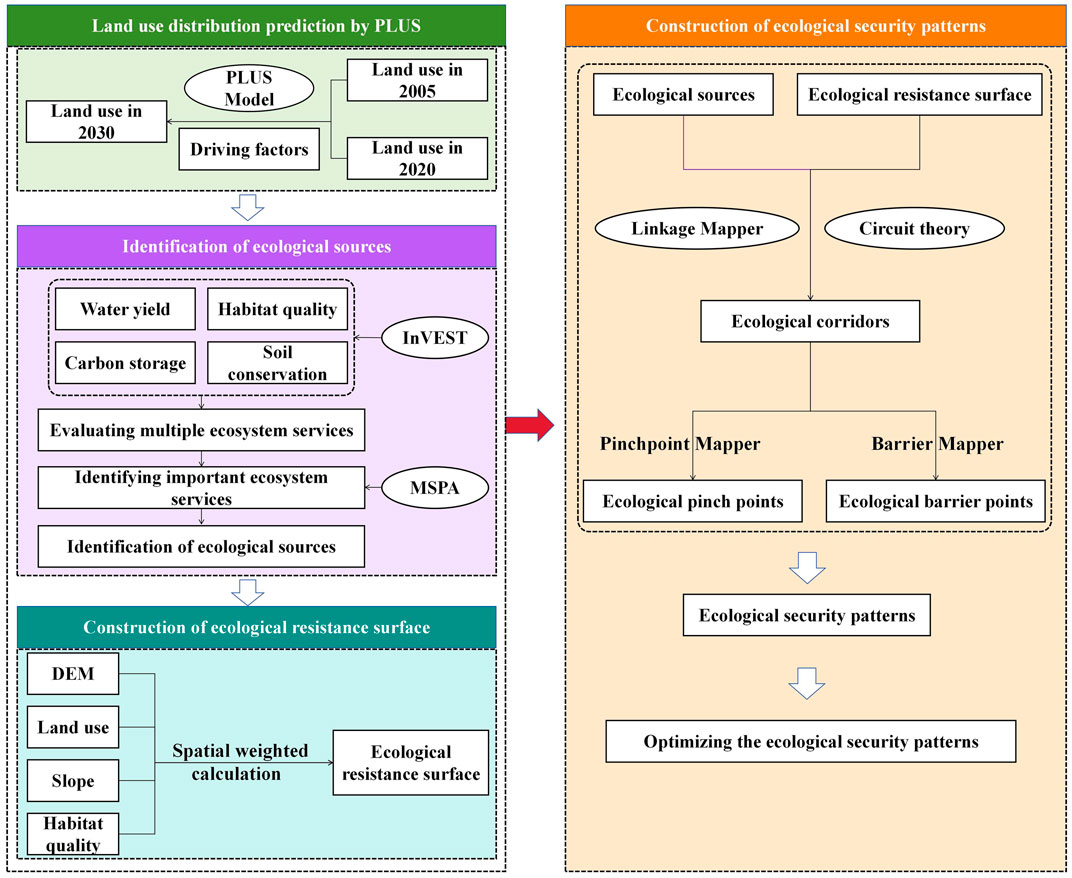
Figure 2. Research framework. DEM stands for digital elevation model. MSPA stands for morphological spatial pattern analysis.
3 Methods
3.1 PLUS model
3.1.1 Land use prediction
The China University of Geosciences developed the PLUS model, a raster-based land use change prediction model on the basis of the FLUS model (Jiang et al., 2021). It is divided into three parts: land expansion extraction based on two-phase land use data, land expansion analysis strategy using driving factors, and cellular automata using multi-type random patch seeds. Liang et al. (2021) provide an in-depth introduction to the PLUS model. In accordance with the trend of land use change from 2005 to 2020, this analysis did not limit the special change rules and defaults to the natural development scenario. According to the current development trends and transition probabilities, simulate and predict land use changes for 2035.
Based on the PLUS model, the land expansion analysis strategy was used to superimpose the land use data in 2005 and 2020, and the part of the two-period land use change was extracted. Then, the random forest algorithm was used to analyze the relationship between land use expansion and driving factors, so as to obtain the change rules of various types of land. Then, the cellular automata using multi-type random patch seeds module was used to input the conversion matrix, neighborhood weights and land use demand data in 2035 predicted by Markov chain to obtain the predicted land use in 2035.
3.1.2 Potential driving factors of land use change in 2020
Nine driving factors were chosen for land use change in the SYRB based on their characteristics: DEM, slope, precipitation, temperature, population, soil type, GDP, distance from a road, and distance from a railway. The influence of the driving factors on each land use type was assessed using the random forest algorithm (Liang et al., 2021) (Figure 3).
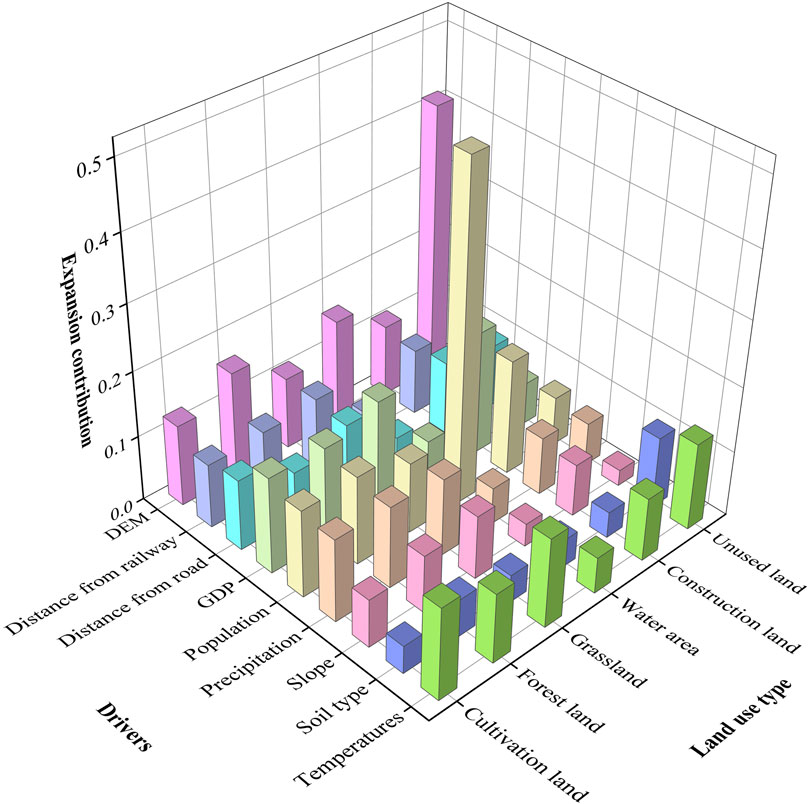
Figure 3. Contribution of the driving factors of land use expansion. GDP stands for gross domestic product.
3.1.3 Accuracy verification
The land use data from 2005 were used to predict land use spatial distribution in 2020 to test the PLUS model’s applicability (Figure 4). The simulated accuracy Kappa coefficient was 0.894, and the overall accuracy was 0.926, when the results were compared to the real land use area in 2020. When Kappa is more than 0.75, the simulation result is reliable (Jafari and Abedi, 2021). Therefore, the PLUS model can predict the SYRB’s land use in 2035.
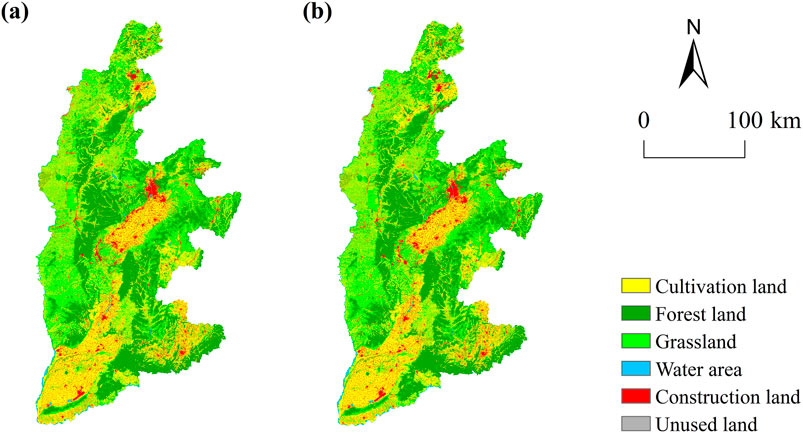
Figure 4. Comparison between the predicted land use and the actual land use in 2020. (A) Predicted land use in 2020. (B) Actual land use in 2020.
3.2 Ecosystem services assessment
3.2.1 Water yield
Water yield is the number of water resources per unit area in a certain time period, and it indicates how well the ecosystem is able to save water by catching rainfall (Pessacg et al., 2015). The InVEST model water yield module was used to predict the water yield in the SYRB in 2035 based on the fluctuation in water yield from 2005 to 2020:
In the formula, grid unit (GU)
3.2.2 Habitat quality
High-intensity human activity can easily lead to habitat degradation and species loss (Sallustio et al., 2017). Based on the official user manual of the InVEST model (Natural Capital Project, 2024), previous research results (Terrado et al., 2016), and the actual sources of ecological risk in the study area, three land use types, cultivated land, urban land, and unused land, were ultimately identified as threat factors. Subsequently, values for their maximum impact distance and weights were assigned, and their degradation types were determined (Table 2). By integrating the recommended values from the InVEST model, existing research results (Dong et al., 2022), and the actual conditions of the study area, the habitat suitability of each land use type and their sensitivity to each threat factor were established (Table 3). The SYRB’s habitat quality from 2005 to 2020 was analyzed by connecting land use types with threat factors using the InVEST model’s habitat quality module, and the habitat quality in 2035 was predicted as follows:
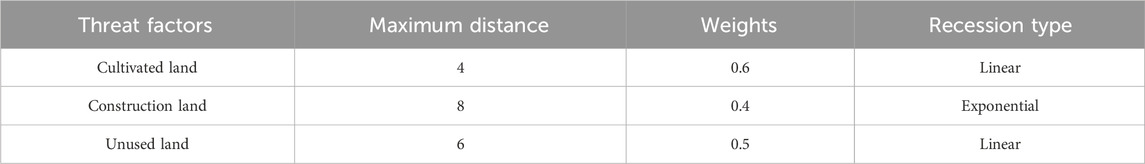
Table 2. Threat source weights and maximum impact distances.
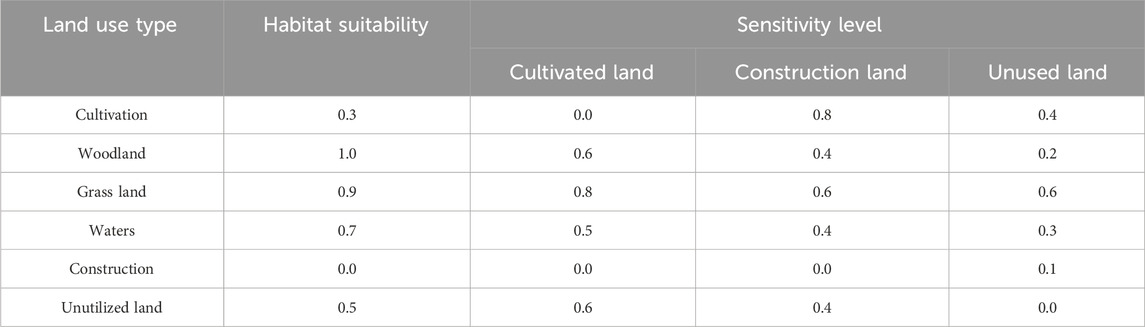
Table 3. Sensitivity of land use types to stress.
In this context,
3.2.3 Soil conservation
The assessment of soil conservation capacity can better identify areas with high ecosystem stability as source reserve areas (Saad et al., 2018). In the InVEST model, land use types, precipitation, surface transpiration, and soil texture were used to evaluate the soil conservation change from 2005 to 2020 and to predict the soil conservation capacity in 2035. The formula is as follows:
In the formula,
3.2.4 Carbon storage
Carbon storage is an essential regulatory function in ecosystem services, with a substantial influence on the conservation of the regional ecological environment (Piyathilake et al., 2022). Ecosystems with a high carbon storage capacity usually support richer plant and animal diversity. The evolution of carbon storage in the SYRB from 2005 to 2020 was assessed using the InVEST model, and the carbon storage in 2035 was predicted, which takes into account various land use types as well as the aboveground biological carbon (
3.3 Ecosystem service and ecological source identification
A region that possesses excellent ecological stability, expansibility, and ideal ecological function is known as the ecological source, which may enable the ecological process to develop in a positive direction (Dai, 2022). The results of water yield, habitat quality, carbon storage, and soil conservation were normalized, and then weight was calculated using the entropy approach as follows: 0.24, 0.26, 0.26, and 0.24. Through weighted superposition analysis, the ecosystem service functions evaluation results in the SYRB were achieved. The natural breakpoint method (Gao et al., 2022) divides the ecosystem service functions into five levels, ranging from high to low: excellent, good, general, poor, and worst. The original ecological sources were determined to be the first three levels (Zhou et al., 2023).
MSPA is a quantitative approach to detecting ecological sources. It mainly identifies and classifies ecological sources through neighborhood analysis to obtain the distribution (Vogt et al., 2007; Saura and Pascual-Hortal, 2007). In this study, the original ecological sources were used as prospect data for the MSPA analysis. The SYRB yielded seven distinct landscape types: core, islet, perforation, edge, bridge, loop, and branch areas (Dai, 2022). The core area was recognized as its final ecological source in the SYRB. In the process of source identification, there are many patches with small areas and uneven distribution, which provide limited ecosystem services and have little impact on the overall ESP. As a result, the research removed those ecological patches with areas smaller than 10 km2.
3.4 Resistance surface construction
The resistance surface reflects the difficulties of species movement across ecological sources (Ding et al., 2022). It reflects the horizontal resistance to ecological processes. The resistance surface in this study was constructed using land use, elevation, slope, and habitat quality. The resistance value was determined by consulting the necessary literature and expert opinions, and the weights of the various resistance factors were calculated utilizing the analytic hierarchy approach (Table 4).
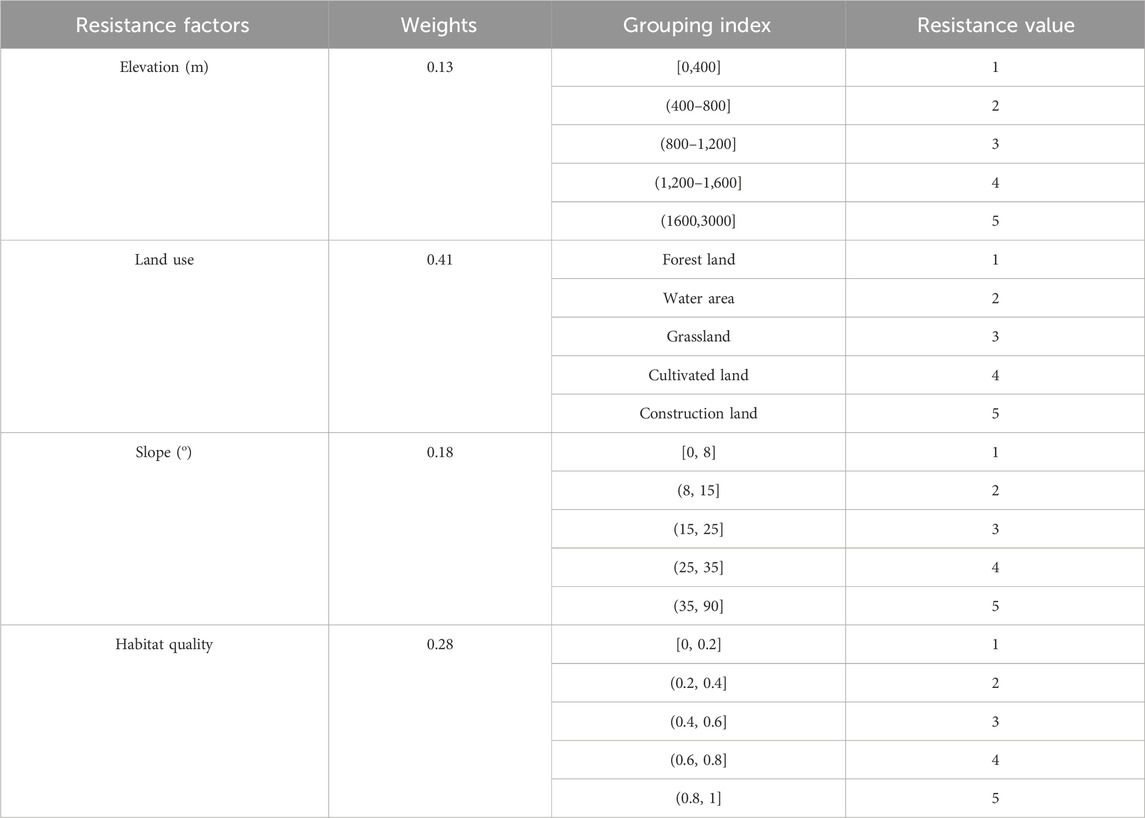
Table 4. Classification and weight of each resistance factor.
3.5 Identifying the ecological corridors, ecological pinch points, and ecological barrier points
The ecological corridors are the channel for the movement and exchange of materials, energy, and information across ecological sources, and it is the easiest linked ecological channel with minimum resistance. The least-cost paths were determined using the Linkage Pathways Tool in Linkage Mapper based on circuit theory, with the lowest-cost path serving as the best ecological corridor.
The ecological pinch points are the high-frequency areas where ecological processes flow, serving as an alternative path in the study area for materials, energy, and organisms to flow between different ecological sources or when no other options are available. This study identified the pinch point using the Pinchpoint Mapper module in Linkage Mapper, chose the “all to one” mode, and combined with Circuits pace tools to effectively identify the pinch area through the current flow between ecological sources. Then, using the natural breakpoint approach, the identification findings were classified into five levels, with the highest level reflecting the ecological pinch points.
The ecological barrier points are the key nodes that hinder the connectivity between ecological sources, and their removal improves connectivity. This research employed the Barrier Mapper module in Linkage Mapper, selecting 500 m as the iterative radius to identify the obstacle point.
4 Results
4.1 Spatial–temporal changes of land use from 2005 to 2035
Cultivated land was the primary land use category in the SYRB, followed by forest land and grassland. Cultivated land was generally concentrated in the center and southern sections of the SYRB with ample water supplies and relatively level terrain, while forest and grassland were mostly concentrated in the Taiyue, Zhongtiao, and Lvliang mountains (Figure 5).
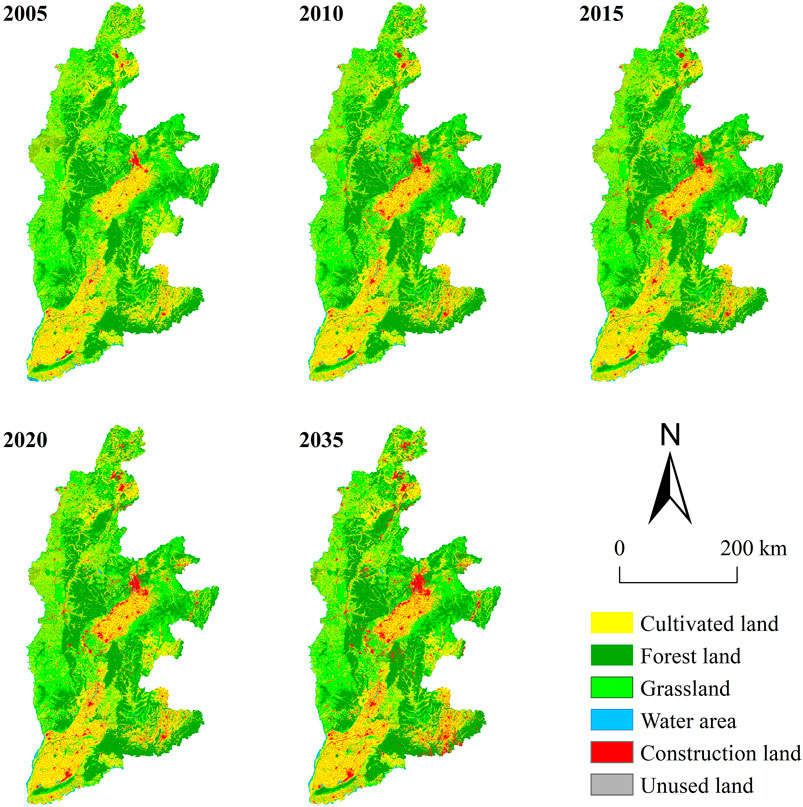
Figure 5. Land use changes from 2005 to 2035.
The areas of the six land use groups ranged from high to low: cultivated land (43,399.17 km2), forest land (34,690.24 km2), grassland (31,216.10 km2), construction land (6,048.13 km2), water area (1,006.92 km2), and unused land (39.61 km2) in 2020 (Figure 6). From 2005 to 2020, the total area transferred between land use types was 6,080.99 km2, or 5.22% of the SYRB’s total area. Over the past 15 years, construction land showed a clear expansion trend, increasing by 2,837.44 km2, an increase of 88.37%. Forest land also showed an upward trend, growing by 203.05 km2, or 0.59%. Meanwhile, cultivated land, grassland, water area, and unused land showed a shrinking trend, decreasing by 1990.12, 864.21, 182.83, and 3.34 km2, with a decrease of 4.38%, 2.69%, 15.37%, and 7.78% respectively.
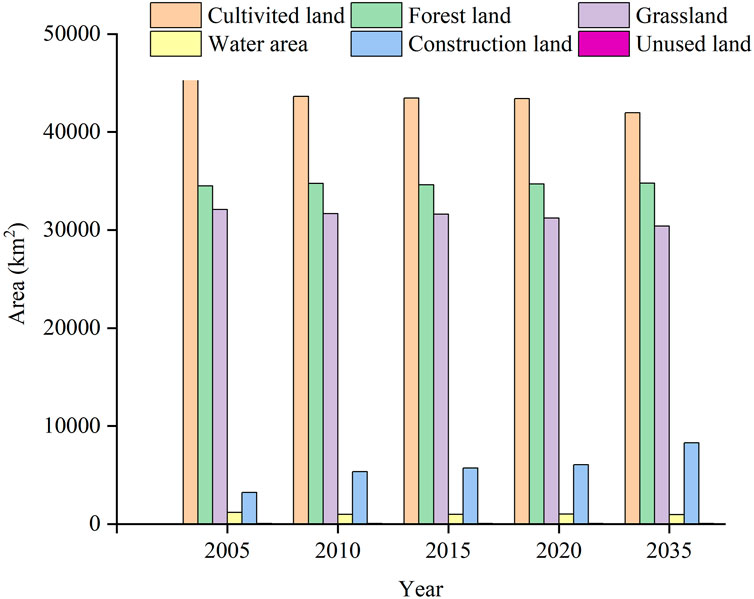
Figure 6. Areas of different land use types from 2005 to 2035.
The areas of the six land use groups ranged from high to low in 2035 were cultivated land (41,961.21 km2), forest land (34,764.42 km2), grassland (30,393.08 km2), construction land (8,276.51 km2), water area (968.20 km2), and unused land (36.59 km2). 4,605.10 km2 of land were transferred from 2020 to 2035. Construction and forest land expanded by 2,228.37 and 74.18 km2, respectively, whereas cultivated land, grassland, water area, and unused land decreased by 1,437.79, 823.02, 38.72, and 3.02 km2 respectively.
4.2 Spatial–temporal variation of ecosystem services
From 2005 to 2035, the water yield and soil conservation in the SYRB showed a fluctuating upward trend (Figure 7), while the habitat quality and carbon storage showed a downward trend. The average water yield grew by 10.045%, from 279.030 mm in 2005 to 307.059 mm in 2035. The average soil conservation rate grew by 17.494%, from 94.712 t/ha in 2005 to 111.281 t/ha in 2035. The average habitat quality dropped from 0.035 in 2005 to 0.014 in 2035, a 60.430% reduction. The average carbon storage dropped from 101.428 t/ha in 2005 to 100.875 t/ha in 2035, a 0.545% reduction.
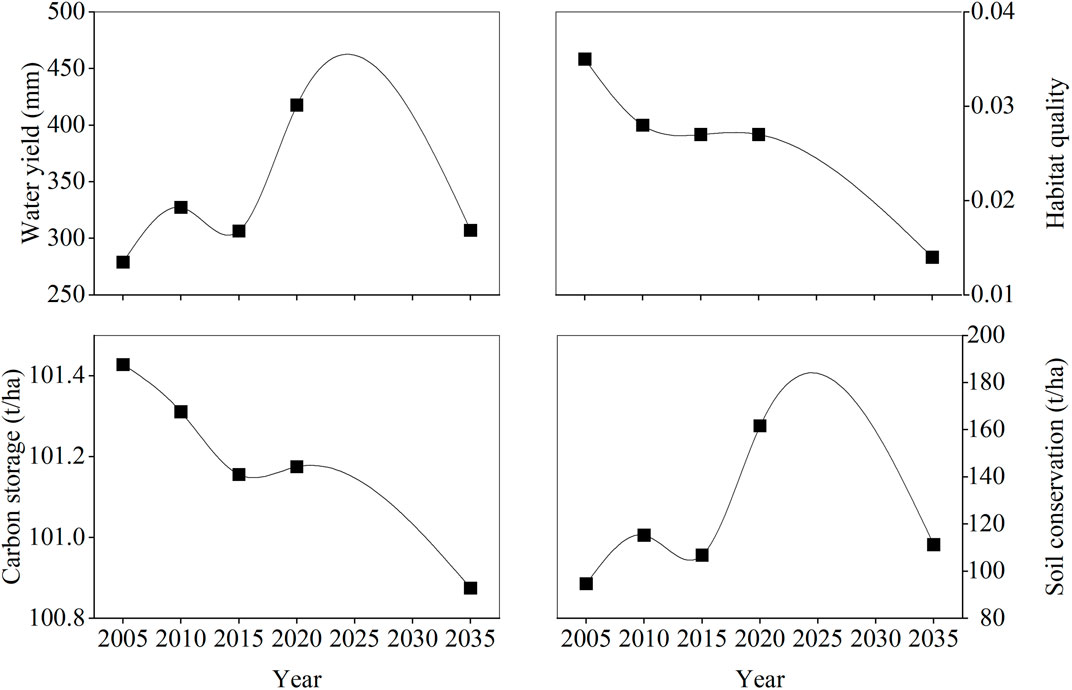
Figure 7. Changes of different ecosystem services from 2005 to 2035.
The general trend of the geographical distribution of water yield in the SYRB from 2005 to 2035 declined from southeast to northwest (Figure 8). In 2005, high-value water yield areas were primarily concentrated along the southeastern route, while low-value areas were mostly distributed along the northwest route and the central urban agglomeration of the region (Wang J. et al., 2024), with sporadic distribution in the southern basins. In 2010, the high-value range of water yield in the study area expanded, whereas low-value areas were less distributed, only sporadically in the central urban agglomeration of the region and southern basins. In 2015, the water yield in the majority of the study area’s middle and northern regions was low, while high-value portions were still concentrated along the southeastern edge. High-value water yield areas expanded obviously in 2020. The majority of the study region south of the center was high-value, while low-value areas were mainly scattered in the central urban agglomeration. In 2035, the central urban agglomeration and southern basins were still the primary distribution locations for low water yield. The geographical distribution of water yield is intimately linked to the distribution of precipitation and vegetation cover. Areas with heavy precipitation but low evapotranspiration have higher water yields and vice versa.

Figure 8. Spatial distribution of the ecosystem service supply from 2005 to 2035.
The geographical distribution of soil conservation in the research region changed slightly between 2005 and 2035 (Figure 8). As time went by, the high-value regions of soil conservation increased slowly and fluctuated, while the low-value parts decreased slowly in a fluctuating manner. The high-value regions were mainly located in the western Lvliang Mountains, the central Taiyue Mountains, and the southern Wangwu and Zhongtiao Mountains, being forest lands and grasslands with high vegetation coverage. The low-value regions were primarily concentrated in basins with considerable human activity and limited vegetation covering.
From 2005 to 2035, the geographical distribution patterns of carbon storage, habitat quality, and soil conservation in the study area were basically consistent (Figure 8). High-value locations were distributed in the research area’s mountainous regions on the east and west sides, while low-value areas were located in regions with a high level of urbanization. The research region did not show an overall decline in carbon storage or habitat quality.
In 2005, the area classified as providing outstanding ecosystem services amounted for 8.12% of the total area, increasing to 8.22% in 2010 and 8.88% in 2015 (Figure 9). However, by 2020, there was a decrease to 7.04% of the total area, followed by an increase to 12.92% by 2035. Excellent-grade areas were mostly located in the forest land on the research area’s east and west edges, where the vegetation was better. The area graded as having good ecosystem services accounted for 17.44% of the total area in 2005, 19.99% in 2010, 20.09% in 2015, 20.76% in 2020, and 21.31% in 2035, showing a continuous expansion trend. This grade was mainly located on the edge of the excellent grade of ecological sources. The areas of general grade made up 34.23% of the total area in 2005, 32.56% in 2010, 34.61% in 2015, 33.59% in 2020, and 33.85% in 2035. This grade showed fluctuating changes, mainly extending along the edges of the areas of good and excellent grades. The ecosystem services in the poor and worst grades were mainly dispersed in urban built-up regions and cultivated land, providing fewer ecosystem services.
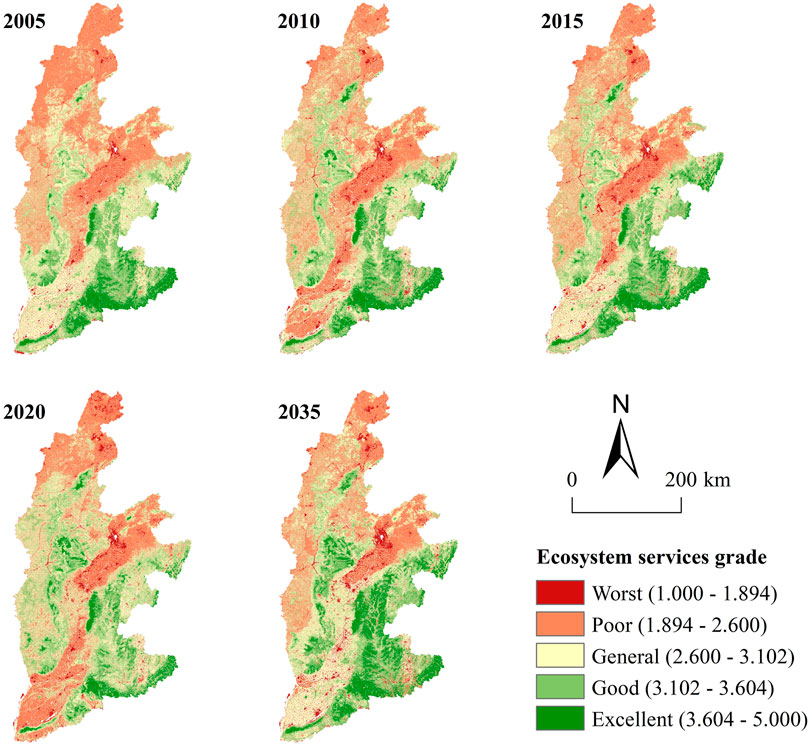
Figure 9. Spatial distribution of the ecosystem services grade from 2005 to 2035.
4.3 Analysis of the landscape pattern based on MSPA
From 2005 to 2035, the core area showed a fluctuating development trend, with the majority of it concentrated in locations with significant biodiversity and superior ecological conditions, such as the Lvliang, Taiyue, Zhongtiao, and Taihang mountains (Figure 10). The core area was generally located in the research area’s eastern and western regions, with a weak connection between these two parts. The bridge area was less than that of the core area, which connects different core area patches as a structural corridor, and it has significant implications for biological migration and landscape connectedness. The edge and perforation sections served as a transition between the core area and non-green landscape patches. From 2005 to 2035, the edge area continued to increase while the perforation area decreased continuously. The edge region was situated on the outside of the core area, and its ability to protect the core area from external disturbances gradually increased. The perforation region was situated on the inner border of the core area, and its ability to maintain ecological stability within the core area declined. The branch area expanded and subsequently declined, indicating that the connectivity of ecological corridors within the study area is not particularly tight. Islet and loop areas had the smallest proportions, with the islet area decreasing, indicating that the fragmented patches that can be used as stepping stones for biota gradually decreased, which is detrimental to the overall connection of ecological patches. The fluctuating growth of loop areas indicates the instability of support for migration and movement of organisms within patches, and the region was very small.
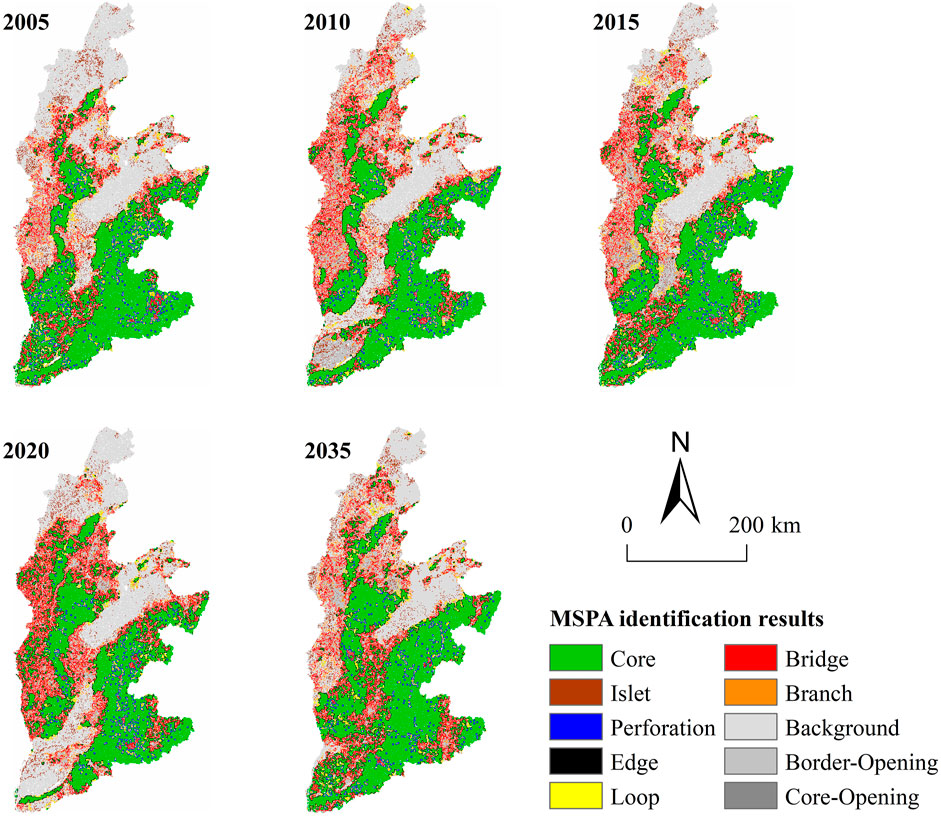
Figure 10. Landscape pattern distribution based on MSPA.
4.4 Analysis of ecological source evolution
The final ecological sources were obtained by choosing patches bigger than 10 km2, which MSPA designated as ecological core regions. In 2005, there were 81 ecological sources covering 35,767 km2, or 30.73% of the research area (Figure 11). In 2010, there were 64 ecological sources covering 33,225 km2, or 28.54% of the overall area. In 2015, there were 80 ecological sources covering 36,171 km2, or 31.07% of the area. In 2020, there were 114 ecological sources covering 31,062 km2, or 26.69% of the area. In 2035, there were 110 ecological sources covering a total of 39,931 km2, or 34.30% of the area. The ecological sources increased from 2005 to 2015 but decreased from 2015 to 2020. The overall area of ecological sources increased from 2020 to 2035, but the number of source regions remained stable, showing a good trend in the ecological environment. However, the phenomenon of ecological fragmentation still existed.
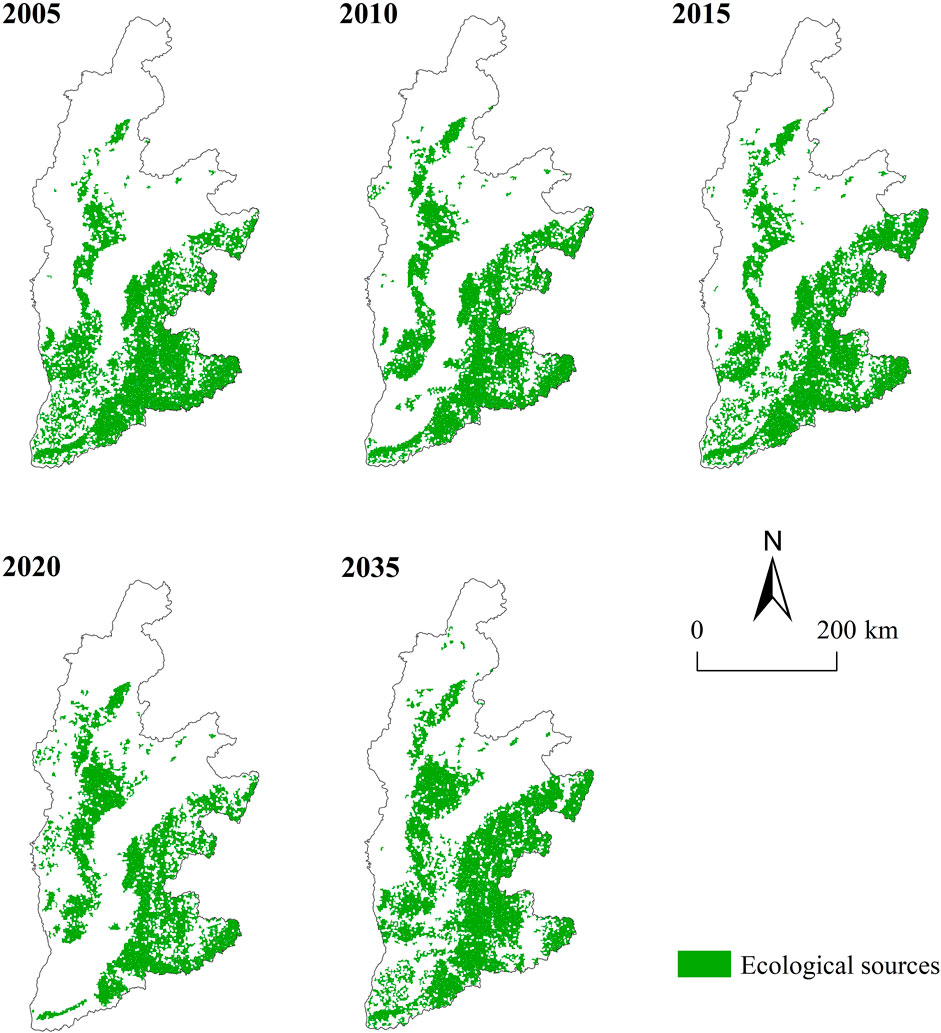
Figure 11. Spatial changes of ecological sources from 2005 to 2035.
The research area’s ecological sources were mainly found in the southeastern Taihang, Zhongtiao, and Taiyue mountains, as well as the center and western Lvliang Mountains. These places are mainly covered by forests, with high habitat quality and relatively intact ecosystem services functions, making them priority regions for ecological development. The ecosystem services functions along the western corridor were relatively high, but they were distributed in a scattered manner, with small areas that were easily influenced by human activity. As a result, they were more prone to fragmentation or disappearance, with fewer ecological sources spread over the area. In the central basin, cultivated and construction land predominated, with more anthropogenic interventions, leading to the dispersion of important areas for ecosystem service functions.
4.5 Changes in resistance surfaces
The geographical distribution of resistance surface in the SYRB indicated that the low-resistance areas were mostly found in regions with more precipitation and concentrated forest areas (Figure 12). High-resistance zones were found in densely populated regions of cities, where the ecological environment was relatively fragile and posed greater resistance to ecological processes. The comprehensive resistance values in 2005, 2010, 2015, 2020, and 2035 were 3.389, 3.402, 3.405, 3.407, and 3.426, respectively. Resistance values increased year by year, further hindering biological migration and exchange.
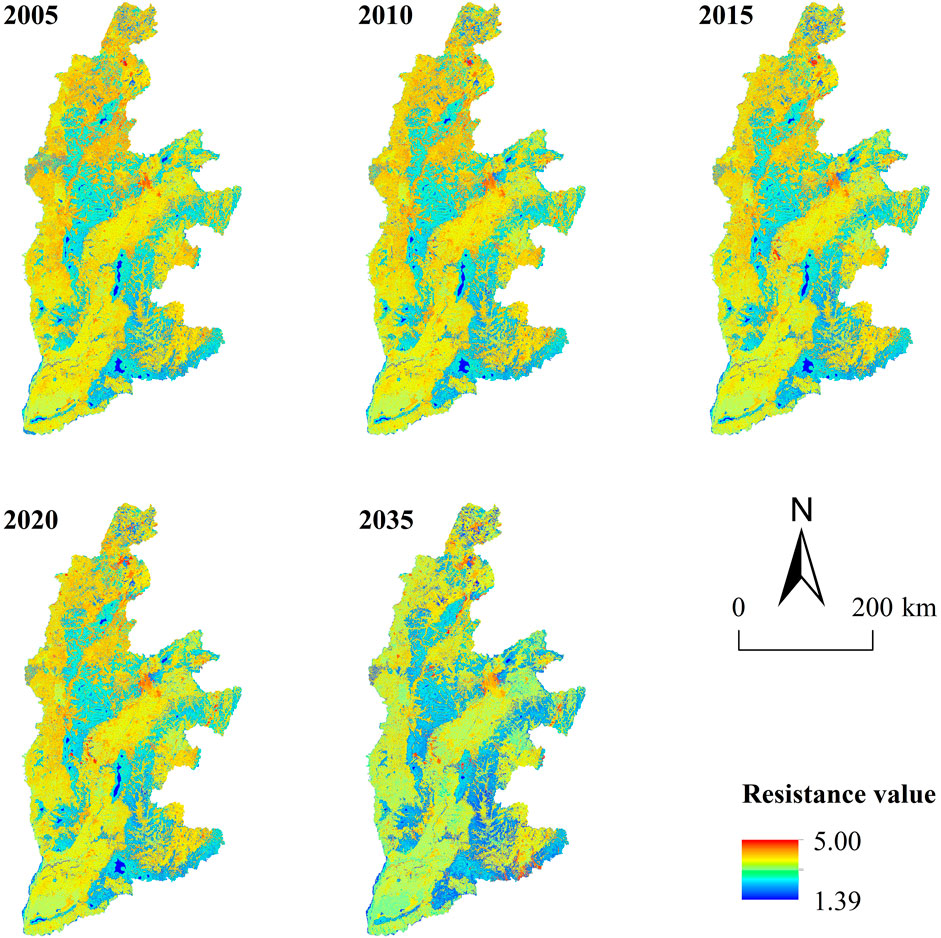
Figure 12. Spatial changes in resistance surface from 2005 to 2035.
4.6 Dynamic changes in ecological corridors, ecological pinch points, and ecological barrier points
In 2005, there were 191 ecological corridors totaling 2,792.239 km. In 2010, there were 137 ecological corridors spanning 2,945.837 km (Figure 13). In 2015, there were 188 ecological corridors totaling 3,499.462 km. In 2020, there were 274 ecological corridors totaling 4,061.342 km. In 2035, there were 268 ecological corridors totaling 3,553.176 km. The increasing length of ecological corridors indicates that the fragmentation of ecological source areas increased the cost of resistance to biological migration. Areas with concentrated ecological source areas had a higher number of ecological corridors but shorter lengths. The distance between the source areas in the east and west was relatively far, the ecological corridors were long, and the quantity was limited. The southern basins were greatly influenced by human activity, resulting in unstable ecological sources and a rise in the number of ecological corridors due to source area growth. There were no ecological source sites or ecological corridors in the research area’s northern end.
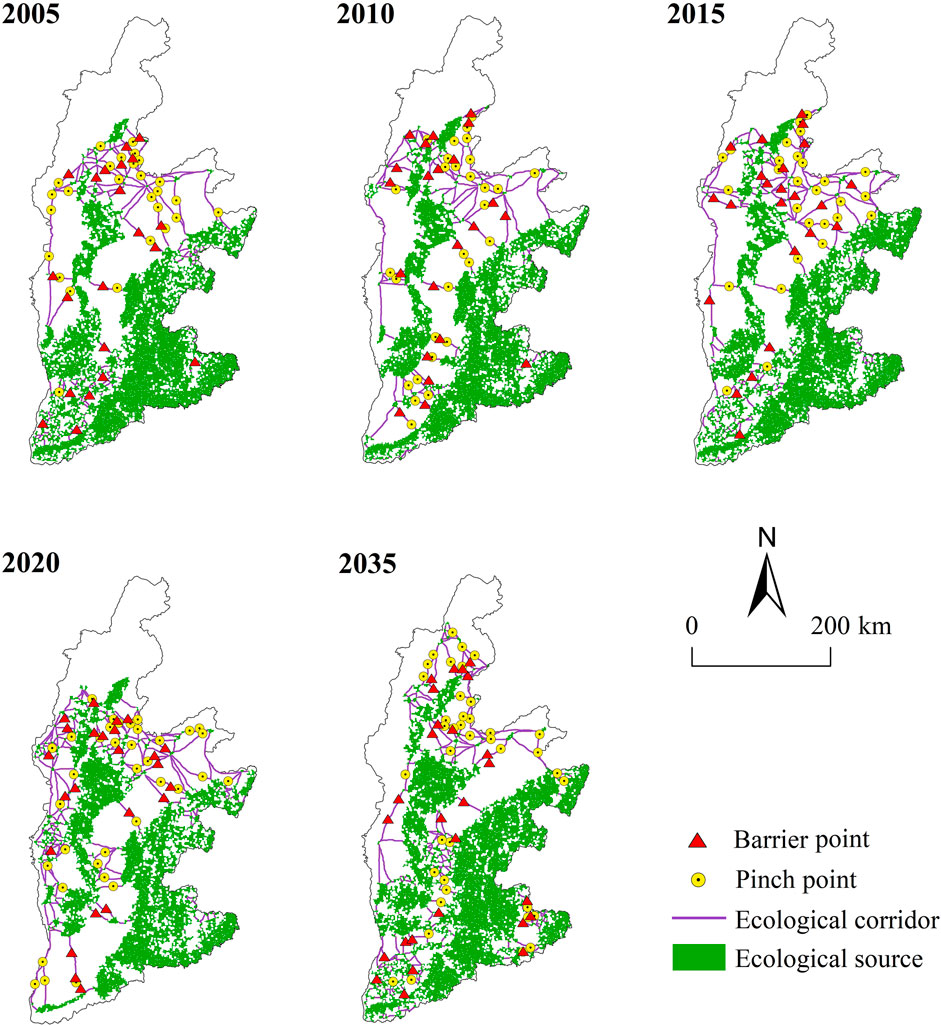
Figure 13. Spatial changes of ecological corridors, ecological pinch points, and ecological barrier points from 2005 to 2035.
In 2005, 27 ecological pinch points were identified in the research region (Figure 13). The number increased to 28 in 2010 and 2015 and reached 36 in 2020. By 2035, there were 40 ecological pinch points. This shows a rise in the number of ecological pinch points, with their distribution expanding from a relatively concentrated central area to the study area’s periphery. Ecological pinch points were typically found in the middle of ecological corridors or in areas intersecting with ecological source areas. These areas often face higher ecological risks as a result of the high ecological resistance in the surrounding areas, highlighting the urgent need to protect ecological pinch-point areas in order to sustain the connectivity of the ecological landscape.
In 2005, a total of 21 ecological barrier points were identified, increasing to 22 in 2010, 23 in 2015, 24 in 2020, and 28 in 2035 (Figure 13). This minor rise in the number of barriers suggests that the overall ESP remained unstable. Overlaying ecological pinch points and ecological barrier points revealed obstacles along important migration corridors for wildlife, making these areas a priority for protection and restoration.
4.7 Ecological security pattern construction
To improve the integrity and efficiency of the ecological network, this research combined the “Ecological Protection and High-Quality Development Plan of the Yellow River Basin in Shanxi Province,” the “14th Five-Year Plan for the Conservation and Utilization of Natural Resources in Shanxi Province,” and the ecological protection and restoration project of the “Two Mountains, Seven Rivers, and One Basin” in Shanxi Province to construct an ESP of the SYRB, namely, “one axis, two zones, four belts, and multiple points.” “One axis” describes the development axis along the northeast-southwest direction of the Fen River (Figure 14). The “two zones” allude to two ecological essential protected areas: the Lvliang Mountains and the Taihang, Zhongtiao, and Taiyue mountains, as well as their surrounding areas. The “four corridors” are important bridges that connect ecological sources in 2020 depending on the distribution and extension directions of significant ecological corridors in 2020. “Multiple points” refer to multiple ecological barrier points and ecological pinch points.
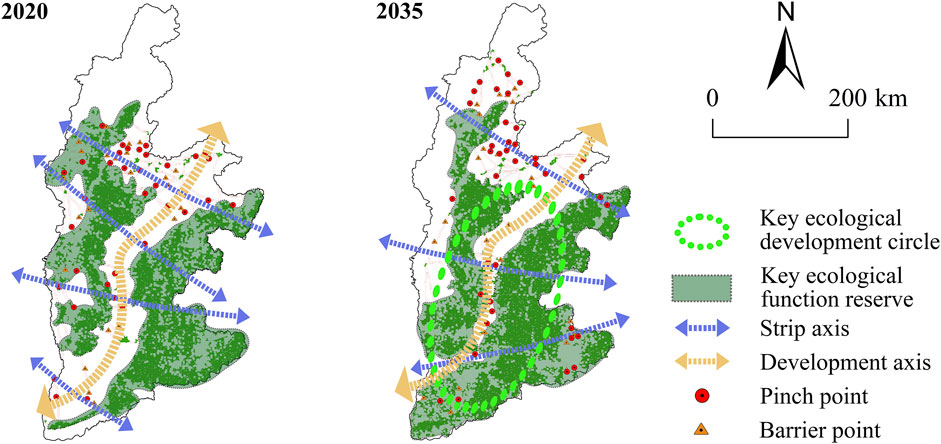
Figure 14. The construction of ecological security pattern for 2020 and 2035.
According to the land use prediction results of the SYRB in 2035, an ESP model of “one circle, two zones, one axis, three belts, and multiple points” was constructed. Compared to the ESP in 2020, by 2035, many small patches had formed between the two key ecological protection areas, increasing the connectivity between the two regions and forming a “circle,” namely, the important ecological development circle of the SYRB. In the central and southern basins, as well as the southeast, multiple ecological pinch points formed, and the number of pinches increased. The distribution was relatively concentrated in the center and gradually spread to the study area’s neighboring areas, with the distribution gradually expanding.
5 Discussion
5.1 Comparison of ecological sources in the Yellow River Basin
In the ESP constructed for the SYRB in 2020, there are 114 ecological sources covering a total of 31,062 km2, along with 274 ecological corridors that extend a total length of 4,061.342 km. Utilizing MSPA and Remote Sensing Ecological Index for identification (Wang B. et al., 2024), 108 ecological sources and 243 ecological corridors were identified within the SYRB, encompassing a total area of 34,157.42 km2 and a total length of 3,259.44 km. By calculating various Multi-ecosystem Service Landscape Indices (Wang et al., 2023), the comprehensive capacity of ecosystem services was quantified, identifying 16 ecological sources in Shanxi Province, with a total area of 3,094 km2 and 15 primary ecological corridors totaling 1,000 km in length. Our results were consistent with those of Wang J. et al. (2024), but demonstrated superior performance compared to Wang et al. (2023). This study first conducts a comprehensive assessment of ecosystem services, and then integrates the MSPA model to identify regions with high ecosystem services value as ecological sources. This approach enhances the scientific basis for the selection of ecological sources and aligns more closely with the actual conditions of the region. In the construction of the ESP for 2035, there are a total of 110 ecological sources, encompassing an area of 39,931 km2, while the total length of 268 ecological corridors is 3,553.176 km. Compared to 2020, the number of ecological sources has decreased, while their total area has increased. Conversely, the number of ecological corridors has increased, although their total length has decreased, indicating an improvement in the ecological environment.
In the YRB, the Ningxia region’s ecological sources are primarily located in the southern portion. Ecological risks are higher at the border of the northern desert (Jiang et al., 2024). The ecological source areas in the Henan section of the YRB are mostly located in the forested area in the southwest of Luoyang City (Wei et al., 2023). The ecological source areas in the Gansu section of the YRB are mostly distributed on the eastern and southern edges, with uneven and fragmented spatial distribution (Xu et al., 2023). The ecological sources in the “Jiziwan” region of the YRB are scattered and fragmented (Wei et al., 2022). However, apart from the YRB’s source area, the ecological sources in Shanxi Province are the most densely distributed, forming a unique ESP (Yan et al., 2024). The high-density forest cover in the eastern and western mountainous areas of the research area, coupled with the high number of cities and frequent human activity in the central basin area, has hindered ecological exchanges between the eastern and western regions. In addition, Shanxi Province has abundant coal resources and is a significant coal resource province in China. Long-term, large-scale, and intensive coal resource exploitation has led to land subsidence and excavation damage on the surface, which can accelerate soil erosion in local areas, exacerbate vegetation destruction, and damage the ecosystem (Wu et al., 2021). By comparing the coal mines distribution map in Shanxi Province (https://zrzyt.shanxi.gov.cn), it can be found that areas with a concentrated distribution of coal mines in the research region overlap significantly with regions of the lowest ecological environment quality grade.
Compared to 2020, the ESP in 2035, based on anticipated climate change, showed a decrease in the average values of the four ecosystem services. Among them, the water yield and soil conservation in the western region of the study area decreased most significantly. Therefore, there was a noticeable shrinkage in the identification of important areas for ecosystem services and ecological sources. Research has shown that climate change leads to varying degrees of change in the frequency and severity of regional extreme weather events (floods, storms, etc.), thereby further impacting the quality of the natural environment (Fan et al., 2022). The increase in extreme weather events caused by global warming in 2030 will pose a bigger danger to the SYRB’s natural environment quality (Fu et al., 2024).
5.2 Strategies and recommendations for ecological restoration
(1) For ecological resources, it is essential to establish key conservation areas, adjust forest structures, enhance biodiversity to increase vegetation coverage, maintain ecological functions, and ensure that these resources remain undisturbed by human activities. In addition, create buffer zones at the edges of ecological sources, increase vegetation coverage, and mitigate the effects of human activities.
(2) Based on the current ecological corridors, protection measures should be established according to the biological migration needs of different regions, providing channels for biological exchange between source areas; on the contrary, artificial ecological corridors should be developed to improve the connection between ecological sources. For the relatively dense short-distance corridors in the western part of the study area, future efforts should prioritize ecological maintenance to ensure the continuity of regional ecological connectivity. The central area, primarily composed of construction land and cultivated land, should aim to prevent the rapid expansion of construction land, which could adversely affect the spatial integrity of ecological corridors.
(3) Ecological pinch points are often vulnerable links within ecosystems. It is recommended that stringent protective measures be implemented in areas where these pinch points are located, prohibiting the conversion of land containing pinch points into non-ecological uses, thereby preventing the expansion of construction land from adversely affecting these ecological pinch points. ecological barrier points are generally situated within or in the vicinity of construction land. The areas where these ecological barrier points are situated should prioritize ecological restoration, prohibiting high-intensity and large-scale development activities.
(4) Considering the regional differences and actual situation, it is vital to increase ecological management in environmentally sensitive areas and metropolitan areas with high human activity, as well as to harmonize the interaction between economic growth and environmental conservation.
5.3 Limitations
This study used the PLUS, InVEST, and MSPA models, together with circuit theory, to identify ESPs for 2020 and 2035. However, due to the uncertainties of future climate data and future benefits, there is a certain lag in improving ecosystem services and ESPs through ecological protection and restoration measures. Long-term observation and continuous revision of ecological protection strategies are still needed. In addition, the research model selects four representative ecosystem services: water yield, habitat quality, carbon storage, and soil conservation. The exclusion of other significant ecosystem services may lead to certain discrepancies in the construction of the ESPs, which will be discussed in greater depth in subsequent research endeavors. It is essential to take into account the variations in future ESPs under different scenarios, in order to propose more precise strategies for ecological restoration and development. Additionally, data sources with varying spatial resolutions can significantly influence the results. Higher spatial resolution tends to yield more accurate outcomes. Future researches should therefore give adequate consideration to the acquisition and application of high-resolution data.
6 Conclusion
(1) From 2005 to 2035, cultivated land was the most common land use type in the SYRB, followed by forest land and grassland. From 2005 to 2020, 6,080.99 km2 of land was transferred between different types, accounting for 5.22% of the overall area of the SYRB. The overall area of land use transfer from 2020 to 2035 was 4,605.10 km2. Among these, construction and forest land expanded, increasing by 2,837.44 and 203.05 km2 from 2005 to 2020 and by 2,228.37 and 74.18 km2 from 2020 to 2035, respectively. Meanwhile, cultivated land, grassland, water, and unused land shrunk.
(2) From 2005 to 2035, the water yield and soil conservation in the SYRB fluctuated upward, while habitat quality and carbon storage decreased. The spatial distribution of ecosystem services exhibited diversity, with high-value areas mostly located in the western Lvliang Mountains, the central Taiyue Mountains, the southern Wangwu Mountains, and the Zhongtiao Mountains, where vegetation coverage was relatively high in terms of forest land and grassland. Low-value regions were mostly concentrated in basins with considerable human activity and low vegetation coverage.
(3) The impact of government initiatives for ecological protection and restoration is seen in the expansion of the ecological source areas, which went from 35,767 km2 in 2005 to 39,931 km2 in 2035. However, the phenomenon of ecological fragmentation needs to be taken seriously. The construction of the ESPs of “one axis, two zones, four corridors, and multiple points” in 2020 and “one circle, two zones, one axis, three belts, and multiple points” in 2035 provide important scientific basis and support for national land spatial planning.
Data availability statement
The original contributions presented in the study are included in the article/supplementary material, further inquiries can be directed to the corresponding author.
Author contributions
JW: Methodology, Writing–original draft. ZL: Methodology, Writing–review and editing. ZZ: Conceptualization, Writing–review and editing. QW: Writing–review and editing.
Funding
The author(s) declare that financial support was received for the research, authorship, and/or publication of this article. This research was funded by the Planning Subject of Philosophy and Social Sciences in Shanxi Province (Grant number 2023YY069), Research Project of Philosophy and Social Sciences in Shanxi Universities (Grant number 2023W048), Science and Technology Innovation Fund Project of Shanxi Agricultural University (Grant number 2020QC26), and Science and Technology Innovation Project of Colleges and Universities in Shanxi Province (2024L520).
Conflict of interest
The authors declare that the research was conducted in the absence of any commercial or financial relationships that could be construed as a potential conflict of interest.
Publisher’s note
All claims expressed in this article are solely those of the authors and do not necessarily represent those of their affiliated organizations, or those of the publisher, the editors and the reviewers. Any product that may be evaluated in this article, or claim that may be made by its manufacturer, is not guaranteed or endorsed by the publisher.
References
Baskent, E. Z. (2020). A framework for characterizing and regulating ecosystem services in a management planning context. Forests 11, 102. doi:10.3390/f11010102
Bengochea Paz, D., Henderson, K., and Loreau, M. (2020). Agricultural land use and the sustainability of social-ecological systems. Ecol. Modell. 437, 109312. doi:10.1016/j.ecolmodel.2020.109312
Bennett, E. M., Peterson, G. D., and Gordon, L. J. (2009). Understanding relationships among multiple ecosystem services. Ecol. Lett. 12, 1394–1404. doi:10.1111/j.1461-0248.2009.01387.x
Chang, K.-F., Lin, C.-T., and Bin, Y.-Q. (2024). Harmony with nature: disentanglement the influence of ecological perception and adaptation on sustainable development and circular economy goals in country. Heliyon 10, e26034. doi:10.1016/j.heliyon.2024.e26034
Chen, W., Liu, H., and Wang, J. (2024). Construction and optimization of regional ecological security patterns based on MSPA-MCR-GA Model: a case study of Dongting Lake Basin in China. Ecol. Indic. 165, 112169. doi:10.1016/j.ecolind.2024.112169
Chen, Y., Zhu, M., Lu, J., Zhou, Q., and Ma, W. (2020). Evaluation of ecological city and analysis of obstacle factors under the background of high-quality development: taking cities in the Yellow River Basin as examples. Ecol. Indic. 118, 106771. doi:10.1016/j.ecolind.2020.106771
Dai, Y. (2022). Identifying the ecological security patterns of the three gorges reservoir region, China. Sci. Pollut. Res. 29, 45837–45847. doi:10.1007/s11356-022-19173-3
Ding, M., Liu, W., Xiao, L., Zhong, F., Lu, N., Zhang, J., et al. (2022). Construction and optimization strategy of ecological security pattern in a rapidly urbanizing region: a case study in central-south China. Ecol. Indic. 136, 108604. doi:10.1016/j.ecolind.2022.108604
Doncaster, C. P., and Bullock, J. M. (2024). Living in harmony with nature is achievable only as a non-ideal vision. Environ. Sci. Policy 152, 103658. doi:10.1016/j.envsci.2023.103658
Dong, J., Zhang, Z., Liu, B., Zhang, X., Zhang, W., and Chen, L. (2022). Spatiotemporal variations and driving factors of habitat quality in the loess hilly area of the Yellow River Basin: a case study of Lanzhou City, China. J. Arid. Land 14, 637–652. doi:10.1007/s40333-022-0097-6
Fan, K., Slater, L., Zhang, Q., Sheffield, J., Gentine, P., Sun, S., et al. (2022). Climate warming accelerates surface soil moisture drying in the Yellow River Basin, China. J. Hydrol. 615, 128735. doi:10.1016/j.jhydrol.2022.128735
Fu, S. T., He, C. X., Ma, J. K., Wang, B., and Zhen, Z. L. (2024). Ecological environment quality of the Shanxi section of the Yellow River Basin under different development scenarios. J. Appl. Ecol. 35, 1337–1346. doi:10.13287/j.1001-9332.202405.027
Gao, M., Hu, Y., and Bai, Y. (2022). Construction of ecological security pattern in national land space from the perspective of the community of life in mountain, water, forest, field, lake and grass: a case study in Guangxi Hechi, China. Ecol. Indic. 139, 108867. doi:10.1016/j.ecolind.2022.108867
Gomes, E., Inácio, M., Bogdzevič, K., Kalinauskas, M., Karnauskaitė, D., and Pereira, P. (2021). Future land-use changes and its impacts on terrestrial ecosystem services: a review. Sci. Total Environ. 781, 146716. doi:10.1016/j.scitotenv.2021.146716
González, E., Rossetti, M. R., Moreno, M. L., Bernaschini, M. L., Cagnolo, L., Musicante, M. L., et al. (2024). “Habitat loss and fragmentation in chaco forests: a review of the responses of insect communities and consequences for ecosystem processes,” in In insect decline and conservation in the neotropics. Editors J. L. León-Cortés, and A. Córdoba-Aguilar (Cham: Springer International Publishing), 129–162.
Guo, H., Song, X., Leng, P., Zhu, X., Hu, R., Guo, D., et al. (2024a). Higher water ecological service values have better network connectivity in the middle Yellow River basin. Ecol. Indic. 160, 111797. doi:10.1016/j.ecolind.2024.111797
Guo, Z., Hu, Y., and Bai, Y. (2024b). How to achieve ecological control zoning based on ecological security pattern (ESP)? A case study of China’s coastal areas. Environ. Earth Sci. 83, 57. doi:10.1007/s12665-023-11362-8
Hasan, S. S., Zhen, L., Miah, M. G., Ahamed, T., and Samie, A. (2020). Impact of land use change on ecosystem services: a review. Environ. Dev. 34, 100527. doi:10.1016/j.envdev.2020.100527
Huang, Y., Zhang, J., Zhang, P., Chen, Z., Zhang, X., Lu, R., et al. (2023). Construction and optimization of ecological security pattern based on landscape ecological risk assessment in the affected area of the Lower Yellow River. Front. Ecol. Evol. 11. doi:10.3389/fevo.2023.1271352
Jafari, R., and Abedi, M. (2021). Remote sensing-based biological and nonbiological indices for evaluating desertification in Iran: image versus field indices. Land Degrad. Dev. 32, 2805–2822. doi:10.1002/ldr.3958
Jiang, H., Peng, J., Liu, M., Dong, J., and Ma, C. (2024). Integrating patch stability and network connectivity to optimize ecological security pattern. Landsc. Ecol. 39, 54. doi:10.1007/s10980-024-01852-w
Jiang, Y., Huang, M., Chen, X., Wang, Z., Xiao, L., Xu, K., et al. (2021). Identification and risk prediction of potentially contaminated sites in the Yangtze River Delta. Sci. Total Environ. 815, 151982. doi:10.1016/j.scitotenv.2021.151982
Lautenbach, S., Kugel, C., Lausch, A., and Seppelt, R. (2011). Analysis of historic changes in regional ecosystem service provisioning using land use data. Ecol. Indic. 11, 676–687. doi:10.1016/j.ecolind.2010.09.007
Li, Y., Zhang, L., Qiu, J., Yan, J., Wan, L., Wang, P., et al. (2017). Spatially explicit quantification of the interactions among ecosystem services. Landsc. Ecol. 32, 1181–1199. doi:10.1007/s10980-017-0527-6
Liang, X., Guan, Q., Clarke, K. C., Liu, S., Wang, B., and Yao, Y. (2021). Understanding the drivers of sustainable land expansion using a patch-generating land use simulation (PLUS) model: a case study in Wuhan, China. Urban Syst. 85, 101569. doi:10.1016/j.compenvurbsys.2020.101569
Liu, Z., Chang, Y., Pan, S., Zhang, P., Tian, L., and Chen, Z. (2024). Unfolding the spatial spillover effect of urbanization on composite ecosystem services: a case study in cities of Yellow River Basin. Ecol. Indic. 158, 111521. doi:10.1016/j.ecolind.2023.111521
Luo, K., Wang, H., Yan, X., Yi, S., Wang, C., and Lei, C. (2024). Integrating CVOR and circuit theory models to construct and reconstruct ecological networks: a case study from the Tacheng-Emin Basin, China. Ecol. Indic. 165, 112170. doi:10.1016/j.ecolind.2024.112170
Natural Capital Project (2024). InVEST 0.0. Available at: https://naturalcapitalproject.stanford.edu/software/invest (Accessed May 23, 2024).
Newton, A. C., Coward, F., Elliott, S., Jenkins, E., Linden, M. V., Riris, P., et al. (2024). Understanding long-term human ecodynamics through the lens of ecosystem collapse. Holocene 34, 1439–1453. doi:10.1177/09596836241259785
Pessacg, N., Flaherty, S., Brandizi, L., Solman, S., and Pascual, M. (2015). Getting water right: a case study in water yield modelling based on precipitation data. Sci. Total Environ. 537, 225–234. doi:10.1016/j.scitotenv.2015.07.148
Piyathilake, I. D. U. H., Udayakumara, E. P. N., Ranaweera, L. V., and Gunatilake, S. K. (2022). Modeling predictive assessment of carbon storage using InVEST model in Uva province, Sri Lanka. Earth Syst. Environ. 8, 2213–2223. doi:10.1007/s40808-021-01207-3
Qiu, M., Yang, Z., Zuo, Q., Wu, Q., Jiang, L., Zhang, Z., et al. (2021). Evaluation on the relevance of regional urbanization and ecological security in the nine provinces along the Yellow River, China. Ecol. Indic. 132, 108346. doi:10.1016/j.ecolind.2021.108346
Rodríguez, J. P., Beard, T. D., Bennett, E. M., Cumming, G. S., Cork, S. J., Agard, J., et al. (2006). Trade-offs across space, time, and ecosystem services. Ecol. Soc 11, art28. doi:10.5751/es-01667-110128
Saad, S. I., Mota da Silva, J., Silva, M. L. N., Guimarães, J. L. B., Sousa Júnior, W. C., Figueiredo, R. d.O., et al. (2018). Analyzing ecological restoration strategies for water and soil conservation. PloS One 13, e0192325. doi:10.1371/journal.pone.0192325
Sallustio, L., De Toni, A., Strollo, A., Di Febbraro, M., Gissi, E., Casella, L., et al. (2017). Assessing habitat quality in relation to the spatial distribution of protected areas in Italy. Environ. Manage. 201, 129–137. doi:10.1016/j.jenvman.2017.06.031
Saura, S., and Pascual-Hortal, L. (2007). A new habitat availability index to integrate connectivity in landscape conservation planning: Comparison with existing indices and application to a case study. Urban Plan. 83, 91–103. doi:10.1016/j.landurbplan.2007.03.005
Shifaw, E., Sha, J., Li, X., Bao, Z., Ji, J., Huang, J., et al. (2024). Spatiotemporal dynamics of ecological security pattern based on an optimized assessment framework and circuit theory: a case of Fuzhou City, China. Hum. Ecol. Risk Assess. 30, 352–377. doi:10.1080/10807039.2024.2358317
Terrado, M., Sabater, S., Chaplin-Kramer, B., Mandle, L., Ziv, G., and Acuna, V. (2016). Model development for the assessment of terrestrial and aquatic habitat quality in conservation planning. Sci. Total Environ. 540, 63–70. doi:10.1016/j.scitotenv.2015.03.064
Tian, H., Wang, H., Lyu, X., Li, X., Yang, Y., Zhang, Y., et al. (2024). Construction and optimization of ecological security patterns in Dryland watersheds considering ecosystem services flows. Ecol. Indic. 159, 111664. doi:10.1016/j.ecolind.2024.111664
Tiando, D. S., Hu, S., Fan, X., and Ali, M. R. (2021). Tropical coastal land-use and land cover changes impact on ecosystem service value during rapid urbanization of Benin, west africa. Res. Public Health 18, 7416. doi:10.3390/ijerph18147416
Vogt, P., Riitters, K. H., Estreguil, C., Kozak, J., Wade, T. G., and Wickham, J. D. (2007). Mapping spatial patterns with morphological image processing. Landsc. Ecol. 22, 171–177. doi:10.1007/s10980-006-9013-2
Wang, B., Fu, S., Hao, Z., and Zhen, Z. (2024a). Ecological security pattern based on remote sensing ecological index and circuit theory in the Shanxi section of the Yellow River Basin. Ecol. Indic. 166, 112382. doi:10.1016/j.ecolind.2024.112382
Wang, J., Li, Y., Wang, S., Li, Q., Li, L., and Liu, X. (2023). Assessment of multiple ecosystem services and ecological security pattern in Shanxi province, China. Int. J. Environ. Res. Public Health 20, 4819. doi:10.3390/ijerph20064819
Wang, J., Lv, Z., Cao, Y., Wang, S., and Zhen, Z. (2024b). Spatial-temporal evolution and influencing factors of ecological resilience in urban agglomerations: a case study of Shanxi section of the Yellow River Basin. Fron. Environ. Sci. 12, 1385604. doi:10.3389/fenvs.2024.1385604
Wei, H., Wang, Y., Liu, J., Zhang, J., and Cao, Y. (2023). Coordinated development of cultivated land use and ecological protection in cities along the main stream of the Yellow River in Henan Province, China. Ecol. Indic. 156, 111143. doi:10.1016/j.ecolind.2023.111143
Wei, L., Zhou, L., Sun, D., Yuan, B., and Hu, F. (2022). Evaluating the impact of urban expansion on the habitat quality and constructing ecological security patterns: a case study of Jiziwan in the Yellow River Basin, China. Ecol. Indic. 145, 109544. doi:10.1016/j.ecolind.2022.109544
Wu, D., Zheng, L., Wang, Y., Gong, J., Li, J., and Chen, Q. (2024). Dynamics in construction land patterns and its impact on water-related ecosystem services in Chengdu-Chongqing urban agglomeration, China: a multi-scale study. J. Clean. Prod. 143022, 143022. doi:10.1016/j.jclepro.2024.143022
Wu, W., Zhou, J., Niu, J., and Lv, H. (2021). Study on coupling between mineral resources exploitation and the mining ecological environment in Shanxi Province. Environ. Dev. Sustain. 23, 13261–13283. doi:10.1007/s10668-020-01209-8
Xu, J., Liao, X., Gan, Q., and Zhou, M. (2023). Construction of ecological security pattern based on MSPA and circuit theory in Gansu section of the Yellow river basin. Ecol. Environ. 32, 805. doi:10.16258/j.cnki.1674-5906.2023.04.018
Yan, J., Qiao, H., Li, Q., Song, M., Yao, X., Gao, P., et al. (2024). Landscape ecological risk assessment across different terrain gradients in the Yellow River Basin. Fron. Environ. Sci. 11. doi:10.3389/fenvs.2023.1305282
Zhang, B., Cao, J., Chen, D., Li, X., Liu, Y., Wang, J., et al. (2024a). Construction of watershed ecological security patterns with integrated of spatial variability: a case study of the Yellow River Basin, China. Ecol. Indic. 159, 111663. doi:10.1016/j.ecolind.2024.111663
Zhang, S., Xiong, K., Min, X., and Zhang, S. (2024b). Demographic shrinkage promotes ecosystem services supply capacity in the karst desertification control. Sci. Total Environ. 917, 170427. doi:10.1016/j.scitotenv.2024.170427
Zhao, Y., He, L., Bai, W., He, Z., Luo, F., and Wang, Z. (2024). Prediction of ecological security patterns based on urban expansion: a case study of Chengdu. Ecol. Indic. 158, 111467. doi:10.1016/j.ecolind.2023.111467
Zhou, G., Huan, Y., Wang, L., Lan, Y., Liang, T., Shi, B., et al. (2023). Linking ecosystem services and circuit theory to identify priority conservation and restoration areas from an ecological network perspective. Sci. Total Environ. 873, 162261. doi:10.1016/j.scitotenv.2023.162261
Keywords: ecological security pattern, ecosystem services, land use, ecological source, Yellow River Basin
Citation: Wang J, Lv Z, Zhen Z and Wu Q (2024) Evolution of the ecological security pattern of the Yellow River Basin based on ecosystem services: a case study of the Shanxi section, China. Front. Environ. Sci. 12:1477843. doi: 10.3389/fenvs.2024.1477843
Received: 14 August 2024; Accepted: 14 October 2024;
Published: 25 October 2024.
Edited by:
Christopher Lant, Utah State University, United StatesReviewed by:
Weifeng Gong, Qufu Normal University, ChinaHuiqing Han, Guizhou Institute of Technology, China
Copyright © 2024 Wang, Lv, Zhen and Wu. This is an open-access article distributed under the terms of the Creative Commons Attribution License (CC BY). The use, distribution or reproduction in other forums is permitted, provided the original author(s) and the copyright owner(s) are credited and that the original publication in this journal is cited, in accordance with accepted academic practice. No use, distribution or reproduction is permitted which does not comply with these terms.
*Correspondence: Zhilei Zhen, emhlbmNoZW5nQHN4YXUuZWR1LmNu