 Subodh Kumar
 Saurabh Verma
 Abhishek Lodh
94% of researchers rate our articles as excellent or good
Learn more about the work of our research integrity team to safeguard the quality of each article we publish.
Find out more
ORIGINAL RESEARCH article
Front. Environ. Sci., 20 February 2025
Sec. Atmosphere and Climate
Volume 12 - 2024 | https://doi.org/10.3389/fenvs.2024.1475324
This article is part of the Research TopicApplication of Artificial Intelligence-Supported Process-Based Climate Models to Understand the Atmosphere/Weather Patterns and Their PredictionView all 6 articles
Tropical cyclone (TC) is a rapidly intensifying storm over warm water of oceans, critically studied for its potential to inflict severe damage and pose life-threatening hazards. The present study focuses on exploring the pre- and post-cyclone characteristics of TC Amphan and Nisarga using ECMWF Reanalysis v5 (ERA5) reanalysis. Our analysis reveals that the TC features, such as its intensity, life cycle, wind circulations, the warm-core structure evolution, and the related environmental factors, are consistent with India Meteorological Department observations. The presented results have indicated that maximum sustainable wind speed, central sea level pressure, lower troposphere temperature and lower stratosphere temperature along the radius from the TC center create a favourable condition that eventually leads to the formation and intensification of super and severe cyclonic storms, for example, Amphan and Nisarga, respectively. The analysis suggests that the atmospheric instability, TC formation, development, and energy for intensification are controlled mainly by the warmer-than-average Arabian Sea and Bay of Bengal basin sea surface temperature anomalies in the Indian Ocean region. The results indicated that the TC genesis and movement are well captured by ERA5, close to the observed best tracks provided by the India Meteorological Department, with an RMSE of ∼31 km. The vorticity budget analysis illustrates that in the developing and mature stages of TC, the tilting term converts horizontal vorticity into vertical vorticity via upward motion. During the dissipation phase, the tilting term reverses, resulting in a fall in vertical vorticity, which weakens or dissipates the TC intensity. Overall, the circulation pattern appears to reproduce most of the essential characteristics of the mature stage of TCs, like the eye and eyewall, highlighting the importance of near real-time high-resolution reanalysis datasets for exploring the details of extreme events.
Synoptic scale events are weather systems that ranges between 200–2000 km and temporal scale ranging from a few hours to many days. Mesoscale atmospheric systems are weather systems with spatial scale ranging from 1 to 1,000 km and temporal scale ranging from a few hours to many days. They exist between larger-scale (synoptic) systems, such as low-pressure fronts, and smaller-scale (microscale) phenomena, such as turbulence. Examples of mesoscale atmospheric systems are convective systems, sea and land breezes, mountain-valley winds and urban heat islands (Wang et al., 2022). Tropical cyclones (TCs) are meso-alpha weather system because its spatial scale usually falls within 1000 km. Among all the examples mentioned, mesoscale atmospheric systems influence TCs and play a pivotal role in shaping TC development, intensity, and path, significantly impacting their genesis and intensification (Houze Jr, 2014). TCs are generally categorized as intense and severe weather systems, defined by cyclostrophic rotating low-vorticity weather systems that form over the tropical ocean (Mohapatra et al., 2012; Jaiswal and Ali, 2018). The North Indian Ocean (NIO), which includes the Arabian Sea (AS) and the Bay of Bengal (BOB) rim, is responsible for 6% of all TCs, causing significant societal impact over the coastal land regions (Mohanty et al., 2015). TCs have a complicated vertical structure with a warm core and high vertical wind shear. Previous investigation suggests that TC development and intensity have been connected to rising sea surface temperature (SST) in recent decades (Emanuel, 1986; Emanuel, 2005; Trenberth, 2007; Balaji et al., 2020; Kumar et al., 2021). Murakami et al. (2013) observed that warming in the NIO strengthens the intensity of TCs by increasing ocean-atmosphere heat energy transfer.
The advances in numerical simulations (Kimball and Dougherty, 2006; Gentry and Lackmann, 2010; Kumar et al., 2024) and observational studies on TCs have highlighted the critical role of planetary boundary layer (PBL) dynamics in improving our understanding of TCs, especially in terms of horizontal-vertical resolution and lower-layer distribution (Qiu et al., 2010). The vertical structure of TCs, including temperature, moisture, and wind fields, is critical to their intensification and persistence. Braun and Tao (2020) and Rogers et al. (2003) indicated that the correct vertical structures in NWP models and reanalysis datasets can significantly enhance intensity forecasts and better capture the complex dynamics within the rain bands and eyewall. A clear understanding of the TC vertical structure is critical because it influences the cyclone’s intensity and predictability, emphasizing the importance of vertical wind shear and thermodynamic profiles in TC behavior, as found in previous studies by Molinari and Vollaro (2010), Montgomery and Smith (2017) and Tang and Emanuel (2012). Previous studies highlighted the necessity for improved early warning systems, disaster preparedness, and climate adaptation strategies in coastal regions (Bhowmick et al., 2020; Ghosh et al., 2021) and were compounded by the concurrent COVID-19 pandemic, creating additional challenges for disaster management (Majumdar and Dasgupta, 2020; Mondal et al., 2020; 2022; Belasen and Polachek, 2021; O'Connor et al., 2021). The primary goal of this research is to assess the meteorological and oceanic variables that cause instability and increased TC severity and transition from deep depression to severe storms. This analysis aims to provide valuable insights into how varying storm intensities impact TC dynamical variability with associated environmental factors and energy indices at different TCs phases. The TC dynamics regarding vertical structure have not received enough attention, particularly in the NIO region, is the primary focus of the current research. The other focus of our study is to investigate the vorticity budget and diabatic heating terms of TCs under consideration for the study. Vorticity is a useful proxy for the divergence and convergence of air masses in a tropospheric column (this is because vorticity in fluids is similar to angular momentum in solids). Hence, we aim to understand the dynamics of TCs with an aim to help in prediction of localized weather more accurately, improving early warnings and disaster preparedness. The considered case studies are discussed in detail in the next Section 2.
The Indian subcontinent faced two significant TCs in 2020 named “Amphan” and “Nisarga.” Amphan was formed in the BOB, and Nisarga in the AS. Both cyclones were severely devastating on the Indian coast especially during the time of the COVID-19 pandemic and caused significant socioeconomic losses in June (Bhowmick et al., 2020; Dube et al., 2021). The life cycle of TCs typically involves several distinct stages, including formation, intensification, mature phase, and decay. Amphan and Nisarga are designated as super cyclones and severe cyclones per India Meteorological Department (IMD) criteria, respectively. The detailed information of TCs is mentioned in Sections 2.1, 2.2, respectively.
According to some studies (RMSC Report, 2020; Hassan et al., 2020; Halder et al., 2021), Amphan originated from a low-pressure system over the southeast BOB on May 13th, intensifying rapidly into a depression by May 16th and further strengthening into a cyclonic storm later that day. By May 18th, it had escalated into a super cyclonic storm, maintaining this intensity for nearly 24 h before weakening into an extremely severe cyclonic storm on May 19th. Amphan had approached West Bengal, Odisha, and parts of Bangladesh, diminished to a Very Severe Cyclonic Storm, and made landfall in the Sundarbans region on May 20th with winds approaching nearly 150–170 km/h, strengthening to 185 km/h (Pramanik et al., 2021; Ghosh et al., 2021). After crossing land, it dissipated into a well-marked low-pressure area over north Bangladesh and neighboring regions by the night of May 21st and has significantly impacted the coastal areas, causing many fatalities and economic loss (Kotal et al., 2021; Singh et al., 2021; Behera et al., 2022).
The IMD RMSC Report (2020) and Dube et al. (2021) reports that the severe cyclonic storm Nisarga originated from a low-pressure system that developed in 2020 over the southeast AS in the early hours of May 31st. By the following day, June 1st, it had coalesced into a depression over the east-central AS. Rapid intensification ensued, with the system being upgraded to a cyclonic storm by noon on June 2nd and by the morning of June 3rd, it had further strengthened into a severe cyclonic storm. The storm’s trajectory led it to cross the Maharashtra coast, near the south of Alibagh, between 0 and 3 h IST on June 3rd, maintaining its status as a severe cyclonic storm. Subsequently, it dissipated into a low-pressure area over southeast Uttar Pradesh and adjoining Bihar by the afternoon of 5 June 2020. Thus, it is notable for directly impacting infrastructure and transportation in Mumbai and the Maharashtra region (Kotal et al., 2021; Ray et al., 2021), with a significant impact on coastal climates (Singh and Roxy, 2022; Ahammed et al., 2023). The third section gives an overview of the datasets and methodologies used. The fourth section discusses predicted results. The fifth section contains the summary and conclusions, which analyses the study findings and the corresponding implications.
The study focuses on the NIO region, which includes the AS and BOB. This region has complicated weather and has been regularly hit by TCs, which have increased in intensity in recent decades (Singh et al., 2001). For our analysis in the study fifth generation European reanalysis dataset is used. The ECMWF Reanalysis v5 (ERA5) data (Hersbach et al., 2023) outperforms the previous reanalysis ERA-Interim datasets with its extensive vertical levels by the Integrated Forecasting System since 2016. The ERA5 data is downloaded from the ECMWF’s CDS Copernicus portal: https://cds.climate.copernicus.eu/) with 31 km of spatial resolution and hourly temporal resolution (Hersbach et al., 2023).
The TC Track, central sea level pressure (CSLP), and maximum surface wind speed (MSW or Vmax) calculated from ERA5 reanalysis are validated with the Indian Meteorological Department’s (IMD) best track observations (https://rsmcnewdelhi.imd.gov.in/). The Joint Typhoon Warning Centre (JTWC) also has an archive of TC best track data (http://www.metoc.navy.mil/jtwc/jtwc.html/north-indian-ocean), which is used in our work additionally. JTWC and IMD best-track data comprise primary information about the center locations of NIO TCs, their intensities (in m/sec), and CSLP (in hPa) in six-hour intervals (Dvorak, 1975). The estimated TC center, CSLP (also called as mean sea level pressure, MSLP), MSW, and vector displacement errors for the life span of cyclones Amphan and Nisarga, respectively, are calculated from ERA5 reanalysis (Supplementary Tables S1, S2). These tables highlight the accuracy and discrepancies in tracking the TC’s core parameters throughout their duration. The study also analyses the vertical variation of atmospheric parameters especially vorticity budget, potential vorticity, and diabatic heating terms, as well as their different conditions during all the cyclonic stages. Thus, the spatial distribution of the east-west cross-section of horizontal wind speed (m/sec), outgoing longwave radiation (OLR), relative vorticity, equivalent potential temperature, cloud parameters (including cloud rainwater content, water vapour mixing ratio, cloud liquid water content, and cloud ice water content), vertically integrated moisture divergence, and relative humidity (RH) over the 100 km of radius from the storm center has been examined. The influencing parameters include atmospheric and oceanic environments, averaged over the NIO Region. The estimated area-average values of lower troposphere temperature (LTT) and lower stratosphere temperature (LST) are calculated from the ERA5 datasets. The LTT is defined as the average temperature between 1,000 and 700 hPa, and the LST represents the temperature at 70 hPa (Emanuel et al., 2013; Balaji et al., 2018).
Further, the most suitable cyclone energy metrics like accumulated cyclone energy (ACE) and power dissipative index (PDI) are estimated from the IMD and JTWC best track datasets, which analyze the long-term variability of TC dynamical characteristics. According to Kumar et al. (2022), ACE and PDI are adequate indicators of TC activity. They can be calculated using MSW values over an ocean basin over a year, including the NIO. ACE is calculated by summing the squares of the storm’s MSW (in knots) observed every 6 h. The mathematical representations for ACE and PDI are as follows:
Vmax is represented as the MSW (1 knot ≈ 0.514 m/s) of TC at every 6-h interval. The contributions of ACE Equation 1, PDI Equation 2, and critical environmental variables (Tables 1–3) for Amphan, Nisarga, and all 2020 TCs, are discussed briefly in the next section.
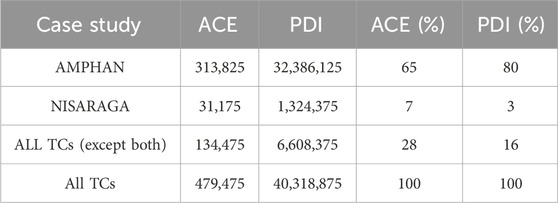
Table 1. Contribution of ACE and PDI for Amphan, Nisarga, and all 2020 TCs, using JTWC data.
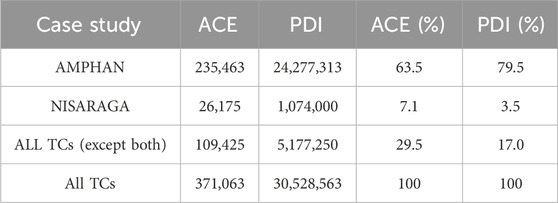
Table 2. Contribution of ACE and PDI for Amphan, Nisarga, and all 2020 TCs using ERA5 data.
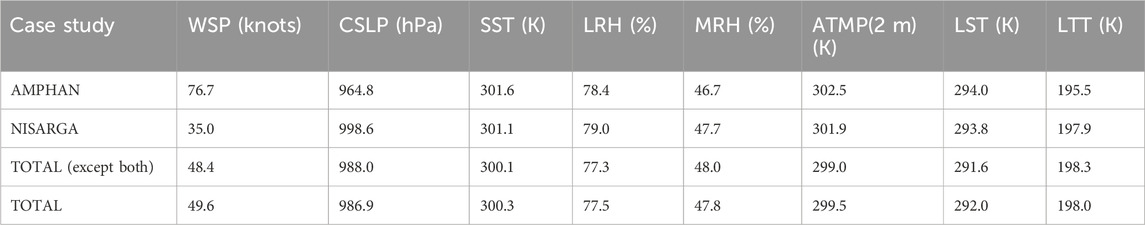
Table 3. Contribution of Environmental Variables for Amphan, Nisarga, and all 2020 TCs using ERA5 reanalysis.
The vorticity advection that is associated with atmospheric processes like TCs, which is the transport of meteorological quantity (e.g., temperature, moisture, vorticity) by the wind (Douglas, 1992; Kutty and Gohil, 2017; Lodh et al., 2022; Raymond and López Carrillo, 2011; Shu et al., 2022) will also be studied. To determine the distribution of vertical ascent from the transport of vorticity (neglecting friction and subgrid-scale processes), we compute all the terms in the vorticity budget in Cartesian coordinates (x, y, z):
where, absolute vorticity, η = ζ + f = relative vorticity + planetary vorticity.
On the right-hand side of Equation 3, the first term is divergence or stretching term, the second term is called tilting term and the third term is called solenoidal term. The term on left hand side is the rate of change of vertical component of absolute vorticity following the flow, called absolute vorticity tendency. The strength of the vortex in any cyclonic circulation like TCs is measured by the vorticity ζ over an area. Hence, after some algebraic rearrangements (neglecting the solenoidal term) the Equation 3 can be written as,
The Equation 4 shows that the vorticity tendency is primarily contributed by five terms:
(a) Horizontal advection term =
(b) Vertical advection of relative vorticity =
(c) Divergence term =
(d) Tilting term =
(e) Advection of planetary vorticity =
The first two terms (a) and (b) of Equation 4 tells that total vorticity advection is defined as meridional advection of planetary vorticity and vertical advection of relative vorticity. The divergence term (term c) represents the impact of horizontal divergence or convergence on the absolute vorticity. The tilting term (term d) represents the tilting or twisting of vorticity between horizontal and vertical components. The solenoidal term comes into effect when the atmosphere is baroclinic and vorticity change results from differential horizontal accelerations imposed by horizontal variations in the pressure-gradient force, but in the analysis conducted in our work the solenoidal term is neglected. The diabatic heat budget is also studied for the TCs under study. The thermodynamic energy (diabatic heating) equation (Veiga et al., 2005; Routray et al., 2023) is given below:
where, Q is the heating term obtained from the contributions by turbulent heat transfer and molecular conduction, latent heat release and radiative processes. T is the temperature,
The current study examines the features of the TCs Amphan and Nisarga concerning several environmental parameters. This improves our understanding of the physical and dynamic components of extreme weather events in the NIO area. As a result, the study proposes variability in atmospheric and oceanic metrics such as MSW, CSLP, SST, RH, air temperature (ATMP), LTT, LST (lower stratospheric temperature), ACE, PDI and then derives connections between these parameters.
This analysis aims to provide valuable insights into how varying storm intensities affect structural characteristics, including horizontal and vertical variability. Figure 1A depicts the track of the Amphan and Nisarga cyclones in the NIO region. Figures 1B, C present the deviation in track magnitude for both the Amphan and Nisarga cyclones compared to observations from the IMD. This figure highlights the difference between the ERA5 and IMD’s best track data at six hourly points along the cyclones’ paths. The root means square error and standard deviation for the track of the Amphan cyclone, relative to IMD observations, are found to be 31.15 km and 19.24 km, respectively. Similarly, for the Nisarga cyclone, these values are found to be 31.27 km and 18.52 km, demonstrating a reasonably close match. Previous studies (Mohapatra et al., 2021; Kumar et al., 2022) reveal that the (MSW and CSLP of cyclone eye are critical parameters used to categorize the intensity of a TC (and thus potential for damage) and shows high correlation (negative) with each other. Figure 2 indicates the temporal variation of MSW (m/sec) and CSLP (hPa) from ERA5 reanalysis and IMD observations for both cases of cyclones. The RMSE in MSW and CSLP is 11.58 m/s and 15.55 hPa (8.66 m/s, 3.46 hPa) for the Amphan (and Nisarga) TC, respectively. The standard deviation is 9.58 m/s and 15.47 hPa (4.12 m/s, 6.07 hPa) for the Amphan (Nisarga) TC, respectively. Thus, the values of RMSE and standard deviation are comparable and reasonable. The maximum variation in the Amphan cyclone is found in its rapidly intensified stage during 18–19th May 2020, whereas on 3rd June 2020 for the Nisarga cyclone. The mean track error in ERA5 reanalysis is ∼ 31 km during the life span of the Amphan and Nisarga cyclones (see Supplementary Tables S1, S2), ranging between 2 and 88 km for both cases. The TC track error shows that the ERA5 reanalysis is not influenced by any systematic error and can be considered for the statistical and dynamic analysis of the TC development.
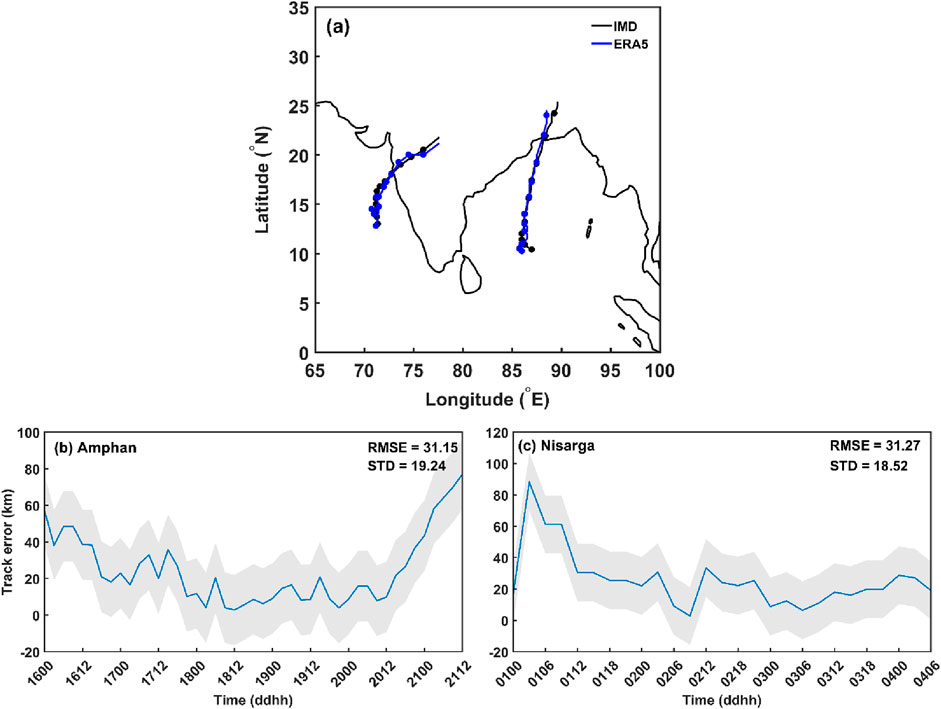
Figure 1. (A) Amphan (in the Bay of Bengal) and Nisarga (in Arabia Sea) cyclone track from ERA5, and track error in km for (B) Amphan TC (C) Nisarga TC compared with IMD best track observations.
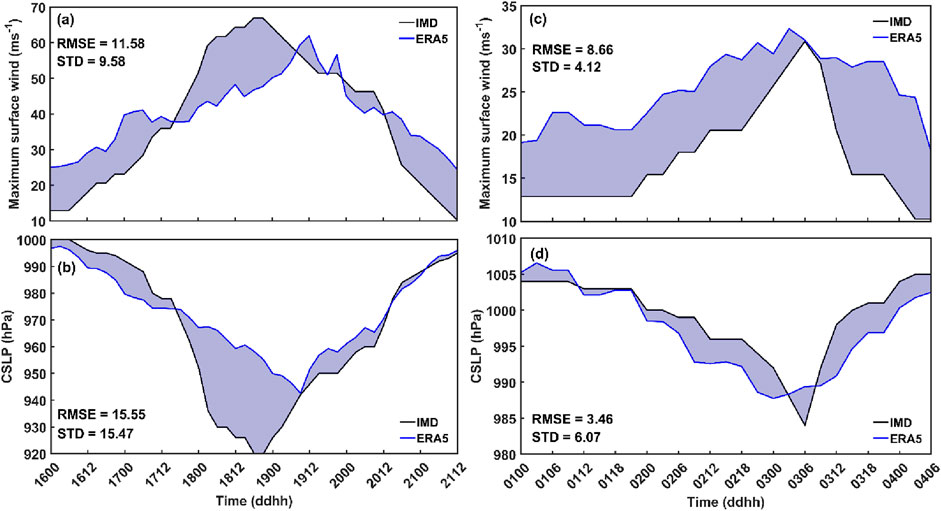
Figure 2. Time series of (A, C) maximum sustainable surface wind (MSW; m/sec) and (B, D) central sea level pressure (CSLP) in hPa with the comparison of IMD data sets for TC Amphan and Nisarga.
Several research studies have investigated the relationship between horizontal wind speed and TCs over India (such as Mohanty et al., 2012; Mohapatra et al., 2015). The study also found that the horizontal wind speed can provide crucial information on the potential intensification of a TC, reveals larger TCs tend to have higher wind speeds. Figures 3A–F demonstrates the spatial distribution of the east-west cross-section of horizontal wind speed (m/sec) for Amphan through the center of the cyclone at 12 UTC for (a) 16-May, (b) 17-May, (c) 18-May, (d) 19-May, (e) 20-May, and (f) 21-May. Similarly, Figure 4 shows the spatial distribution of the east-west cross-section of horizontal wind speed through the center of the cyclone at 12 UTC on (a) 01-Jun, (b) 02-Jun, and (c) 03-Jun for Nisarga. The wind variation is well captured during the intensification of both cyclones (Figures 3C, D). However, the vertical depiction from lower to upper level shows rapid intensification of winds during the mature stage of both the cyclones with slightly stronger winds near the cyclone’s eyewall. On 19th May around 87° E we can see a dipole like structure in vertical variation of wind, which is not prominent in the case of Nisarga TC.
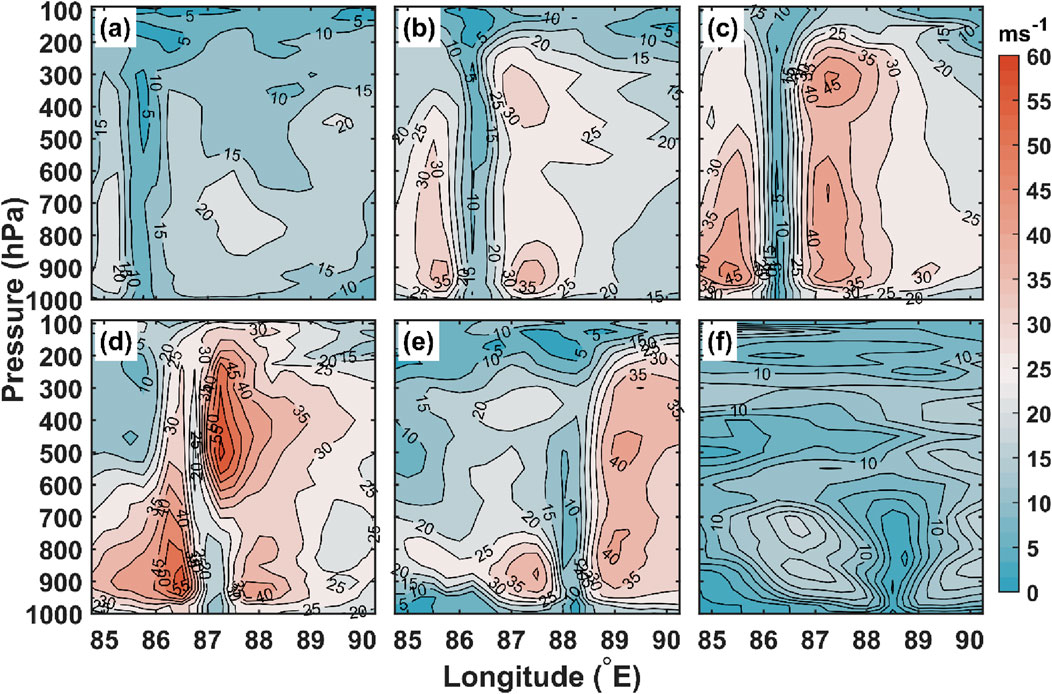
Figure 3. East-west cross-section of horizontal wind speed (m/sec) through the center of the cyclone at 12 UTC on (A) 16-May, (B) 17-May, (C) 18-May, (D) 19-May, (E) 20-May, and (F) 21-May for Amphan.
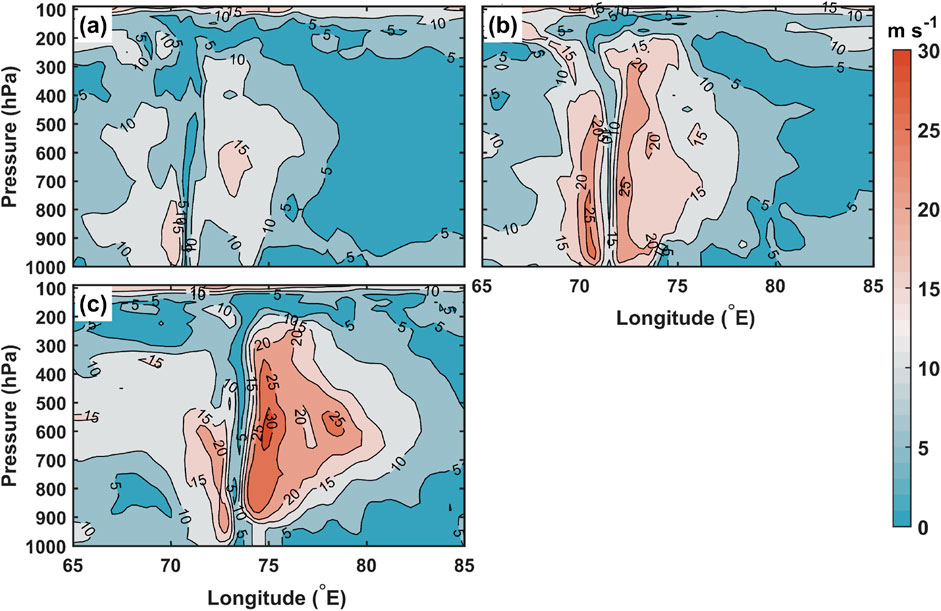
Figure 4. East-west cross-section of horizontal wind speed (m/sec) through the center of the cyclone at 12 UTC on (A) 01-Jun, (B) 02-Jun, and (C) 03-Jun for Nisarga.
Tangential wind within TCs is defined as the horizontal wind component circulating the cyclone’s center, perpendicular to the radial direction, a characteristic elucidated in prior research (Emanuel, 1994; Smith et al., 2015; Holland, 1993). It is a key parameter used to describe the structure of the TC, as well as its intensity and size. In Figure 5, the radius (degree)-height (hPa) cross-section of tangential wind (m/sec) at 12 UTC (a) 16-May, (b) 17-May, (c) 18-May, (d) 19-May, (e) 20-May, and (f) 21-May for Amphan TC is shown. Figure 6 is similar to that at 12 UTC on (a) 01-Jun, (b) 02-Jun, and (c) 03-Jun for Nisarga. From the figure, it is observed that the tangential winds are stronger in the lower-levels which is the inflow region extending vertically up during the cyclone. The strong tangential winds varying horizontally in a radius of about 250 km shows a large zone of maximum wind speed extending vertically and horizontally compared to the cyclone’s outer radius (400–1,000 km) region.
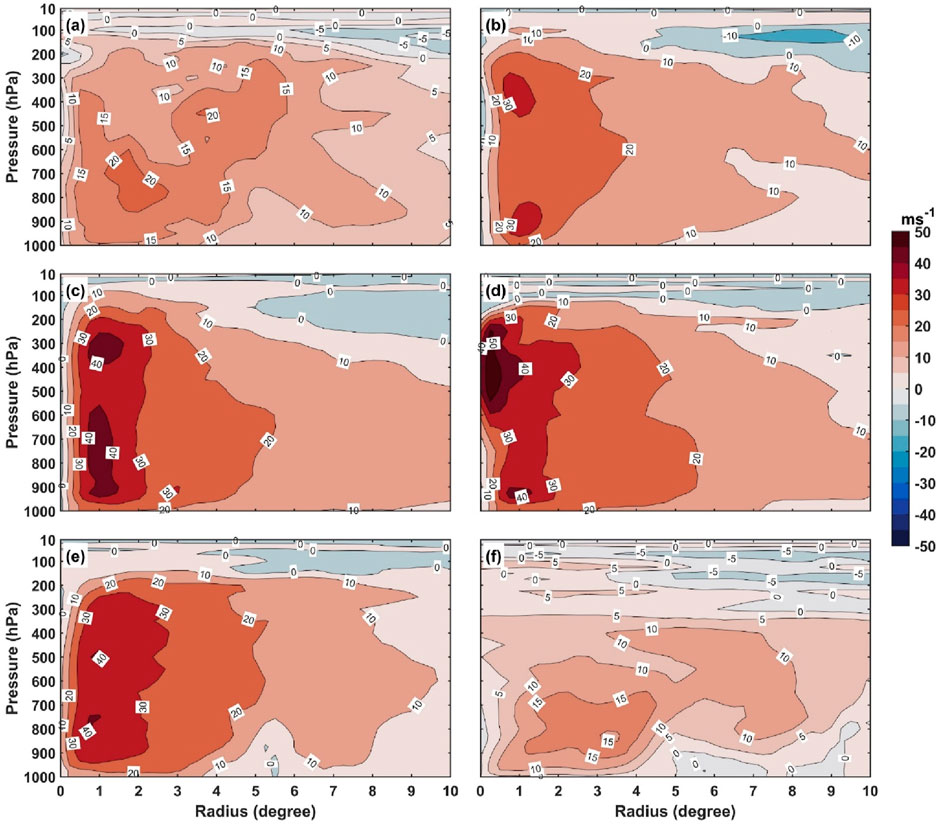
Figure 5. Radius (degree)-height (hPa) cross section of tangential wind (m/sec) from the TC center at 12 UTC on (A) 16-May, (B) 17-May, (C) 18-May, (D) 19-May, (E) 20-May, and (F) 21-May for TC Amphan.
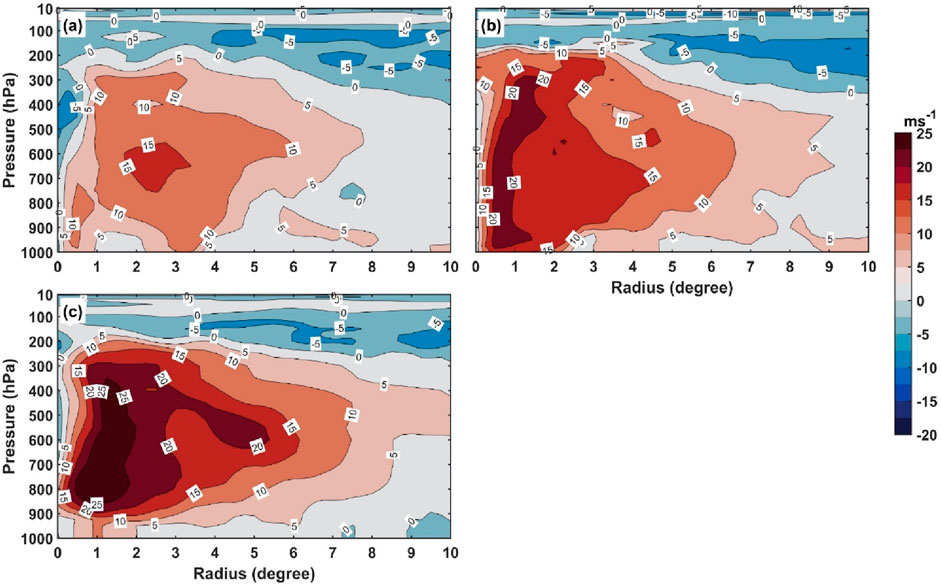
Figure 6. Radius (degree)-height (hPa) cross section of tangential wind (m/sec) from the TC center at 12 UTC on (A) 01-Jun, (B) 02-Jun, and (C) 03-Jun for Nisarga.
Figure 7 indicates the radius (degree)-height (hPa) cross section of radial wind (m/sec) at 12 UTC of (a) 16-May, (b) 17-May, (c) 18-May, (d) 19-May, (e) 20-May, and (f) 21-May for Amphan TC, whereas Figure 8 suggests the radius (degree)-height (hPa) cross section of radial wind (m/sec) at 12 UTC on (a) 01-Jun, (b) 02-Jun, and (c) 03-Jun for Nisarga TC. Figures 7, 8 show that the distribution of averaged radial winds exhibits a typical secondary circulation, an intense radial outflow in the upper layer (about 300 hPa) on 20th- and 21st -May, a strong radial inflow in the bottom level (about 200 km radius) upto 500 hPa and a weak outflow above the top level through the center of the cyclone for both TC cases. Strong radial winds at lower pressure levels suggest that the core’s significant convergence and concentrated warming promoted the TC’s intense vertical motion and strengthened its intensity (Ma et al., 2012). This feature is also corroborated from Supplementary Figures S3, S4, which shows the spatial distribution of equivalent potential temperature with radius-height (hPa) cross section of tangential wind. Kumar et al., 2021; 2022 have previously explored how storm intensities impact structural characteristics using radial parameters and wind intensity.

Figure 7. Radius (degree)-height (hPa) cross section of radial wind (m/sec) from the TC center at 12 UTC on (A) 16-May, (B) 17-May, (C) 18-May, (D) 19-May, (E) 20-May, and (F) 21-May for TC Amphan.
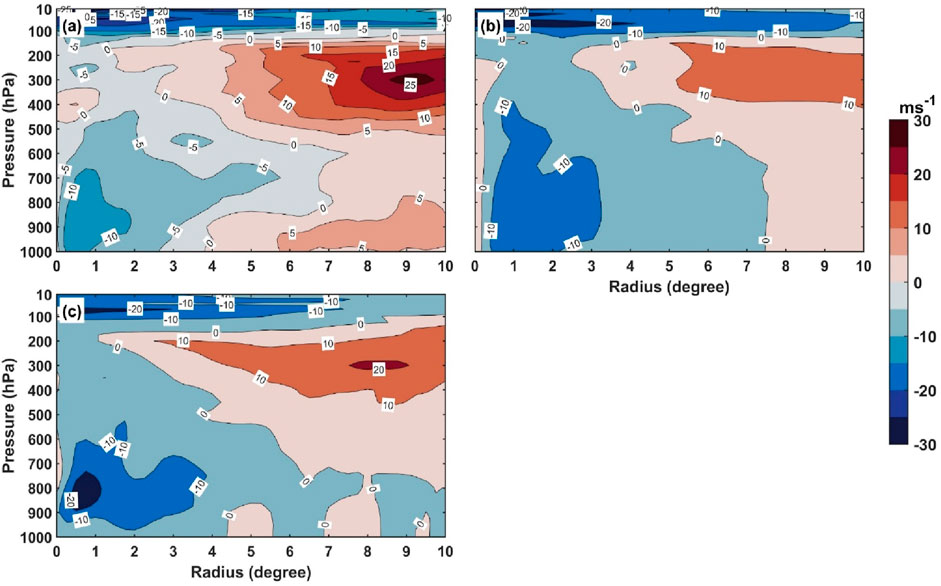
Figure 8. Radius (degree)-height (hPa) cross section of radial wind (m/sec) from the TC center at 12 UTC on (A) 01-Jun, (B) 02-Jun, and (C) 03-Jun for Nisarga.
Various studies (Kotal et al., 2009; Raju et al., 2011; Sebastian and Behera, 2015; Balaguru et al., 2020) suggest that equivalent potential temperature (θe) is an important indicator of atmospheric instability and crucial for analysing and forecasting NIO-TCs. The Supplementary Figures S1, S2 shows the vertical profiles of equivalent potential temperature, horizontal wind speed, zonal, and meridional wind speed of the two TCs. Supplementary Figures S1A, S2A depict the vertical profiles of area-averaged equivalent potential temperature (°K) over a 100 km radius from the storm center (calculated from ERA5 reanalysis), illustrating vertical variability throughout the lifespan of the Amphan and Nisarga cyclone, with spatially averaged profiles during the time span of TC. The analysis suggests the TC show a similar qualitative trend, i.e., θe decreases from the surface to the upper level followed by an increase from 500 hPa onwards. In both cases, minimum θe is observed at ≈ 600 hPa level, whereas the maximum potential temperature is at ≈ 100 hPa, clearly seen during the initial and mature stages of TCs (Supplementary Figures S1, S2A, B), but it reverses during the decaying phase (Supplementary Figures S1, S2C, D). The region of unstable motion (which is a surrogate for mixing and entrainment) for both cases seen in cyclones extends up to the mid-troposphere (Supplementary Figures S1A, S2A). The variation of θe indicates that the region of instability extended up to 4–5 km altitude in both TC under consideration in the study. Hence, our analysis reveals that θe is a better indicator of TC intensity than other thermodynamic variables like convective available potential energy and lifted index (Osuri et al., 2012; Sun et al., 2017; Verma et al., 2023). The Supplementary Figures S1B, S2B, illustrate variabilities in wind speed at different altitudes, depending on whether it represents the eye, eyewall, or outer rainbands from 16th-21st May 2020 (1st–3rd June 2020). The vertical profile of horizontal wind speed (Supplementary Figures S1B, S2B) exhibits maximum near the surface on 17–18th May and decreases as day progresses. It is observed that the peak wind speed typically occurs in the cyclone’s boundary layer (the lowest 1–1.5 km of the atmosphere) due to strong surface friction, which gradually decreases with height from 900 hPa (∼1 km) onwards. Also, closer to the TC’s eye or core, wind speed is at its highest, declining further from the center, as the TC circulation weakens. The vertical profile of zonal (meridional) wind speed shows that its values ranges between 0 and 20 (−10 to 10) m/sec upto 600 hPa (Supplementary Figures S1C, D). In addition, Supplementary Figures S3, S4 show the spatial distribution of θe (shaded, in °K) with radius-height (hPa) cross-sections of tangential wind at 12 UTC on 16th-21st May 2020 for the Amphan Cyclone and 1–3 June for TC Nisarga. Higher values of tangential wind in the eye and core of both considered TCs is seen, with comparatively lower values found farther from the TC core.
The relationship between ATMP and the intensity of TCs in the Indian Ocean is complex and influenced by various atmospheric and oceanic factors (Krishnamurthy et al., 2016; Rouault et al., 2003). However, a general link or variation between ATMP and cyclone intensity (in terms of tangential wind) is observed. Supplementary Figures S5, S6 shows the spatial distribution of ATMP (shaded, in °K) with radius-height (hPa) cross-sections of tangential wind at 12 UTC on 16–21 May for the Amphan Cyclone and 1–3 June for TC Nisarga. The spatial distribution shows that ATMP decreases in the mid and upper levels of the atmosphere, while tangential winds remain stronger near the cyclone core throughout the cyclone’s life span.
Nonetheless, various environmental factors are also responsible for intensifying cyclonic disturbances and their occurrences in the NIO region (Chavas and Emanuel, 2010; Chan and Chan, 2015). According to scientific studies (Eric and Chan, 2012; Deshpande et al., 2021; Lodh et al., 2022; Routray et al., 2023), relative vorticity is an essential characteristic for describing the structure of cyclonic systems like TC and its potential intensification. Figure 9 depicts the regional distribution of relative vorticity for TC Amphan between May 16 and 21, 2020, at 12 UTC. In contrast, Figure 10 depicts the spatial distribution of relative vorticity at 12 UTC for TC Nisarga on (a) June 1, (b) June 2, and (c) June 3, respectively. Both figures show the spatial distribution of relative vorticity (nearly 20 × 10⁻4 s⁻1) during its lifespan, highlighting the values of vorticity that are high near the eye region of the cyclonic area and increase during the intensification and development of TCs.
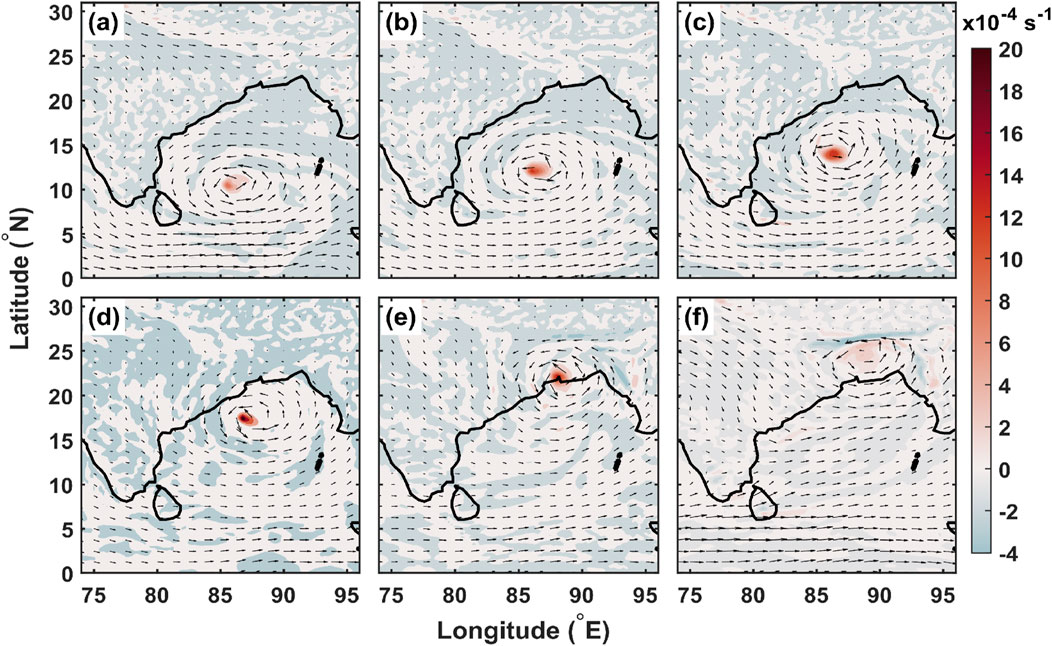
Figure 9. The spatial distribution of relative vorticity (sec−1) at 12-UTC on (A) 16-May, (B) 17-May, (C) 18-May, (D) 19-May, (E) 20-May, and (F) 21-May for TC Amphan.
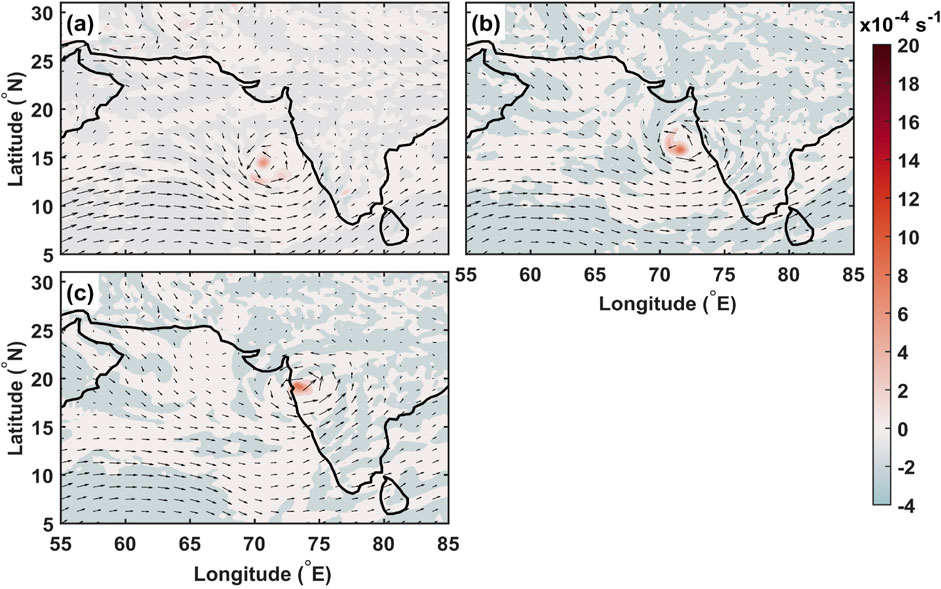
Figure 10. The spatial distribution of relative vorticity (sec−1) at 12 UTC on (A) 01-Jun, (B) 02-Jun, and (C) 03-Jun for TC Nisarga.
In addition, SST, wind field, low-level vorticity, low- and mid-level RH, and OLR can also significantly impact TC activities, including landfall, intensification, and structure (Mohapatra and Sharma, 2015; Mohapatra et al., 2015; Tiwari et al., 2022). In a warmer climate, atmospheric moisture is expected to increase rapidly, as indicated by Trenberth et al., 2003. Trenberth (1999) indicated that approximately 70% of precipitation in mid-latitude cyclones originates from existing atmospheric moisture, with the rest from surface evaporation during the storm’s evolution. High mid-troposphere RH is crucial for TC development, as it mitigates the adverse effects of entrainment on convection (Gray, 1968). Additionally, TCs outside the eyewall are sensitive to RH, affecting precipitation intensity and coverage outside the TC core. Higher RH promotes storm intensification, while lower RH can weaken storms and affect their movement, impacting coastal regions.
Figure 11 shows the spatial distribution of vertically integrated moisture divergence at 12 UTC on (a) 16 May, (b) 17 May, (c) 18 May, (d) 19 May, (e) 20 May, and (f) 21 May for the Amphan Cyclone. Figure 12 presents this distribution at 12 UTC on (a) 1 June, (b) 2 June, and (c) 3 June for TC Nisarga. These figures indicate high moisture convergence near the eyewall throughout the life span of TC, a crucial factor influencing TC movement, intensification, and development in the BOB and AS in the NIO region. Vertically integrated moisture convergence impacts precipitation distribution, potential flooding, and further TC intensification. Supplementary Figures S7, S8 illustrate the vertical variation of area-averaged over a 100 km radius from the storm center (a) cloud water mixing ratio, (b) cloud liquid water content, (c) cloud ice water content, and (d) cloud rainwater content. The figure clearly displays that the vertical distribution of water vapor mixing ratio in tropical cyclones is highest near the surface (nearly 20 g/kg) and gradually decreases with height, cloud liquid water content is highest in the middle to higher troposphere (with in the eyewall region). In comparison, cloud ice water content peaks in the upper troposphere and cloud rainwater content reaches maximum values in the lower troposphere, varying with storm intensity. In addition, the spatial distribution of outgoing longwave radiation (OLR), whereas movement of TC is well captured, and a low value of OLR is found in the eye region as compared for both the TC cases (Supplementary Figures S9, S10). The net estimates of outgoing longwave radiation (OLR) over the tropical ocean’s surface were estimated using hourly ERA5 data. Both figures reveal a strong correlation between OLR distribution and cyclone intensity, highlighting the influence of environmental factors like wind shear and indicate cyclogenesis throughout the TC’s lifespan.
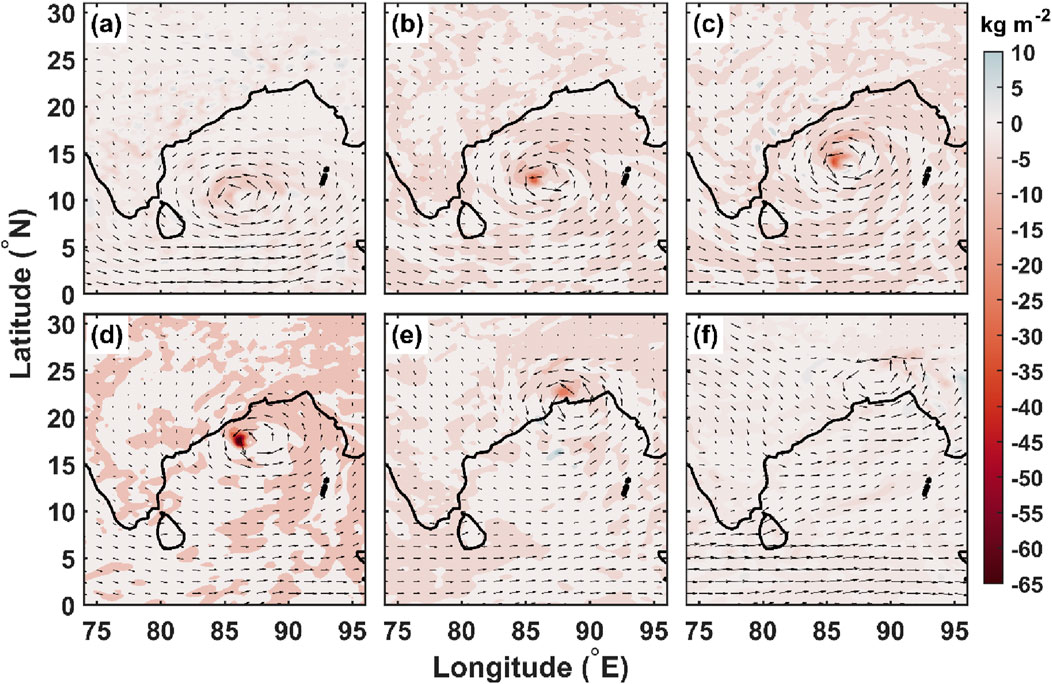
Figure 11. The spatial distribution of vertically integrated moisture divergence up to 200 hPa (kg. m−2. Section 1) at 12 UTC on (A) 16-May, (B) 17-May, (C) 18-May, (D) 19-May, (E) 20-May, and (F) 21-May for TC Amphan.
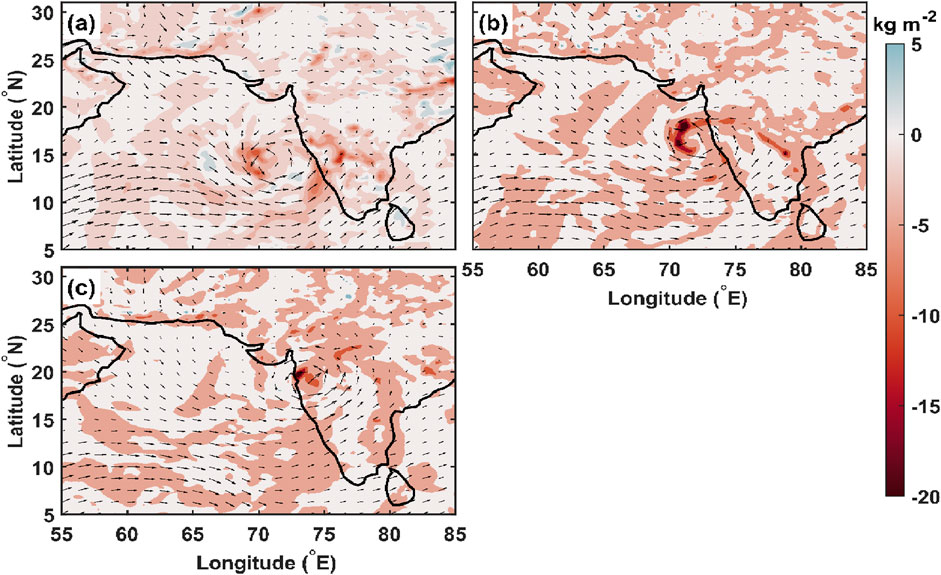
Figure 12. The spatial distribution of vertically integrated moisture divergence up to 200 hPa (kg. m−2 .sec−1) at 12 UTC on (A) 01-Jun, (B) 02-Jun, and (C) 03-Jun for TC Nisarga.
Very few studies have emphasized the correspondence of environmental parameters like LTT, LST, PDI Equation 2, and ACE Equation 1 with TC variability. Therefore, the temporal variability of various environmental parameters and their variation are discussed (see Table 1–3). Tables 1, 2 show the values for PDI and ACE parameterscontributions of ACE and PDI for AMPHAN and Nisarga, with ACE accounting for around 65% and PDI for nearly 80% of all TCs occurring in 2020, according to JTWC and ERA5 data. Table 3 shows the mean values of the contribution of environmental variables, including WSP, CSLP, SST, LRH, MRH, ATMP (2 m), LST, and LTT, for Amphan, Nisarga using ERA5 reanalysis, providing a comparison and contribution for individual cases and the combined 2020 cases. The temporal variation of LTT and LST for both TC cases is shown in Supplementary Figures S11A, B. The figure indicates the time series of LTT and LST averaged for the life period of both the TC cases. In NIO, the trends in LTT and LST are substantial, with a net rise in LTT for TC Amphan by ∼ 2 K and a net reduction in LST of ∼ 6 K. Whereas for Nisarga, LTT and LST increases by 2 K and 6 K, respectively. These environmental factors impact TC formation and structure, with lower temperatures above increasing air instability and favoring higher updrafts within the TC, adding to its intensity and structural complexity (Kossin et al., 2016; Nolan et al., 2007).
Supplementary Figure S12 shows the spatial distribution of RH (shaded) and radius (degree) - height (hPa) cross-section of tangential wind at 12 UTC on (a) 16 May, (b) 17 May, (c) 18 May, (d) 19 May, (e) 20 May, and (f) 21 May for the Amphan Cyclone. Supplementary Figure S13 shows the same parameters at 12 UTC on (a) 1 June, (b) 2 June, and (c) 3 June for TC Nisarga. Both figures clearly convey that high RH values in the lower and middle troposphere (Table 3) are decisive for TC movement and intensification and precipitation distribution. The case studies given here indicate that this environmental aspect was critical in the rapid growth of cyclones into severe cyclonic development. This emphasizes the various processes leading to TC intensification, warning against attributing rapid intensification to sole evidence. Additionally, this dynamic case study demonstrates the crucial role of these environmental factors in the creation and progression of TCs, highlighting the significance of taking them into account in TC forecast and assessment.
Vorticity, which represents atmospheric rotation, is important to cyclone formation, structure, and intensification by promoting low-level air convergence and upper-level divergence (Douglas, 1992; Van Sang et al., 2008). Vorticity budget analysis is a widely utilized approach to study the physical mechanisms behind vortex formation. Using the three-dimensional wind field derived from the ERA5 reanalysis, the scale of each term in the vorticity equation is calculated, during the period of the two cyclones, Amphan and Nisarga. Figure 13 and Supplementary Figure S14 shows the major contributing terms from the vorticity Equation 4 plotted for the two cyclones: vorticity, local time tendency of relative vorticity, horizontal advection of relative vorticity, convergence, stretching or divergence term, advection of planetary vorticity, vertical advection of relative vorticity and tilting term. It is clearly noticed that there is closed structure of positive vorticity values (Figures 13A–C; Supplementary Figures S14A, B) and convergence (Figures 13J–L; Supplementary Figures S14G, H) of wind with values around 2.5 × 10⁻⁵ sec−1 to 4 × 10⁻⁵ sec−1 (1.5 × 10⁻⁵ sec−1 to 2.25 × 10⁻⁵ sec−1) and 0.4 × 10⁻⁵ sec−1 to 1.2 × 10⁻⁵ sec−1 (0.3 × 10⁻⁵ sec–1 – 0.6 × 10⁻⁵ sec−1) for Amphan (Nisarga), respectively. The horizontal advection of relative vorticity term,
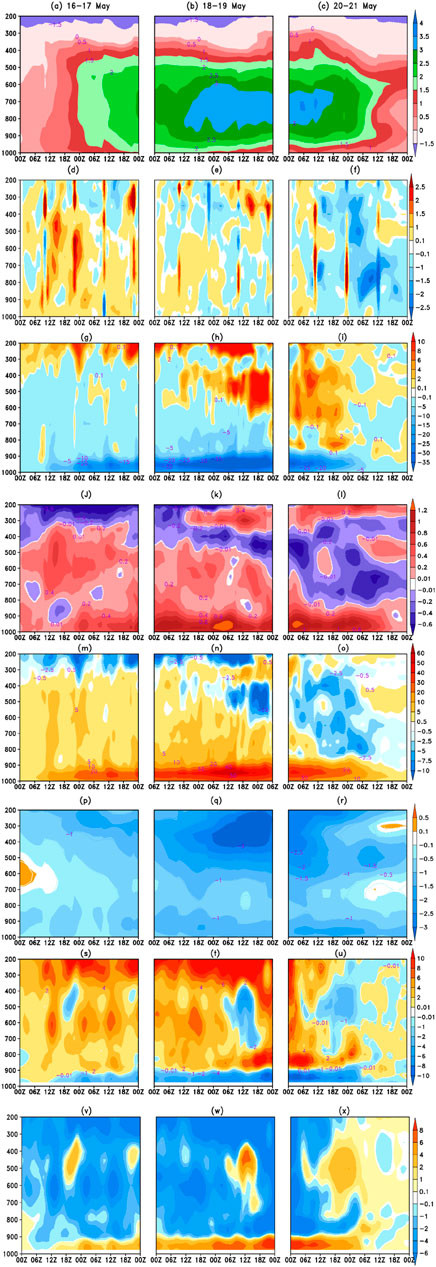
Figure 13. Time-pressure cross section of vorticity (x 10−5 sec−1) during (A) 00 UTC 16th to 23UTC of 17th May 2020, (B) 00 UTC 18th to 23UTC of 19th May 2020, (C) 00 UTC 20th to 23UTC of 21st May 2020 averaged between 10 and 25° N and 84–94°E from ERA5; (D, E, F) same as (A, B, C) but for local time tendency of relative vorticity (x 10−11 sec−2); (G, H, I) same as (A, B, C) but for horizontal advection of relative vorticity (x 10−10 sec−2); (J, K, L) same as (A, B, C) but for convergence (x 10−5 sec−1); (M, N, O) same as (A, B, C) but for divergence term or stretching term (x 10−10 sec−2); (P, Q, R) same as (A, B, C) but for advection of planetary vorticity (x 10−10 sec−2); (S, T, U) same as (A, B, C) but for vertical advection of relative vorticity (x 10−10 sec−2); (V, W, X) same as (A, B, C) but for tilting term (x 10−10 sec−2); (* Kindly note all the vorticity budget terms and other variables are averaged between 10 and 25° N and 84–94°E).
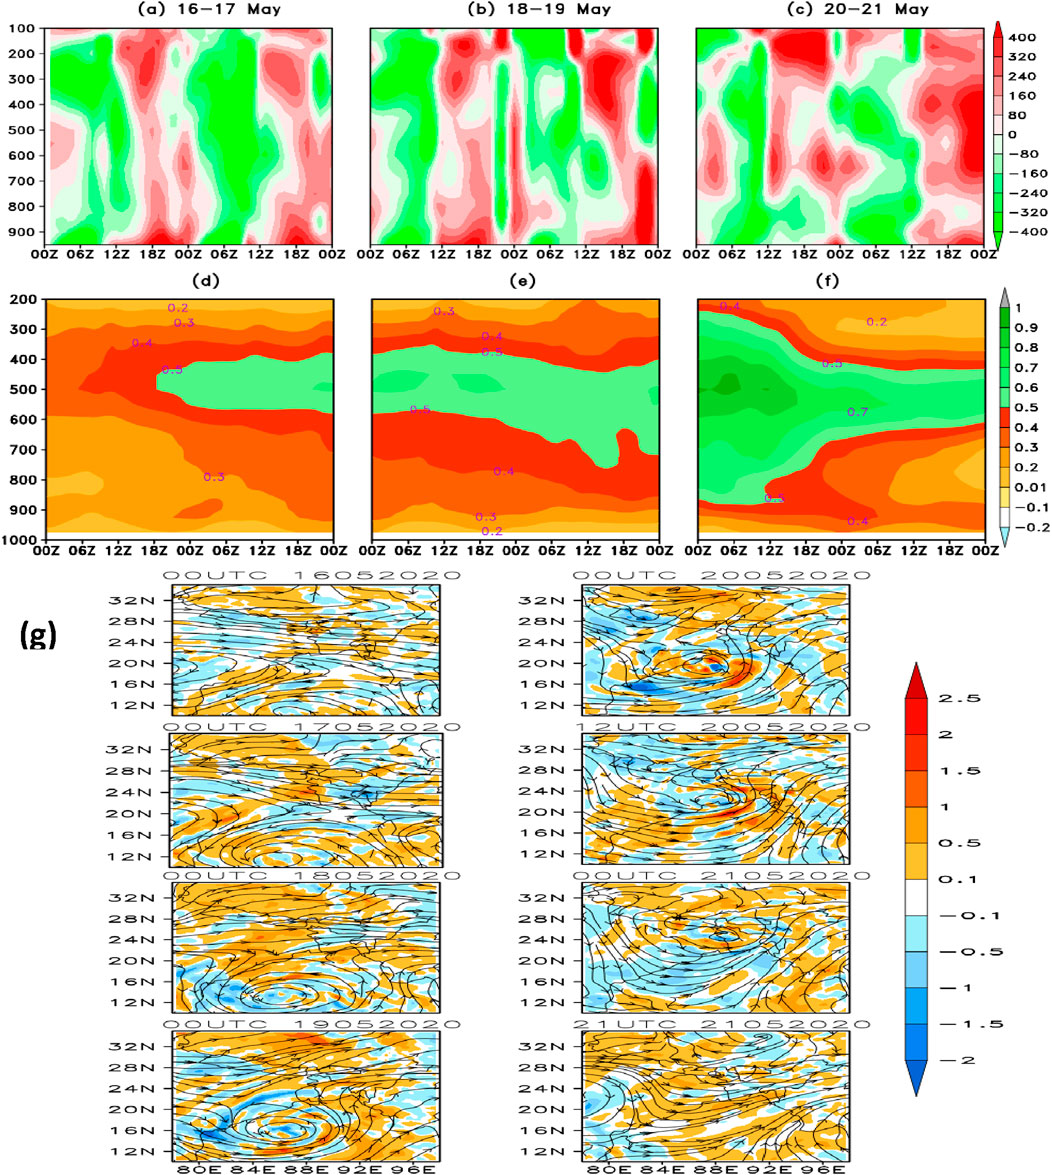
Figure 14. Time-pressure cross-section of Diabatic heating (K sec−1) during (A) 00 UTC 16th to 23UTC of 17th May 2020, (B) 00 UTC 18th to 23UTC of 19th May 2020, (C) 00 UTC 20th to 23UTC of 21st May 2020 averaged between 10 and 25° N and 84–94°E from ERA5; (D, E, F) same as (A, B, C) but for potential vorticity (x 10–6 K kg−1 m2 s−1); (G) Spatial distribution of vertically averaged (up to 500 hPa) diabatic heating (shaded; K.h−1) superimposed with 850 hPa streamlines from 00UTC 16th to 21UTC of 21st May 2020.
Diabatic heating Equation 5, primarily from latent heat release during condensation, is crucial to the intensification of TCs (Vigh and Schubert, 2009; Geetha and Balachandran, 2016). In both Amphan and Nisarga (Figure 14; Supplementary Figure S15), significant diabatic heating occurred in the mid-to-upper troposphere, driven by intense convective activity within the core of the TCs. This process contributed to strengthening the TCs by enhancing vertical motion and sustaining the warm-core structure characteristic of intense tropical systems. The latent heat release is concentrated around the eyewall and convective bands, playing a key role in the rapid intensification of these storms. Thus, diabatic heating figures shows that it not only reinforces vertical circulation but also influences vorticity through feedback mechanisms (Fujiwara et al., 2017). Additionally, the latent heat release associated with DH can accelerate cyclone intensification by amplifying vorticity in the storm’s core (Shu et al., 2022; Kutty and Gohil, 2017). Potential vorticity which combines vorticity with atmospheric stability, is also a way for understanding TC evolution. In both cyclones Amphan and Nisarga (Figures 14D, E, F; Supplementary Figures S15C, D), high potential vorticity in the upper troposphere, driven by strong convection and vertical wind shear, played a significant role in intensification of TC (Wada and Usui, 2007; Molinari and Vollaro, 2010; Kotal et al., 2012; Hoskins et al., 2021). Convection helped transport potential vorticity toward the storm centers, and the interaction between upper-level potential vorticity and low-level vorticity deepened the cyclonic systems, maintaining their strength as they moved across the warm waters of the BOB and AS. The accumulation of potential vorticity near the cyclone core, particularly in Amphan (0.9 × 10⁻⁶ K kg−1 m2 sec−1) indicated heightened dynamic activity crucial for its stronger intensity. Amphan exhibited a more pronounced PV tower extending from the lower to upper troposphere, contributing to its greater intensity and longevity compared to Nisarga (Kutty and Gohil, 2017). The presence of high SSTs in the Bay of Bengal provided abundant moisture, which led to enhanced diabatic heating, enhanced the upper-level divergence, aiding in the development of strong outflow channels that supported the Amphan’s intensification. Amphan’s deep, organized convection led to a more predictable and steadier path, while Nisarga’s convection was more erratic, influencing its landfall.
The current study illustrates the TC dynamics in the NIO region, focusing on Amphan (in BOB) and Nisarga (in AS) in 2020, and examines critical metrics such as tangential and radial wind profiles, emphasizing on vorticity budget analysis and diabatic heating. The study confirms that the ERA5 reanalysis data gives relatively accurate cyclone tracks for Amphan and Nisarga, with mean track errors of ∼31 km. The RMSE (and STD) for track deviations is 31.15 km (19.24 km) for Amphan and 31.27 km (18.52 km) for Nisarga, respectively, with errors ranging from 0–50 km for both cyclones using IMD and JTWC datasets.
The MSW and CSLP in the cyclone eye have indicated a strong negative correlation, which is critical for classifying TC strength. During the mature phases of cyclones, vertical wind dynamics are changing substantially, with stronger winds concentrated near the eyewall. The study described the radial and tangential wind variation to better understand the TC structure. The intense radial inflow and outflow at lower and upper levels, indicates influence on vertically integrated convergence and concentrated warming in lower troposphere promotes the strengthening of cyclone intensity and motion. Further, the tangential winds peak near the eyewall with lower-level inflows extending up to 250 km are influences precipitation patterns and plays an essential role in inflow and outflow dynamics critical for TC development and movement.
Moreover, the current study has found that ATMP correlates with TC intensity, whereas θe is significant for NIO-TC analysis, suggesting atmospheric instability and energy for intensification. Additionally, θe and ATMP exhibit patterns related to tangential wind cross-sections. The changes in LTT and LST, with increasing LTT and decreasing LST, have indicated variations in TC intensity and structure. High mid-tropospheric RH, moisture divergence near the eyewall, vertical cloud property variations, and low OLR in the eye region impact TC movement, intensification, and precipitation distribution. Energy indices like ACE and PDI illustrate the importance of environmental variables during rapid TC intensification. This analysis has incorporated environmental elements such as SST, wind field, low-level vorticity, RH, and OLR, which are substantial TC activities such as landfall and structure. However, future research should concentrate on improving empirical correlations and studying climatological variability using new techniques like Artificial Neural Networks (Roy and Kovordányi, 2012) to improve our capacity to anticipate and reduce the effects of TC in the region, especially in light of ongoing climate change and global warming.
In both Amphan and Nisarga, relative vorticity is enhanced by upward transport of momentum and energy from the different terms of vorticity budget, while upper-level divergence intensified the cyclones through enhanced outflow. Positive vorticity advection at upper levels also helped maintain their strength by interacting with environmental wind fields (Raymond and López Carrillo, 2011; Shu et al., 2022). For Cyclone Amphan, stretching and tilting terms dominated the vorticity budget, with cyclonic vorticity concentrated near the surface, aided by strong convection and vertical motions. In contrast, Nisarga exhibited a more balanced contribution between stretching and advection terms, with its rapid intensification driven by interactions between mid- and lower-level vorticity and environmental factors. Overall it is concluded that the tilting term, along with others like divergence and advection, is critical to the TC’s vorticity profile. It has a direct impact on the cyclone’s intensity and organization, especially during its mature stage, because it constantly feeds vertical vorticity into the system and allows the cyclone to rotate continually. Also, for both cyclones Amphan and Nisarga high potential vorticity in the upper troposphere, driven by strong convection and vertical wind shear, played a significant role in intensification of TC. In summary, diabatic heating was a key factor in the intensification of both Cyclone Amphan and Cyclone Nisarga, but the differences in environmental and oceanic conditions led to distinct outcomes in their evolution and impacts.
Data used for analysis in this article are available from the Copernicus Climate Data Store (https://cds.climate.copernicus.eu/), Typhoon Warning Center (https://www.metoc.navy.mil/jtwc/jtwc.html?north-indian-ocean) and India Meteorological Department, Ministry of Earth Sciences, India (https://rsmcnewdelhi.imd.gov.in/). The authors declare that the data and the codes generated during this research will be available upon reasonable request.
SK: Conceptualization, Formal Analysis, Investigation, Methodology, Validation, Writing–original draft, Writing–review and editing. SV: Conceptualization, Data curation, Formal Analysis, Investigation, Software, Validation, Visualization, Writing–review and editing. AL: Conceptualization, Formal Analysis, Data curation, Investigation, Methodology, Software, Validation, Visualization, Writing–review and editing, Supervision.
The author(s) declare that no financial support was received for the research, authorship, and/or publication of this article.
The authors acknowledge the Regional Specialized Meteorological Centre, India Meteorological Department (http://www.rsmcnewdelhi.imd.gov.in/index.php), Joint Typhoon Warning Center (https://www.metoc.navy.mil/jtwc/jtwc.html?north-indian-ocean) for providing the best track records of tropical cyclones, and to ERA5 reanalysis for providing atmospheric and surface variables (https://cds.climate.copernicus.eu/).
The authors declare that the research was conducted in the absence of any commercial or financial relationships that could be construed as a potential conflict of interest.
All claims expressed in this article are solely those of the authors and do not necessarily represent those of their affiliated organizations, or those of the publisher, the editors and the reviewers. Any product that may be evaluated in this article, or claim that may be made by its manufacturer, is not guaranteed or endorsed by the publisher.
The Supplementary Material for this article can be found online at: https://www.frontiersin.org/articles/10.3389/fenvs.2024.1475324/full#supplementary-material
Ahammed, M. M., Ahmed, M. U., Khan, S. I., Rahman, M. M., and Hossain, M. A. (2023). Impact of tropical cyclone Nisarga on the coastal environment and communities of Bangladesh. Mar. Georesources Geotechnol. 41 (1), 119–136. doi:10.1080/1064119X.2022.2040111
Balaguru, K., Foltz, G. R., Leung, L. R., Kaplan, J., Xu, W., Reul, N., et al. (2020). Pronounced impact of salinity on rapidly intensifying tropical cyclones. Bull. Am. Meteorological Soc. 101 (9), E1497–E1511. doi:10.1175/bams-d-19-0303.1
Balaji, M., Bhaskaran, P. K., Rao, A. D., and Srinivas, K. (2020). Impact of sea surface temperature on tropical cyclone intensity in the North Indian Ocean. J. Geophys. Res. Oceans 125 (5), e2019JC015682. doi:10.1029/2019JC015682
Balaji, M., Chakraborty, A., and Mandal, M. (2018). Changes in tropical cyclone activity in north Indian Ocean during satellite era (1981–2014). Int. J. Climatol. 38 (6), 2819–2837. doi:10.1002/joc.5463
Behera, M. D., Prakash, J., Paramanik, S., Mudi, S., Dash, J., Varghese, R., et al. (2022). Assessment of tropical cyclone Amphan affected inundation areas using sentinel-1 satellite data. Trop. Ecol. 63, 9–19. doi:10.1007/s42965-021-00187-w
Belasen, A. R., and Polachek, S. W. (2021). Natural disasters and migration: the case of Hurricane Maria in Puerto Rico. Ann. Regional Sci. 67 (3), 619–642. doi:10.4337/9781782546078.00026
Bhowmick, S. A., Agarwal, N., Sharma, R., Sundar, R., Venkatesan, R., Prasad, C. A., et al. (2020). Cyclone amphan: oceanic conditions pre- and post-cyclone using in situ and satellite observations. Curr. Sci. 119 (9), 1510–1516. doi:10.18520/cs/v119/i9/1510-1516
Braun, S. A., and Tao, W.-K. (2020). Sensitivity of high-resolution simulations of Hurricane Bob (1991) to planetary boundary layer parameterizations. Mon. Weather Rev. 128 (12), 3941–3961. doi:10.1175/1520-0493(2000)129<3941:sohrso>2.0.co;2
Chan, K. T., and Chan, J. C. (2015). Global climatology of tropical cyclone size as inferred from QuikSCAT data. Int. J. Climatol. 35 (15), 4843–4848. doi:10.1002/joc.4307
Chavas, D. R., and Emanuel, K. A. (2010). A QuikSCAT climatology of tropical cyclone size. Geophys. Res. Lett. 37 (18). doi:10.1029/2010GL044558
Chen, Y. R., and Li, Y. Q. (2022). A thermodynamic condition affecting the movement of a Southwest China vortex case. Meteoro. Atmospher. Physics. 134, 36. doi:10.1007/s00703-022-00874-w
Deshpande, M., Singh, V. K., Ganadhi, M. K., Roxy, M. K., Emmanuel, R., and Kumar, U. (2021). Changing status of tropical cyclones over the north Indian Ocean. Clim. Dyn. 57, 3545–3567. doi:10.1007/s00382-021-05880-z
Douglas, M. W. (1992). Structure and dynamics of two monsoon depressions. Part II: vorticity and heat budgets. Mon. Weather Rev. 120 (8), 1548–1564. doi:10.1175/1520-0493(1992)120<1548:sadotm>2.0.co;2
Dvorak, V. F. (1975). Tropical cyclone intensity analysis and forecasting from satellite imagery. Month. Weather. Review. 103 (5), 420–430. doi:10.1175/1520-0493(1975)103%3C0420:TCIAAF%3E2.0.CO;2
Dube, S. K., Jain, I., Rao, A. D., and Murty, T. S. (2021). Storm surge modelling for the arabian Sea and Bay of bengal. Nat. Hazards 106 (1), 749–769. doi:10.1007/s11069-009-9397-9
Emanuel, K. (2005). Increasing destructiveness of tropical cyclones over the past 30 years. Nature 436 (7051), 686–688. doi:10.1038/nature03906
Emanuel, K., Solomon, S., Folini, D., Davis, S., and Cagnazzo, C. (2013). Influence of tropical tropopause layer cooling on Atlantic hurricane activity. J. Clim. 26 (7), 2288–2301. doi:10.1175/JCLI-D-12-00242.1
Emanuel, K. A. (1986). An air-sea interaction theory for tropical cyclones. Part I: steady state maintenance. J. Atmos. Sci. 43, 585–605. doi:10.1175/1520-0469(1986)043<0585:aasitf>2.0.co;2
Emanuel, K. A. (1994). “The physics of tropical cyclogenesis over the eastern Pacific,” in Tropical cyclone disasters. Editors J. Lighthill, Z. Zhemin, G. Holland, and K. Emanuel (Beijing: Peking Univ. Press), 588.
Eric, K. W. N., and Chan, J. C. (2012). Interannual variations of tropical cyclone activity over the north Indian Ocean. Int. J. Climatol. 32 (6), 819–830. doi:10.1002/joc.2304
Fujiwara, K., Kawamura, R., Hirata, H., Kawano, T., Kato, M., and Shinoda, T. (2017). A positive feedback process between tropical cyclone intensity and the moisture conveyor belt assessed with Lagrangian diagnostics. J. Geophys. Res. Atmos. 122 (23), 12–502. doi:10.1002/2017JD027557
Gray, W. M. (1968). Global view of the origin of tropical disturbances and storms. Month. Weather. Review. 96 (10), 669–700. doi:10.1175/1520-0493(1968)096%3c0669:GVOTOO%3e2.0.CO;2
Geetha, B., and Balachandran, S. (2016). Diabatic heating and convective asymmetries during rapid intensity changes of tropical cyclones over North Indian Ocean. Trop. Cyclone Res. Rev. 5 (1-2), 32–46. doi:10.6057/2016TCRRh1.04
Gentry, M. S., and Lackmann, G. M. (2010). Sensitivity of simulated tropical cyclone structure and intensity to horizontal resolution. Mon. Weather Rev. 138 (3), 688–704. doi:10.1175/2009MWR2976.1
Ghosh, S., Bakshi, M., Bhattacharyya, S., Nath, B., and Chaudhuri, P. (2021). A review of climate change impacts on mangrove forests: insights from coastal pollution, heavy metal and social studies from tropical and subtropical coasts of Asia. Earth-Science Rev. 222, 103760. doi:10.4172/2157-7617.1000270
Halder, B., Das, S., Bandyopadhyay, J., and Banik, P. (2021). The deadliest tropical cyclone ‘Amphan’: investigate the natural flood inundation over south 24 Parganas using google earth engine. Saf. extreme Environ. 3 (1), 63–73. doi:10.1007/s42797-021-00035-z
Hassan, M. M., Ash, K., Abedin, J., Paul, B. K., and Southworth, J. (2020). A quantitative framework for analyzing spatial dynamics of flood events: a case study of super cyclone Amphan. Remote Sens. 12 (20), 3454. doi:10.3390/rs12203454
Hersbach, H., Bell, B., Berrisford, P., Biavati, G., Horányi, A., Muñoz Sabater, J., et al. (2023). ERA5 hourly data on single levels from 1940 to present. Copernic. Clim. Change Serv. (C3S) Clim. Data Store (CDS). doi:10.24381/cds.adbb2d47
Holland, G. (1993). “Ready reckoner,” in Global guide to tropical cyclone forecasting. Editor G. Holland (Melbourne: Bureau of Meteorology Research Centre).
Hoskins, B. J., McIntyre, M. E., and Robertson, A. W. (2021). On the use and significance of isentropic potential vorticity maps. Q. J. R. Meteorological Soc. 107 (453), 67–75. doi:10.1002/qj.49710745302
Houze Jr, R. A. (2014). Mesoscale convective systems. Rev. Geophys. 52 (3), 681–705. doi:10.1002/2013RG000434
Jaiswal, R. K., and Ali, S. (2018). Recent trends in sea surface temperature and tropical cyclone activity over the North Indian Ocean. Theor. Appl. Climatol. 133 (3-4), 969–979. doi:10.1007/s00704-017-2233-7
Kimball, S. K., and Dougherty, F. C. (2006). The sensitivity of idealized hurricane structure and development to the distribution of vertical levels in MM5. Mon. Weather Rev. 134 (7), 1987–2008. doi:10.1175/mwr3171.1
Kossin, J. P., Knapp, K. R., Olander, T. L., and Velden, C. S. (2016). Global increase in major tropical cyclone exceedance probability over the past four decades. Proc. Natl. Acad. Sci. 113 (39), 10847–10852. doi:10.1073/pnas.1610110113
Kotal, S. D., Bhowmik, S. K. R., Kundu, P. K., and Das, A. K. (2021). Performance of the NWP-based cyclone prediction system of India Meteorological Department during 2020. Mausam 72 (2), 279–296. doi:10.1007/978-3-319-10217-7_9
Kotal, S. D., Kundu, P. K., and Roy Bhowmik, S. K. (2009). An analysis of sea surface temperature and maximum potential intensity of tropical cyclones over the Bay of Bengal between 1981 and 2000. Meteorological Appl. A J. Forecast. Pract. Appl. Train. Tech. Model. 16 (2), 169–177. doi:10.1002/met.96
Kotal, S. D., Tyagi, A., and Roy Bhowmik, S. K. (2012). Potential vorticity diagnosis of rapid intensification of very severe cyclone GIRI (2010) over the Bay of Bengal. Nat. hazards 60, 461–484. doi:10.1007/s11069-011-0024-1
Krishnamurthy, L., Vecchi, G. A., Msadek, R., Murakami, H., Wittenberg, A., and Zeng, F. (2016). Impact of strong ENSO on regional tropical cyclone activity in a high-resolution climate model in the North Pacific and North Atlantic Oceans. J. Clim. 29 (7), 2375–2394. doi:10.1175/JCLI-D-15-0468.1
Kumar, S., Panda, J., Paul, D., and Guha, B. K. (2022). Impact of environmental variables on the North Indian Ocean tropical cyclones radial parameters. Clim. Dyn. 60, 813–830. doi:10.1007/s00382-022-06316-y
Kumar, S., Panda, J., Singh, K., Guha, B. K., and Kant, S. (2021). Structural characteristics of North Indian Ocean tropical cyclones during 1999–2017: a scatterometer observation-based analysis. Theor. Appl. Climatol. 143 (1), 227–240. doi:10.1007/s00704-020-03431-w
Kumar, S., Panda, J., Paul, D., and Bhasi, I. (2024). A study on radial characteristics of North Indian Ocean tropical cyclones and associated energy indices through numerical modeling. Atmospher. Res. 309, 107587. doi:10.1016/j.atmosres.2024.107587
Kutty, G., and Gohil, K. (2017). The role of mid-level vortex in the intensification and weakening of tropical cyclones. J. Earth Syst. Sci. 126 (94), 94. doi:10.1007/s12040-017-0879-y
Lodh, A., Routray, A., Dutta, D., George, J. P., and Mitra, A. K. (2022). Improving the prediction of monsoon depressions by assimilating ASCAT soil moisture in NCUM-R modeling system. Atmos. Res. 272, 106130. doi:10.1016/j.atmosres.2022.106130
Ma, Z., Fei, J., Huang, X., and Cheng, X. (2012). Sensitivity of tropical cyclone intensity and structure to vertical resolution in WRF. Asia-Pacific J. Atmos. Sci. 48 (1), 67–81. doi:10.1007/s13143-012-0007-5
Majumdar, B., and Dasgupta, S. (2020). Let Bengal be heard: dealing with Covid and cyclone Amphan together. South Asian Hist. Cult. 11, 317–322. doi:10.1080/19472498.2020.1780063
Mohanty, U. C., Niyogi, D., and Potty, K. V. J. (2012). Recent developments in tropical cyclone analysis using observations and high-resolution models. Nat. Hazards 63 (3), 1281–1283. doi:10.1007/s11069-012-0088-6
Mohanty, U. C., Osuri, K. K., Tallapragada, V., Marks, F. D., Pattanayak, S., Mohapatra, M., et al. (2015). A great escape from the Bay of Bengal “super sapphire–Phailin” tropical cyclone: a case of improved weather forecast and societal response for disaster mitigation. Earth Interact. 19 (17), 1–11. doi:10.1175/EI-D-14-0032.1
Mohapatra, M., Bandyopadhyay, B. K., and Tyagi, A. (2012). Best track parameters of tropical cyclones over the North Indian Ocean: a review. Nat. Hazards 63 (3), 1285–1317. doi:10.1007/s11069-011-9935-0
Mohapatra, M., Geetha, B., Balachandran, S., and Rathore, L. S. (2015). On the tropical cyclone activity and associated environmental features over north Indian ocean in the context of climate change. J. Clim. Change 1 (1-2), 1–26. doi:10.3233/JCC-150001
Mohapatra, M., and Sharma, M. (2015). Characteristics of surface wind structure of tropical cyclones over the north Indian Ocean. J. Earth Syst. Sci. 124 (7), 1573–1598. doi:10.1007/s12040-015-0613-6
Mohapatra, M., Sharma, M., Devi, S. S., Kumar, S. V. J., and Sabade, B. S. (2021). Frequency of genesis and landfall of different categories of tropical cyclones over the North Indian Ocean. Mausam 72, 1–26. doi:10.54302/mausam.v72i1.119
Molinari, J., and Vollaro, D. (2010). Vertical shear and the distribution of convection in tropical cyclones. J. Atmos. Sci. 67 (8), 2455–2477. doi:10.1175/2010JAS3409.1
Mondal, M., Paul, S., Bhattacharya, S., and Biswas, A. (2020). Micro-level assessment of rural societal vulnerability of coastal regions: an insight into Sagar Island, West Bengal, India. Asia-Pacific J. Rural Dev. 30 (1-2), 55–88. doi:10.1177/1018529120946230
Mondal, P., Dutta, T., Qadir, A., and Sharma, S. (2022). Radar and optical remote sensing for near real-time assessments of cyclone impacts on coastal ecosystems. Remote Sens. Ecol. Conservation 8, 506–520. doi:10.1002/rse2.257
Montgomery, M. T., and Smith, R. K. (2017). Recent developments in the fluid dynamics of tropical cyclones. Annu. Rev. Fluid Mech. 49, 541–574. doi:10.1146/annurev-fluid-010816-060022
Murakami, H., Wang, B., Li, T., and Kitoh, A. (2013). Projected increase in tropical cyclones near Hawaii. Nature. Climate. Change. 3 (8), 749–754. doi:10.1038/nclimate1890
Nolan, D. S., Montgomery, M. T., and Grasso, L. D. (2007). Warm core structure of Hurricane Erin diagnosed from high-resolution numerical simulation. Mon. Weather Rev. 135 (10), 3277–3295. doi:10.1175/MWR3478.1
O'Connor, J., Eberle, C., Cotti, D., Hagenlocher, M., Hassel, J., Janzen, S., et al. (2021). Interconnected disaster risks. Socio. Environ. Sci., nyhz4182. doi:10.53324/nyhz4182
Osuri, K. K., Mohanty, U. C., Routray, A., and Mohapatra, M. (2012). The impact of satellite-derived wind data assimilation on track, intensity and structure of tropical cyclones over the North Indian Ocean. Int. J. Remote Sens. 33 (5), 1627–1652. doi:10.1080/01431161.2011.596849
Pramanik, M., Szabo, S., Pal, I., Udmale, P., Pongsiri, M., and Chilton, S. (2021). Population health risks in multi-hazard environments: action needed in the Cyclone Amphan and COVID-19 – hit Sundarbans region, India. Clim. Dev. 14, 99–104. doi:10.1080/17565529.2021.1889948
Qiu, X., Tan, Z. M., and Xiao, Q. (2010). The roles of vortex Rossby waves in hurricane secondary eyewall formation. Mon. Weather Rev. 138 (6), 2092–2109. doi:10.1175/2010MWR3161.1
Raju, P. V. S., Potty, J., and Mohanty, U. C. (2011). Sensitivity of physical parameterizations on prediction of tropical cyclone Nargis over the Bay of Bengal using WRF model. Meteorology Atmos. Phys. 113, 125–137. doi:10.1007/s00703-011-0151-y
Ray, K., Pandey, P., Pandey, C., Dimri, A. P., and Kishore, K. (2021). On the recent floods in India. Curr. Sci. 117 (2), 204–218. doi:10.18520/cs/v117/i2/204-218
Raymond, D. J., and López Carrillo, C. (2011). The vorticity budget of developing typhoon Nuri (2008). Atmos. Chem. Phys. 11, 147–163. doi:10.5194/acp-11-147-2011
RMSC Report (2020). Report on cyclonic disturbances over north Indian ocean during 2020, ESSO Report No. No. MOES/IMD/RSMC-Tropical Cyclone Report/01(2021)/11
Rogers, R., Aberson, S., Black, M., Black, P., Cione, J., Dodge, P., et al. (2003). The intensity forecasting experiment: a NOAA multiyear field program for improving tropical cyclone intensity forecasts. Bull. Am. Meteorological Soc. 84 (5), 677–689. doi:10.1175/BAMS-84-5-677
Rouault, M., Florenchie, P., Fauchereau, N., and Reason, C. J. (2003). South East tropical Atlantic warm events and southern African rainfall. Geophys. Res. Lett. 30 (5). doi:10.1029/2002gl014840
Routray, A., Lodh, A., Dutta, D., George, J. P., and Mitra, A. K. (2023). Influence of ASCAT soil moisture on prediction of track and intensity of landfall tropical cyclones. Int. J. Remote Sens. 44 (1), 341–380. doi:10.1080/01431161.2022.2164232
Roy, C., and Kovordányi, R. (2012). Tropical cyclone track forecasting techniques - a review. Atmos. Res. 104–105, 40–69. doi:10.1016/j.atmosres.2011.09.012
Sebastian, M., and Behera, M. R. (2015). Impact of SST on tropical cyclones in north Indian ocean. Procedia Eng. 116, 1072–1077. doi:10.1016/j.proeng.2015.08.346
Shu, Y., Sun, J., Jin, C., and Zhuang, B. (2022). Vorticity budget and formation mechanisms of a mesoscale convective vortex in a heavy-rainstorm episode. Atmosphere 13 (4), 556. doi:10.3390/atmos13040556
Singh, O., Khan, T. M. A., and Rahman, M. S. (2021). Recent sea level and sea surface temperature trends along the Bangladesh coast in relation to the frequency of intense cyclones. Mar. Geod. 44 (2), 99–119. doi:10.1080/01490410050030670
Singh, O. P., Khan, T. M. A., and Rahman, M. S. (2001). Has the frequency of intense tropical cyclones increased in the north Indian Ocean? Curr. Sci., 575–580. Available at: https://www.jstor.org/stable/24104250
Singh, V. K., and Roxy, M. K. (2022). A review of ocean-atmosphere interactions during tropical cyclones in the north Indian Ocean. Earth-Science Rev. 226, 103967. doi:10.1016/j.earscirev.2022.103967
Smith, R. K., Montgomery, M. T., Kilroy, G., Tang, S., and Müller, S. (2015). Tropical low formation during the Australian monsoon: the events of January 2013 (paper updated July 2016). Aust. Meteorological Oceanogr. J. 65 (4), 318–341. doi:10.22499/2.6503.003
Sun, Y., Zhong, Z., Li, T., Yi, L., Hu, Y., Wan, H., et al. (2017). Impact of ocean warming on tropical cyclone size and its destructiveness. Sci. Rep. 7 (1), 8154. doi:10.1038/s41598-017-08533-6
Tang, B. H., and Emanuel, K. A. (2012). Midtropospheric ventilation's constraint on tropical cyclone intensity. J. Atmos. Sci. 69 (9), 2695–2709. doi:10.1175/JAS-D-11-0238.1
Tiwari, G., Kumar, P., Javed, A., Mishra, A. K., and Routray, A. (2022). Assessing tropical cyclone characteristics over the Arabian Sea and Bay of Bengal in the recent decades. Meteorology Atmos. Phys. 134 (3), 1–15. doi:10.1007/s00703-021-00824-4
Trenberth, K. E. (1999). Atmospheric moisture recycling: role of advection and local evaporation. J. Clim. 12 (5), 1368–1381. doi:10.1175/1520-0442(1999)012<1368:amrroa>2.0.co;2
Trenberth, K. E. (2007). Warmer oceans, stronger hurricanes. Sci. Am. 297 (1), 44–51. doi:10.1038/scientificamerican0707-44
Trenberth, K. E., Dai, A., Rasmussen, R. M., and Parsons, D. B. (2003). The changing character of precipitation. Bull. Am. Meteorol. Soc. 84 (9), 1205–1218. doi:10.1175/BAMS-84-9-1205
Veiga, J. P., Rao, V. B., and Franchito, S. H. (2005). Heat and moisture budgets of the walker circulation and associated rainfall anomalies during El Niño events. Internat. J. Climato. A. J. Royal Meteoro. Society. 25 (2), 193–213. doi:10.1002/joc.1115
Van Sang, N., Smith, R. K., and Montgomery, M. T. (2008). Tropical-cyclone intensification and predictability in three dimensions. Q. J. R. Meteorological Soc. A J. Atmos. Sci. Appl. meteorology Phys. Oceanogr. 134 (632), 563–582. doi:10.1002/qj.235
Verma, S., Kumar, S., Kant, S., and Mehta, S. (2023). Sensitivity analysis of convective and PBL parameterization schemes for Luban and Titli tropical cyclones. Theor. Appl. Climatol. 151 (1-2), 311–327. doi:10.1007/s00704-022-04264-5
Vigh, J. L., and Schubert, W. H. (2009). Rapid development of the tropical cyclone warm core. J. Atmos. Sci. 66 (11), 3335–3350. doi:10.1175/2009JAS3092.1
Wang, Z., Xue, L., Liu, J., Ding, K., Lou, S., Ding, A., et al. (2022). Roles of atmospheric aerosols in extreme meteorological events: A systematic review. Current. Pollution. Reports. 8 (2), 177–188. doi:10.1007/s40726-022-00216-9
Keywords: tropical cyclones, ERA5 reanalysis, TC intensity, vorticity budget, diabatic heating, environmental factors
Citation: Kumar S, Verma S and Lodh A (2025) Unravelling the dynamical characteristics of tropical cyclones: Amphan and Nisarga using ERA5 reanalysis. Front. Environ. Sci. 12:1475324. doi: 10.3389/fenvs.2024.1475324
Received: 03 August 2024; Accepted: 25 November 2024;
Published: 20 February 2025.
Edited by:
Kanhu Charan Pattnayak, National Environment Agency, SingaporeReviewed by:
Mourani Sinha, Techno India University, IndiaCopyright © 2025 Kumar, Verma and Lodh. This is an open-access article distributed under the terms of the Creative Commons Attribution License (CC BY). The use, distribution or reproduction in other forums is permitted, provided the original author(s) and the copyright owner(s) are credited and that the original publication in this journal is cited, in accordance with accepted academic practice. No use, distribution or reproduction is permitted which does not comply with these terms.
*Correspondence: Abhishek Lodh, YWJoaXNoZWsubG9kaEBzbWhpLnNl
†ORCID: Subodh Kumar, orcid.org/0009-0008-7511-5407; Saurabh Verma, orcid.org/0009-0003-0642-2888; Abhishek Lodh, orcid.org/0000-0002-4951-0226
‡These authors have contributed equally to this work and share first authorship
Disclaimer: All claims expressed in this article are solely those of the authors and do not necessarily represent those of their affiliated organizations, or those of the publisher, the editors and the reviewers. Any product that may be evaluated in this article or claim that may be made by its manufacturer is not guaranteed or endorsed by the publisher.
Research integrity at Frontiers
Learn more about the work of our research integrity team to safeguard the quality of each article we publish.