- 1School of Foreign Languages, Jiangsu Open University, Nanjing, China
- 2School of Management Science and Engineering, Nanjing University of Information Science and Technology, Nanjing, China
- 3Cuiying Honors College, Lanzhou University, Lanzhou, China
Introduction: China’s manufacturing sector is a cornerstone of its industrial system. However, some parts of China are dominated by heavy chemicals, which leads to severe environmental pollution. The emergence of green finance (GF) can influence social capital to gradually withdraw from companies that emit pollution and increase investment in environmentally friendly ones.
Methods: This paper selects the data related to GF and the manufacturing industry (MI) from 2011 to 2020 by exploring the effect of GF on the transformation and upgrading of manufacturing industries (MIU) through literature analysis and the Spatial Durbin model.
Results: The results demonstrate that GF positively influences the promotion of MIU, whereas MIU has a good spatial spillover effect. The results of this regression remain robust after a series of tests.
Discussion: This research suggests that the government and enterprises should pay attention to GF and encourage more enterprises to take the initiative to adjust the industrial direction and achieve a clean upgrade in manufacturing.
1 Introduction
With rapid economic and social advancement, China faces increasingly severe problems of resource supply pressure, environmental pollution, and ecosystem degradation. These problems have become critical bottlenecks limiting sustainable economic development. Currently, green development has gained comprehensive support in China. Since 2020, the Party Central Committee has raised higher demands for enhancing ecological civilisation and speeding up the promotion of GF development. China has entered a stage where quality rather than quantity is necessary.
The manufacturing industry (MI) is the core industry of China’s national economy. In 2021, the total value of MI in China reached 31.4 trillion yuan (Fu and Liu, 2022). In absolute size, the manufacturing sector still ranks first among China’s three major industries. Although the manufacturing industrial structure is being adjusted, the structure of some regions of China is still dominated by the heavy chemicals industry. The challenges of environmental damage persist, as increased production relies on consuming energy resources, thus making it difficult to eliminate the dependence on them. In 2015, China’s State Council issued a document on building a strong manufacturing country, known as “Made in China 2025.” The document proposed strengthening green development, creating a green manufacturing system, and taking the path of ecological development, which means that MI requires to be transformed and upgraded.
Green finance (GF) can help break through this blockage. The development of GF in China has significantly expanded the space for green development of the economy and society Wang B et al. (2023). Through the development of GF, the social capital can be gradually guided to divest from polluting industries and invest more in green and environmental protection industries. GF can also decrease the funding cost of manufacturing industries and provide abundant and innovative green products and services. Meanwhile, it can impose financial constraints on highly polluting and energy-intensive manufacturing industries, promote technological innovation in these industries, and indirectly facilitate the transformation and upgrading of manufacturing industries (MIU). GF has achieved positive results in guiding green investment and optimising the energy structure in recent years. However, deficiencies still exist. For example, the GF standard system is not uniform, the criteria and boundaries of green projects are vague, and green funds are mainly invested in enterprises with good environmental benefits and low pollution and energy consumption. In addition, the unstable capital chain and the lack of a corresponding innovation incentive mechanism have made it difficult for enterprises to engage in substantial innovation behaviour.
China hopes to promote the transition of local financial institutions and enterprises towards green development “from the top down” by playing a guiding role of the central government and promoting the combination of financial policies at the upper level and market exploration at the lower level. Therefore, China has been actively building pilot zones for GF reform and innovation in an attempt to explore replicable and scalable experiences based on the effectiveness of GF in the region to explore an effective path for the further development of GF at the national level. In recent years, the performance of local GF markets has been varying, and the GF in the middle and lower reaches of the YREB has been performing better. In general the scale of GF products has been expanding and the types of products have been constantly innovated, which has effectively helped enterprises to broaden their financing channels and reduce their financing costs. However, as China’s GF is still in a nascent state, some relevant enterprises and financial institutions in the upper reaches of the YREB have not responded to the national GF policies in a timely manner and have not fully recognised its importance in the MIU.
This article selects eleven provinces and cities within China’s Yangtze River Economic Belt (YREB) as the research sample. This choice is based on three main reasons: 1. The Yangtze River, being China’s largest river, is strategically located, spanning three major regions of the East, Middle East, and West, and possessing rich ecological resources. This provides a favourable geographic foundation for green development. 2. YREB plays a crucial role as the driving force of China’s economic development, with substantial potential for market demand and growth. 3. YREB exhibits significant variations in terms of resources, environment, and industrial foundation across its upper, middle, and lower reaches, making it valuable to study as a whole.
This paper takes 9 provinces and 2 municipalities in YREB from 2011 to 2020 as a sample to measure the impact of GF on MIU. The entropy method is used to measure the level of GF and MIU in the YREB. Referring to Zhang et al. (2023a) model construction, the article added spatial factors and empirically analyzed them by constructing a spatial model. Firstly, the explanatory, dependent, and control variables are identified. Secondly, the Moran index measurement method is used to test the spatial autocorrelation coefficient of the GF index and MIU to determine whether there is a global spatial autocorrelation. A suitable model is chosen to comprehensively analyze and systematically study the relationship between GF and MIU and the spatial spillover effect between regions. Eventually, it is concluded that the growth of GF has a facilitating effect on MIU, and the MIU in the core area has a remarkable spatial spillover effect on the MIU in the neighbouring regions.
The contributions of this paper are mainly the following: 1. Currently, the academic community, both domestically and globally, primarily concentrates on the correlation between GF and the industrial structure, while few academics have examined the effect of GF on MIU. This article conducts theoretical research on the impact of GF on MIU to make up for this theoretical gap. 2. This article adds spatial factors to the original basic regression to further analyze the spatial effect of GF on the transformation and upgrading of the manufacturing industry in the Yangtze River Economic Belt. 3. A practical examination of how GF affects MIU and its spatial impact is essential for responsible banks to offer green credit support to high-quality and key enterprises in the traditional manufacturing sector. This will help the traditional MIU to conduct technological research and development to enable them to develop in a high-end and green direction. Moreover, this study will encourage the government to deepen GF reform, save financing costs, and accelerate the elimination of manufacturing enterprises. The study is not only of theoretical significance at the academic level but also an essential part of practicing the philosophy of green progress and realising the sustainable development of manufacturing enterprises.
2 Literature review
2.1 The impact of GF on the transformation and upgrading of industrial structure
China’s manufacturing industry is currently at a critical juncture, facing both restrictions and opportunities. This is due to the gradual saturation of the low-end market and the rapid development of the high-end market. Moreover, the country’s focus on sustainable development in recent years has accelerated this process (Gu et al., 2021). Unlike traditional financial models, GF can play its unique role. The primary preoccupation of the present literature focuses on the impact of GF on industrial structures, just like the works of Hu and Hong (2022), Nian and Dong (2022), and Gong et al. (2022). Wang and Li (2022) and Zhang et al. (2023b), and others further studied the regional differences in this effect. The theoretical mechanisms and empirical methods of the above works are referenced for our study of GF and MIU.
2.2 Mechanisms of action
2.2.1 Capital orientation mechanism
GF mainly affects MIU through capital orientation, information transmission, technological innovation and other mechanisms. The capital-oriented mechanism means financial institutions make market-oriented choices and allocate funds to industries with high marginal capital output or high growth potential to make profits. In this process, inefficient industries will gradually be eliminated due to a lack of funds. Various production factors will be transferred from the traditional heavy chemical industry to the low-carbon industry sector, promoting MIU.
Financial institutions mainly use financial tools to implement different financing methods for various types of enterprises to promote the flow of funds to green manufacturing enterprises. Due to policy support, green industry enterprises can access financial resources at a lower cost, leading to decreased financing expenses (Xu and Li, 2020). This helps in fostering the development and advancement of green industries. On the other hand, highly polluting enterprises will encounter challenges in securing finances, including increased financing costs Li et al. (2022) and limited access to funding. Li et al. (2024) also suggest that companies that enhance their investments in environmental management may displace economically polluting industries.
2.2.2 Information transmission mechanism
China has used the information transmission mechanism by enacting green financial policies. By promulgating a green credit policy, the government specifies the penalties and incentives for some enterprises, thus clearly conveying to the enterprises the intention of the government and financial agencies to support green industries. Financial institutions are restructuring the funding constraints of some corporations and delivering the respective warning or encouragement signals to encourage more corporations to take the initiative to adjust the direction of the industry and transform to green. Through the information transmission mechanism, investors and producers can make investment or production choices based on financial market information, promoting a reasonable manufacturing industry transformation. Chen et al. (2021) discovered that after government intervention, manufacturing firms would be compensated, rewarded, or punished for their innovative behaviour through transfer payments, tax breaks, etc. As a result, all firms eventually shift to green and low-carbon innovation (Chen et al., 2021). Yang et al. (2022) explored whether implementing financial policies can change the attitudes of institutional investors using data from China. Ultimately, it was found that short-period speculators were more likely to be influenced by green financial policies (Yang et al., 2022). In addition, there are some related policies, such as Zhao et al. (2023), who argue that low-carbon strategies can facilitate the digital transformation of manufacturing firms.
2.2.3 Technological innovation mechanism
In the process of MIU, technological innovation can break through the bottleneck constraints of key and core technologies, promote the large-scale application and rapid iterative upgrading of new technologies, and promote manufacturing industrial development towards high-end cleaning. However, when faced with solid financing constraints, enterprises prefer to invest limited funds in projects with good returns, quick results, and no time for technological innovation. GF can help solve financing constraints, provide financial support, and stimulate technological innovation through synergies with environmental regulatory policies at the regional level Jiang et al. (2022). Furthermore, it can improve the sustainable development performance of enterprises Ding et al. (2022) and further promote green production. Technological innovation projects tend to be high-risk. A developed green financial market can provide investors with more efficient and diverse investment products and risk-avoidance tools. It can also enhance the enthusiasm for venture capital investment in technological innovation projects and offer good technical support for MIU.
2.3 Spatial effects of green finance
Spatial factors were initially widely used to analyze geographical issues. However, they have become increasingly constrained by geographic limitations in the traditional finance sector’s operations and development. Therefore, spatial factors have been added to many economic studies based on realistic considerations. Scholars have developed spatial metrology techniques through continuous research, enabling spatial analysis. Economic features in a specific spatial region are frequently associated with economic features in surrounding areas. Today, scholars employ spatial thinking to address financial issues.
Although there are differences between GF and traditional finance, GF is still an innovative financial development model based on traditional finance. Therefore, the evolution of GF is also intimately associated with the geographical location between regions. Many scholars have considered spatial factors when studying the topic of GF. Some scholars have concluded that GF in the Yangtze River Delta has an apparent spatial agglomeration impact with great regional differences Xie et al. (2020). GF presents a significant spatial agglomeration between provinces Wang B et al. (2023). All these studies show that the evolution of GF itself has spatial relevance. Studies on the spatial spillover impacts of GF are mainly divided into the following directions: Feng et al. (2022) concluded that the impact of GF on carbon emissions has significant regional heterogeneity. Huang et al. (2022) demonstrates that GF is instrumental in promoting green innovation in the locality and neighbouring provinces. Some scholars have researched the implications of GF on reducing ambient pollution and confirmed the existence of a significant spatial spillover effect Lin et al. (2023). Concerns have also been raised about the spatial effect of GF on industrial structure optimisation and inter-regional industrial rationalisation Gao et al. (2023) and Wang Z et al. (2023).
The research mentioned above shows that there are remarkable regional variations in GF. In manufacturing industry growth, regions with higher levels of GF development can take advantage of financial development to drive surrounding areas to provide the necessary production factors for the core area. This will facilitate the transfer of resources from surrounding areas to the central area, foster the clustering of industries, and leverage economies of scale to promote urban innovation in central cities. Meanwhile, China’s GF policy is committed to establishing a unified GF system and GF market. It also focuses on creating a favourable financial atmosphere for the evolution of the local MIU and radiating it to the surrounding region. The development strategy of GF in the core region can be used as an effective prototype for the growth of GF in surrounding areas. The nearby stress in the region will also drive the development of GF, contribute positively to local manufacturing innovation, and promote MIU.
2.4 Overview
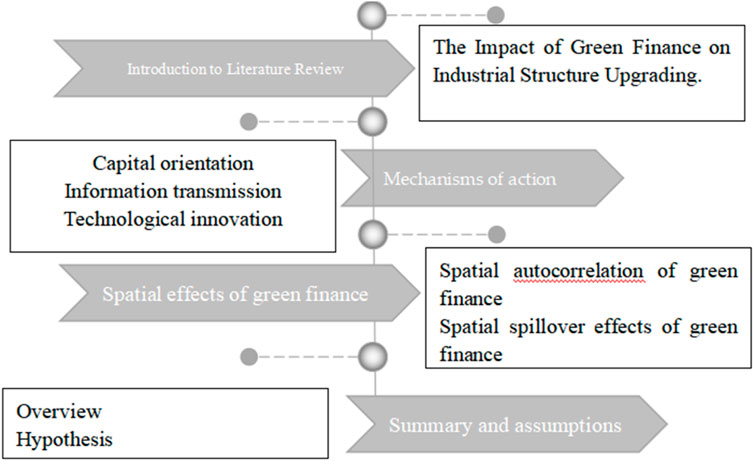
From previous literature, it is not difficult to conclude that GF can promote MIU through capital orientation, information transmission and technological innovation. Some scholars believe that GF has remarkable spatial spillover effects on specific economic and ecological environmental characteristics. This shows that the current research direction of GF is extensive, but the study on the spatial effect of GF on MIU is not perfect. Most scholars closely follow the impact of GF on industrial institutions and have not studied the manufacturing industry as an independent subject. The relevant literature review framework is shown in Figure 1. After reviewing relevant literature and theoretical basis, this paper chooses the manufacturing industry as the main body and puts forward the following hypothesis:
Hypothesis 1:. GF in the YREB has facilitating effects on the MIU.
3 Variable setting and indicator construction
3.1 Selection of samples
Data from 11 provinces and cities in China’s YREB during 2011–2020 were regularised. The data mainly come from the CSMAR database and China Statistical Yearbook. After subsequent collation, 1,694 data on GF and 990 data on manufacturing transformation were obtained.
3.2 Variable setting
3.2.1 Explained variable
This paper mainly analyzes the manufacturing industrial restructure and its promotion from a multi-dimensional perspective, distinguishing the MIU from the traditional upgrading of industrial structure. The paper builds a system of integrated metrics from four aspects: manufacturing operation scale, manufacturing technology innovation, manufacturing production efficiency and manufacturing low-carbon development. The operation scale of the manufacturing industry is an essential cornerstone of MIU. At the time of international industrial transfer and the deepening of the global industrial division of labour, China has seized the opportunity to take advantage of the demographic dividend to form the advantage of low cost and low price in the global production system. It has also expanded manufacturing production and provided a relatively favourable environment and foundation for the subsequent MIU, with the transfer of energy-directed and labour-intensive industries. The R&D investment of MI in high-tech fields continues to grow, providing a constant impetus for MIU. The productivity of MI also reflects MIU to some extent. Compared with the low-end manufacturing industry, the high-end manufacturing industry, with advantages in research and development, design, processing and manufacturing, and product services, has higher production efficiency. The low-carbon development of MI is an inevitable requirement for the MIU, and the MIU will also react to the low-carbon development. MI is the main body of wastewater and waste gas discharge. Accelerating the MIU can adapt to the ecological concept, meet people’s yearning for clear water and green mountains, and adapt to changes in international economic and trade rules. The construction of specific indicators is shown in Table 1.
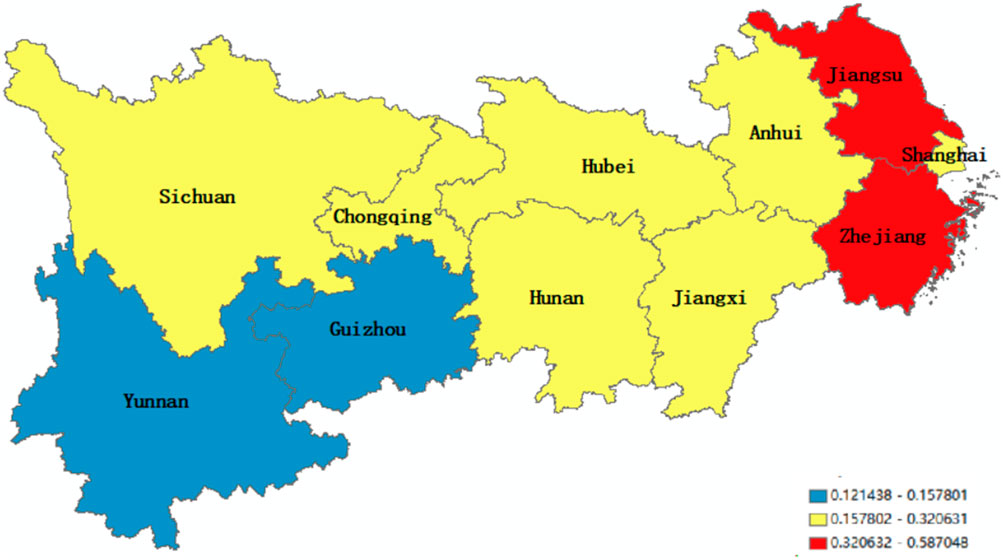
To assure the coherence and usability of data, the entropy method is used to gauge MIU. Figure 2 clearly shows the range in which the 2020 MIU are located in each province and city. Jiangsu and Zhejiang performed better in the MIU.
Taking Jiangsu as an example, there are several important reasons. Firstly, the added value proportion in MI has remained stable, with the strategic emerging industries’ output value and high-tech industries in Jiangsu accounting for 37.8% and 46.5%, respectively. Generally, high-tech industries produce less pollution, and MI’s innovation capacity has been consistently improving. The R&D investment intensity of manufacturing firms has reached about 2%, which has doubled compared to the end of the “12th Five-Year-Plan” period. Two national manufacturing innovation centres have been established, covering 1/8 of the country’s total. There are 33,000 high-tech enterprises. Finally, green development has reached a new level. The revenue of the seven high energy-consuming industries accounted for 28.6%. Emissions per unit of industrial-added value declined by 20% compared to 2020.
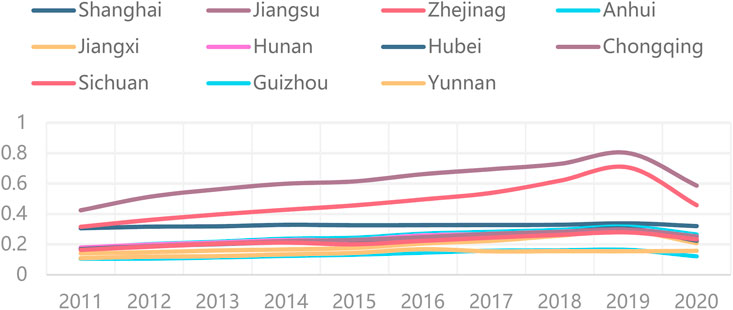
Figure 3 reveals the changes in the level of MIU from 2011 to 2020. MIU in Jiangsu and Zhejiang continued to rise from 2011 to 2019 and declined after reaching a peak in 2019, which may be caused by the impact of the epidemic, upward pressure on factor costs, and overcapacity. The cleanliness index of Guizhou and Yunnan is low, and Guizhou has shown a downward trend year by year in 2020.
This is because Yunnan and Guizhou are located in the southwest, with less plain area, more mountains and plateaus, and backward traffic. Although the natural resources, mineral reserves, tourism resources and climate environment in these two regions are among the best in the country, traffic has restricted too much development. Secondly, the population quality in this area is low, and the original farming and lifestyle of slash-and-burn cultivation, extensive planting, and thin harvest persist. Education is backward, and colleges and universities’ scientific and technological strength is not strong. Finally, the scientific and technological investment in the two provinces is seriously insufficient, and the level of scientific and technological achievements that have been converted into productivity is low. Besides the tobacco and nonferrous metal industries, other sectors are small and lack a solid foundation, particularly in high-tech and automobile steel manufacturing. The industrial base is fragile, the service industry’s growth is limited, and there’s a lack of industry transformation and upgrading.
3.2.2 Explanatory variable
Because of GF’s complexity, we measure it as a comprehensive indicator in the index setting. We have selected green credit, investment, insurance, bond, support, fund, and equity to construct the GF index.
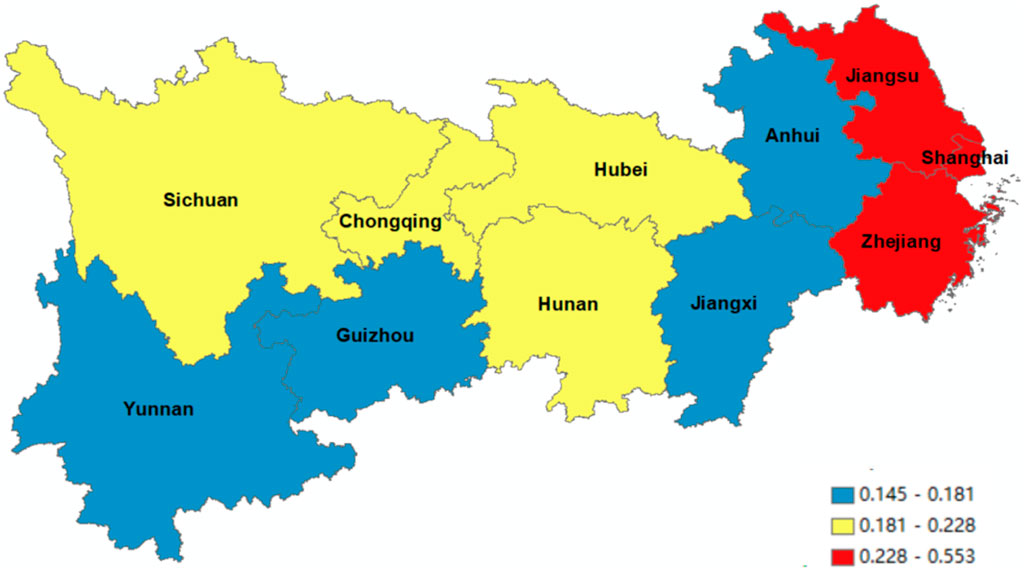
Figure 4 illustrates the extent of GF in 11 provinces and municipalities. We can see that Jiangsu, Zhejiang, and Shanghai are red areas, which means their GF index lies between 0.228 and 0.553. This is because these three regions are bordered by the Yellow Sea and the East Sea, located at the confluence of rivers and seas, and are the most developed economic sectors in China with the largest scale of economic volume, which have unique advantages in talent training. Furthermore, the number of enterprises in these three regions is large, the competition is greater, and they respond quickly to the financial policies promulgated by the state.
In addition, some regions have special factors, such as Jiangsu. Jiangsu’s green credit scale accounts for one-tenth of the national total. The Jiangsu Provincial Government has established a diversified GF supply system covering the entire province using financial and fiscal incentives, effectively mobilising market players to participate in the progress of ecological civilisation. Since 2021, multiple financial institutions in Jiangsu have continuously innovated green financial products, strengthened precision services in key areas, and established a reasonably diversified green financial product system. Several provincial financial institutions have been actively promoting the development of green finance (GF). They have continuously improved their research capabilities in GF and accelerated the construction of research platforms, such as the GF Alliance for small and medium-sized banks. The joint efforts of the government and financial agencies have contributed to the growth of GF in Jiangsu province.
3.2.3 Control variables
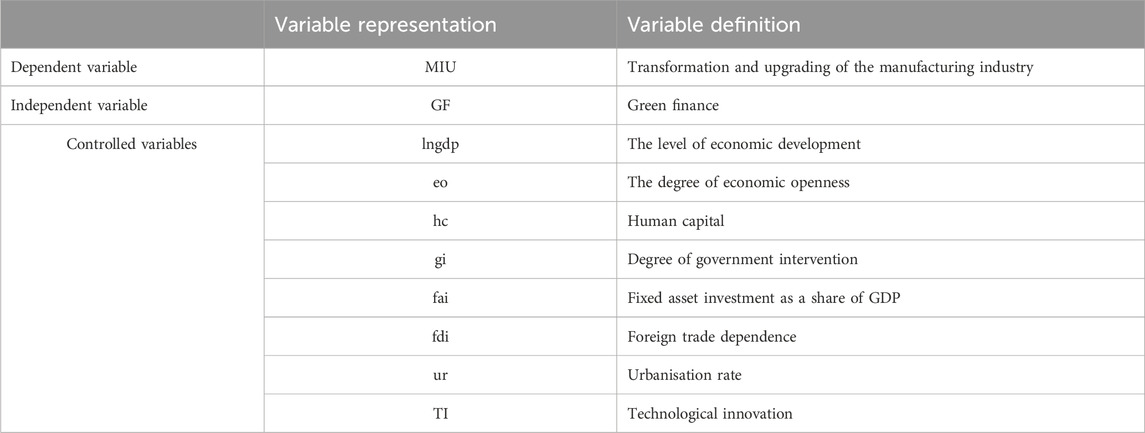
The control variables include (1) the level of economic development. (2) The degree of economic openness. (3) Human capital, i.e., log form of per capita education expenditure. (4) Degree of government intervention, i.e., general fiscal expenditure as a share of GDP in logarithmic form. (5) Fixed asset investment as a share of GDP. (6) Foreign trade dependence, i.e., foreign direct investment in logarithmic form. (7) Urbanisation rate. (8) Technological innovation. Table 2 shows all the variables mentioned.
3.3 Indicator construction
The entropy method is not limited by timeliness and regional differences when calculating weights. The calculation process is based on quantitative data, enabling it to effectively reflect changes in MIU and GF. Therefore, this paper utilises the entropy method to measure the MIU and GF index. Before we analyze the original data, it’s important to note that the presence of large values can skew the regression results. Therefore, it’s necessary to normalise the metrics before computing the weights of each metric. We used the following formula to process the data:
The second step calculates the weight of a sample to the indicator. Specific calculations are shown in Equation 3.
The third step calculates the entropy value of the indicator. Specific calculations are shown in Equation 4.
The fourth step calculates the entropy value of each indicator of the agent based on the amount of information reflected in the system by each agent. Specific calculations are shown in Equation 5.
The fifth step calculates the influence weight of each proxy indicator in the comprehensive evaluation system. Specific calculations are shown in Equation 6.
In the sixth step, the proxy indicators are cumulatively summed with their impact weights to obtain the composite indicator values. Specific calculations are shown in Equation 7.
4 Empirical studies
4.1 Spatial autocorrelation test
A spatial weight matrix was added to the original linear regression to reflect the spatial correlation between GF and MIU. Before the specific model construction, the Moran index measurement method was used to examine the spatial autocorrelation coefficient of MIU and judge whether there is a global spatial autocorrelation. Finally, the spatial econometric model is chosen to comprehensively and systematically study the spatial spillover effect between the sampled 11 provinces and cities in the YREB.
First, the paper selects the economic distance matrix E as the spatial weight matrix to conduct the Moran index test, which considers the difference in economic level between regions. Usually, the per capita income difference or the economic development level between the regions is selected as the economic distance. If the differences in economic development between regions are greater, then the spatial weighting coefficient is smaller, and vice versa. The specific setting is shown in Equation 8: where
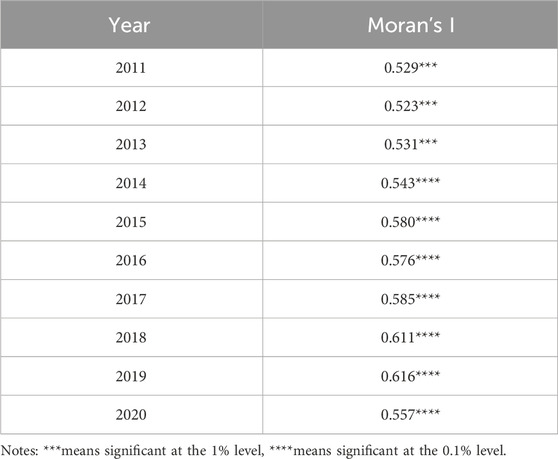
The spatial autocorrelation test results of MIU are presented in Table 3. MIU has a positive spatial autocorrelation and presents a state of high aggregation and low aggregation, which is suitable for further analysis by using the spatial econometric model.
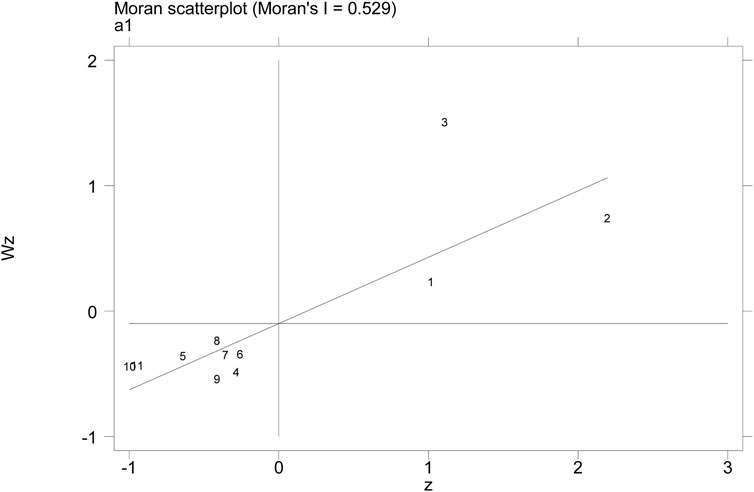
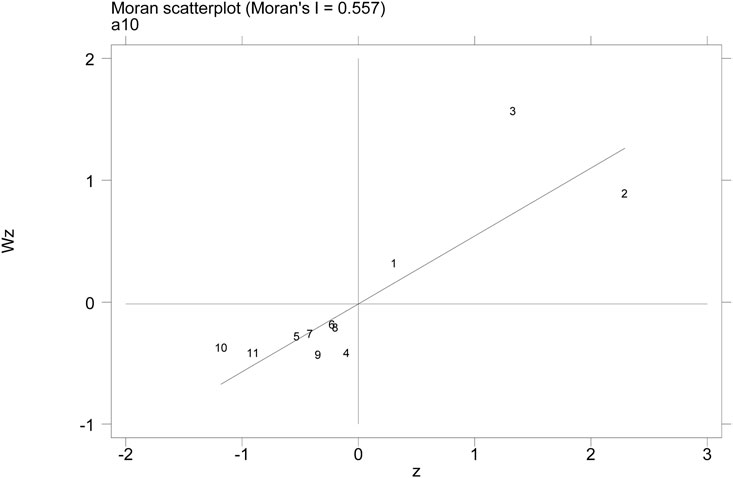
After the global spatial autocorrelation test, the paper further utilises the Moran index to recognise the spatial agglomeration of specific provinces and cities and uses the Moreland scatter plot to assist the judgment. The paper presents the Moran scatter chart of MIU YREB in 2011 and 2020. From the scatterplot of MIU in as can be seen from Figures 5, Figure 6, there is no change between the first and third quadrants in 2011 and 2020. MIU generally presents obvious spatial characteristics of high and high agglomeration and low and low agglomeration, which indicates that MIU between regions is relatively stable. The MIU is mainly limited to the province (city). The high-level area has not yet formed a spillover effect on the surrounding low-level area, and it has not been able to drive the industrial upgrading of the surrounding area.
4.2 Model building
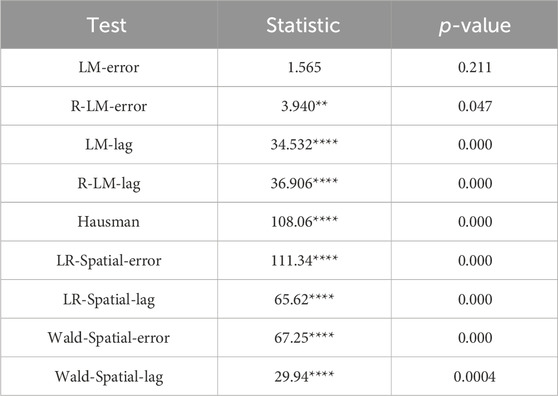
After determining that the object of study has significant spatial autocorrelation, we need to select a suitable spatial measurement model through further testing. Spatial econometric models mainly include spatial lag model (SAR), spatial error model (SEM) and spatial Durbin model (SDM). Compared with the other two models, the spatial Durbin model takes into account the spatial lag effects of both the dependent and independent variables and can simultaneously analyze the spatial spillover effects of the dependent and independent variables in a region. A series of tests were done to determine the specific model. First, the LM test is carried out on the panel data to identify the presence of spatial error effects and spatial lag effects. Through Table 4, we find that the LM test results of the spatial error model are not significant, but they pass its robust LM test. The LM test of the spatial lag model and the robust LM test reject the null hypothesis. Therefore, the spatial econometric model can be chosen for regression. Furthermore, the LR and Wald tests were done, and the correlation statistic was significant at 0.1% level, indicating that SDM cannot degenerate into SAR or SEM. In addition, the Hausman test showed significant results at 0.1% level, rejecting the original hypothesis. In conclusion, the following spatial model is constructed based on the spatial Durbin model with fixed effects.
In Equation 9, i stands for the region, t represents the year, and
4.3 Descriptive statistics
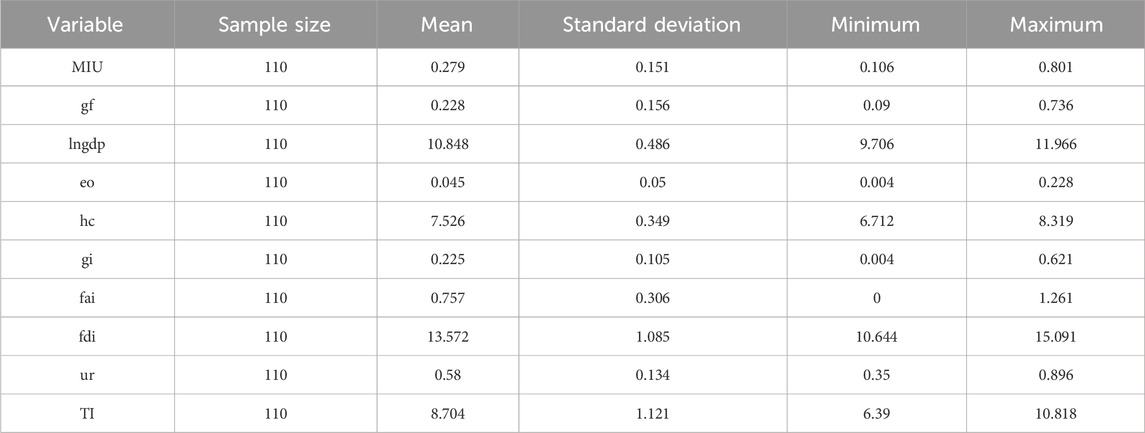
The contents in Table 5 are descriptive statistics of the relevant variables, where the data involved are from publicly available data with no outliers. The statistical results show a small difference in GF between provinces and municipalities. The analysis suggests that there isn’t a significant disparity in the level of focus and backing for green financial development across provinces and municipalities. Although there is a difference in the transformation and upgrading indicators of MI, it is not substantial. This is due to the variation in pollution levels in the manufacturing sector across different regions, which correspondingly leads to differing degrees of clean-up efforts.
There is a big gap in technological innovation between provinces and cities, and the development of regional innovation capacity is unbalanced. This is due to the differences in resource capacity, geographic conditions, policy orientation of each province, and different degrees of investment in technological innovation. In addition, the disparities between the GDP, human capital, and urbanisation rate in the control variables are also very obvious, coinciding with the current situation of unbalanced development between regions in China.
4.4 Regression analysis
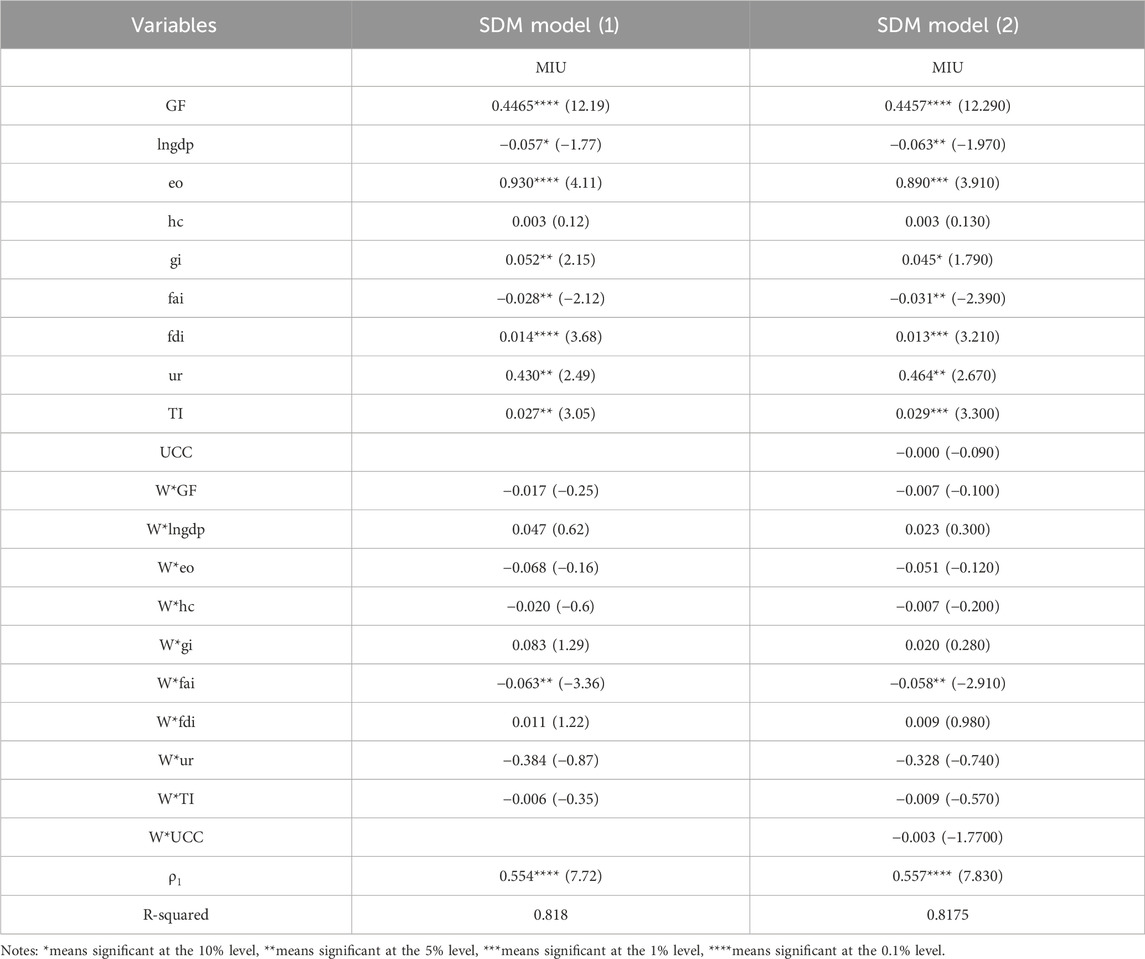
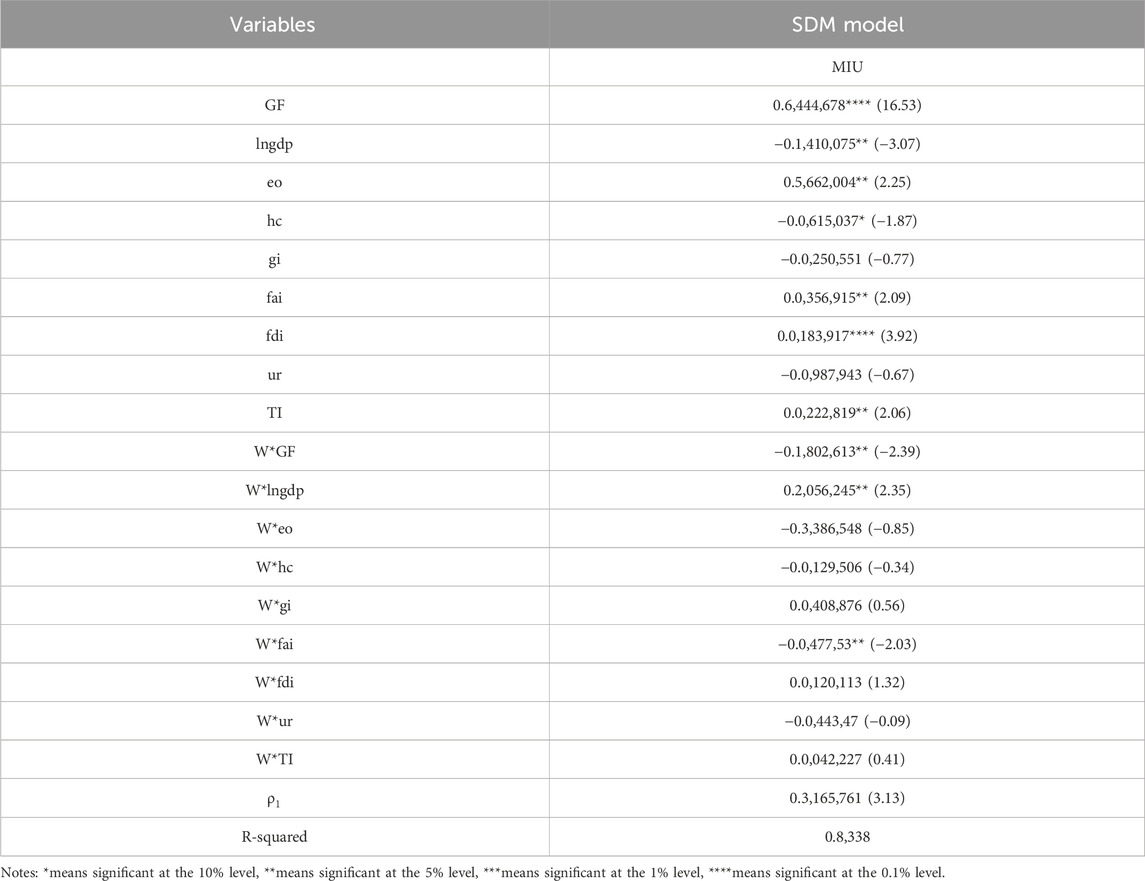
According to the above tests, a fixed effects model is chosen to construct the model. On this basis, the paper conducts regression on the three forms of the fixed effect model, compares the overall goodness of fit R2 of the three regression results, and finally chooses the individual fixed effect model with the highest goodness of fit. The specific findings are presented in Table 6.
Based on the above table, the spatial effect of GF development level on MIU in China’s YREB is analyzed. The spatial autoregressive coefficient of MIU is 0.554, which is significant at the 0.1% level, suggesting that MIU has a remarkable positive spatial spillover effect. Thus, a higher level of MIU in this region will facilitate MIU in neighbouring regions.
The explanatory variable GF development has a strong promoting effect on the MIU, and the impact coefficient is 0.4465, passing the significance test of 0.1%. GF regulates the investment of financial capital and social capital in low-carbon industries and enterprises that adopt green production methods so that these enterprises can obtain funds at a lower cost and force MIU. The spillover effect of GF on the MIU is not significant due to the immaturity of GF’s development. Its influence is currently limited to the province or city, and it has not been able to drive the MIU in the surrounding areas.
Finally, this study investigates the impact of control variables on MIU in provinces (cities) within YREB. The regression analysis reveals a positive effect of government fiscal expenditure on industrial upgrading, indicating that appropriate fiscal intervention can promote the transformation and development of MI. Furthermore, GF can coordinate with financial support mechanisms to jointly facilitate its transformation and upgrading. However, we have observed that fixed asset investment has a restraining effect on MIU. Adequate capital is allocated to fixed assets, reducing research and development costs and hindering talent acquisition necessary for manufacturing development.
There is a clear positive correlation between economic openness, dependence on foreign trade, urbanization rate, and industrial development. The expansion of economic openness and the growing influx of foreign capital have provided a strong economic foundation and a source of power for the MIU. Furthermore, a higher urbanization rate results in more working people and their aspirations for a better living environment further drive the MIU’s growth. Regarding the spatial effect of other variables, the coefficient of financial expenditure remains positive. It has a significant impact, indicating that government intervention in the surrounding region has a promoting effect on MIU. The coefficient of fixed asset investment is markedly negative, showing that the fixed asset investment in the surrounding area will have an inhibiting effect on the MIU in the region.
4.5 Spatial effect decomposition
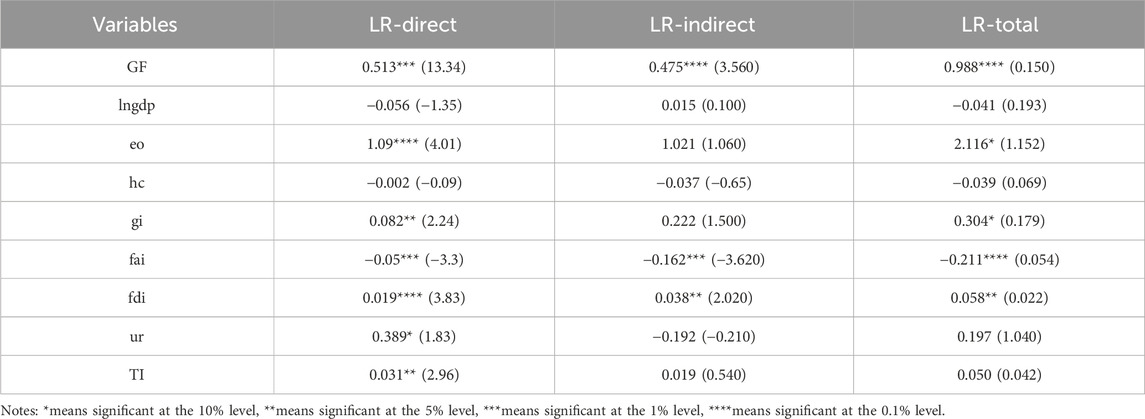
The paper further decomposed the spatial hysteresis effect shown in Table 7. The direct, indirect, and total effects of GF in the YREB on the MIU are significantly positive. This demonstrates that promoting GF in the region remarkably influences the local and surrounding MIU. It also encourages the development of MI in the region, exerts a spillover effect, and guides the surrounding manufacturing industry to transform and upgrade. Government fiscal expenditure will not only directly affect the MIU in the region but also have a spatial spillover effect on the peripheral areas. Additionally, Fixed asset investment will not only hinder the MIU in the region but also inhibit the MIU in the peripheral areas.
4.6 Robustness tests
Robustness testing can be done by adding control variables, and we introduce the coordination level of urban consumption as a new control variable for the robustness test. The outcomes are presented in Table 6. For GF, the regression results before and after adding control variables are still significant. The findings show that the relationship between GF and manufacturing transformation still holds.
In addition to adding control variables, we chose to replace the spatial matrix for robustness testing. The base regression model utilises the economic distance matrix, and we chose the economic-geographical weight matrix W for robustness testing, with the relevant calculations are shown in Equations 10, 11:
4.7 Endogeneity test
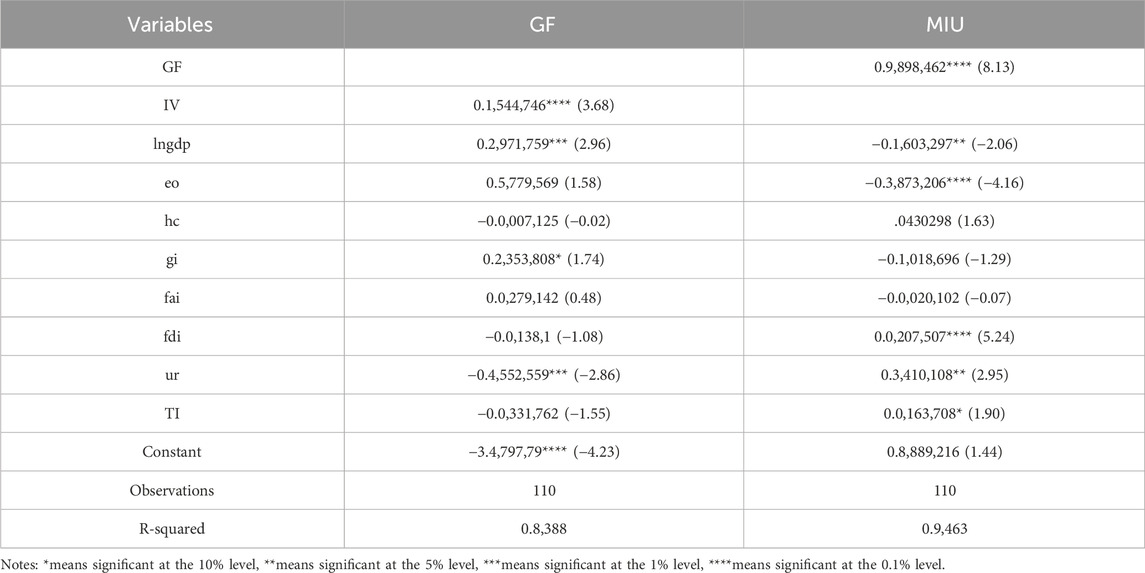
Issues such as bias in the measurement of GF and the possible existence of uncontrolled omitted variables lead to the endogeneity problem. In this paper, we refer to the study of Wang K et al. (2023) and choose to use two-stage least squares (2sls) to address the endogeneity problem. The instrumental variables (IV) are created by multiplying the number of banking institutions in each province by the average of the Green Finance (GF) for each province and then taking the logarithm. This instrumental variable is chosen because green credit has the greatest impact on the development of GF. Additionally, since the main source of green credit issuance in China is from banks, it serves as a reflection of the level of China’s GF development.
The results of the two-stage regression of the instrumental variable (IV) are presented in Table 9. In the first stage, the regression of the endogenous explanatory variable GF on IV yields a regression coefficient of 0.154, which is statistically significant at the 0.1% level, indicating the importance of IV. The weak instrumental variable test produces a p-value of 0.0043 and an F-value of 13.5132, which exceeds the threshold of 10, confirming the validity of the instrumental variable. Additionally, the number of IVs matches the number of endogenous explanatory variables, and there is no over-identification issue, demonstrating the robustness of the regression results.
4.8 Heterogeneity test
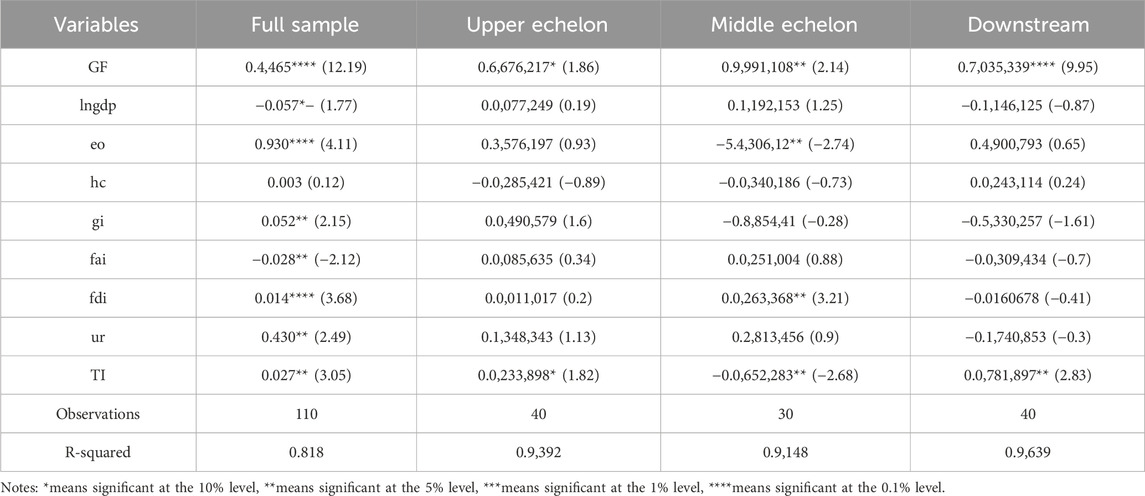
The impact of green finance on the transformation and advancement of the manufacturing industry varies across different regions. This study uses the National Bureau of Statistics division of the YREB region to categorize the sample into upstream, midstream, and downstream segments for a more in-depth analysis of the variations. According to Table 10, green finance can significantly promote the transformation and upgrading of the manufacturing industry in the upstream, midstream and downstream regions. The most significant promotion effect is found in the middle reaches, with a correlation coefficient of 0.999, which is significant at the 5% level. The correlation coefficient for the upstream region is 0.668, significant at the 10% level, and for the downstream region, it is 0.704, significant at the 0.1% level.
The middle reaches of the region mainly include Hubei, Hunan and Jiangxi provinces. These three places have sufficient energy and socio-economic resources and also occupy an important geographical location for transport. The development of GF has a unique advantage. In addition, the development of the traditional MI in the region is mainly based on the premise of energy resource consumption. The MIU is urgent, and the response to the GF policy is more timely and proactive. The downstream area includes Shanghai, Jiangsu, Zhejiang and Anhui provinces and cities. These four regions have a higher level of economic development and a more sound financial system. The development of GF has a strong supporting role, can better integrate green credit, green bonds, green insurance and other diversified financial services, and give full play to all types of financial instruments in the MIU. The upstream region includes four provinces and cities, namely Chongqing, Sichuan, Guizhou and Yunnan. Compared with other regions in the YREB, they have a better green ecological foundation, but limited by the level of macroeconomic development, their urbanisation process is relatively lagging behind, the development of MI is relatively slow, and the role of GF has limited space. In addition, the impact of GF on the MIU in the upstream region has a certain relationship with regional policies. On the one hand, the provinces and cities have a limited number of GF policies, a lack of innovation in policy tools, poor policy implementation and other issues. The second point is that even though local governments are more active in promoting policies, they are constrained by limited market effectiveness, and the promotion effect is slightly inferior to that of the middle and lower reaches.
5 Discussions
Based on panel data from the YREB region from 2011 to 2020, this paper focuses on studying the impact of GF on the MIU of the YREB and passes a series of tests. The following is a discussion of the relevant measurement results:
Firstly, the GF of the provinces and municipalities in the YREB region has gradually improved, with the average GF in 2020 higher than in 2011. Similarly, we find that the level of GF in YREB shows regional differences due to imbalances in regional economic and infrastructure development. The level of development in economically advanced regions along the eastern coast is generally higher than that in less developed inland areas. The eastern coastal region has a well-established financial and ecological foundation, with clear market demand and financial capacity for green development. Additionally, economically developed regions have advanced macroeconomic levels and strong green finance mechanisms, which can better connect the green development of the entire region. Some scholars consider the government to be a key player and focus on the impact of government financial (GF) policies on Manufacturing Industry Upgrading (MIU) Li (2024). However, MIU requires guidance from relevant government policies and increased efforts from financial institutions and relevant enterprises. Therefore, this article opts to examine the influence of GF on MIU. After conducting a benchmark regression and a series of robustness tests, we have concluded that GF significantly contributes to MIU in the YREB. This research’s findings share similarities with those of Wu (2024) but also have differences when compared to previous studies. For example, Zhang N et al. (2023) argued that a high level of MIU in one region would hinder the development of the manufacturing industry in neighbouring regions. This contradicts our research findings. We reasoned that when a region achieves MIU, it has amassed a substantial amount of replicable experience in transforming traditional industries and developing new ones. Similarly, the region has experienced significant capital accumulation and talent attraction while successfully achieving MIU. This accomplishment will also stimulate MIU in the neighbouring region. Unlike a study by Chen et al. (2023) that examined industry heterogeneity, we focused on analyzing regional heterogeneity, given the complex and extensive nature of the YREB region where the impact may vary. The strong promotion effect of GF on MIU in the midstream region can be attributed to the exceptional ecological resources and strong demand for green economic development in the central inland region. This enables active exploration of integrating GF and MI characteristics and utilizing GF development to promote MIU.
6 Conclusion and policy implications
6.1 Conclusion
At the level of empirical research, this paper discusses the impact of GF on MIU. It is well known that GF differs from traditional finance in its ability to combine financial and environmental protection activities (Zhu, 2022; Cai and Guo, 2021) to achieve a dual improvement of the economy and environment. The conclusion of this study shows that MIU in YREB has a spatial autocorrelation, and the region’s MIU has a promoting impact on MIU in the adjoining areas. Under the decomposition of spatial effects, GF’s direct and indirect effects on MIU have significant positive effects. The findings of this paper can help supplement the studies on aspects of GF and manufacturing structures’ transformation and upgrading. Simultaneously, from a practical perspective, this study can promote the promulgation of national policies related to GF and provide effective financing guarantees for the clean manufacturing industry.
Some experts have emphasized the effect of green financial instruments, which are becoming an influential financing mechanism (Yu et al., 2021). However, as GF in China is not yet well established, relevant data are difficult to obtain. Index selection is a limitation when measuring the GF index. Detailed data on the municipal units in each province are also difficult to obtain, so there is space for further improvement in the accuracy of GF indicators.
6.2 Policy implications
By researching GF, we suggest that the government actively use GF tools, gather green financial resources, and strive to build a global green financial centre while strengthening our financial foundation. To achieve these goals, this study recommends developing GF in the following ways.
Firstly, we need to improve the organizational system of green finance (GF). The government and stakeholders should establish green banks and other financial institutions specialised in serving green enterprises. This involves clarifying the operational management requirements of specialised institutions, establishing unique performance assessment methods different from those used by traditional financial institutions, and providing special preferential policies and financial subsidies for the employees of green financial institutions. Financial institutions, enterprises, and local governments should cooperate to establish a “green enterprise bank.” The government ought to supply interest subsidization to enterprises in the bank and provide financing guarantees for green enterprise entities.
Moreover, we need to improve the relevant incentive mechanisms. Government departments should give preferential loan policies to low-pollution and low-consumption enterprises. Additionally, they should accelerate the transformation of society capital into green investment in energy conservation industries by reducing the reserve margin ratio and raising the loan limit and other preferential methods to help grow green emerging industries (MacAskill et al., 2020). The government should provide subsidised support for green loans, bonds, or asset securitisation products. It should also give policy tilts to financial institutions that excel in green credit regarding refinancing, rediscounting, and other monetary policy tools. The government can also issue corresponding financial subsidies to stimulate the market, reduce enterprise financing costs, and raise their incentive to issue green bonds.
Furthermore, there must be a promotion of synergistic growth of GF in China and the establishment of a regional cooperation mechanism for GF. Establishing a trans-regional green financial information-sharing platform composed of governments, manufacturing enterprises, and financial institutions can break the inter-regional financial barriers, strengthen regional cooperation, and build a green industrial ecology. Realizing regional connectivity can also reduce the imbalance of regional development, provide more green financial support for surrounding provinces and cities, and drive the growth of peripheral manufacturing.
Lastly, promote the integration of GF and MIU, and develop new green financial products. First of all, the government should support the policy orientation of MIU and moderately support the improvement of the financing capacity of the MI. Secondly, financial institutions should continuously innovate green financial products and services and study their degree of fit with MIU. Given the long cycle and high demand for MIU loans, they should combine green financial products with MIU and develop medium and long-term credit products and special funds suitable for MIU. These will strengthen MIU’s green finance support.
Data availability statement
The raw data supporting the conclusions of this article will be made available by the authors, without undue reservation.
Author contributions
YS: Conceptualization, Data curation, Formal Analysis, Investigation, Methodology, Resources, Visualization, Writing–original draft. HZ: Formal Analysis, Investigation, Methodology, Software, Writing–review and editing. YW: Formal Analysis, Investigation, Methodology, Visualization, Writing–review and editing. YP: Formal Analysis, Investigation, Software, Validation, Visualization, Writing–review and editing. DT: Conceptualization, Formal Analysis, Project administration, Supervision, Writing–review and editing.
Funding
The author(s) declare that no financial support was received for the research, authorship, and/or publication of this article.
Conflict of interest
The authors declare that the research was conducted in the absence of any commercial or financial relationships that could be construed as a potential conflict of interest.
Publisher’s note
All claims expressed in this article are solely those of the authors and do not necessarily represent those of their affiliated organizations, or those of the publisher, the editors and the reviewers. Any product that may be evaluated in this article, or claim that may be made by its manufacturer, is not guaranteed or endorsed by the publisher.
References
Cai, R., and Guo, J. (2021). Finance for the environment: a scientometrics analysis of green finance. Mathematics 9 (13), 1537. doi:10.3390/math9131537
Chen, H., Wang, J., and Miao, Y. (2021). Evolutionary game analysis on the selection of green and low carbon innovation between manufacturing enterprises. Alexandria. Eng. J. 60 (2), 2139–2147. doi:10.1016/j.aej.2020.12.015
Chen, M., Song, L., Zhu, X., Zhu, Y., and Liu, C. (2023). Does green finance promote the green transformation of China’s manufacturing industry? Sustainability 15 (8), 6614. doi:10.3390/SU15086614
Ding, X., Jing, R., Wu, K., Maria, V., Petrovskaya, L. I., Zhikun, S., et al. (2022). The impact mechanism of green credit policy on the sustainability performance of heavily polluting enterprises-based on the perspectives of technological innovation level and credit resource allocation. Int. J. Environ. Res. Public Health 19 (21), 14518–14525. doi:10.3390/ijerph192114518
Feng, L., Shang, S., An, S., and Yang, W. (2022). The spatial heterogeneity effect of green finance development on carbon emissions. Entropy 24 (8), 1042. doi:10.3390/e24081042
Fu, L., and Liu, A. (2022). China statistical yearbook. China: National Bureau of Statistics (NBS), 4–5. doi:10.40049/y.cnki.yinfn.2022.000001
Gao, L., Tian, Q., and Meng, F. (2023). The impact of green finance on industrial reasonability in China: empirical research based on the spatial panel Durbin model. Environ. Sci. Pollut. Res. 30 (22), 61394–61410. doi:10.1007/s11356-022-18732-y
Gong, Y., Song, Z., and Lyu, Z. (2022). “Green finance, industrial structure upgrading and high-quality economic development-empirical analysis based on PVAR model,” in 2022 13th international conference on E-business, management and economics (ICEME 2022) (Beijing, China: Association for Computing Machinery) Date: 2022.7.16-7.18, 333–339. doi:10.1145/3556089.3556154
Gu, B., Chen, F., and Zhang, K. (2021). The policy effect of Green Finance in promoting industrial transformation and upgrading efficiency in China: analysis from the perspective of government regulation and public environmental demands. Environ. Sci. Pollut. Res. 28, 47474–47491. doi:10.1007/s11356-021-13944-0
Hu, J., and Hong, Z. (2022). Has Green Finance optimized the industrial structure in China? Environ. Sci. Pollut. Res. Int. 6. doi:10.1007/s11356-022-24514-3
Huang, Y., Chen, C., Lei, L., and Zhang, Y. (2022). Impacts of green finance on green innovation: a spatial and nonlinear perspective. J. Clean. Prod. 365, 132548. doi:10.1016/j.jclepro.2022.132548
Jiang, L., Wang, Y., and Zhang, J. (2022). Local-neighborhood effects of environmental regulations on green technology innovation in manufacturing:Green credit-based regulation. Front. Environ. Sci. 10. doi:10.3389/fenvs.2022.1072180
Li, G., Luo, J. I., and Liu, S. (2024). Performance evaluation of economic relocation effect for environmental non-governmental organizations: evidence from China. Economics 18, 20220080. doi:10.1515/econ-2022-0080
Li, J. (2024). Research on the influence of green finance on green transformation of manufacturing industry. Acad. J. Bus. and Manag. 6 (1). doi:10.25236/AJBM.2024.060108
Li, W., Cui, G., and Zheng, M. (2022). Does green credit policy affect corporate debt financing? Evidence from China. Environ. Sci. Pollut. Res. 29, 5162–5171. doi:10.1007/s11356-021-16051-2
Lin, Z., Liao, X., and Yang, Y. (2023). China's experience in developing green finance to reduce carbon emissions: from spatial econometric model evidence. Environ. Sci. Pollut. Res. 30 (6), 15531–15547. doi:10.1007/s11356-022-23246-8
MacAskill, S., Roca, E., Liu, B., Stewart, R. A., and Sahin, O. (2020). Is there a green premium in the green bond market? Systematic literature review revealing premium determinants. J. Clean. Prod. 280, 124491. doi:10.1016/j.jclepro.2020.124491
Nian, W., and Dong, X. (2022). Spatial correlation study on the impact of green financial development on industrial structure upgrading. Front. Environ. Sci. 10, 1017159. doi:10.3389/fenvs.2022.1017159
Wang, Z., Teng, Y.-P., Wu, S., and Chen, H. (2023). Does green finance expand China’s green development space? Evidence from the ecological environment improvement perspective. Systems 11 (7), 369. doi:10.3390/systems11070369
Wang, B., Wang, Y., Cheng, X., and Wang, J. (2023). Green finance, energy structure, and environmental pollution: evidence from a spatial econometric approach. Environ. Sci. Pollut. Res. 30 (28), 72867–72883. doi:10.1007/s11356-023-27427-x
Wang, K., Yang, H., Zhou, J., and Hu, F. (2023). Fintech, financial constraints and OFDI: evidence from China. Glob. Econ. Rev. 52 (4), 326–345. doi:10.1080/1226508X.2023.2283878
Wang, W., and Li, Y. (2022). Can green finance promote the optimization and upgrading of industrial structures? Based on the intermediary perspective of technological progress. Front. Environ. Sci. 10. doi:10.3389/fenvs.2022.919950
Wu, Y. (2024). Study on green finance enabling manufacturing enterprises to green transformation and sustainable development path. Proc. Ser. 3 (1). doi:10.31058/J.PS.2024.30011
Xie, H., Ouyang, Z., and Choi, Y. (2020). Characteristics and influencing factors of green finance development in the Yangtze River Delta of China: analysis based on the spatial Durbin model. Sustainability 12 (22), 9753. doi:10.3390/su12229753
Xu, X., and Li, J. (2020). Asymmetric impacts of the policy and development of green credit on the debt financing cost and maturity of different types of enterprises in China. J. Clean. Prod. 264, 121574. doi:10.1016/j.jclepro.2020.121574
Yang, W., Lai, P., Han, Z., and Tang, Z. P. (2022). Do government policies drive institutional preferences on green investment? Evidence from China. Environ. Sci. Pollut. Res. 30, 8297–8316. doi:10.1007/s11356-022-22688-4
Yu, X., Mao, Y., Huang, D., Sun, Z., and Li, T. (2021). Mapping global research on green finance from 1989 to 2020: a bibliometric study. doi:10.1155/2021/9934004
Zhang, X., Shan, Z., Wang, X., and Tang, D. (2023a). The impact of green finance on upgrading the manufacturing industry of the Yangtze River Economic Belt based on the spatial econometric model. Sustainability 15 (12), 9766. doi:10.3390/su15129766
Zhang, X., Shan, Z., Wang, X., and Tang, D. (2023b). The impact of green finance on upgrading the manufacturing industry of the Yangtze River Economic Belt based on the spatial econometric model. Sustainability 15 (12), 9766. doi:10.3390/su15129766
Zhang, N., Sun, J., Tang, Y., Zhang, J., Boamah, V., Tang, D., et al. (2023). How do green finance and green technology innovation impact the Yangtze River Economic belt’s industrial structure upgrading in China? A moderated mediation effect model based on provincial panel data. Sustainability 15 (3), 2289–2322. doi:10.3390/su15032289
Zhao, S., Zhang, L., An, H., Lin, P., Zhou, H., and Hu, F. (2023). Has China's low-carbon strategy pushed forward the digital transformation of manufacturing enterprises? Evidence from the low-carbon city pilot policy. Environ. Impact Assess. Revie 102, 107184. doi:10.1016/j.eiar.2023.107184
Keywords: green finance, manufacturing industry, transformation and upgrading, spatial durbin model, Yangtze River economic belt (YREB)
Citation: Sun Y, Zhong H, Wang Y, Pan Y and Tang D (2024) The effect of green finance on the transformation and upgrading of manufacturing industries in the Yangtze River economic belt of China. Front. Environ. Sci. 12:1473621. doi: 10.3389/fenvs.2024.1473621
Received: 31 July 2024; Accepted: 09 October 2024;
Published: 23 October 2024.
Edited by:
Ilyas Ahmad, University of Education Lahore, PakistanReviewed by:
Lina Zhang, Hohai University, ChinaMohsin Altaf, Canterbury Christ Church University, United Kingdom
Copyright © 2024 Sun, Zhong, Wang, Pan and Tang. This is an open-access article distributed under the terms of the Creative Commons Attribution License (CC BY). The use, distribution or reproduction in other forums is permitted, provided the original author(s) and the copyright owner(s) are credited and that the original publication in this journal is cited, in accordance with accepted academic practice. No use, distribution or reproduction is permitted which does not comply with these terms.
*Correspondence: Yuning Wang, MzIwMjIwOTQ1NTAwQGx6dS5lZHUuY24=
 Yanbing Sun1
 Decai Tang