 Hui Kang
 Wenzhang Dou1,3
- 1School of Software and Microelectronics, Peking University, Beijing, China
- 2China Mobile Communications Group Beijing Co., Ltd., Beijing, China
- 3Institute of Strategy, Peking University, Beijing, China
- 4Big Data Center, China Aero Geophysical Survey and Remote Sensing Center for Natural Resources (AGRS), Beijing, China
Water resource asset (WRA) accounting holds great importance in ecological civilization construction. Existing WRA accounting methods heavily rely on statistical data, resulting in issues such as missing and inaccessible data. Moreover, they only consider the value brought by the physical resources, such as water quantity and quality, while neglecting the value brought by the ecological functions. Therefore, by fully exploiting the rapid, objective, and efficient advantages of remote sensing (RS) in monitoring surface objects, this article develops a surface WRA (SWRA) accounting method based on multi-source RS data. First, a representation model is innovatively proposed, with full consideration of the ecological service functions offered by water resources. Specifically, the SWRAs are represented by two parts: tangible and intangible assets. The tangible asset refers to the quantifiable stock of water resources. Surface water volume is adopted as the indicator for tangible assets in this article. The intangible asset, which primarily embodies the ecological service functions provided by water resources, encompasses five major categories: flood regulation, carbon fixation, oxygen release, water purification, and water conservation. Furthermore, due to different units, the total amounts cannot be summed or compared directly. Therefore, this article utilizes price tools to convert SWRAs into price value, ultimately achieving SWRA accounting. The established method was tested in Miyun, Beijing, China, from 2013 to 2023. The findings demonstrate that the SWRA value reached its peak in 2023, amounting to
1 Introduction
As the foundation of sustainable development, natural resource asset accounting is of great significance to national decision-making, ecological protection, and social equity. In recent years, governments worldwide have introduced a series of policies, such as compiling natural resource balance sheets and establishing a system for auditing outgoing leaders’ management of natural resources to advance ecological civilization, conserve resources, and safeguard the ecological environment (Tang et al., 2020). Surface water resources are a vital part of natural resources and play a critical role in human existence and development. With the rapid socio-economic development and profound changes in the environment and climate, concerns regarding surface water resources have become more noticeable, posing a significant constraint to economic development and people’s livelihoods (Guan and Hubacek, 2008; Aznar-Sánchez et al., 2018). Therefore, it is necessary to investigate an effective surface water resource asset (SWRA) accounting method.
Natural resource asset accounting has been studied in recent years (Li and Yin, 2016; Hu et al., 2018; Fang and Ji, 2021). However, the methods described in those articles cannot be directly applied to WRA and fail to comprehensively consider various aspects of WRAs. Consequently, a few studies have begun to separate water resources from natural resources and focus on the WRA accounting. Dee et al. initiated the first research on the WRA accounting index system (Dee et al., 1973), based on which Vilanova et al. developed a new system incorporating economic and social benefits (Vilanova et al., 2015). Lu et al. devised an accounting index system based on the water resource balance sheet, conducting a system to assess the performance of water resource management and protection in Gansu, China, from 2014 to 2016 (Lu et al., 2019). Wang et al. established an accounting index system based on the Drive-Pressure-State-Impact-Response (DPSIR) model (Wang and Yang, 2017) that covers five key aspects: drive, pressure, state, impact, and response. In order to consider the social and economic factors, Yang et al. applied a fuzzy mathematical model of water resource value, taking into account resources, the environment, society, and efficiency (Yang et al., 2017). Furthermore, Chen et al. constructed an accounting index system for the WRA outgoing audit evaluation system from four dimensions: resource, environment, society, and economy (Chen et al., 2023). The article utilized the analytic hierarchy process (AHP) and the initial comparison scoring method to comprehensively assess the water resource management performance of a certain city during 2018–2020. Although the techniques mentioned above establish a comprehensive accounting system for natural resources, they encounter several practical problems and are difficult to apply. One major challenge is that these methodologies heavily rely on regional statistical and survey data, which frequently suffer from issues that include missing or incomplete data and challenges in data acquisition. This reliance restricts the promptness and geographical specificity of the accounting, hence impacting the practical effectiveness of the accounting system. In addition, the current methodologies only evaluate the water resource based on measurable physical factors like quantity and quality without considering the ecological functions offered by natural resources. Hence, it is imperative to research effective and viable accounting approaches for SWRA.
This study proposes an SWRA accounting method based on multi-source RS data that takes full advantage of the rapid, objective, and efficient benefits of remote sensing (RS) technology to greatly enhance the feasibility of accounting operations. The main contributions are:
The article is organized as follows. Section 2 introduces the materials and the proposed methods, and Section 3 experiments the proposed methods in the Miyun District based on multi-source RS data. The results are discussed in Section 4. The conclusions are given in Section 5.
2 Materials and methods
2.1 Research area and data sources
Miyun District is located in the northeastern region of Beijing, between N
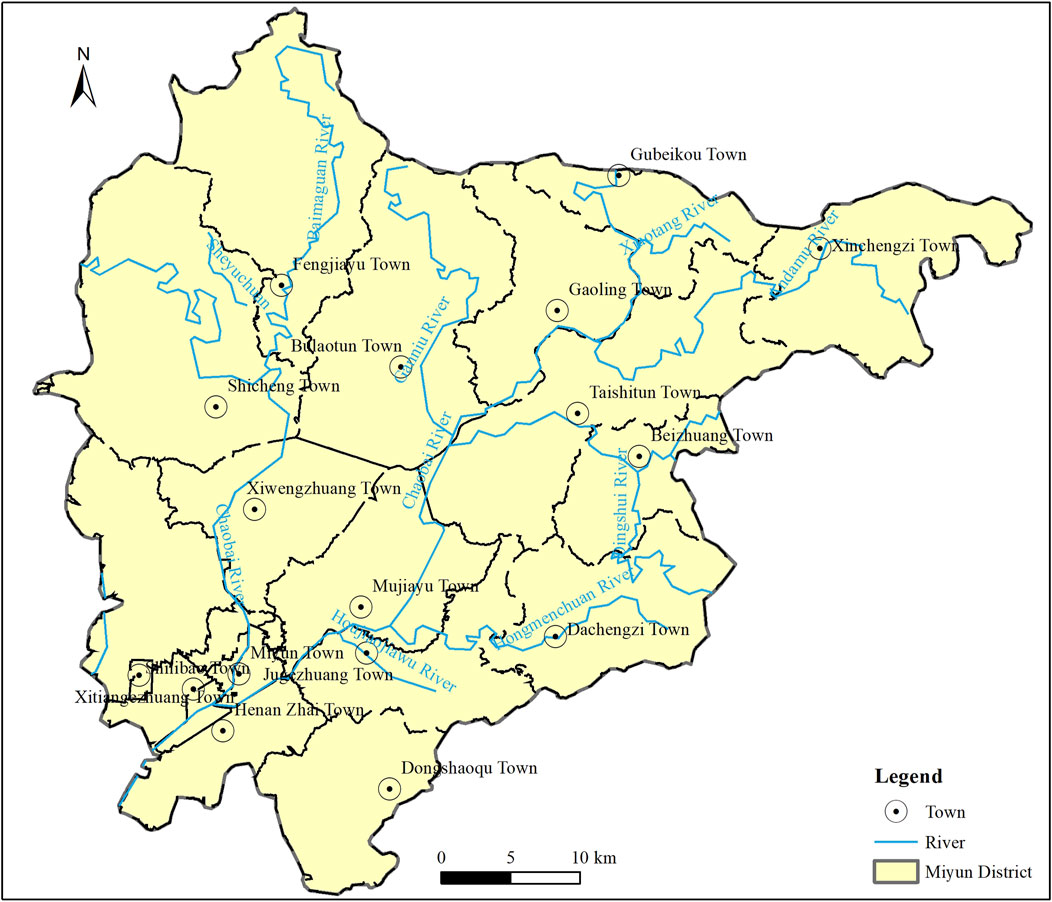
Figure 1. Location map of Miyun District, Beijing.
The RS data used in this article include Landsat Collection 2 Level-2 (LC2L2), Moderate-Resolution Imaging Spectroradiometer (MODIS) MOD16A2, and Global Land Surface Satellite (GLASS) products. Rainfall data are provided by the Beijing Miyun Reservoir Management Office and the China Meteorological Data Service Centre (CMDC). All data are collected from the period of 2013–2023.
2.2 Surface water resource asset accounting method
Figure 2 shows the proposed novel SWRA accounting method, which consists of three major phases. First, the SWRAs are modeled as tangible and intangible assets. Then, SWRAs are calculated based on multi-source RS data. Afterward, the SWRA value is accounted for using price tools. More details are explained as follows.
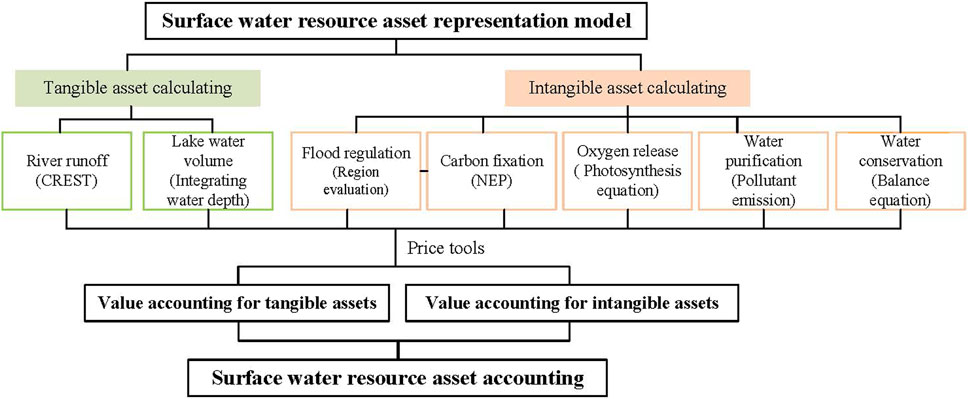
Figure 2. Flowchart of the proposed method.
2.2.1 SWRA model
This section provides a detailed description of the proposed SWRA model. By considering the ecological service function, the SWRAs are represented as two components: tangible and intangible assets. Tangible assets refer to physical entities that can be seen and touched, such as water area and volume. This article uses surface water volume as the tangible asset indicator, denoted by
Due to different accounting units, the total amount cannot be summed and compared. The price tool is applied to convert the assets into price values, hence achieving the SWRA accounting. The ultimate SWRA value is indicated by
where
2.2.2 Calculating SWRA based on multi-source RS data
As previously stated, most current methods rely on statistical data, which suffer from limitations such as coarse time resolution and significant regional bias. To address these limitations, this study computes the SWRAs, that is, tangible and intangible assets, using multi-source RS data.
2.2.2.1 Tangible asset calculating
According to Section 2.2, this article considers water volume as a tangible asset. The evaluation objects for surface water resources include rivers, lakes, reservoirs, and ponds. The calculation methods for water volume vary between rivers and lakes/reservoirs. Therefore, the surface water volume is determined from two aspects: river runoff and lake water volume. The latter aspect is applicable to reservoirs and ponds.
where
where
2.2.2.2 Intangible asset calculating
As discussed in Section 2.2, the intangible assets are represented by five indexes: water conservation, flood regulation, carbon fixation, oxygen release, and water purification.
The specific values of
where
where
where
where
where
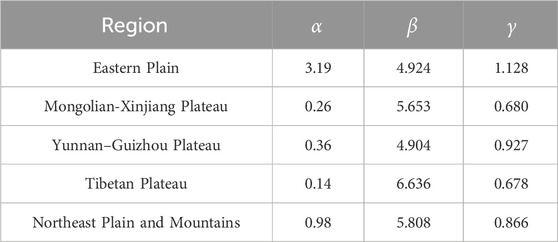
Table 1. Parameters for flood regulation evaluation in different regions.
2.2.3 SWRA value accounting by price tools
This section uses price tools to unify the accounting units, assess the economic value of the SWRAs acquired earlier and present that value in monetary terms.
2.2.3.1 Value accounting for tangible assets
The calculation of volume value is based on the market value method, that is, as Equation 10.
where
2.2.3.2 Value accounting for intangible assets
in which
where
where
where
in which
3 Results
In order to analyze the effectiveness of the proposed accounting method in this article, we select Miyun City, Beijing, as a research area to realize its SWRA assessment over a period of 10 years, from 2013 to 2023.
3.1 Using the proposed method to calculate the value of the tangible assets
The evaluation objects for surface water in Miyun include rivers, reservoirs, and ponds. The section runoff for rivers is calculated by the trained CREST model in Wang et al. (2011), and the river length is calculated by ArcMap. We determine the water depth for reservoirs and ponds using the inversion model in Behrenfeld and Falkowski (1997). The water volume can be calculated by combining the surface water area in Miyun following Kang et al. (2023).
China is divided into six regions based on the collection standards for water resource fees. The average collection standard for surface water resource fees in Beijing and Tianjin is 1.6 yuan/m3. The average collection standard in Shanxi and Inner Mongolia is 0.5 yuan/m3. The standard in Hebei, Shandong, and Henan is 0.4 yuan/m3, and the standard in Liaoning, Jilin, Heilongjiang, Ningxia, and Shaanxi is 0.3 yuan/m3. The standard in Jiangsu, Zhejiang, Guangdong, Yunnan, Gansu, and Xinjiang is 0.2 yuan/m3. The standard in the remaining regions is 0.1 yuan/m3. The average collection standard for surface water fees in Miyun is aligned with the standard set for Beijing and Tianjin, which is 1.6 yuan/m3.
3.2 Using the proposed methodintangible assets
3.2.1 Flood regulation
Because Miyun belongs to the eastern plain region, the flood regulation is calculated by
3.2.2 Carbon fixation
The carbon fixation is derived by Equation 4, and the NEP is calculated by Equation 6. The conversion coefficient between NEP and NPP is 0.086 in Beijing. The NPP is calculated using the VGPM model trained in Behrenfeld and Falkowski (1997). The inputs of VGPM are the maximum photosynthesis rate of the water body, photosynthetically active radiation intensity, Zeu (euphotic depth), and illumination period. The maximum photosynthesis rate of a water body is the function of temperature. Photosynthetically active radiation intensity can be obtained by GLASS. Zeu can be calculated by suspended matter concentration and chlorophyll concentration, which can be inferred based on LC2L2. The illumination period is calculated by the average sunrise and sunset times.
3.2.3 Oxygen release
After acquiring the carbon fixation, the oxygen release can be derived according to Equation 7.
3.2.4 Water purification
In these experiments, three emissions, including total nitrogen, total phosphorus, and COD, are chosen. The TP, TN, and COD are calculated by models in Li et al. (2017), Duan (2006), and Peng (2022), respectively. All models take LC2L2 SR data as inputs. The pollution equivalents for TN, TP, and COD are 0.8, 0.25, and 1, respectively.
3.2.5 Water conservation
The evapotranspiration in Equation 9 comes from MODIS MOD16A2. The rainfall data are obtained from the Miyun precipitation station. The surface water area in Miyun is obtained by Kang et al. (2023).
4 Discussion
The numerical values of the individual SWRAs are listed in Table 2, and their economic values are listed in Table 3. As can be seen clearly, the water resources in Miyun decreased significantly from 2013 to 2015, with notable reductions in various aspects.
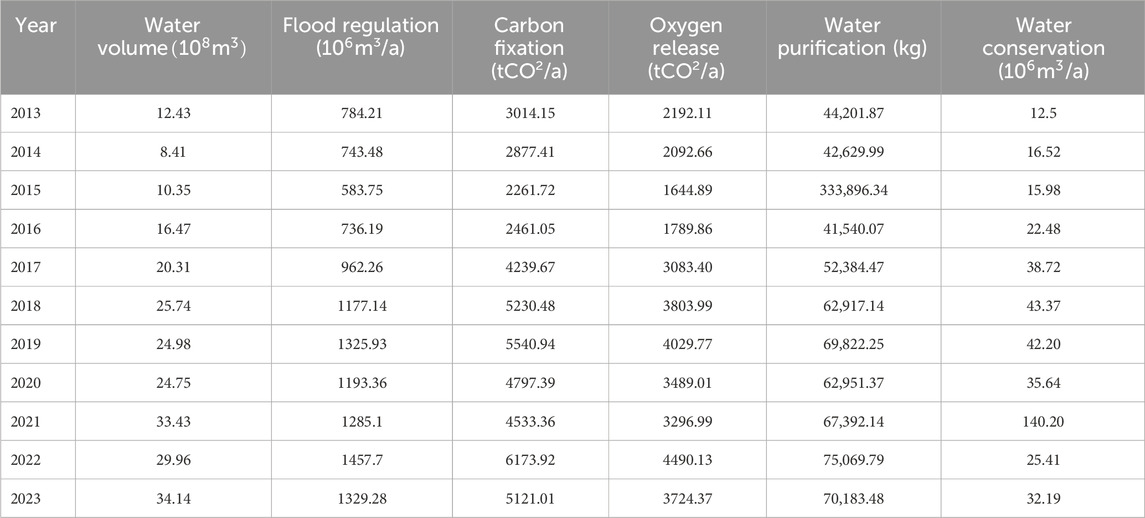
Table 2. The numerical values of water storage and five SWRAs in Miyun from 2013 to 2023.
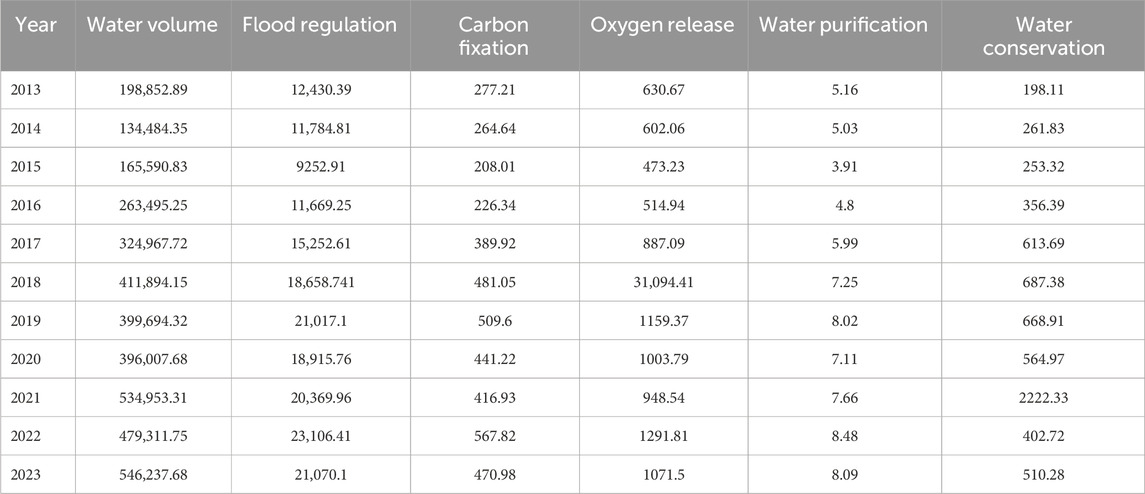
Table 3. Economic values for water storage and five SWRAs (104yuan) in Miyun from 2013 to 2023.
The data presented in Table 2 clearly show that the water gradually dried up from 2013 to 2015. However, it has seen a large-scale and sustained increase since 2015, stabilizing by 2019. This outcome demonstrates the effectiveness of the South-to-North Water Diversion Project, which was put into operation at the end of 2014. It opened up a new water source for Beijing. Over 70% of the water supply in urban Beijing now comes from the Middle Route, effectively alleviating the city’s water shortage and allowing Miyun Reservoir to recover and replenish. In 2020, due to maintenance work on the Beijing section of the Middle Route, the water supply decreased, resulting in a slight drop in water volume. By 2023, over
As indicated in Table 3, Beijing’s SWRA values have steadily increased since 2015. This positive change is not only attributed to the implementation of the South-to-North Water Diversion Project but is also inseparable from the strategic deployment of the local government, such as the Miyun “5+2” water conservation system. These projects prioritize water resource protection, spare no effort in safeguarding water sources, strengthen ecological construction, and pursue the path of green development. Note that the value of water conservation reached an abnormal maximum in 2021. This is because Beijing experienced an extraordinarily long flood season lasting 122 days, with 79 rainfall events occurring from June 1st to September 30th in 2021. Of these, 10 rainfall events reached or exceeded the intensity of heavy rain, including two instances of torrential rain. In addition, overall climate conditions were poor in Beijing in 2022, featuring a marked warm and dry climate, with precipitation being the lowest since 2012. Therefore, there was a notable decrease in the value of water conservation in 2022.
5 Conclusion
In response to the deficiencies of existing water resource accounting methods, this article proposes a novel approach to water resource asset accounting based on multi-source remote sensing data. This method considers the ecological service functions of water resources, encompassing both tangible and intangible assets. It further realizes the valuation of assets through pricing tools, providing a more accurate and efficient methodological foundation for water resource asset auditing. Taking Miyun, Beijing, as an example, this article utilizes the proposed method to conduct a rapid SWRA accounting in Miyun District from 2013 to 2023. The results indicate that the value of SWRA is the highest in 2023, reaching
Data availability statement
Publicly available datasets were analyzed in this study. These data can be found here: https://geocloud.cgs.gov.cn/#/home.
Author contributions
HK: data curation, formal analysis, methodology, writing–original draft, and writing–review and editing. WD: conceptualization, project administration, and writing–review and editing. LC: investigation, methodology, resources, writing–review and editing, and funding acquisition. LH: methodology, software, and writing–review and editing. XS: funding acquisition, supervision, writing–review and editing, and resources. ZD: visualization, writing–review and editing, and formal analysis.
Funding
The author(s) declare that financial support was received for the research, authorship, and/or publication of this article. This research was funded by the provincial and ministerial project, grant number ARGS2024X043. The article processing charge (APC) was funded by ARGS2024X043.
Conflict of interest
Author HK was employed by China Mobile Communications Group Beijing Co., Ltd.
The remaining authors declare that the research was conducted in the absence of any commercial or financial relationships that could be construed as a potential conflict of interest.
Publisher’s note
All claims expressed in this article are solely those of the authors and do not necessarily represent those of their affiliated organizations, or those of the publisher, the editors, and the reviewers. Any product that may be evaluated in this article, or claim that may be made by its manufacturer, is not guaranteed or endorsed by the publisher.
References
Aznar-Sã¡nchez, J. A., Belmonte-Ureña, L. J., Velasco-Muñoz, J. F., and Manzano-Agugliaro, F. (2018). Economic analysis of sustainable water use: a review of worldwide research. J. Clean. Prod. 198, 1120–1132. doi:10.1016/j.jclepro.2018.07.066
Behrenfeld, M. J., and Falkowski, P. G. (1997). Photosynthetic rates derived from satellite-based chlorophyll concentration. Limnol. Oceanogr. 42, 1–20. doi:10.4319/lo.1997.42.1.0001
Chen, J., Tian, G., Li, J., and Xu, H. (2023). Research on the outgoing audit and evaluation of water resource assets of leadership cadres in city y. Sustainability 15, 12535. doi:10.3390/su151612535
Dee, N., Baker, J., Drobny, N., Duke, K., Whitman, I., and Fahringer, D. (1973). An environmental evaluation system for water resource planning. Water Resour. Res. 9, 523–535. doi:10.1029/WR009i003p00523
Duan, H. (2006). Hyperspectral data applied in monitoring and evaluating the water trophic state of lake chagan. Environ. Sci. 7, 1219–1226. doi:10.3321/j.issn:0250-3301.2006.03.020
Fang, Q., and Ji, Y. (2021). Outgoing audit of natural resource assets of leading cadres and earnings management of enterprises: based on the perspective of accrual and real earnings management. J. Of Ocean Univ. Of China 3, 59–72. doi:10.16497/j.cnki.1672-335X.202103006
Guan, D., and Hubacek, K. (2008). A new and integrated hydro-economic accounting and analytical framework for water resources: a case study for north China. J. Environ. Manag. 88, 1300–1313. doi:10.1016/j.jenvman.2007.07.010
Hu, Q., Huo, J., Li, L., Wang, Y., Cui, T., and Liu, Y. (2018). Index system of water ecological civilization city: perspectives and suggestions. J. Yangtze River Sci. Res. Inst. 35, 22–26. doi:10.11988/ckyyb.20170076
Kang, H., Dou, W., and Han, L. (2023). Rapid remote sensing monitoring of surface water based on deeplabv3+. Remote Sens. Nat. Resour. doi:10.6046/zrzyyg.2023227
Li, B., and Yin, H. (2016). Research on the term-end audit method of natural resources assets responsibility of leading cadres based on the fuzzy theory. Audit & Econ. Res. 31, 28–34.
Li, Y., Zhang, Y., Shi, K., Zhu, G., Zhou, Y., Zhang, Y., et al. (2017). Monitoring spatiotemporal variations in nutrients in a large drinking water reservoir and their relationships with hydrological and meteorological conditions based on landsat 8 imagery. Sci. Total Environ. 599-600, 1705–1717. doi:10.1016/j.scitotenv.2017.05.075
Lu, H., Wei, Y., Yang, S., and Lu, P. (2019). Study on balance sheet based audit method of natural assets of leading cadres leaving office a case study of water resource audit in gansu province. J. Glaciol. Geocryol. 41, 227–235. doi:10.7522/j.issn.1000-0240.2019.0104
Peng, Y. (2022). Water quality parameter inversion and eutrophication evaluation of Tangxun Lake based on Landsat8 satellite image data. Huazhong university of science and technology. Master’s thesis. doi:10.27157/d.cnki.ghzku.2022.005389
Ren, Z., Wan, Y., Wang, W., Wang, J., Song, Y., and Zhang, F. (2023). Research on water depth inversion of yunlong lake based on landsat-9 images. Jiangsu Water Conserv., 51–55. doi:10.16310/j.cnki.jssl.2023.10.016
Tang, Y., Zhou, Q., and Jiao, J. (2020). Evaluating water ecological achievements of leading cadres in anhui, China: based on water resources balance sheet and pressure-state-response model. J. Clean. Prod. 269, 122284. doi:10.1016/j.jclepro.2020.122284
Vilanova, M. R. N., Magalhães Filho, P., and Balestieri, J. A. P. (2015). Performance measurement and indicators for water supply management: review and international cases. Renew. Sustain. Energy Rev. 43, 1–12. doi:10.1016/j.rser.2014.11.043
Wang, J., Hong, Y., Li, L., Gourley, J. J., Khan, S. I., Yilmaz, K. K., et al. (2011). The coupled routing and excess storage (crest) distributed hydrological model. Hydrological Sci. J. 56, 84–98. doi:10.1080/02626667.2010.543087
Wang, Y., and Yang, Y. (2017). “Research on the construction of audit and evaluation system for outgoing water resource assets of leading cadres,” in 2017 China water ecology conference, 331–334.
Yang, Y., Liu, Y., Cao, S., and Cheng, Y. (2017). A method of evaluating water resource assets and liabilities: a case study of jinan city, shandong province. Water 9, 575. doi:10.3390/w9080575
Keywords: surface water resource, asset accounting, remote sensing, tangible assets, intangible assets
Citation: Kang H, Dou W, Chen L, Han L, Sui X and Ding Z (2024) A surface water resource asset accounting method based on multi-source remote sensing data. Front. Environ. Sci. 12:1473419. doi: 10.3389/fenvs.2024.1473419
Received: 31 July 2024; Accepted: 19 August 2024;
Published: 11 September 2024.
Edited by:
Chengye Zhang, China University of Mining and Technology, ChinaReviewed by:
Heng Dong, Wuhan University of Technology, ChinaChao Chen, Suzhou University of Science and Technology, China
Wenzhi Zhao, Beijing Normal University, China
Copyright © 2024 Kang, Dou, Chen, Han, Sui and Ding. This is an open-access article distributed under the terms of the Creative Commons Attribution License (CC BY). The use, distribution or reproduction in other forums is permitted, provided the original author(s) and the copyright owner(s) are credited and that the original publication in this journal is cited, in accordance with accepted academic practice. No use, distribution or reproduction is permitted which does not comply with these terms.
*Correspondence: Li Chen, Y2xpX2FAbWFpbC5jZ3MuZ292LmNu