 Alexandra C. Oliver
 Barret L. Kurylyk
 Lindsay H. Johnston
 Nicole K. LeRoux
 Lauren D. Somers
 Rob. C. Jamieson*
- Department of Civil and Resource Engineering and Centre for Water Resources Studies, Dalhousie University, Halifax, NS, Canada
Anthropogenic climate change and associated increasing nutrient loading to coasts will worsen coastal eutrophication on a global scale. Basin Head is a coastal lagoon located in northeastern Prince Edward Island, Canada, with a federally protected ecosystem. Nitrate-nitrogen (NO3-N) is conveyed from agricultural fields in the watershed to the eutrophic lagoon via intertidal groundwater springs and groundwater-dominated tributaries. A field program focused on four main tributaries that discharge into the lagoon was conducted to measure year-round NO3-N loading. These measurements were used to calibrate a SWAT+ hydrologic model capable of simulating hydrologic and NO3-N loads to the lagoon. Several climate change scenarios incorporating different agricultural best management practices (BMPs) were simulated to better understand potential future NO3-N loading dynamics. Results indicate that all climate change scenarios produced increased annual NO3-N loading to the lagoon when comparing historical (1990–2020) to end of century time periods (2070–2100); however, only one climate scenario (MRI-ESM2-0 SSP5-8.5) resulted in a statistically significant (p-value <0.05) increase. Enlarged buffer strips and delayed tillage BMP simulations produced small (0%–8%) effects on loading, while changing the crop rotation from potato-barley-clover to potato-soybean-barley yielded a small reduction in NO3-N loading between the historical period and the end of the century (26%–33%). Modeling revealed changes in seasonal loading dynamics under climate change where NO3-N loads remained more consistent throughout the year as opposed to current conditions where the dominant load is in the spring. An increase in baseflow contributions to streamflow was also noted under climate change, with the largest change occurring in the winter (e.g., up to a five-fold increase in February). These findings have direct implications for coastal management in groundwater-dominated agricultural watersheds in a changing climate.
Introduction
Rising water temperatures and increased export of freshwater and nutrients to the coast are expected to exacerbate coastal eutrophication in future years (Rabalais et al., 2009). Anthropogenic changes such as industrialization and increased population are responsible for accelerated climate change and increased nutrient loading to coastal water bodies (Howarth, 2008; Oppenheimer et al., 2019). In addition to the deleterious human and ecosystem health impacts of coastal eutrophication (Cloern, 2001; Sinha et al., 2019), the degradation of coastal waters impacts the ecosystem services provided by the water body such as recreation, tourism, and cultural value (Malone and Newton, 2020).
Agricultural activity and on-site domestic wastewater treatment systems can cause increased nitrate-nitrogen (NO3-N) loading in rural watersheds. Soil nitrate can be derived from mineral fertilizers, manures, biological nitrogen fixation and soil organic matter (Zebarth et al., 2015). Since the advent of nitrogen fertilizer for agriculture in the 20th century, global usage has increased to approximately 10 times the rate of consumption in 1961 (Lu and Tian, 2017). Nitrogen in the form of ammonia is applied to agricultural fields through chemical fertilizer where it is readily converted to nitrite, then to nitrate by microorganisms in soil and groundwater (Fetter et al., 2017). Nitrate-nitrogen can be transported by runoff over agricultural fields or through groundwater flow once precipitation infiltrates into the aquifer (Spalding and Exner, 1993). Accordingly, the intensification in nitrogen use has resulted in accelerated coastal eutrophication due to non-point source, diffusive transport of soluble nitrate to the coast (Arhonditsis et al., 2000; Malone and Newton, 2020).
Climate change is expected to negatively affect agricultural activities across the globe (Bennett et al., 2021; Nelson et al., 2009), impacting moisture availability and plant physiology, and affecting agricultural productivity (Mahato, 2014) due to increasing air temperatures, shifting precipitation regimes, and increasing frequency and severity of extreme events (AghaKouchak et al., 2020; Rivera, 2014; Wang et al., 2022). These hydrometeorological changes could all contribute to changing agricultural practices and productivity. For example, increased temperatures are expected to prolong agricultural growing seasons (AAFC, 2020) and shift the source of irrigation from rainwater to groundwater (Paradis et al., 2016; Afzaal et al., 2020; Bhatti et al., 2022), further stressing vulnerable water resources. Agricultural best management practices (BMPs) have been developed to help confront, among other stressors, the impacts of future climate change (Lal et al., 2011; Wagena and Easton, 2018). While proactive agricultural practices like BMPs help to reduce nutrient losses from agricultural fields, the efficacy of BMPs in mitigating NO3-N contamination in a changing climate is not well understood (Liu et al., 2017; Zebarth et el., 2015). Coastal agricultural watersheds are subject to additional stressors compared to inland watersheds, including the conversion of traditional nutrient sinks like wetlands and riparian zones to agricultural use (Boesch and Brinsfield, 2000) and other phenomena (e.g., seawater intrusion, coastal flooding, soil salinity) that impact agricultural sustainability (Gopalakrishnan et al., 2019; Tackley et al., 2023).
Understanding of nutrient transport dynamics from agricultural watersheds under a changing climate can be developed by using process-based simulation tools that incorporate changes in climate forcing and agricultural practices. The SWAT+ (Soil and Water Assessment Tool) hydrologic model is a time continuous, semi-distributed watershed model that simulates quality and quantity of surface water and groundwater over a three-dimensional domain (Arnold et al., 2012) with the input of land use, soil, elevation, and climate data. The model can simulate spatial and temporal dynamics of non-point source contaminant loading and has proven to be a valuable tool for environmental planning and management (Arnold et al., 2012). The goal of this study is to investigate the effects of climate change and alternative BMPs on NO3-N loading to a shallow, coastal lagoon with a federally protected ecosystem. Projections from an ensemble of downscaled global climate model (GCM) runs were applied to a SWAT+ hydrologic model, and results were analyzed over three 30-year periods: historical (1990–2020), mid-century (2040–2070) and end of century (2070–2100). Buffer strips, delayed tillage of forage and alternative crop rotations were investigated in SWAT+ over these times periods to assess potential changes in NO3-N loading resulting from the implementation of these common BMPs. As agricultural practices will also likely evolve with climate change to account for longer growing seasons, extended dry seasons, and shifting markets, a future agricultural scenario was also modeled in SWAT+ for which fertilizer amounts were increased, and the growing season was extended.
Methods
Study site
Eutrophic conditions in estuaries in the province of Prince Edward Island (PEI), Canada have been documented since 2002 with the implementation of the PEI Estuaries Survey (Bugden et al., 2014), although they have been anecdotally noted for decades prior. PEI is intensively cultivated for potatoes, accounting for 25% of Canadian potato exports (Government of Prince Edward Island, 2020). Potatoes require high fertilization rates but have poor nitrogen (N) uptake efficiency (Delgado et al., 2001), which causes significant leaching and runoff of N into surface and groundwater (De Notaris et al., 2018; Jiang et al., 2011; Zebarth et al., 2009). The island is characterized by well-drained soils and shallow aquifers that are highly susceptible to N contamination in the form of NO3-N (Puckett et al., 2011). Rainfall, snowmelt, and associated recharge elevate water tables in PEI and drive discharge of N-rich groundwater to streams and, eventually, PEI coastal waters (Pavlovskii et al., 2023). Under current agricultural practices, groundwater NO3-N concentrations in PEI are predicted to continue to increase as NO3-N penetrates deeper into bedrock aquifers (Jiang and Somers, 2009; Zhang and Hiscock, 2011). This could deleteriously impact potable water quality in this province, which is fully dependent on groundwater for drinking water supply (Council of Canadian Academies, 2009), as well as the health of coastal ecosystems that receive contaminated groundwater.
Amidst growing public concern surrounding the health of PEI’s environment, the province has implemented some mandatory agricultural BMPs since the early 2000s. For example, 15 m buffer strips are required around any watercourse (Government of PEI, 2016), and the Agricultural Crop Rotation Act (Government of PEI, 2002) states that potatoes can only be grown on the same parcel of land once every 3 years. The Province of PEI also provides funding through the Agriculture Stewardship Program for farmers wishing to implement BMPs under the categories of manure and livestock management, agroforestry, water and supply management and integrated pest management (Sustainable CAP, 2023). Examples of BMPs currently employed in PEI are cover cropping, incorporating N-fixing plants into crop rotations, improving liquid manure application, implementing edge of field treatment systems such as buffer strips, constructed wetlands and vegetative swales. Research into the effects of alternative crop rotations to the traditional Potato-Barley-Clover (PBC) rotation on PEI has revealed that replacing red clover with soybeans, a legume, adds an additional cash crop, while reducing NO3-N leaching and increasing potato tuber yield (Azimi et al., 2022; Liang et al., 2019).
Basin Head lagoon, located on the northeastern coast of PEI (Figure 1A), has been experiencing declining ecosystem health (Connolly, 2002). Accordingly, the lagoon was designated as a federal Marine Protected Area in 2005 with the goal of protecting the endemic giant Irish moss, a unique morphotype of Irish moss (Chondrus crispus), from declining ecosystem health and water quality (DFO, 2009). More prevalent and sustained hypoxic events have been noted over recent years, particularly in the shallower and more poorly mixed northeast arm of the lagoon throughout the spring and summer months (DFO, 2021). Hypoxic or anoxic conditions can result in irreversible changes to aquatic community structure (Coffin et al., 2018) and can threaten the health of the Irish moss in the Basin Head Marine Protected Area.
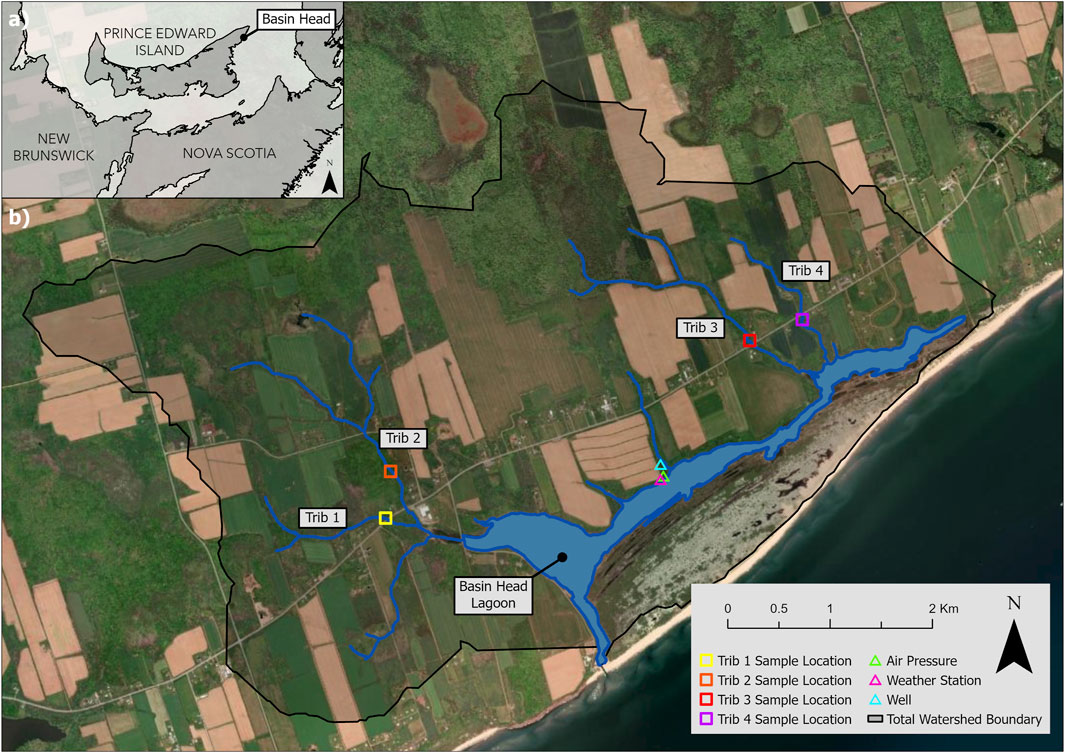
Figure 1. (A) Basin Head study site location on the northeastern shore of PEI in Atlantic Canada, (B) Basin Head lagoon, tributaries (Trib 1–4), sub-watersheds, and sampling and instrument locations [modified from Oliver et al. (2024)].
The Basin Head watershed is 14.6 km2 (Figure 1B) with agriculture (41%) and forest (31%) comprising most of the land cover (KarisAllen et al., 2022). This study focuses on the four major tributaries that discharge into the lagoon with a collective drainage area of 7.2 km2 (Figure 1B), and does not include direct runoff to the lagoon. The Charlottetown soil series is the most abundant throughout the entire province (MacDougall et al., 1988), and is the dominant soil type in the Basin Head watershed (95%). It is classified as a well-drained sandy loam located on gentle slopes (4%–9%) and is extremely well suited for agriculture (MacDougall et al., 1988). The porosity of the Charlottetown soil series varies from 30% in the till layer below 0.5 m (Francis, 1989; Heath, 1983; MacDougall et al., 1988) to approximately 50% in the upper, macroporous zone (Carter, 1987; MacDougall et al., 1988). Depth to bedrock, based on historical well data in the Kings County region, has been observed to range from 0 to 6.2 m (Government of PEI, 2019; Joostema, 2015) and was measured to be 4.6 m at a shallow monitoring well in the watershed installed near the lagoon (KarisAllen et al., 2022) (Figure 1B). The bedrock aquifer that underlies PEI is primarily comprised of sandstone (80%–85%) and interbedded mudstone which is fractured, creating preferential flow paths (Francis, 1989). The fractured sandstone aquifer functions as a dual-porosity system, which presents challenges with characterization of aquifer effective porosity, specific yield, and hydraulic conductivity. However, equivalent porous medium approaches are commonly applied when modeling PEI groundwater systems (e.g., Stanic et al., 2024).
The climate of PEI is characterized as temperate and humid, with a mean annual precipitation of 1,173 mm at the Charlottetown weather station (1971–2000) and mean annual air temperature of 5.3°C (Paradis et al., 2016). Most precipitation (75%) falls as rain (Paradis et al., 2016), and precipitation is relatively uniformly distributed throughout the year, averaging between 80 and 120 mm per month (ECCC, 2023). Baseflow typically contributes 60%–70% of streamflow annually on PEI, and up to 100% in the summer months (Benson et al., 2007; DELJ, 2013); hence groundwater is critical to quantifying PEI water balances and nutrient transport. The fractured sandstone aquifer in the Basin Head watershed provides baseflow to the four tributaries that are the focus of this study (Figure 1) and provides flow for the 30+ intertidal springs that discharge directly into the lagoon (KarisAllen and Kurylyk, 2021; Oliver et al., 2024). The lagoon is tidally pumped and experiences mixing from waves, surges, and current during coastal storms (Bonnington et al., 2023).
Model inputs
The SWAT+ model (Arnold et al., 2012) requires climate variable inputs as well as GIS-based inputs for topography (i.e., Digital Elevation Model, DEM), land use and soils. A summary of the spatial data used to construct the SWAT+ model is presented in Table 1. Full maps of DEM, soil, and land use are provided in Supplementary Figures S1–S3. Figure 2 displays all soil types within the watershed boundaries; however, for simplicity in the model, the Charlottetown series was chosen to represent the entirety of the watershed due to its relative abundance (95%). Precipitation and maximum and minimum daily air temperature records were obtained from a weather station (Onset HOBO) installed at Basin Head (Figure 1B). This weather station did not provide accurate precipitation in winter months (December to March) as it did not possess a heated rain gauge; therefore, the record was supplemented with values from the nearest Environment and Climate Change Canada (ECCC) weather stations at East Point (ECCC ID 7177) and St. Peters (ECCC ID 7177), which are 12 km and 36 km from Basin Head. The East Point station was used to develop a local weather generator within the model (Neitsch et al., 2011) to simulate other variables such solar radiation, wind speed and relative humidity. The weather generator uses statistical monthly measures for air temperature, precipitation, solar radiation, dew point, and more to develop representative daily climate data for a subbasin.
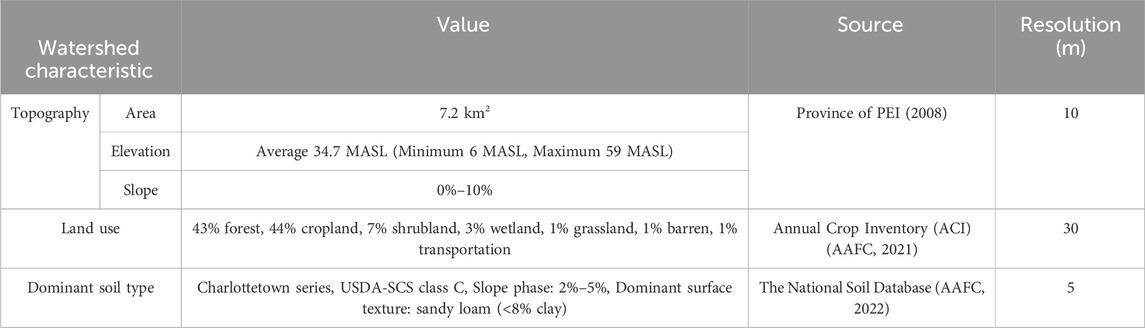
Table 1. Description, data sources and resolution for SWAT+ spatial inputs (topography, land use, and soil).
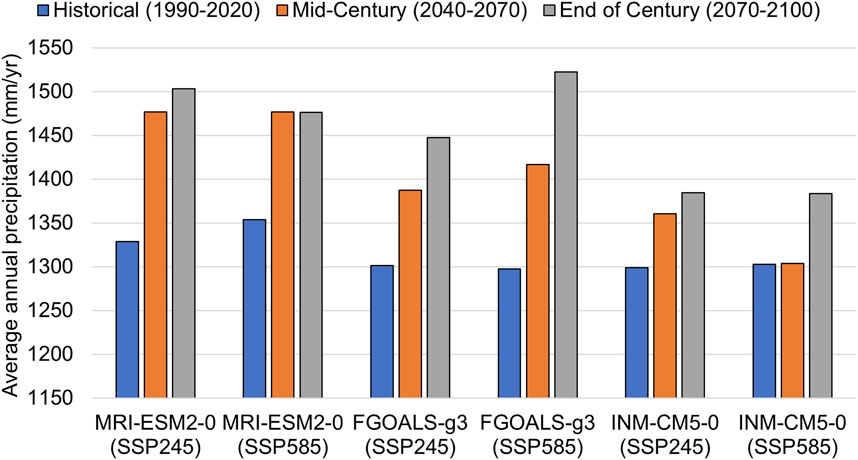
Figure 2. Representative climate models chosen based on average annual precipitation values for each modeled period. Distributions of the mean annual precipitation and air temperature for each scenario are presented in Supplementary Figures S8, S9.
SWAT+ models three major forms of nitrogen in the soil profile and shallow aquifer: (1) organic nitrogen associated with humus, (2) mineral forms of nitrogen held by soil colloids, and (3) mineral forms of nitrogen in solution. The movement of nitrogen between two ‘pools’ (i.e., valence states) of inorganic nitrogen, ammonium (NH4+) and nitrate (NO3−), and three pools of organic nitrogen is simulated. Nitrate transport in SWAT+ is simulated only in the mobile water layer, which includes water transported by surface runoff, lateral flow (i.e., groundwater flow within the soil profile) or percolation (i.e., water moving past the lowest soil profile layer and into the shallow aquifer). The mobile water layer nitrate concentration,
Another important input to the SWAT+ model is agricultural practices. Fertilizer amount, type, and application timing, as well as crop rotation timing influences the forcing of chemical leaching into soils and surface water runoff, and hence NO3-N concentrations in receiving water bodies. Several groups with local knowledge of agricultural practices in Kings County, PEI, where Basin Head is located (i.e., Souris Wildlife, PEI Potato Board, and Fisheries and Oceans Canada) were contacted to develop representative agricultural practices for model inputs. Cropland in the watershed is assumed to adhere to local industry standard crop rotations of potato, a grain (e.g., barley), and a forage (e.g., clover) on a 3-year rotation (herein PBC) as is mandated by the province (Azimi et al., 2022). Although in recent years clover has been replaced with a mix of legumes including alfalfa, sudangrass, pearl millet, and ryegrass, red clover was simulated to maintain consistency over the period of interest (1990–2100). Standard fertilizer application to potato crops in PEI is 155 kg N ha−1 (PEI Analytical Laboratories, Department of Agriculture and Fisheries, PEI). A 15-15-15 Nitrogen-Phosphorous-Potassium fertilizer was chosen based on availability in the SWAT+ interface and given the similarity to the 17-17-7 fertilizer employed by Liang et al. (2020) who studied N dynamics in PEI under different crop rotations. The application method of broadcast, which refers to fertilizer being spread uniformly over the entire field, was chosen based on local practices in the Basin Head watershed, Supplementary Table S1 provides a summary of the agricultural operations incorporated in SWAT+.
Data collection and model calibration
Discrete water samples were collected at the four main (i.e., highest flows) tributaries on 15 occasions covering diverse flow conditions from 11 November 2021, to 28 November 2023 (Figure 1B). Samples were analyzed for NO3-N using the cadmium reduction colorimetric method-APHA Method 4500-E (APHA, 2022). These grab samples were also analyzed for total suspended solids (TSS) using Standard Method 2450D (APHA, 2022). Continuous stream stage measurements were recorded using Onset HOBO loggers at 15-min intervals. Stage was barometrically compensated with a HOBO air pressure logger (Figure 1B). Instantaneous stream discharge measurements were obtained using the velocity-area method (Turnipseed and Sauer, 2010) during the period of 26 June 2019, to 14 October 2023. Stage-discharge relationships were developed for each tributary (Supplementary Figure S4) and used to convert stage to flow. Monthly streamflow (Supplementary Figure S5) was used to calibrate the SWAT+ model hydrology, which is a standard interval for such SWAT+ applications (Ricci et al., 2023; Van Liew et al., 2012), while water quality measurements on a daily basis (i.e., sample concentration) were used to calibrate SWAT+ parameters for NO3-N and TSS.
In groundwater-dominated watersheds, generally the most sensitive streamflow model parameters relate to groundwater and soil moisture. A literature review for SWAT+ modeling found the SCS curve number (cn2), baseflow recession constant (alpha), fraction of root zone percolation that reaches deep aquifer (perco), and soil evaporation compensation factor (esco) to be most sensitive (Ahmad et al., 2011; Liang et al., 2020; Spruill et al., 2000). These parameters, along with others identified in a sensitivity analysis conducted in SWAT+ Toolbox (Supplementary Table S2), were chosen to calibrate streamflow (James, 2022). Evaluation statistics used to assess model performance included the Nash-Sutcliffe efficiency (NSE), RMSE-observation standard deviation ratio (RSR), and percent bias (PBIAS) (Moriasi et al., 2007). Moriasi et al. (2007) states that for streamflow, an RSR less than 0.7 is satisfactory, an NSE over 0.4 is satisfactory, and PBIAS less than 10 is very good. The corresponding equations are presented below, where Yiobs is the observed streamflow and Yisim is the simulated streamflow generated by SWAT+.
Grab sample concentrations (Supplementary Table S3) were used to calibrate NO3-N outputs from SWAT+. Daily NO3-N mass (kg/day) output from each tributary from SWAT+ were converted to a concentration (mg/L) by dividing the mass by the daily total flow. Modeled concentrations were compared to 11 grab sample concentrations from 11 November 2021, to 5 July 2023, and Root Mean Squared Error (RMSE) was calculated for the modeled vs. measured concentrations:
where
Once the model is calibrated satisfactorily, projected results using climate change data can be analyzed to determine patterns in seasonality of flow and NO3-N loading, and trends to baseflow index (BFI). BFI is calculated by dividing the total volume of baseflow by total streamflow for a period. The SWAT+ outputs of lateral flow (flo) and shallow groundwater flow (latQ) sum to determine baseflow, and total streamflow is the summation of water yield (wateryld) and lateral flow (flo) into the channel. The ‘half-flow date’, T50, is a measure of streamflow timing and is defined as the date by which 50% of streamflow for a given water-year (i.e., October 1 to September 30) has passed (Court, 1962). This measure has been used to characterize flow regimes in the neighboring province of Nova Scotia (Johnston et al., 2022), and was calculated in this study for the three model periods.
It should be noted that SWAT studies in other small (<10 km2) watersheds have been noted to yield unsatisfactory results (Spruill et al., 2000), largely due to characteristically low times of concentration and a propensity toward ‘flashiness’ in peak runoff (Uzeika et al., 2012). Chu et al. (2004) noted that characterizing baseflow correctly can be more important in small watersheds. Bailey et al. (2020) outlines limitations to the current groundwater algorithms in SWAT+ and proposes an amendment to the standard SWAT+ module to improve model accuracy, particularly in baseflow-dominated watersheds where model performance can be poor (Bosch et al., 2010; Luo et al., 2012). Despite the challenges in applying SWAT+ in small, baseflow-dominated systems, this model is widely used and still provides useful insight into the hydrology and transport dynamics in these environments.
Model scenarios
Climate change scenarios
Changes to climate forcing will drive changes in hydrologic processes and agricultural practices (Gordon et al., 2008), which can be represented in SWAT+. An analysis by the Pacific Climate Impacts Consortium [of 26 downscaled Coupled Model Intercomparison Project (CMIP) 6 Global Climate Models (GCMs)] (Eyring et al., 2016) and three Shared Socioeconomic Pathways (SSPs) (Riahi et al., 2017) was completed to select models projecting low, moderate, and high changes to precipitation and temperature. Climate data for these models were downloaded from the NASA Climate Data Services (NASA, 2023), and, for the sake of downscaling consistency, only models downscaled using Bias Correction/Constructed Analogues with Quantile Mapping Reordering (BCCAQv2) (Maurer et al., 2010; Cannon, 2015) were considered. The scenarios from the IPSL-CM6A-LR and EC-Earth3-veg GCMs were removed from consideration because they are deemed ‘hot’ models, projecting much greater warming than is generally expected (Rahimpour Asenjan et al., 2023). UKESM1-0-LL was removed for simplicity since it only represents a 360-day year, and BCC-CSM2-MR was missing from the NASA dataset. The remaining six models were compared based on their average annual precipitation for each modeled time period (1990-2020, 2040-2070 and 2070–2100) (Supplementary Table S5), and three representative models (INM-CM5-0, FGOALS-g3, and MRI-ESM2-0) were chosen for low, moderate, and high climate change scenarios (Figure 2). Two SSPs per climate model, SSP2-4.5 (RCP 4.5) and SSP5-8.5 (RCP 8.5), were chosen to represent mid-range and high emissions scenarios, yielding a total of six climate change scenarios with a wide range of possible climate outcomes. The climate data representing each scenario was entered in SWAT+, and the calibrated model was run from 1990 to 2100, with outputs from representative periods of historical (1990–2020), mid-century (2040–2070) and end of century (2070–2100) used for further analysis. The observation period GCM results for each climate scenario were used for the 1990-2020 comparison period rather than historic data in the watershed because the climate station in the watershed was only operational since 2018, and there is no nearby long-term climate station or one with very similar measurements to the Basin Head climate station (Figure 1B) during its operation. Therefore, the climate change analysis presented herein should be considered a sensitivity analysis to plausible future projections of climate change when compared to historic-period output for the same downscaled GCMs. A one-way ANOVA was conducted in Minitab (2021) to generate monthly pairwise comparisons of the NO3-N loading between each period (N = 30) to determine if results were significantly different (p < 0.0.5) among scenarios.
Future agricultural practice scenario
It is important to consider societal changes that may arise due to climate change. Climate change will result in extended growing seasons in Atlantic Canada, defined by the number of days per year where the air temperature is over 5°C, with a projected increase in growing season length of 11% by 2050 and 18% by 2080 (Richards and Daigle, 2011) using climate data from the nearest station to Basin Head (East Baltic, 46.43N 62.17W). In SWAT+, these percentages were rounded to a 10% increase in growing season length for the mid-century period (2040–2070) and a 20% increase for the end of century period (2070–2100). To account for a longer growing season and potential loss in plant productivity, an additional percentage of fertilizer applied to crops was also incorporated. Arbitrarily, an increase in fertilizer application of 10% and 20% were applied for mid-century and end of century periods, respectively, to align with the projected increase in growing season length (Richards and Daigle, 2011). This future agricultural scenario was only run for the MRI-ESM2-0 SSP5-8.5 GCM to consider changing agricultural practices for a more extreme climate scenario. All model runs are listed in Supplementary Table S6 with corresponding weather inputs.
Best management practices
BMPs are implemented widely across PEI and include crop rotations, buffer strips, cover crops, farmable berms, and terraces. Three common BMPs were modeled in SWAT+ from 1990 to 2100 under the climate change scenario with the highest cumulative precipitation (MRI-ESM2-0 SSP5-8.5) to understand how NO3-N loading could be mitigated in a ‘worst-case’ climate scenario. The BMP scenarios chosen to be simulated in SWAT+ were (1) buffer strips (60 m, 30 m), (2) delayed tillage of forage crop from fall to spring, and (3) alternative crop rotation of Potato-Soybean-Barley (PSB) from the default PBC rotation used for other SWAT+ runs.
Buffer strips refer to narrow strips of dense grass surrounding waterways on agricultural land (Helmers et al., 2006). They are known to slow down runoff velocity to control field erosion and trap particulate pollutants and have been shown to facilitate NO3-N removal from shallow groundwater (Simpkins et al., 2002). A spatial analysis revealed that most agricultural fields in the watershed have a grassed buffer of 30 m between the field and waterways, which is double the provincially mandated width of 15 m. A scenario incorporating a 60 m buffer was simulated, which would be considered an extreme measure. The removal of NO3-N in vegetative filter strips in SWAT+ is predicted based on the ratio between field area and filter strip area. It should be noted that the decrease in cropland associated with an increase in buffer size was not included in this simulation to isolate the effect of the buffer, thus, the total effect of an increased buffer width would be underestimated in these results.
Typically, on PEI, a forage crop (i.e., clover, timothy, rye) is grown in the year prior to potato planting. By delaying tillage of forage from fall to spring, just before planting, NO3-N leaching in the winter months is reduced, and there is residual NO3-N left in the soil in spring, reducing the need for fertilizer (Stuart, 2017). This effect was modeled in SWAT+ by editing the agricultural operations such that clover was plowed May 15th, prior to planting of potatoes, instead of on September 15th and by reducing fertilizer application by 25% (Stuart, 2017).
PBC is a representative crop rotation for PEI; however, recent studies have suggested that incorporating legumes may improve soil health, increase potato yields and reduce NO3-N surplus leading to leaching due to the N fixing characteristics of legumes (Liang et al., 2019; Whittaker et al., 2023). A PSB crop rotation was modeled in SWAT+ (Supplementary Table S7) to test this hypothesis under the three periods, for which fertilizer application was reduced by 50% to account for the N fixing characteristics of soybeans. This reduction amount was chosen arbitrarily based on the results of Liang et al. (2019) that showed N efficiency (i.e., how well plants utilize available N) of PSB crop rotations were 1.6 times that of PBC rotations.
Results and discussion
Sampling results and model calibration
73 water samples from the Basin Head tributaries were analyzed for NO3-N, of which 24 (33%) exceeded the Canadian Council of Ministers of the Environment (CCME) guideline for the protection of aquatic life in freshwater (3 mg L−1, CCME, 2012). NO3-N concentrations range from 0 to 6.2 mg/L, with tributary 1 having the highest average concentration (4.2 mg/L) compared to the other tributaries (1.3–1.9 mg/L). TSS concentrations ranged from 0 to 44.0 mg/L, with tributary 2 and 3 being higher on average (11.3–12.3 mg/L) than tributary 1 and 2 (6.1–7.2 mg/L). All grab sample measurements are summarized in Supplementary Table S3.
All sensitive model parameters for hydrology (Supplementary Table S8) were manually calibrated to the measured streamflow (Supplementary Figure S5) until the goodness of fit was satisfactory from April 1st to 1 September 2022, to represent hydrology in the growing season (Table 2). It should be noted that model results from winter months are not calibrated, thus one must take caution when drawing conclusions during these months. Also, snowmelt_min, snowmelt_max, and snowmelt_tmp are climate-related parameters, and would most likely be spatially uniform for a small watershed; they were manually changed to improve streamflow calibration. The sensitivity analysis revealed that simulated NO3-N concentrations were sensitive to only six out of eight parameters: hlife_n, the half-life of nitrate in the shallow aquifer, nperco, the nitrate percolation coefficient, sdnco, the denitrification threshold water content, cdn, denitrification exponential rate coefficient, cmn, the rate factor for humus mineralization of active organic nutrients and n_updis, the nitrogen uptake distribution parameter. NO3-N and TSS were calibrated from 11 November 2021, to 5 July 2023, and from 27 July 2022, to 5 July 2023, respectively. The graphical representation of NO3-N calibration and RMSE (Equation 4) values between measured to simulated concentration are found in Supplementary Figure S6. Six parameters were calibrated for NO3-N: hlife_n (600 for tributary 1, 200 for tributaries 2–4), nperco (0.15 for tributaries 1-3, 0.05 for tributary 4), sdnco (0.66), cdn (0.07), cmn (0.0029) and n_updis (66.7). RMSE (Equation 4) between measured NO3-N load (i.e., concentration multiplied by flow) and simulated load were calculated to be 2.7, 7.6, 4.5 and 1.0 kg/day for tributaries 1 through 4.
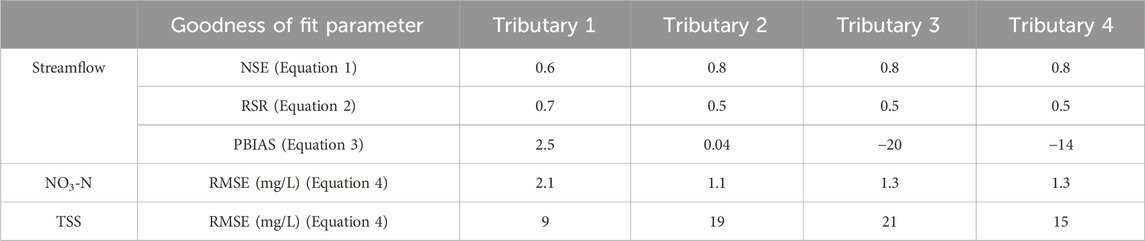
Table 2. Manually calibrated goodness of fit parameters for streamflow, NO3-N and TSS for each tributary (trib, Figure 1B) for the calibration period April 1st to 1 September 2022.
The sediment calibration process in this study closely followed a previous SWAT study (Sinclair, 2014) by choosing sensitive starting parameters for calibration with a focus on in-channel processes. SWAT+ uses the Modified Universal Soil Loss Equation (MUSLE) to generate the landscape erosion contribution to channel TSS values. MULSE is a function of several factors, which were entered into SWAT+ as default values, except for the soil erodibility factor, which was calculated to be 0.49 based on soil information. High sediment loads in several PEI rivers have been documented, mainly citing sediment deposition resulting from intensive agricultural practices (Sirabahenda et al., 2020). Supplementary Figure S7 presents a graphical representation of TSS calibration and RMSE values between measured and simulated concentrations. Four parameters were calibrated for TSS: spexp (1), spcon (0.0001), cov fact (0.02 for tributaries 2 and 3, 0.005 for tributaries 1 and 4), and erod_fact (0.25 for tributaries 1 and 4, 0.75 for tributary 2 and 0.5 for tributary 3). RMSE between measured TSS load (i.e., concentration multiplied by flow) and simulated load were calculated to be 6.7, 34.7, 36.5, and 1.1 kg/day for tributaries 1 through 4. Final calibrated RSME values for NO3-N, TSS, and streamflow for each tributary are found in Table 2. NO3-N was successfully calibrated; however, RMSE values for TSS are significantly higher than 1–2 mg/L, indicating that it is only preliminarily calibrated for sediment transport.
Modelled conditions using MRI-ESM2-0 SSP5-8.5 from the historical period (1990–2020) generally aligned with expected water balance for PEI where an annual average of 1,100 mm of precipitation is partitioned into 440 mm evapotranspiration, 260 mm surface water runoff and 400 mm is groundwater flow (PEI Department of Fisheries and Environment, 1996). During this period SWAT+ simulates the average annual NO3-N transported via surface runoff as 1 kg/ha, while average annual NO3-N transported through groundwater is 6 kg/ha, which aligns with other PEI studies such as Grizard. (2013) that simulated an average NO3-N load of 12 kg-N/ha watershed/yr for the period 1996-2012. Average annual sediment load via overland erosion was modelled to be 0.96 t/ha/yr, which aligns with a nearby previous study in Souris River, PEI that found overland erosion to occur at a rate of 1.5–1.8 t/ha/yr, attributing this high sediment load to row crop agriculture which is common across PEI (Alberto et al., 2016). SWAT+ models deposition of sediment in all tributaries in the watershed, meaning that all TSS at the channel outlets are originated from overland erosion.
Projected climate change impacts
Changes to moisture conditions and seasonality of precipitation events due to climate change could result in changes to the ratio of baseflow and surface runoff contributions in streamflow. The monthly averaged BFI was analyzed for each period in SWAT+, revealing shifts in the partitioning of streamflow over time (Figure 4B). Average BFI in the months of January to May increased from 0.39 in the historical (1990–2020) period to 0.74 and 0.78 in the mid-century (2020–2070) and end-of-century (2070–2100) periods. The largest BFI change occurred in February where monthly average BFI increased from 0.12 in the historical period to 0.63 and 0.68 in the two future periods (>five-fold increase). Average annual simulated BFI increased 22% from historical (1990–2020) to mid-century (2040–2070) periods, and only increased 1% between mid-century and end of century (2070–2100) periods. These baseflow changes could be attributed to increased precipitation as rainfall, more mid-winter thaws, and an earlier spring melt period, inducing recharge and subsequent flow through the shallow aquifer during the winter season.
The SWAT+ model projections also show suppressed summer flow, particularly in April and May, and increased winter flow between historical (1990–2020) and both future periods (2040-2070 and 2070–2100) and illustrate that projected changes in nitrate loading and streamflow follow similar seasonal patterns (Figures 4A, C). During the historical period in the months of January and February, the standard deviation in flow is much lower than the end-of-century period (average decrease of 74%). However, in the months of April to May, the standard deviations of the flow values in the end-of-century period are much lower than in the historical period (−72% on average). This indicates that in the winter months (January and February), there is more variance in flow in the end-of-century period, while in the spring months (April and May) there is more variance during the historical period. Standard deviations of flow between historical and both future periods were within 50% of each other from June to November and were highest from December to May. Increased flow variability in winter and early spring could reflect uncertainty in the effects of climate change on snowmelt processes. The historical period T50 (March 19), a measure of streamflow timing, was shifted earlier by 73 and 78 days respectively for the mid-century (January 7) and end of century (January 1) periods. Some studies (Mukundan et al., 2020; Shrestha et al., 2012) have proposed that earlier snowpack melt and an increase to annual rainfall due to climate change, both of which were modeled in this study, will increase the magnitude and shift the timing of nutrient loading. Average annual streamflow is simulated to increase 5% between historical (1990–2020) and mid-century (2040–2070) periods, and increase 4% between mid-century and end of century (2070–2100) periods. This could be attributed to increased precipitation expected in a future climate, or increased snowmelt due to higher temperatures. Higher streamflows with on average higher baseflow influence in future years (2040–2100) could result in a higher flux of NO3-N to coastal waters.
Based on the SWAT+ simulations of future climate change impacts and the corresponding ANOVA analysis, only the scenario with the highest cumulative precipitation (MRI-ESM2-0 SSP5-8.5) resulted in statistically significant (p < 0.05) changes in NO3-N loading to the lagoon, and only when comparing historical to end-of-century (1990-2020 to 2070–2100) time periods (Figure 3). Under this scenario, the median annual NO3-N load increased from 5,752 to 7,239 kg (+26%). Among all climate scenarios considered, this scenario produced both the highest mean annual precipitation and the highest mean annual air temperature at the end of century (Supplementary Figures S8, S9).
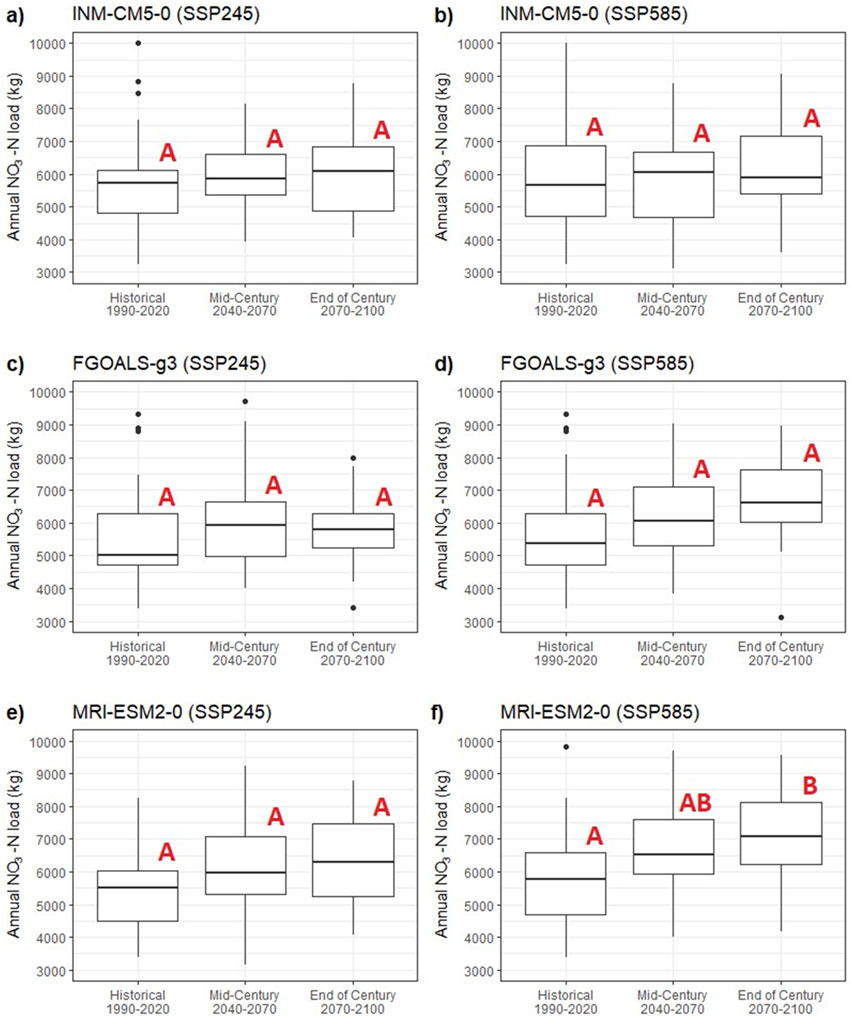
Figure 3. Annual NO3-N load (box and whisker plots showing mean and quartiles) to lagoon from the four main tributaries (Figure 1B) for each climate model scenario (Figure 2), (A) INM-CM5-0 SSP2-4.5, (B) INM-CM5-0 SSP5-8.5, (C) FGOALS-g3 SSP2-4.5, (D) FGOALS-g3 SSP5-8.5, (E) MRI-ESM2-0 SSP2-4.5, (F) MRI-ESM2-0 SSP5-8.5. Distributions that do not share a letter are significantly statistically different.
The GCM scenarios with the lowest cumulative precipitation (INM-CM5-0 SSP2-4.5 and INM-CM5-0 SSP5-8.5) saw small changes in median NO3-N load of less than 7% between consecutive model periods. The mid-range cumulative precipitation GCM scenario, FGOALS-g3 SSP2-4.5, yielded interesting results, as annual median NO3-N load increased by 13% between historical (1990–2020) and mid-century (2040–2070) periods but decreased by 2% from mid-century (2040–2070) to end of century (2070–2100). The FGOALS-g3 SSP5-8.5 GCM yielded a 5% and 10% increase in annual median NO3-N load between the same periods. In general, the simulations with higher cumulative precipitation resulted in larger increases in annual NO3-N load (Figure 2). Between each subsequent modeled period, the MRI-ESM2-0 SSP2-4.5 GCM resulted in a 9% and 6% increase to median annual NO3-N load, while MRI-ESM2-0 SSP5-8.5 resulted in an increase of 13% and 11%, respectively.
These NO3-N load trends generally correspond to trends in cumulative precipitation (Figure 2) and suggest that the projected increased NO3-N loading could be attributed to increased water yield and/or enhanced biogeochemical cycling of N (e.g., greater mineralization of organic N and nitrification of ammonia-N) (Pesce et al., 2018; Rabalais et al., 2009). The similarity in pattern of seasonal streamflow and NO3-N (Figures 4A, C) indicates that increased water yield, rather than elevated concentration, is predominantly responsible for the projected increase in NO3-N loading.
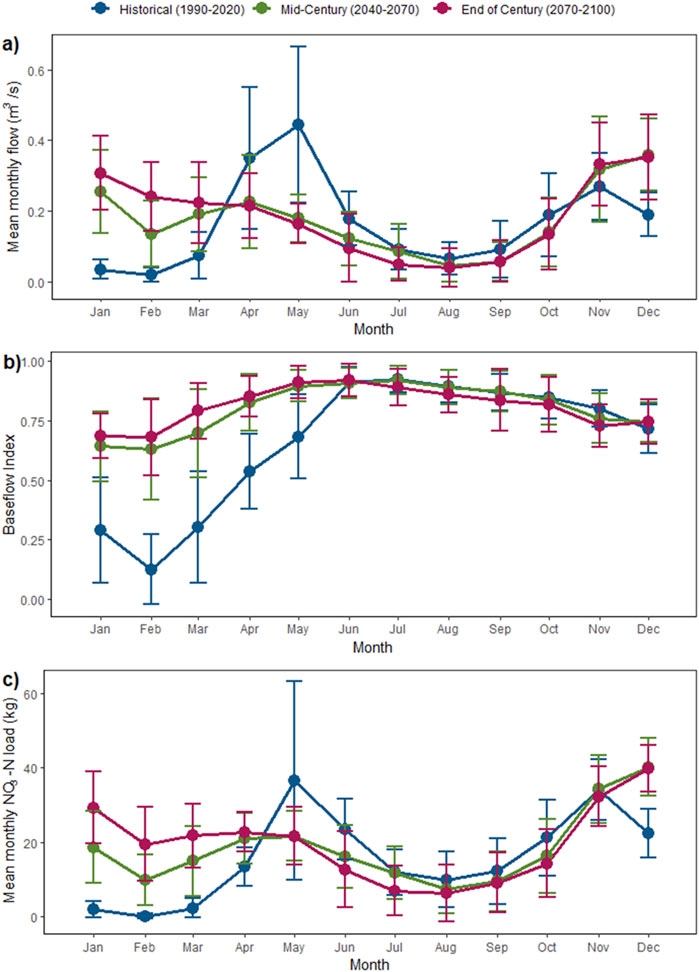
Figure 4. (A) Average monthly flow from all four tributaries for each 30-year period simulated in SWAT+, (B) Monthly average baseflow index at all four tributaries for each 30-year period simulated in SWAT+, (C) NO3-N load (kg/day) averaged on monthly basis from all four tributaries for each 30-year period simulated in SWAT+. Error bars represent standard deviation of average annual values in each simulated period. The GCM plotted is the highest cumulative precipitation climate scenario MRI-ESM2-0 SSP5-8.5.
The effects of NO3-N leaching through surface and groundwater pathways under future climate change scenarios is presently not well understood. However, it is known that climate change impacts groundwater recharge and discharge (Kurylyk et al., 2014), sea levels, soil conditions (i.e., soil moisture, organic carbon, alkalinity) and agricultural productivity (Stuart et al., 2011), all of which could impact nutrient loading and transport dynamics in coastal watersheds. Some studies investigating the effects of climate change on nutrient loading highlight the uncertainty of climate change models on a regional scale (Bürger et al., 2013; El-Khoury et al., 2015; Jeppesen et al., 2011). These have suggested that the use of different downscaling methods for GCMs can result in conflicting trends in directions and magnitudes of nutrient loading, which is likely partly related to the uncertainty in future trend directions and magnitudes for precipitation and groundwater recharge (Kurylyk and MacQuarrie, 2013). A few studies (e.g., Luo et al., 2020; Qi et al., 2009; Tong and Liu, 2006) have suggested that changes to hydrology have more influence on nutrient loading dynamics than changes in land use, while a local PEI study (De Jong et al., 2008) suggests land use is the more important factor. Pulido-Velazquez et al. (2015) noted the importance of analyzing the impacts of land use and hydrologic stressors together when considering nutrient loading patterns. The use of SWAT+ in this study addresses many of these concerns by incorporating future climate data and current land use and agricultural practices, with capability to simulate a wide range of future outcomes.
Seasonal trends in NO3-N loading to the lagoon were also analyzed under the highest cumulative precipitation climate scenario, MRI-ESM2-0 SSP5-8.5 (Figure 4C). Simulations during the historical period (1990–2020) indicate that NO3-N loading to the lagoon is highest during the months of May and November. These peaks likely correspond to NO3-N availability due to recent fertilizer application in spring or harvest in fall and corresponding large precipitation events and snowmelt that typically occur in spring and fall in PEI. For the future climate scenarios, the overall average NO3-N load increases, but the magnitudes of the May and November loads are damped. The increase in NO3-N load in spring appears to occur earlier in the season, while the fall peak occurs later into December. The December peak is higher than the fall peak in the future scenarios; however, these are reversed in the historical period.
Impacts of best management practices
Agricultural practices were altered to represent conditions in a future climate by extending the growing season and increasing fertilizer application amounts by 10% and 20% for the mid-century and end-of-century periods respectfully. Model outputs indicated only small increases in NO3-N load to the lagoon as a result of these changes. For the mid-century period, NO3-N load was increased by 3%, and for the end of century period, it was increased 1% from the original climate change simulation. An additional scenario was simulated where 50% of crop land was converted to coniferous forest (Supplementary Table S9). Even with this drastic change in land use, NO3-N load was only reduced by 20% in the historical period and by 12% for 2040 to 2100 when compared to the baseline climate change scenario (Figure 5). There results partially reflect the challenges in managing the ‘legacy’ effects of nitrate as aquifers can continue to pollute surface waters long after land-use practices change at the land surface (Tesoriero et al., 2013).
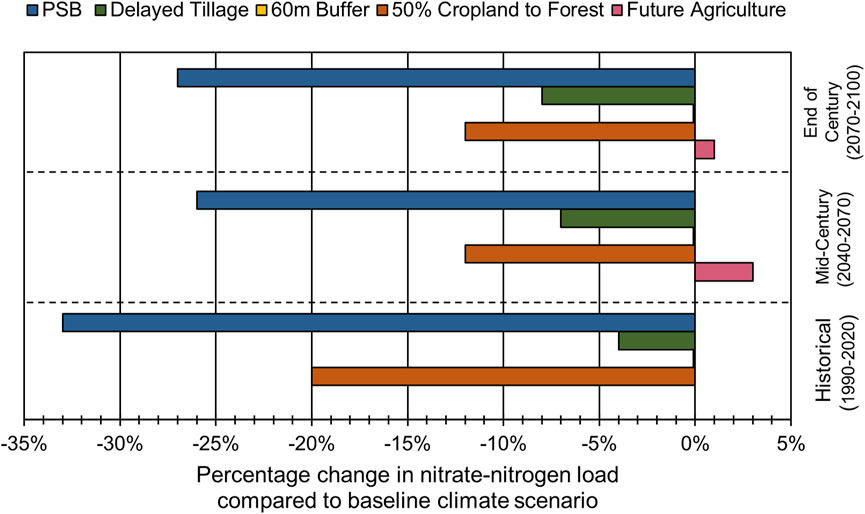
Figure 5. Percentage of NO3-N load compared to baseline climate change scenario from all four modeled tributaries to the lagoon using a future agricultural scenario, altered land-use scenario where 50% of cropland is changed to forest, and BMPs (60 m Buffers, delayed tillage of cover crop from fall to spring, alternative crop rotation of Potato-Soybean-Barley, PSB). The GCM plotted is the highest cumulative precipitation climate scenario MRI-ESM2-0 SSP5-8.5.
Model simulations incorporating BMPs revealed a small change (0%–8%) in NO3-N loading when a 60 m buffer and delayed tillage were applied as conservation tools (Figure 5). Some studies in other watersheds have shown more pronounced benefits from the tested BMPs. For example, studies have identified grassed buffer strips as effective tools for reducing N export in surface runoff (Dunn et al., 2011; Heathwaite et al., 1998). Mankin et al. (2007) noted a strong reduction in total N concentration in field runoff and observed that infiltration accounted for >90% of total N removal. It is expected that grassed buffers have more impact on sediment, phosphorus, and pesticide transport where the main mode of transport is through surface runoff and soil erosion (Al-Wadaey et al., 2012; Sweeney and Newbold, 2014) rather than the groundwater-dominated transport in the Basin Head watershed. NO3-N is soluble and once infiltrated into groundwater is generally unable to be reduced using BMPs that target surface water and soil erosion.
The SWAT+ model findings for Basin Head differ from results for other PEI studies. For example, delayed tillage of forage crops from fall to spring under a 3-year potato rotation on PEI has been shown to reduce N availability in soil and related leaching into the subsurface (Stuart, 2017), without negative effects on soil health or potato yield (Carter et al., 1998). This practice aims to reduce mineralization of forage crops through the winter months to allow for more N carry-over into the growing season. However, in the modeled scenario, this practice should be paired with a reduction in fertilizer application to impact NO3-N leaching. Sanderson et al. (1999) found that spring tillage improved potato tuber yields even at lower fertilization rates than late fall tillage. Model results did not indicate that this practice would significantly reduce NO3-N loading over future decades, likely due to the large input of fertilizer still needed to cultivate potatoes and poor N utilization efficiency of the crop. The only appreciable reduction to NO3-N loading in SWAT+ came from changing the crop rotation to PSB from PBC. Under the historical period, NO3-N load is reduced by approximately 33% with this BMP; however, during the mid-century and end of century periods, this reduction is lowered to 26% and 27%, respectively (Figure 5). This indicates that crop rotation change for this watershed may yield reduced benefits as climate change intensifies. A future climate may experience competing phenomena where precipitation and hence hydrologic loads increase, yet high temperatures and low soil moisture decrease nutrient loading. These results are consistent with Liang et al. (2019) which found N surplus in soils to be significantly higher under a PBC rotation than a PSB rotation, hence leading to higher levels of N leaching. The N fixing properties of legumes in the PSB scenario allowed for a significant reduction in fertilizer application (50%), which is likely the cause of the reduction in NO3-N leaching. It should be noted that this is a simplistic approach that does not consider exact N fixing characteristics of crop rotations at the site, and no in situ soil data was used to confirm the application rates.
Model limitations
A main limitation of the model results are that the findings cannot be generalized to watersheds outside the province of PEI due to the unique soil, crop and aquifer characteristics. Also, the climate change projections (GCMs) used were chosen solely based on cumulative precipitation, representing low, mid-range and high cumulative precipitation, thus, may not represent the full range of potential future conditions. Another limitation that should be noted is that the surface water watershed modeled map not necessarily align with the watershed of the aquifer. This is an assumption that is commonly employed in such studies (Fan, 2019). Based on validation efforts using additional streamflow records, high uncertainty exists in all modelled values currently produced. This model with a relatively short calibration period is used to simulate long-term climate impact, which enhances measurement uncertainty which affects the model confidence. Based on these limitations, such a model should primarily be used for exploratory purposes (Harmel et al., 2014), as in the present study. Streamflow rating curves may not account for high flow conditions properly due to most in situ measurements being collected at low flow (Supplementary Figure S4). Thus, extreme weather events cannot be accurately simulated. This introduces uncertainty in NO3-N and TSS calibration, which uses streamflow to convert from load to concentration (Supplementary Figures S6, S7). Future work to reduce model uncertainty should include the collection of more flow with a higher range of hydrologic conditions, NO3-N, and TSS data and watershed properties for model calibration and validation. Furthermore, it should also be emphasized that there is uncertainty in the prediction of NO3-N transport because of the unknown secondary effects of climate change such as land use change, and changes to agricultural practices (i.e., fertilization rates and timing, growing season) (Howden et al., 2007; Jeppesen et al., 2011). For this reason, future studies are warranted that consider a broader range of future agricultural scenarios and seasonal shifts in hydrologic forcing.
Conclusion
This study evaluated the impacts of climate change and best management practice scenarios on NO3-N loading to a threatened coastal lagoon in the Atlantic Canadian province of PEI. Model (SWAT+) results indicate that NO3-N loading is expected to increase under climate change, further exacerbating eutrophic conditions and the related impacts on the protected ecosystem in this lagoon. However, only the highest cumulative precipitation climate model (MRI-ESM2-0 SSP5-8.5) resulted in statistically different (p-value <0.05) NO3-N loading (+26%) between historical (1990–2020) and end-of-century (2070–2100) periods. Implementing buffer strips and delayed tillage had negligible (0%–8% reduction) effects on NO3-N loading, while changing the crop rotation from potato-barley-clover to potato-soybean-barley yielded a decline (26%–33%) in NO3-N loading compared to a climate change scenario without incorporation of best management practices. A future agricultural practice scenario was evaluated for mid-century (2040–2070) and end of century (2070–2100) to consider a longer growing season and higher fertilizer application amount. Simulated NO3-N loading to the lagoon only increased by 3% and 1% respectively for these future time periods under this additional loading. To explore an extreme scenario where drastic measures were incorporated to limit agricultural contamination, a model scenario was run where 50% of cropland was converted to coniferous forest. This resulted in a reduction in NO3-N loading of 12%–20%. Model analysis revealed changes to seasonal loading dynamics under climate change for which the effect of high spring and fall precipitation effects were subdued, and streamflow and related NO3-N loads remained more seasonally consistent. Changes to streamflow partitioning were noted under climate change scenarios. Most notably, baseflow contributions increased in winter and early spring (January-May), with the largest change (5-fold increase) occurring in February. These results demonstrate the severity of nitrogen contamination within PEI aquifers and water bodies and the trajectory of NO3-N loading to the province’s coastal waters in a future climate. Although PEI remains a national leader in the implementation of best management practices and agricultural innovation, decades of agricultural activity and aquifer storage of NO3-N will facilitate continual groundwater export of leached legacy nitrate to the coast. Extreme changes to land use and reduction to fertilizer application would be needed to appreciably reduce NO3-N loading to the Basin Head watersheds and other PEI watersheds. Conservation tools such as crop rotation will likely become increasingly important to ensure agricultural practices remain resilient to the effects of climate change.
Data availability statement
The raw data supporting the conclusions of this article will be made available by the authors, without undue reservation.
Author contributions
AO: Conceptualization, Data curation, Formal Analysis, Investigation, Methodology, Validation, Visualization, Writing–original draft. BK: Conceptualization, Funding acquisition, Methodology, Project administration, Resources, Supervision, Writing–review and editing, Investigation. LJ: Investigation, Methodology, Writing–review and editing, Data curation. NL: Data curation, Formal Analysis, Methodology, Writing–review and editing. LS: Conceptualization, Methodology, Writing–review and editing. RJ: Conceptualization, Funding acquisition, Methodology, Project administration, Resources, Supervision, Writing–review and editing.
Funding
The author(s) declare that financial support was received for the research, authorship, and/or publication of this article. Research funding was provided by Environment and Climate Change Canada (Atlantic Ecosystems Initiatives Program, GCXE22P028), Fisheries and Oceans Canada (DFO Ocean Management Contribution Program), and the Canada Research Chairs Program.
Acknowledgments
We thank NL, LJ, and members of the Dalhousie University Centre for Water Resources Studies for field and modeling support, and Bailey Strong (Dalhousie University) for help with batch downloading and filtering the downscaled climate scenarios.
Conflict of interest
The authors declare that the research was conducted in the absence of any commercial or financial relationships that could be construed as a potential conflict of interest.
Publisher’s note
All claims expressed in this article are solely those of the authors and do not necessarily represent those of their affiliated organizations, or those of the publisher, the editors and the reviewers. Any product that may be evaluated in this article, or claim that may be made by its manufacturer, is not guaranteed or endorsed by the publisher.
Supplementary material
The Supplementary Material for this article can be found online at: https://www.frontiersin.org/articles/10.3389/fenvs.2024.1468869/full#supplementary-material
References
Afzaal, H., Farooque, A. A., Abbas, F., Acharya, B., and Esau, T. (2020). Precision irrigation strategies for sustainable water budgeting of potato crop in Prince Edward Island. Sustainability 12 (6), 2419. doi:10.3390/su12062419
AghaKouchak, A., Chiang, F., Huning, L. S., Love, C. A., Mallakpour, I., Mazdiyasni, O., et al. (2020). Climate extremes and compound hazards in a warming world. Annu. Rev. Earth Planet. Sci. 48, 519–548. doi:10.1146/annurev-earth-071719-055228
Agriculture and Agri-food Canada (AAFC) (2020). Climate change impacts on agriculture. Available at: https://agriculture.canada.ca/en/environment/climate-change/climate-scenarios-agriculture#d.
Agriculture and Agri-food Canada (AAFC) (2021). Annual crop inventory (ACI). Available at: https://open.canada.ca/data/en/dataset/199e4ab6-832b-4434-ac39-e4887d7cc4e5.
Agri-food Canada (AAFC) (2022). The national soil database. Available at: https://sis.agr.gc.ca/cansis/nsdb/index.html.
Ahmad, H. M., Sinclair, A., Jamieson, R., Madani, A., Hebb, D., Havard, P., et al. (2011). Modeling sediment and nitrogen export from a rural watershed in Eastern Canada using the soil and water assessment tool. J. Environ. Qual. 40 (4), 1182–1194. doi:10.2134/jeq2010.0530
Alberto, A., St-Hilaire, A., Courtenay, S. C., and Van Den Heuvel, M. R. (2016). Monitoring stream sediment loads in response to agriculture in Prince Edward Island, Canada. Environ. Monit. Assess. 188, 415–15. doi:10.1007/s10661-016-5411-3
Al-Wadaey, A., Wortmann, C. S., Franti, T. G., Shapiro, C. A., and Eisenhauer, D. E. (2012). Effectiveness of grass filters in reducing phosphorus and sediment runoff. Water, Air, & Soil Pollut. 223, 5865–5875. doi:10.1007/s11270-012-1322-2
American Public Health Association (APHA) (2022). Standard methods for examination of water and wastewater. 23rd edition. Washington, DC: American Public Health Association, American Water Works Association, Water Environment Federation.
Arhonditsis, G., Tsirtsis, G., Angelidis, M. O., and Karydis, M. (2000). Quantification of the effects of nonpoint nutrient sources to coastal marine eutrophication: applications to a semi-enclosed gulf in the Mediterranean Sea. Ecol. Model. 129 (2-3), 209–227. doi:10.1016/S0304-3800(00)00239-8
Arnold, J. G., Moriasi, D. N., Gassman, P. W., Abbaspour, K. C., White, M. J., Srinivasan, R., et al. (2012). SWAT: model use, calibration, and validation. Trans. ASABE 55 (4), 1491–1508. doi:10.13031/2013.42256
Azimi, M. A., Jiang, Y., Meng, F. R., and Liang, K. (2022). Yield responses of four common potato cultivars to an industry standard and alternative rotation in Atlantic Canada. Am. J. Potato Res. 99 (3), 206–216. doi:10.1007/s12230-022-09873-4
Bailey, R. T., Bieger, K., Arnold, J. G., and Bosch, D. D. (2020). A new physically-based spatially-distributed groundwater flow module for SWAT+. Hydrology 7 (4), 75. doi:10.3390/hydrology7040075
Bennett, E. M., Baird, J., Baulch, H., Chaplin-Kramer, R., Fraser, E., Loring, P., et al. (2021). Ecosystem services and the resilience of agricultural landscapes. Adv. Ecol. Res. 64, 1–43. doi:10.1016/bs.aecr.2021.01.001
Benson, V. S., VanLeeuwen, J. A., Stryhn, H., and Somers, G. H. (2007). Temporal analysis of groundwater nitrate concentrations from wells in Prince Edward Island, Canada: application of a linear mixed effects model. Hydrogeology J. 15 (5), 1009–1019. doi:10.1007/s10040-006-0153-x
Bhatti, A. Z., Farooque, A. A., Krouglicof, N., Peters, W., Li, Q., and Acharya, B. (2022). Climate change impacts on rainfed agriculture and mitigation strategies for sustainable agricultural management: a case study of Prince Edward Island, Canada. World Water Policy 8 (2), 142–179. doi:10.1002/wwp2.12083
Boesch, D. F., and Brinsfield, R. B. (2000). Coastal eutrophication and agriculture: contributions and solutions. Biol. Resour. Manag. Connecting Sci. Policy, 93–115. doi:10.1007/978-3-662-04033-1_8
Bonnington, A. C., Jamieson, R. C., Smith, K. A., Oliver, A., Johnston, L. H., LeRoux, N. K., et al. (2023). Impacts of Extratropical Cyclone Fiona on a sensitive coastal lagoon ecosystem. Limnol. Oceanogr. 68 (12), 2703–2715. doi:10.1002/lno.12452
Bosch, D. D., Arnold, J. G., Volk, M., and Allen, P. M. (2010). Simulation of a low-gradient coastal plain watershed using the SWAT landscape model. Trans. ASABE 53 (5), 1445–1456. doi:10.13031/2013.34899
Bugden, G., Jiang, Y., van den Heuvel, M. R., Vandermeulen, H., MacQuarrie, K. T. B., Crane, C. J., et al. (2014) “Nitrogen loading criteria for estuaries in Prince edward island,” in Fisheries and Oceans Canada, 3066. Ottawa, ON: Fisheries and Oceans Canada: Canadian Technical Report of Fisheries and Aquatic Sciences.
Bürger, G., Sobie, S. R., Cannon, A. J., Werner, A. T., and Murdock, T. Q. (2013). Downscaling extremes: an intercomparison of multiple methods for future climate. J. Clim. 26 (10), 3429–3449. doi:10.1175/JCLI-D-12-00249.1
Canadian Council of Ministers of the Environment (CCME) (2012). “Canadian water quality guidelines: nitrate ion,” in Scientific criteria document. Winnipeg: Canadian Council of Ministers of the Environment.
Cannon, A. J. (2015). Selecting GCM scenarios that span the range of changes in a multimodel ensemble: application to CMIP5 climate extremes indices. J. Clim. 28 (3), 1260–1267. doi:10.1175/JCLI-D-14-00636.1
Carter, M. R. (1987). Physical properties of some Prince Edward Island soils in relation to their tillage requirement and suitability for direct drilling. Can. J. Soil Sci. 67 (3), 473–487. doi:10.4141/cjss87-045
Carter, M. R., Sanderson, J. B., and MacLeod, J. A. (1998). Influence of time of tillage on soil physical attributes in potato rotations in Prince Edward Island. Soil Tillage Res. 49 (1-2), 127–137. doi:10.1016/S0167-1987(98)00167-6
Chu, T. W., Shirmohammadi, A., Montas, H., and Sadeghi, A. (2004). Evaluation of the SWAT model’s sediment and nutrient components in the piedmont physiographic region of Maryland. Trans. ASABE 47, 1523–1538.
Cloern, J. E. (2001). Our evolving conceptual model of the coastal eutrophication problem. Mar. Ecol. Prog. Ser. 210, 223–253. doi:10.3354/meps210223
Coffin, M. R. S., Courtenay, S. C., Knysh, K. M., Pater, C. C., and van den Heuvel, M. R. (2018). Impacts of hypoxia on estuarine macroinvertebrate assemblages across a regional nutrient gradient. Facets 3 (1), 23–44. doi:10.1139/facets-2017-0044
Connolly, K. (2002). Baseline limnology and nutrient study of Basin Head lagoon, Prince edward island, with management implications. Master’s Thesis. Waterloo, ON: Wilfrid Laurier University. Available at: https://scholars.wlu.ca/etd/434/.
Council of Canadian Academies (2009). The sustainable management of groundwater in Canada. Ottawa, ON: Expert Panel Groundwater, Report to the Government of Canada.
Court, A. (1962). Measures of streamflow timing. J. Geophys. Res. 67 (11), 4335–4339. doi:10.1029/JZ067i011p04335
De Jong, R., Qian, B., and Yang, J. Y. (2008). Modelling nitrogen leaching in Prince Edward Island under climate change scenarios. Can. J. Soil Sci. 88 (1), 61–78. doi:10.4141/cjss07032
Delgado, J. A., Riggenbach, R. R., Sparks, R. T., Dillon, M. A., Kawanabe, L. M., and Ristau, R. J. (2001). Evaluation of nitrate-nitrogen transport in a potato–barley rotation. Soil Sci. Soc. Am. J. 65 (3), 878–883. doi:10.2136/sssaj2001.653878x
DELJ (2013). Water extraction permitting policy. Available at: https://www.princeedwardisland.ca/sites/default/files/publications/water_extraction_permitting_policy_2013.pdf.
De Notaris, C., Rasmussen, J., Sørensen, P., and Olesen, J. E. (2018). Nitrogen leaching: a crop rotation perspective on the effect of N surplus, field management and use of catch crops. Agric. Ecosyst. & Environ. 255, 1–11. doi:10.1016/j.agee.2017.12.009
Department of Fisheries and Oceans Canada (DFO) (2009). Ecological assessment of Irish moss (chondrus crispus) in Basin Head marine protected area (gulf region CSAS science advisory report 2008/059), Fisheries and Oceans Canada, moncton, Canada. Available at: https://waves-vagues.dfo-mpo.gc.ca/library-bibliotheque/335723.pdf.
Department of Fisheries and Oceans Canada (DFO) (2021). 2021-2026 Operational management plan Basin Head marine protected area. Available at: https://waves-vagues.dfo-mpo.gc.ca/library-bibliotheque/4104440x.pdf.
Dunn, A. M., Julien, G., Ernst, W. R., Cook, A., Doe, K. G., and Jackman, P. M. (2011). Evaluation of buffer zone effectiveness in mitigating the risks associated with agricultural runoff in Prince Edward Island. Sci. Total Environ. 409 (5), 868–882. doi:10.1016/j.scitotenv.2010.11.011
El-Khoury, A., Seidou, O., Lapen, D. R., Que, Z., Mohammadian, M., Sunohara, M., et al. (2015). Combined impacts of future climate and land use changes on discharge, nitrogen and phosphorus loads for a Canadian river basin. J. Environ. Manag. 151, 76–86. doi:10.1016/j.jenvman.2014.12.012
Environment and Climate Change Canada (ECCC) (2023). Historical data, East Point. Ottawa, ON: Prince Edward Island. [Station ID 7177; December 2022].
Eyring, V., Bony, S., Meehl, G. A., Senior, C. A., Stevens, B., Stouffer, R. J., et al. (2016). Overview of the coupled model intercomparison Project phase 6 (CMIP6) experimental design and organization. Geosci. Model Dev. 9 (5), 1937–1958. doi:10.5194/gmd-9-1937-2016
Fan, Y. (2019). Are catchments leaky? Wiley interdisciplinary reviews. Water 6 (6), e1386. doi:10.1002/wat2.1386
Fetter, C. W., Boving, T., and Kreamer, D. (2017). Contaminant hydrogeology, Waveland Press. Saddle River, NJ: Prentice Hall Press.
Francis, R. M. (1989). Hydrogeology of the winter river basin, Prince edward island. Charlottetown, PEI: PEI Department of Environment, PEI. Available at: http://www.gov.pe.ca/photos/original/cle_WinterR.pdf.
Gopalakrishnan, T., Hasan, M. K., Haque, A. S., Jayasinghe, S. L., and Kumar, L. (2019). Sustainability of coastal agriculture under climate change. Sustainability 11 (24), 7200. doi:10.3390/su11247200
Gordon, L. J., Peterson, G. D., and Bennett, E. M. (2008). Agricultural modifications of hydrological flows create ecological surprises. Trends Ecol. & Evol. 23 (4), 211–219. doi:10.1016/j.tree.2007.11.011
Government of PEI (2002). Agricultural crop rotation Act. Available at: https://www.princeedwardisland.ca/sites/default/files/legislation/a-08-01-agricultural_crop_rotation_act.pdf.
Government of PEI (2016). Watercourse, wetland and buffer zone activity regulations. Available at: https://www.princeedwardisland.ca/sites/default/files/publications/watercourse_wetland_and_buffer_zone_activity_guidelines_dec_2016.pdf.
Government of Prince Edward Island (2020) “The Prince Edward Island potato sector: an economic impact analysis,” in Charlottetown, PE: strategic policy and evaluation division. Charlottetown, PEI: PEI Department of Agriculture and Land. Available at: https://www.princeedwardisland.ca/sites/default/files/publications/af_potato_econ_impact_study.pdf.
Grizard, P. (2013). Modeling nitrate loading from watersheds to coastal water of the Northumberland Strait. Master’s Thesis, Fredericton, NB: University of New Brunswick. Available at: https://unbscholar.lib.unb.ca/handle/1882/13636.
Harmel, R. D., Smith, P. K., Migliaccio, K. W., Chaubey, I., Douglas-Mankin, K. R., Benham, B., et al. (2014). Evaluating, interpreting, and communicating performance of hydrologic/water quality models considering intended use: a review and recommendations. Environ. Model. & Softw. 57, 40–51. doi:10.1016/j.envsoft.2014.02.013
Heath, R. C. (1983). Basic ground-water hydrology (water supply paper 2220). Reston, VA: U.S. Geological Survey. Available at: https://pubs.er.usgs.gov/djvu/WSP/wsp_2220.pdf.
Heathwaite, A. L., Griffiths, P., and Parkinson, R. J. (1998). Nitrogen and phosphorus in runoff from grassland with buffer strips following application of fertilizers and manures. Soil Use Manag. 14 (3), 142–148. doi:10.1111/j.1475-2743.1998.tb00140.x
Helmers, M., Isenhart, T., Dosskey, M., Dabney, S., and Strock, J. (2006). Buffers and vegetative filter strips. Available at: https://www.epa.gov/sites/default/files/2015-07/documents/2006_8_24_msbasin_symposia_ia_session4-2.pdf.
Howarth, R. W. (2008). Coastal nitrogen pollution: a review of sources and trends globally and regionally. Harmful Algae 8 (1), 14–20. doi:10.1016/j.hal.2008.08.015
Howden, S. M., Soussana, J. F., Tubiello, F. N., Chhetri, N., Dunlop, M., and Meinke, H. (2007). Adapting agriculture to climate change. Proc. Natl. Acad. Sci. 104 (50), 19691–19696. doi:10.1073/pnas.0701890104
James, C. (2022). SWAT+ Toolbox. Available at: https://celray.github.io/docs/swatplus-toolbox/v1.0/index.html.
Jeppesen, E., Kronvang, B., Olesen, J. E., Audet, J., Søndergaard, M., Hoffmann, C. C., et al. (2011). Climate change effects on nitrogen loading from cultivated catchments in Europe: implications for nitrogen retention, ecological state of lakes and adaptation. Hydrobiologia 663, 1–21. doi:10.1007/s10750-010-0547-6
Jiang, Y., and Somers, G. (2009). Modeling effects of nitrate from non-point sources on groundwater quality in an agricultural watershed in Prince Edward Island, Canada. Hydrogeology J. 17 (3), 707–724. doi:10.1007/s10040-008-0390-2
Jiang, Y., Zebarth, B., and Love, J. (2011). Long-term simulations of nitrate leaching from potato production systems in Prince Edward Island, Canada. Nutrient Cycl. Agroecosyst. 91, 307–325. doi:10.1007/s10705-011-9463-z
Johnston, L. H., Dunnington, D. W., Greenwood, M. C., Kurylyk, B. L., and Jamieson, R. C. (2022). Identifying hydrologic regimes and drivers in Nova Scotia, Canada: catchment classification efforts for a data-limited region. J. Hydrologic Eng. 27 (11), 05022017. doi:10.1061/(ASCE)HE.1943-5584.0002200
Joostema, P. (2015). Site location plan: saltwater production well development [Well core log and pumping test data]. Joost Environ.
KarisAllen, J., and Kurylyk, B. L. (2021). Drone-based characterization of intertidal spring cold-water plume dynamics. Hydrol. Process. 35 (6), e14258. doi:10.1002/hyp.14258
KarisAllen, J. J., Mohammed, A. A., Tamborski, J. J., Jamieson, R. C., Danielescu, S., and Kurylyk, B. L. (2022). Present and future thermal regimes of intertidal groundwater springs in a threatened coastal ecosystem. Hydrology Earth Syst. Sci. 26 (18), 4721–4740. doi:10.5194/HESS-26-4721-2022
Kurylyk, B. L., and MacQuarrie, K. T. (2013). The uncertainty associated with estimating future groundwater recharge: a summary of recent research and an example from a small unconfined aquifer in a northern humid-continental climate. J. hydrology 492, 244–253. doi:10.1016/j.jhydrol.2013.03.043
Kurylyk, B. L., MacQuarrie, K. T., and Voss, C. I. (2014). Climate change impacts on the temperature and magnitude of groundwater discharge from shallow, unconfined aquifers. Water Resour. Res. 50 (4), 3253–3274. doi:10.1002/2013WR014588
Lal, R., Delgado, J. A., Groffman, P. M., Millar, N., Dell, C., and Rotz, A. (2011). Management to mitigate and adapt to climate change. J. Soil Water Conservation 66 (4), 276–285. doi:10.2489/jswc.66.4.276
Liang, K., Jiang, Y., Nyiraneza, J., Fuller, K., Murnaghan, D., and Meng, F. R. (2019). Nitrogen dynamics and leaching potential under conventional and alternative potato rotations in Atlantic Canada. Field Crops Res. 242, 107603. doi:10.1016/j.fcr.2019.107603
Liang, K., Jiang, Y., Qi, J., Fuller, K., Nyiraneza, J., and Meng, F. R. (2020). Characterizing the impacts of land use on nitrate load and water yield in an agricultural watershed in Atlantic Canada. Sci. Total Environ. 729, 138793. doi:10.1016/j.scitotenv.2020.138793
Liu, Y., Engel, B. A., Flanagan, D. C., Gitau, M. W., McMillan, S. K., and Chaubey, I. (2017). A review on effectiveness of best management practices in improving hydrology and water quality: needs and opportunities. Sci. Total Environ. 601, 580–593. doi:10.1016/j.scitotenv.2017.05.212
Lu, C., and Tian, H. (2017). Global nitrogen and phosphorus fertilizer use for agriculture production in the past half century: shifted hot spots and nutrient imbalance. Earth Syst. Sci. Data 9 (1), 181–192. doi:10.5194/essd-9-181-2017
Luo, C., Li, Z., Liu, H., Li, H., Wan, R., Pan, J., et al. (2020). Differences in the responses of flow and nutrient load to isolated and coupled future climate and land use changes. J. Environ. Manag. 256, 109918. doi:10.1016/j.jenvman.2019.109918
Luo, Y., Arnold, J., Allen, P., and Chen, X. (2012). Baseflow simulation using SWAT model in an inland river basin in Tianshan Mountains, Northwest China. Hydrology Earth Syst. Sci. 16 (4), 1259–1267. doi:10.5194/hess-16-1259-2012
MacDougall, J. I., Veer, C., and Wilson, F. (1988). Soil of Prince edward island: Prince edward island soil survey. Ottawa, ON: Agriculture Canada. Available at: https://sis.agr.gc.ca/cansis/publications/surveys/pe/pe83-54/index.html.
Mahato, A. (2014). Climate change and its impact on agriculture. Int. J. Sci. Res. Publ. 4 (4), 1–6.
Malone, T. C., and Newton, A. (2020). The globalization of cultural eutrophication in the coastal ocean: causes and consequences. Front. Mar. Sci. 7, 670. doi:10.3389/fmars.2020.00670
Mankin, K. R., Ngandu, D. M., Barden, C. J., Hutchinson, S. L., and Geyer, W. A. (2007). Grass shrub riparian buffer removal of sediment, phosphorus, and nitrogen from simulated runoff. J. Am. Water Resour. Assoc. 43 (5), 1108–1116. doi:10.1111/j.1752-1688.2007.00090.x
Maurer, E. P., Hidalgo, H. G., Das, T., Dettinger, M. D., and Cayan, D. R. (2010). The utility of daily large-scale climate data in the assessment of climate change impacts on daily streamflow in California. Hydrology Earth Syst. Sci. 14 (6), 1125–1138. doi:10.5194/hess-14-1125-2010
Minitab, L. L. C. (2021). Minitab. Available at: https://www.minitab.com.
Moriasi, D. N., Arnold, J. G., Van Liew, M. W., Bingner, R. L., Harmel, R. D., and Veith, T. L. (2007). Model evaluation guidelines for systematic quantification of accuracy in watershed simulations. Trans. ASABE 50 (3), 885–900. doi:10.13031/2013.23153
Mukundan, R., Hoang, L., Gelda, R. K., Yeo, M. H., and Owens, E. M. (2020). Climate change impact on nutrient loading in a water supply watershed. J. Hydrology 586, 124868. doi:10.1016/j.jhydrol.2020.124868
NASA (2023). Climate data services (CDS). Available at: https://www.nccs.nasa.gov/services/climate-data-services.
Neitsch, S. L., Arnold, J. G., Kiniry, J. R., and Williams, J. R. (2011). Soil and water assessment tool theoretical documentation version 2009. College Station, Texas: Texas Water Resources Institute, Texas A&M University. Available at: https://swat.tamu.edu/media/99192/swat2009-theory.pdf.
Nelson, G. C., Rosegrant, M. W., Koo, J., Robertson, R., Sulser, T., Zhu, T., et al. (2009). Impact on agriculture and costs of adaptation. Food Policy Report. Washington DC: International Food Policy Research Institute.
Oliver, A. C., Jamieson, R. C., Smith, K. A., Cantelon, J. A., and Kurylyk, B. L. (2024). Intertidal spring dynamics and coastal nutrient loading revealed through geophysics, drone surveys, and in situ monitoring. Hydrol. Process. 38 (5), e15144. doi:10.1002/hyp.15144
Oppenheimer, M., Glavovic, B. C., Hinkel, J., van de Wal, R., Magnan, A. K., Abd-Elgawad, A., et al. (2019). “Sea level rise and implications for low-lying islands, coasts and communities,” in IPCC special report on the ocean and cryosphere in a changing climate. Editors H. O. Pӧrtner, D. C. Roberts, V. Masson-Delmotte, P. Zhai, M. Tignor, E. Poloczanskaet al. (Cambridge, UK and New York, NY, USA: Cambridge University Press), 321–445. doi:10.1017/9781009157964.006
Paradis, D., Vigneault, H., Lefebvre, R., Savard, M. M., Ballard, J. M., and Qian, B. (2016). Groundwater nitrate concentration evolution under climate change and agricultural adaptation scenarios: Prince Edward Island, Canada. Earth Syst. Dyn. 7 (1), 183–202. doi:10.5194/esd-7-183-2016
Pavlovskii, I., Jiang, Y., Danielescu, S., and Kurylyk, B. L. (2023). Influence of precipitation event magnitude on baseflow and coastal nitrate export for Prince Edward Island, Canada. Hydrol. Process. 37, e14892. doi:10.1002/hyp.14892
PEI Department of Fisheries and Environment (1996). Water on Prince edward island: understanding the resource, knowing the issues. Available at: https://www.princeedwardisland.ca/sites/default/files/publications/water_on_prince_edward_island_understanding_the_resource_knowing_the_issues.pdf.
Pesce, M., Critto, A., Torresan, S., Giubilato, E., Santini, M., Zirino, A., et al. (2018). Modelling climate change impacts on nutrients and primary production in coastal waters. Sci. Total Environ. 628, 919–937. doi:10.1016/j.scitotenv.2018.02.131
Province of PEI (2008). 2 meter contours. Available at: http://www.gov.pe.ca/gis/index.php3?number=1011267&lang=E#what.1.
Puckett, L. J., Tesoriero, A. J., and Dubrovsky, N. M. (2011). Nitrogen contamination of surficial aquifers-A growing legacy. Environ. Sci. Technol. 45 (3), 839–844. doi:10.1021/es1038358
Pulido-Velazquez, M., Peña-Haro, S., García-Prats, A., Mocholi-Almudever, A. F., Henríquez-Dole, L., Macian-Sorribes, H., et al. (2015). Integrated assessment of the impact of climate and land use changes on groundwater quantity and quality in the Mancha Oriental system (Spain). Hydrology Earth Syst. Sci. 19 (4), 1677–1693. doi:10.5194/hess-19-1677-2015
Qi, S., Sun, G., Wang, Y., McNulty, S. G., and Myers, J. M. (2009). Streamflow response to climate and landuse changes in a coastal watershed in North Carolina. Trans. ASABE 52 (3), 739–749. doi:10.13031/2013.27395
Rabalais, N. N., Turner, R. E., Díaz, R. J., and Justić, D. (2009). Global change and eutrophication of coastal waters. ICES J. Mar. Sci. 66 (7), 1528–1537. doi:10.1093/icesjms/fsp047
Rahimpour Asenjan, M., Brissette, F., Martel, J. L., and Arsenault, R. (2023). Understanding the influence of “hot” models in climate impact studies: a hydrological perspective. Hydrology Earth Syst. Sci. 27 (23), 4355–4367. doi:10.5194/hess-27-4355-2023
Riahi, K., Van Vuuren, D. P., Kriegler, E., Edmonds, J., O’neill, B. C., Fujimori, S., et al. (2017). The Shared Socioeconomic Pathways and their energy, land use, and greenhouse gas emissions implications: an overview. Glob. Environ. change 42, 153–168. doi:10.1016/j.gloenvcha.2016.05.009
Ricci, G. F., Centanni, M., DeGirolamo, A. M., and Gentile, F. (2023). Modelling daily streamflow in a temporary karst river system: comparing three approaches using the SWAT model. Hydrological Sci. J. 68 (3), 462–473. doi:10.1080/02626667.2023.2174027
Richards, W., and Daigle, R. (2011) “Scenarios and guidance for adaptation to climate change and sea level rise-NS and PEI municipalities,” in Atlantic climate adaptation solutions association. Available at: https://www.novascotia.ca/nse/climate-change/docs/ScenariosGuidance_WilliamsDaigle.pdf.
Rivera, A. (2014). Canada’s groundwater Resources. Markham, ON: Fitzhenry & Whiteside Limited. doi:10.4095/293431
Sanderson, J. B., MacLeod, J. A., and Kimpinski, J. (1999). Glyphosate application and timing of tillage of red clover affects potato response to N, soil N profile, and root and soil nematodes. Can. J. Soil Sci. 79 (1), 65–72. doi:10.4141/s98-028
Shrestha, R. R., Dibike, Y. B., and Prowse, T. D. (2012). Modeling climate change impacts on hydrology and nutrient loading in the Upper Assiniboine Catchment. J. Am. Water Resour. Assoc. 48 (1), 74–89. doi:10.1111/j.1752-1688.2011.00592.x
Simpkins, W. W., Wineland, T. R., Andress, R. J., Johnston, D. A., Caron, G. C., Isenhart, T. M., et al. (2002). Hydrogeological constraints on riparian buffers for reduction of diffuse pollution: examples from the Bear Creek Watershed in Iowa, USA. Water Sci. Technol. 45 (9), 61–68. doi:10.2166/wst.2002.0205
Sinclair, A. C. (2014). An integrated modeling approach for the evaluation of phosphorus loading in rural Nova Scotia watersheds Doctoral Dissertation. Halifax, NS: Dalhousie University.
Sinha, E., Michalak, A. M., Calvin, K. V., and Lawrence, P. J. (2019). Societal decisions about climate mitigation will have dramatic impacts on eutrophication in the 21st century. Nat. Commun. 10 (1), 939. doi:10.1038/s41467-019-08884-w
Sirabahenda, Z., St-Hilaire, A., Courtenay, S. C., and Van Den Heuvel, M. R. (2020). Assessment of the effective width of riparian buffer strips to reduce suspended sediment in an agricultural landscape using ANFIS and SWAT models. Catena 195, 104762. doi:10.1016/j.catena.2020.104762
Spalding, R. F., and Exner, M. E. (1993). Occurrence of nitrate in groundwater—a review. J. Environ. Qual. 22 (3), 392–402. doi:10.2134/jeq1993.00472425002200030002x
Spruill, C. A., Workman, S. R., and Taraba, J. L. (2000). Simulation of daily and monthly stream discharge from small watersheds using the SWAT model. Trans. ASAE 43 (6), 1431–1439. doi:10.13031/2013.3041
Stanic, S., LeRoux, N. K., Paldor, A., Mohammed, A. A., Michael, H. A., and Kurylyk, B. L. (2024). Saltwater intrusion into a confined island aquifer driven by erosion, changing recharge, sea-level rise, and coastal flooding. Water Resour. Res. 60 (1), e2023WR036394. doi:10.1029/2023WR036394
Stuart, M. E., Gooddy, D. C., Bloomfield, J. P., and Williams, A. T. (2011). A review of the impact of climate change on future nitrate concentrations in groundwater of the UK. Sci. Total Environ. 409 (15), 2859–2873. doi:10.1016/j.scitotenv.2011.04.016
Stuart, V. (2017). Watershed evaluation of beneficial management practices (WEBs): managing our land and protecting our water through long-term watershed-scale research: final report (2004-2013). Ottawa. Ont: Agriculture and Agri-Food Canada.
Sustainable Canadian Agricultural Partnership (CAP) (2023). Agriculture stewardship program. Available at: https://www.princeedwardisland.ca/sites/default/files/publications/af_asp_guide.pdf.
Sweeney, B. W., and Newbold, J. D. (2014). Streamside forest buffer width needed to protect stream water quality, habitat, and organisms: a literature review. J. Am. Water Resour. Assoc. 50 (3), 560–584. doi:10.1111/jawr.12203
Tackley, H. A., Kurylyk, B. L., Lake, C. B., Lapen, D. R., and van Proosdij, D. (2023). Impacts of repeated coastal flooding on soil and groundwater following managed dike realignment. Sci. Total Environ. 893, 164957. doi:10.1016/j.scitotenv.2023.164957
Tesoriero, A. J., Duff, J. H., Saad, D. A., Spahr, N. E., and Wolock, D. M. (2013). Vulnerability of streams to legacy nitrate sources. Environ. Sci. & Technol. 47 (8), 3623–3629. doi:10.1021/es305026x
Tong, S. T., and Liu, A. J. (2006). Modelling the hydrologic effects of land-use and climate changes. Int. J. Risk Assess. Manag. 6 (4-6), 344–368. doi:10.1504/ijram.2006.009543
Turnipseed, D. P., and Sauer, V. B. (2010). Discharge measurements at gaging stations (No. 3-A8). Reston, VA: US Geological Survey. doi:10.3133/tm3A8
Uzeika, T., Merten, G. H., Minella, J. P., and Moro, M. (2012). Use of the SWAT model for hydro-sedimentologic simulation in a small rural watershed. Rev. Bras. Ciência do Solo 36, 557–565. doi:10.1590/s0100-06832012000200025
Van Liew, M. W., Feng, S., and Pathak, T. B. (2012). Climate change impacts on streamflow, water quality, and best management practices for the Shell and Logan Creek Watersheds in Nebraska, USA. Int. J. Agric. Biol. Eng. 5 (1), 13–34. doi:10.3965/j.ijabe.20120501.003
Wagena, M. B., and Easton, Z. M. (2018). Agricultural conservation practices can help mitigate the impact of climate change. Sci. Total Environ. 635, 132–143. doi:10.1016/j.scitotenv.2018.04.110
Wang, X., Guo, J., Fenech, A., and Farooque, A. A. (2022). Future climate projections for Eastern Canada. Clim. Dyn. 59 (9-10), 2735–2750. doi:10.1007/s00382-022-06251-y
Whittaker, J., Nyiraneza, J., Zebarth, B. J., Jiang, Y., and Burton, D. L. (2023). The effects of forage grasses and legumes on subsequent potato yield, nitrogen cycling, and soil properties. Field Crops Res. 290, 108747. doi:10.1016/j.fcr.2022.108747
Zebarth, B. J., Danielescu, S., Nyiraneza, J., Ryan, M. C., Jiang, Y., Grimmett, M., et al. (2015). Controls on nitrate loading and implications for BMPs under intensive potato production systems in Prince Edward Island, Canada. Groundw. Monit. Remediat. 35 (1), 30–42. doi:10.1111/gwmr.12088
Zebarth, B. J., Drury, C. F., Tremblay, N., and Cambouris, A. N. (2009). Opportunities for improved fertilizer nitrogen management in production of arable crops in eastern Canada: a review. Can. J. Soil Sci. 89 (2), 113–132. doi:10.4141/cjss07102
Keywords: hydrologic model, SWAT+, climate change, best management practice, nitrate loading
Citation: Oliver AC, Kurylyk BL, Johnston LH, LeRoux NK, Somers LD and Jamieson RC (2024) Impacts of climate change and best management practices on nitrate loading to a eutrophic coastal lagoon. Front. Environ. Sci. 12:1468869. doi: 10.3389/fenvs.2024.1468869
Received: 22 July 2024; Accepted: 15 August 2024;
Published: 27 August 2024.
Edited by:
Yefang Jiang, Agriculture and Agri-Food Canada (AAFC), CanadaReviewed by:
Kang Liang, University of Maryland, College Park, United StatesYongbo Liu, Environment and Climate Change Canada (ECCC), Canada
Copyright © 2024 Oliver, Kurylyk, Johnston, LeRoux, Somers and Jamieson. This is an open-access article distributed under the terms of the Creative Commons Attribution License (CC BY). The use, distribution or reproduction in other forums is permitted, provided the original author(s) and the copyright owner(s) are credited and that the original publication in this journal is cited, in accordance with accepted academic practice. No use, distribution or reproduction is permitted which does not comply with these terms.
*Correspondence: Rob. C. Jamieson, amFtaWVzcmNAZGFsLmNh