 Shumin Chen
- School of Economics, Guangdong University of Technology, Guangzhou, China
In the context of the global push towards a green economy, this research investigates the impact of green trade barriers on the export trade volume of Chinese photovoltaic products to ASEAN from 2010 to 2021. The strong evidence indicates that green trade barriers have a positive effect on improving the export trade volume of Chinese photovoltaic products to ASEAN. This conclusion remains robust through multiple robustness tests, including excluding data from pandemic-affected years and the only developed country Singapore. Moreover, the impact of green trade barriers varies with exchange rate levels and language environments. In countries with higher exchange rates and countries with different official languages, the positive effect of green trade barriers on trade is more significant. In contrast, in countries with the same official language, green trade barriers have a negative effect on improving the trade volume. Additionally, higher levels of renewable energy consumption diminish the beneficial effect of TBT on photovoltaic trade, and CO2 emissions lessen the detrimental effect of TBT on photovoltaic trade. The findings provide valuable insights for policymakers, suggesting that align with international standards, provide differentiated technical assistance and adopt transparent trade rules when formulating green trade barriers to better support the competitiveness and export growth of Chinese photovoltaic products in the international market.
1 Introduction
With the increasing awareness of environmental protection and sustainable development globally, green barriers to trade (GBT), which emerged in the late 1980s and gained prominence in the 1990s (Li et al., 2020), have replaced traditional tariff barriers, which become important non-tariff barriers worldwide. Many scholars have explored its connotation and impact from various perspectives. Roberts (1998) proposed that green trade barriers are essentially technical trade barriers. Although they arise from the need to satisfy developed countries' demands for environmental protection, product differentiation, and product information, if these barriers are used unreasonably, they can become tools for protecting domestic products and markets (Maskus and Wilson, 2001). As time went by, environmental barriers, also known as “green barriers,” were used to implement trade protection and discrimination by establishing high-standard domestic environmental regulations (Deng and Huang, 2018). Therefore, GTB refers to trade-restrictive measures that are taken to promote the environment and achieve sustainable development, aiming at ensuring imported goods comply with environmental standards, laws and regulations (Zhao, 2007). Biermann et al. (2009) highlight that governments worldwide are increasingly adopting green trade barriers as a strategy to internalize environmental costs and foster sustainable development.
In tackling challenges like climate change, environmental protection, and energy shortages, renewable energy sources are receiving increasing attention (Owusu and Asumadu-Sarkodie, 2016). Electric vehicles, lithium batteries, and photovoltaic products, known as the “new three drivers” of China’s foreign trade. As a crucial means of generating clean energy, photovoltaic products hold considerable development potential (Zhu et al., 2021), have even been identified by the National Development and Reform Commission’s Energy Research Institute as a crucial tool for stabilizing China’s foreign trade and boosting the economy. China is experiencing rapid growth in photovoltaic (PV) technology, leading the world in both installed capacity and the shipping volume of exporting PV modules (Yao and Cai, 2019). Data from the General Administration of Customs showed that in the past decade, China’s total exports of photovoltaic products such as silicon wafers, photovoltaic cells and photovoltaic modules ranked first in the world, climbing from US $233 billion in 2012 to US $51.25 billion in 2002, breaking through US $50 billion for the first time, hitting a record high. Year-on-year growth reached 80.3 per cent. In the first half of 2023, China’s total exports of photovoltaic products are about 29.2 billion US dollars, an increase of 11.7% over the same period last year, of which silicon wafers, photovoltaic cells, photovoltaic modules accounted for 10.2%, 8.6% and 81.1%, respectively1. These achievements can be attributed to the integrity of the supply chain. In the upstream segment of China’s photovoltaic industry, China benefits from abundant silicon resources and advanced purification technology as the world’s largest polysilicon producer (Rehman et al., 2021). The scale of production and technological advancements have significantly reduced polysilicon production costs, giving Chinese PV products a cost advantage. In the midstream segment of China’s photovoltaic industry, significant advancements have been made in the manufacturing of PV cells and modules, particularly in monocrystalline silicon cells and high-efficiency cell technologies. Leading Chinese PV module manufacturers such as Longi Green Energy, Trina Solar, and JA Solar hold prominent positions in the international market, with their products widely exported across the globe. And the downstream section is the major activities including Installation and after-sales service (Jackson et al., 2021). Besides, China’s port is huge and equipped with lots of robots, facilitating a strong carrying capacity on the sea (Wu and Yang, 2018), which provide efficient transport services for export products (Song and Mi, 2016).
Recently, facing several urgent factors related to energy transition and environmental concerns, Southeast Asia’s demand for renewable energy has significantly increased (Erdiwansyah et al., 2019a). Among these, one of the primary reasons for the surge in PV demand is the severe pollution caused by fossil fuel consumption (Chen and Mauzerall, 2021). Southeast Asian countries such as Indonesia, Vietnam, and the Philippines have been rapidly expanding their coal power capacities, making the region one of the fastest-growing areas for coal-fired power generation, second only to China and India. However, this dependence on coal is increasingly becoming problematic. For instance, according to Chen and Mauzerall (2021), the combined output from planned fossil fuel plants, along with renewable energy targets and current capacity, is expected to exceed future electricity demand. This indicates that many of these fossil fuel plants may become stranded assets (Ansari and Holz, 2020), unused and unprofitable, while also limiting the deployment of renewable energy. In addition, Southeast Asia’s reliance on fossil fuels conflicts with the goals set forth by international agreements, such as the Paris Agreement and the Copenhagen Accord. Clark et al. (2020) notes that the current trajectory of coal power expansion in Southeast Asia will severely hinder the region’s ability to meet its climate commitments. As a result, the region faces growing pressure to transition to cleaner energy sources, creating a strong demand for renewable technologies like PV systems.
While Southeast Asia’s demand for photovoltaic (PV) products is rapidly increasing, the region faces significant barriers to developing its own large-scale PV manufacturing industry. These challenges make it more reliant on imports from countries like China to meet its renewable energy needs (Erdiwansyah et al., 2019b). The reasons for this reliance can be understood through several key factors. First is the lack of raw materials and advanced manufacturing capabilities. The production of PV products, especially solar cells and modules, requires highly specialized technology and expertise. China has spent decades developing a comprehensive and vertically integrated PV supply chain, from the production of raw materials like polysilicon to the manufacturing of high-efficiency solar modules. Southeast Asian countries, by contrast, do not possess the same level of advanced manufacturing infrastructure or technological know-how to compete with established global players like China (Yeung, 2013), like technology for large-scale purification and, which are unable to produce PV products at the same scale and quality. For instance, the Philippines has similarly set ambitious renewable energy targets as part of its efforts to transition away from fossil fuels (Aleluia et al., 2022). However, the country lacks a robust PV manufacturing industry. While the Philippines has a few solar panel assembly plants, such as First Philec and SunPower, these operations are primarily focused on assembly rather than full-scale production, and many of the critical components they use are imported from countries like China. For example, SunPower, which has a facility in the Philippines, imports silicon wafers and solar cells from China, as the Philippines does not produce these components domestically. To meet the country’s growing demand for solar energy, the government has relied on importing solar panels and components. In 2020, the Philippines imported around 85% of its solar panels from China, reinforcing its reliance on external sources to achieve its energy transition targets. In addition, Southeast Asian countries have prioritized the deployment of renewable energy infrastructure, including solar power, over developing a local manufacturing industry for PV products. Governments in the region are more focused on meeting their energy transition goals, such as those outlined in the Paris Agreement, rather than building manufacturing capacity. As a result, these countries rely on imports to quickly scale up their renewable energy capacity, leveraging China’s established supply chain and competitive pricing to meet their energy needs. Vietnam has made significant strides in installing renewable energy capacity (Riva Sanseverino et al., 2020), particularly in solar energy, which expand the need for PV products. By the end of 2020, Vietnam had installed over 16 GW of solar capacity, making it one of the top solar energy producers in Southeast Asia. However, the country’s focus has been on deploying solar farms and rooftop solar systems rather than establishing a local manufacturing industry for PV products. While Vietnam does have some solar panel manufacturers, they largely produce for export and rely on importing critical components. As a result, it is challenging for them to achieve self-sufficiency in production, making them heavily reliant on imports. Importing photovoltaic modules from China, with its highly developed supply chain, is a more practical and cost-effective solution.
However, even though ASEAN countries have a high demand for importing PV products, they are continually raising various market access standards, posing obstacles to the export of Chinese photovoltaic products to Southeast Asia. For instance, Malaysia requires imported photovoltaic products to be certified by the Energy Commission of Malaysia (Chua and Oh, 2010). Similarly, the Thai government enforces stringent quality and certification standards for imported photovoltaic modules. These green trade barriers increase the difficulty for Chinese enterprises to enter the Southeast Asian market. The additional testing and certification costs not only raise expenses but also extend the market entry time.
Based on this context, this paper aims to explore the impact of green trade barriers on the trade value of photovoltaic (PV) products in China-ASEAN, and to provide a comprehensive analysis of this important but under-researched topic, and attempt to answer the following questions:
How do green trade barriers affect the trade volume of Chinese photovoltaic products exported to ASEAN countries? What is the influence mechanism between the two? Is there any heterogeneous influence?
By exploring these issues, this paper hopes to provide valuable insights for policymakers and industry practitioners to help them better address the challenges posed by green trade barriers, promote the sustainable and healthy development of China’s photovoltaic (PV) industry, and facilitate cooperation between China and Southeast Asian countries in the field of clean energy.
The remainder of the paper is organized as follows. Section 2 provides a review of the literature and hypothesis; while Section 3 presents the data and develops the methodological approach. Section 4 presents the empirical findings. Section 5 concludes the study and provides policy recommendations.
2 Literature review and hypotheses
2.1 Literature review
By reviewing a series of literature, several main methods for quantifying green trade barriers are revealed, including tariff equivalency approaches, the number of TBT (Technical Barriers to Trade) and SPS (Sanitary and Phytosanitary) notifications, frequency index and coverage ratio. Gao and Bao utilized the number of TBT to measure GBTs, He found that stringent GBTs in importing countries have a positive effect on exports, with this effect being more pronounced when the importing country is a developing nation. Bao and Qiu (2010) discovered that while using the frequency index to measure TBT, indicating they are trade restrictive, the negative effects of TBT aren’t significant when assessed using the coverage ratio. Guoda and Qianjiang, (2007) employed three dummy variables to measure the implementation of relevant regulations and assess green barriers. His findings reveal that pesticide residue policies have a negative impact on trade flows.
The research on the impact of green trade barriers on exports has primarily been divided into two categories: facilitative effects and inhibitory effects. Scholars hold the view that GBTs hinder trade and may cause some negative effects. Su (2021) took China’s Hebei province as an example to discuss the impact of GBTs on agricultural exports and found that the implementation of green trade barriers will lessen the export quantity of farming products and raise the sell abroad price. Mao and Lu (2024) pointed out that GBTs constrain the development of trade, thus explore the internal characteristics of commodities and deciding optimally on intended export regions. By using panel data in 84 Russian regions and 204 countries from 2013 to 2020, Sokolova et al. (2024) suggested environmental agenda presents a significant challenge for some regional exporters in Russia, primarily due to the absence of domestic environmental regulations and the particular characteristics of both the commodity composition and the geographic distribution of their exports. According to Zhu et al. (2024), CBAM had an inevitable impact on China’s exports. His findings revealed that the implementation of EU carbon tariffs not only decreases the export value of Chinese goods but also results in a decline in EU exports. However, more and more research think that the green barrier is beneficial to increase the trade scale. Li and Zhu (2020) mentioned that green barriers have a positive effect on the agricultural product export in China. Gao and Bao also utilized gravity model to examine China’s exports from 1996 to 2019, TBT (Technical Barriers to Trade) measures not only contribute to the growth of China’s exports but also significantly enhance the export of China’s electromechanical products and chemicals. de Melo and Solleder (2020) suggested that GBTs can increase the export of green products.
There are some researches focus on the impact of GBTs on PV products. Fliess and Kim (2008) investigate 136 companies in 10 countries and found that when some small companies will receive more certification requirements and testing requirements in exporting process. Zhu et al. (2021) examined the impact of both internal and external forces on China’s solar PV export during 2007–2016, and found that trade protectionism and some non-tariff barriers inhibit China’s PV exports. Grossmann stated that strict environmental regulations will affect the installation volumes in HVMs considering the trade conflicts in western countries. Hui and Yuansong (2021) stated that in the PV industry, the forms of green barriers are diverse and complex. The European Union’s REACH regulation and RoHS directive impose stringent restrictions on the use of specific chemicals in photovoltaic modules (Babayigit et al., 2018), requiring manufacturers to improve materials and production processes to meet environmental standards. Similarly, the UL certification in the United States sets high standards for the safety performance of photovoltaic products (McNutt et al., 2018), compelling manufacturers to undergo additional testing and certification processes to ensure compliance with market requirements. Tang et al. (2024) employed the LCA method to assess the carbon footprints of China’s photovoltaic (PV) panels across different decarbonization scenarios and found that green trade barriers, especially from developed nations such as the EU, affecting the transition towards sustainability and low carbon emissions and pose significant challenges for China’s renewable energy sector.
At present, most studies prefer to use trade gravity models to achieve a quantitative analysis of the impact of exports. Among these, the frequency of TBT submitted to the WTO is the most widely used method for quantifying green trade barriers. This paper will also adopt this approach to further explore the effects of green trade barriers. Although the study of green trade barriers and international trade scales has been a popular topic among scholars, limitations still exist. First, research has predominantly focused on developed countries, Belt and Road Initiative (BRI) countries or OECD countries, with less attention given to developing countries with relatively lower economic levels. Additionally, most previous studies have concentrated on agricultural and textile products, with inadequate research on high-tech products such as photovoltaic products and integrated circuits.
2.2 Hypotheses
Green trade barriers, including TBT, SPS and other environmental protection regulations, have become an integral factor in international trade. By examine export products from 199 countries, Gao and Bao suggest that TBTs can actually promote trade, particularly in developing countries. This indicates that producing goods in compliance with higher environmental standards can provide exporters with a competitive edge in markets with stringent environmental regulations and numerous green trade barriers, which can appeal to environmentally conscious consumers and businesses, and exporters can avoid trade restrictions and stimulate trade growth. Hence, this paper proposes the following hypothesis.
H1: Green trade barriers will have a positive impact on the trade scale of China’s photovoltaic products exports to ASEAN.
Exchange rates play a crucial role in international trade by affecting the relative cost of goods and services across countries. A higher exchange rate generally means that a country’s currency is stronger compared to others, making its imports cheaper and its exports relatively more expensive (Auboin and Ruta, 2013). However, in the context of green trade barriers, higher exchange rates can amplify the positive impact on the trade scale of environmentally compliant products. Biswas and Roy (2016) indicate that consumers are willing to pay a higher price for goods that meet stringent environmental standards. In countries with higher exchange rates, the increased purchasing power allows consumers and businesses to afford higher-priced, high-quality, and environmentally friendly products. For China’s photovoltaic (PV) products, compliance with green trade barriers enhances their competitiveness and marketability in ASEAN countries with higher exchange rates. The strong currency in these countries makes imported PV products more attractive, despite their higher prices, due to their compliance with environmental standards. This creates a favorable market environment for China’s PV products, leading to a more significant positive impact on their trade scale. Therefore, this paper proposes the following hypothesis.
H2: In countries with higher exchange rates, green trade barrier has a more significant positive impact on the trade scale of China’s photovoltaic products exports to ASEAN.
The role of language in international trade is a crucial yet often underappreciated factor. Language barriers can pose significant challenges to trade, including difficulties in communication, contract negotiations, and compliance with regulations (Alam and Mostafiz, 2022). Melitz (2008) proved that countries share the same official language, and these barriers are minimized, facilitating smoother trade interactions. However, in such scenarios, the competitive edge provided by compliance with green trade barriers may be less pronounced, as market entry is already relatively easy, leading to a potential negative impact on the export volume of Chinese photovoltaic (PV) products. On the other hand, in countries with different official languages, the inherent language barriers make market entry more challenging. In these contexts, compliance with stringent green trade barriers can serve as a significant differentiator, enhancing the perceived value and quality of Chinese PV products. This compliance can help overcome the initial scepticism and build trust with importers, leading to a positive impact on export volumes. As a result, this paper proposes the following hypotheses.
H3a: In countries with different official languages, green trade barriers have a positive impact on the trade scale of China’s photovoltaic products exports to ASEAN.
H3b: In countries that use the same official language, green trade barriers have a negative impact on the trade scale of China’s photovoltaic products exports to ASEAN.
The use of renewable energy can reduce pollution and provide people with better living conditions. In countries with high renewable energy consumption, there is often an established base of photovoltaic (PV) product usage, and the demand for these products may already be relatively saturated. In such cases, the change in green trade barriers may have limited impact on the import of PV products. Additionally, these countries may have domestic photovoltaic manufacturing factories, resulting in lower demand for imports. Consequently, a reduction in green trade barriers might not significantly alter the demand for Chinese photovoltaic products in these markets. Therefore, the following hypothesis is proposed.
H4: In countries with higher renewable energy consumption, the positive effect of green trade barriers on the trade scale of China’s photovoltaic products exported to ASEAN will be lessened.
Carbon dioxide emissions serve as a key indicator of a country’s environmental impact (Zaman and Abd-el Moemen, 2017), and its commitment to reducing greenhouse gas emissions. Demiral et al. (2021) suggested that stricter environmental policies may not reduce CO₂ emissions and could even exacerbate them. When the carbon emissions of a country or region rise, human’s wellbeing will be adversely affected (Can et al., 2022), and the negative impact of green trade barriers will outweigh the positive impact. In order to ease the environmental pressure and ensure that people live in a low-pollution environment, these high-carbon emission countries may appropriately relax environmental regulations, reduce green trade barriers, and encourage the import of a large number of photovoltaic products in order to improve the carbon emissions brought by fossil fuel. Therefore, the following hypothesis is proposed.
H5: In countries with higher per capita carbon dioxide emissions, the negative effect of green trade barriers on the trade scale of China’s photovoltaic products exported to ASEAN will be weakened.
3 Methodology
The gravity model has long been used to analyze and predict bilateral trade flows. By linking bilateral trade flows with factors such as gross domestic product (GDP), distance, and other factors influencing trade resistance, the gravity model has been widely applied to estimate international trade flows. Specifically, to examine the impact of green trade barriers on a country’s exports, this study constructs the following benchmark regression model based on the gravity model:
In this model, the subscripts i and t represent the product export destination and export time (year) respectively. The dependent variable Tradevalueit is the export value (in logarithm), and the core explanatory variable is TBTit. The control variables include GDP_growthit, POP_growthit, ACEit, WGIit. ε denotes the error term. By employing fixed effects, this study further mitigates the endogeneity problem that may arise from potential omitted variables. Additionally, this study examines the impact of variables such as the official language of the importing country on export value. The definitions and sources of the main variables involved in the regression are shown in Table 1.
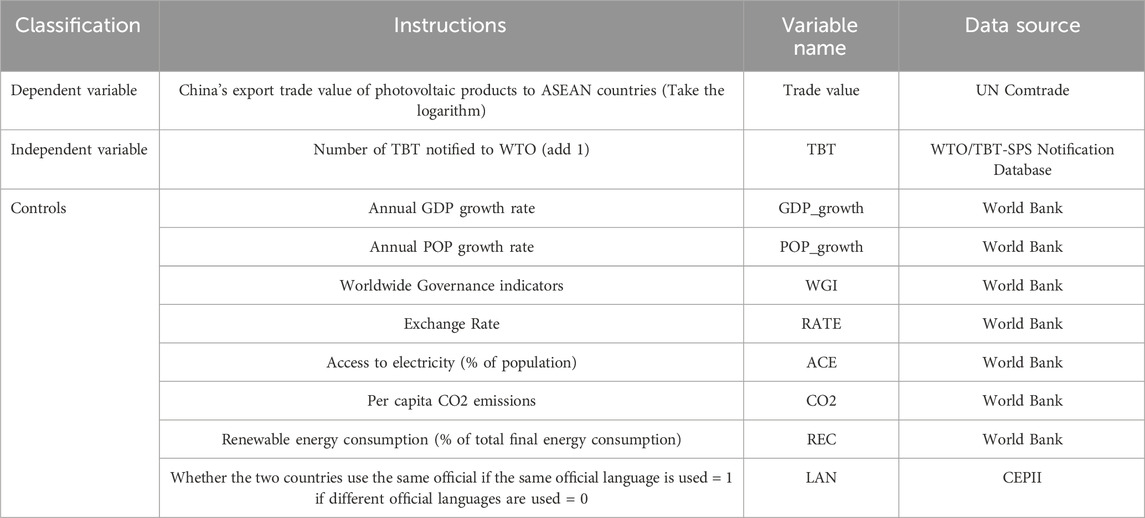
Table 1. Variables and data source.
Trade value: this study examines the trade volume of Chinese photovoltaic products exported to ASEAN countries. By analyzing this variable, we can gain insights into the changes in sales volume of Chinese photovoltaic products in these markets.
TBT: the number of Technical Barriers to Trade (TBT) notifications submitted to the World Trade Organization (WTO). TBTs generally refer to the technical standards and compliance requirements established by countries to protect safety, health, and the environment. TBTs can reflect the level of strictness in technical requirements imposed by trade partner countries on imported products, and they are used to assess the impact of these barriers on the export of Chinese photovoltaic products.
GDP_growth: Annual Gross Domestic Product (GDP) growth rate, representing a country’s economic growth rate. Countries with high GDP growth rates may have higher demand for photovoltaic products, as economic growth is typically accompanied by increased energy demand.
POP_growth: Annual population growth rate, representing the rate of population growth in a country. Countries with high population growth rates may have greater energy demand, including for photovoltaic products.
WGI: Worldwide Governance Indicators, measuring the quality of governance in aspects such as government efficiency, legal systems, and corruption control. Countries with higher levels of governance typically have better business environments and may be more favorable towards importing photovoltaic products.
ACE: Access to electricity, measuring the percentage of a population in a country that has reliable access to power. This indicator reflects the development level of a nation’s infrastructure and plays a crucial role in supporting human daily life. In countries with low access percentages, a significant portion of the population lacks a reliable electricity supply. Thus, these nations often seek to expand their energy infrastructure, and photovoltaic products provide a cost-effective renewable solution, which will drive their demands for photovoltaic imports.
RATE: Exchange rate between the currencies of two countries. Exchange rate fluctuations directly impact trade costs and revenues. For example, if the Chinese yuan appreciates against the currency of a Southeast Asian country, the price of Chinese photovoltaic products in that country will be relatively higher, potentially reducing exports. Conversely, if the yuan depreciates, Chinese photovoltaic products will be more competitively priced in that country, potentially increasing exports.
LAN - Whether the two countries use the same official language. Communication is more convenient between countries that share the same language, potentially making it easier to establish trade relationships.
CO2: The annual per capita carbon dioxide emissions, indicating the level of environmental impact and the urgency of adopting cleaner energy solutions. Countries with higher per capita CO2 emissions may face greater pressure to reduce their carbon footprint, increasing their demand for renewable energy products like PV systems.
RNE: Renewable energy consumption is the share of energy derived from renewable sources in a country’s total final energy consumption. Countries with higher REC percentages typically invest more in renewable technologies, including massive demands for photovoltaic systems, to meet their energy needs.
This paper examines the impact of green trade barriers on the export volume of China’s photovoltaic products to ASEAN countries from 2010 to 2021. To enhance the normality and variance stability of the data, a logarithmic transformation was applied, making the regression analysis results more reliable and interpretable. Additionally, to address the issue of some countries having zero TBT notifications in certain years, a +1 adjustment was made to the TBT notification counts. This adjustment ensures data validity and prevents negative infinity in the logarithmic calculations.
4 Empirical analysis
4.1 Benchmark regression
To explore the impact of green trade barriers on the export trade volume of Chinese photovoltaic products, this study employs a fixed effects model and progressively adds control variables for regression analysis (Table 2). In model (1), we only estimate the trade volume (Trade value) and the number of TBT notifications (TBT) that are regressed. Model (2) includes the GDP growth rate (GDP_growth). Model (3) adds the population growth rate (POP_growth). Model (4) includes World Governance Index (WGI). Finally, in model (5), access to electricity (ACE) was added. The results show that in all models, the coefficient for the number of TBT notifications is significantly positive. This indicates that green trade barriers significantly promote the export of Chinese photovoltaic products. This effect may be due to higher green trade barrier standards prompting enterprises to improve product quality and technological levels, thereby enhancing their competitiveness in the international market.
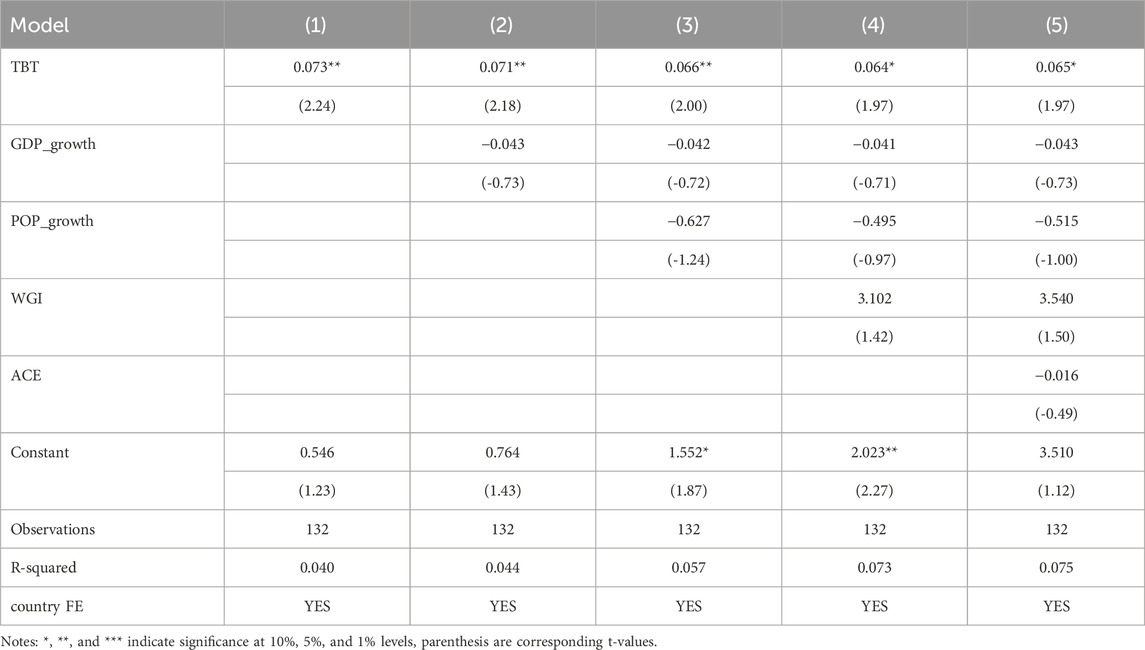
Table 2. Benchmark regression analysis.
4.2 Robustness test
To conduct robustness tests, this study utilized two methods to exclude specific samples, thereby verifying the reliability of the benchmark regression results. In Table 3, model (6) excluded the year 2021, which was most severely affected by the pandemic, while model (7) excluded the developed country, Singapore.
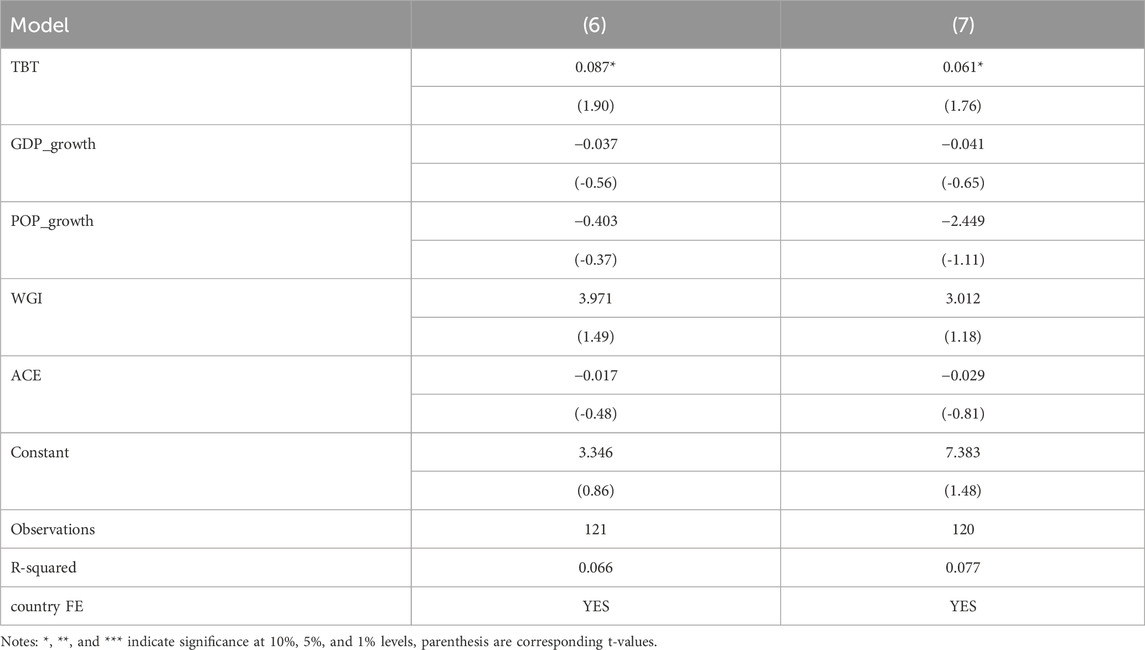
Table 3. Robustness test.
In model (6), the TBT coefficient remained significantly positive after excluding the year 2021. This suggests that the pandemic-induced noise in the data partially obscured the true effect of TBT, and the model’s robustness improved after removing the abnormal year. Following the exclusion of 2021, the model’s R-squared was 0.066, closely aligning with the benchmark regression results, further validating TBT’s role in promoting the export of Chinese photovoltaic products.
The results of model (7) revealed that after excluding Singapore, the TBT coefficient remained significantly positive, indicating that the positive impact of the number of TBT notifications on the trade volume of photovoltaic products was still significant. This further substantiates that higher TBT standards can significantly boost the export of Chinese photovoltaic products, with results remaining robust even after excluding samples from highly developed economies. Furthermore, excluding Singapore increased the model’s R-squared to 0.077, indicating an enhanced explanatory power of the independent variables over the dependent variable.
In summary, the robustness test results demonstrate that, whether excluding the developed country Singapore or the year severely affected by the pandemic, the positive impact of green trade barriers on the trade volume of photovoltaic products remains significant. This finding further strengthens the reliability and generalizability of this study’s conclusions.
4.3 Heterogeneity analysis
Through heterogeneity analysis, this paper further investigates the impact of green trade barriers on the export trade volume of Chinese photovoltaic products to Southeast Asia (Table 4). Specifically, models (8) and (9) present the regression results for groups with exchange rates (RATE) above and below the mean, respectively. Model (10) analyzes countries using different official languages, while model (11) focuses on countries using the same official language.
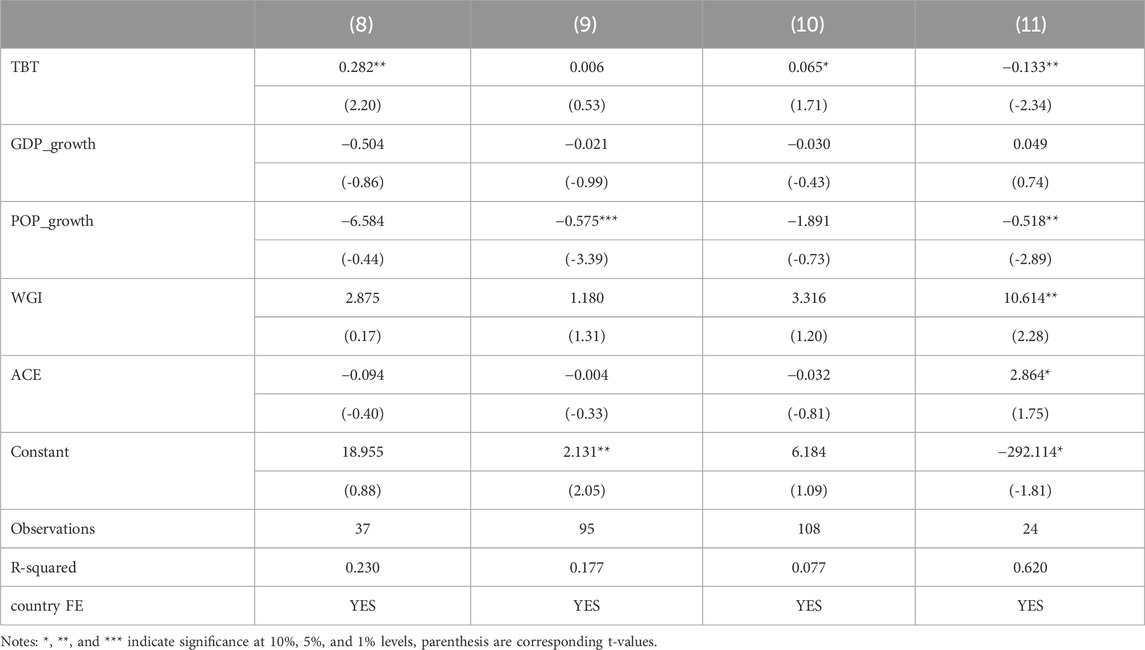
Table 4. Heterogeneity analysis.
In model (8), the results for the group with exchange rates above the mean indicate that the coefficient for the number of TBT notifications (TBT) is 0.282, significant at the 5% level. This suggests that in countries with higher exchange rates, an increased number of TBT notifications positively impacts the export trade volume of photovoltaic products. This effect may be attributed to higher exchange rates lowering import costs, thereby enhancing the market competitiveness of high-standard photovoltaic products. Conversely, in model (9), where exchange rates are below the mean, TBT is not significant, indicating that in countries with lower exchange rates, green trade barriers do not significantly influence the export trade volume of photovoltaic products.
In model (10), among countries using different official languages, the coefficient for the number of TBT notifications is 0.065, significant at the 10% level. This suggests that green trade barriers positively affect the export trade volume of photovoltaic products between countries with different official languages. This could be due to language differences creating market entry barriers, making high-standard products more attractive. In contrast, in model (11), among countries using the same official language, TBT is significantly negative. This indicates that green trade barriers negatively impact the export trade volume of photovoltaic products between countries with the same official language. This may result from easier market access between countries with the same language, where TBT becomes an obstacle.
Overall, the heterogeneity analysis results demonstrate that the impact of green trade barriers on the export trade volume of Chinese photovoltaic products varies significantly depending on exchange rate levels and language environments. In countries with higher exchange rates and different official languages, green trade barriers positively impact photovoltaic product exports. Conversely, in countries with lower exchange rates and the same official language, the impact of green trade barriers is either insignificant or negative. These findings suggest that policymakers should consider factors such as exchange rate levels and language environments when formulating TBT standards to better promote the competitiveness and export growth of Chinese photovoltaic products in the international market.
4.4 Moderating effect
This section examines the moderating effects of green trade barriers on the export trade value of Chinese photovoltaic products by introducing two moderating variables: per capita CO2 emissions and renewable energy consumption (Table 5).
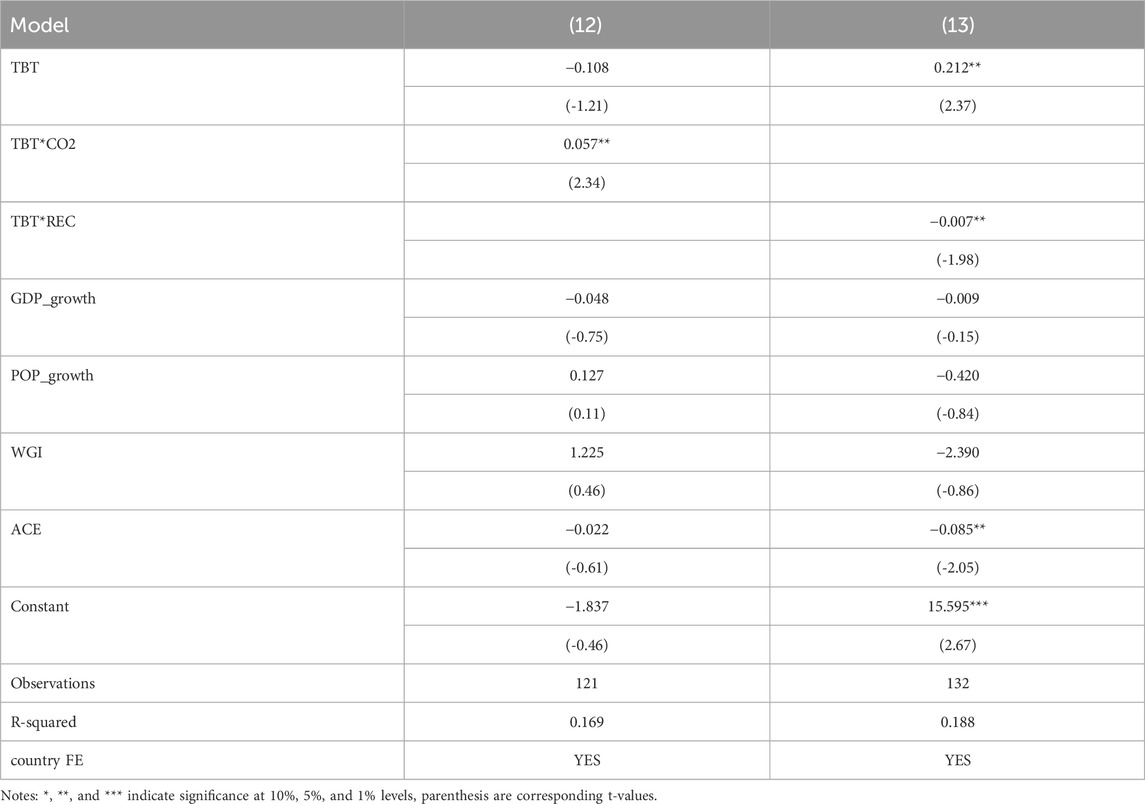
Table 5. Moderating effect.
In model (12), the interaction term between TBT and CO2 emissions (c.TBT#c.co2) is included in the regression model. The results show that the interaction term is significantly positive, suggesting that as CO2 emissions increase, the negative impact of the number of TBT notifications on the trade value of photovoltaic products becomes weak. In other words, higher CO2 emissions are associated with a reduced detrimental effect of TBT on trade volume.
In model (13), the direct effect of TBT is positive and significant (p < 0.05), implying that TBT has a favorable influence on the trade value. The results of the interaction term between TBT and REC shows that the coefficient for the interaction term is positive and significant at the 10% level. This implies that the positive effect of TBT on trade volume decreases as renewable energy consumption increases. Therefore, higher renewable energy consumption reduces the beneficial impact of TBT on trade volume. Therefore, countries who rely more on renewable energy consumption, may already equipped with massive infrastructure that can produce clean energy, reduce the country’s demand for photovoltaic products.
5 Conclusion and outlook
In the context of the global push towards a green economy, this study investigates the impact of green trade barriers on the export trade volume of Chinese photovoltaic products to Southeast Asian countries. Based on benchmark regression analysis, the results indicate a significant positive correlation between green trade barriers and the trade volume of photovoltaic products, suggesting that green trade barriers have facilitated the export of Chinese photovoltaic products to ASEAN countries. This conclusion remains robust even after controlling for various economic variables and fixed effects and is further validated through multiple robustness tests. Specifically, the positive impact of green trade barriers on the trade volume of photovoltaic products persists even after excluding data from years significantly affected by the pandemic and the only developed country, Singapore. Moreover, heterogeneity analysis reveals that the impact of green trade barriers varies with exchange rate levels and language environments. Specifically, green trade barriers have a positive impact on the export of photovoltaic products in countries with higher exchange rates and different official languages, whereas their impact is insignificant or negative in countries with lower exchange rates and the same official language. Additionally, the moderation effect analysis shows that GBTs are less harmful to PV trade when CO2 emissions are higher., and the increased renewable energy consumption mitigates the positive effect of GBTs on PV trade. Policymakers should consider exchange rate levels, language environments, CO2 emissions and renewable energy consumption when formulating green trade barrier standards to better support the competitiveness and export growth of Chinese photovoltaic products in the international market.
5.1 Aligning with international standards
China should optimize its TBT (Technical Barriers to Trade) policies for photovoltaic products by enhancing product quality and technical standards to ensure compliance with international standards such as those established by the International Electrotechnical Commission (IEC) and the International Organization for Standardization (ISO). For instance, LONGi Green Energy Technology has achieved certification under the IEC 61215 standard, which covers design, materials, processes, and product performance requirements for photovoltaic modules. This certification has significantly boosted LONGi’s competitiveness in the international market, facilitating successful entry into multiple Southeast Asian countries, including Vietnam and Thailand.
Furthermore, China should engage in extensive bilateral and multilateral cooperation with South and Southeast Asian countries to promote mutual recognition of technical standards and certification systems through dialogue and consultation, thereby reducing trade frictions caused by technical trade barriers and promoting the export of photovoltaic products. For example, China and Malaysia have signed a bilateral Mutual Recognition Agreement (MRA), ensuring that the certification results of Chinese photovoltaic products are recognized in Malaysia. This agreement has allowed Trina Solar to quickly enter the Malaysian market without the need for redundant certification, significantly saving time and costs.
Additionally, China should establish testing and certification bodies domestically that comply with international standards, ensuring these institutions obtain internationally recognized accreditations. For example, Tongwei Solar has established an advanced quality control laboratory in China and obtained ISO/IEC 17025 international laboratory certification. This certification center provides high-standard testing and certification services for both domestic and international photovoltaic enterprises, helping companies obtain internationally recognized quality certifications before export, thereby enhancing their competitiveness in the global market.
5.2 Providing differentiated policy support and technical assistance
Providing differentiated policy support and technical assistance is a key strategy. Different countries have varying levels of economic development, market demands, and technological capabilities, necessitating tailored policies and assistance measures. First, China should formulate differentiated policy support based on the economic and market conditions of South and Southeast Asian countries. For countries with faster economic growth and higher market demand, more competitive financing schemes and export credit guarantees can be offered to reduce the financial risks associated with procuring Chinese photovoltaic products. Additionally, for countries with significant market potential, government-to-government cooperation projects or joint investments can be utilized to help these countries develop photovoltaic power projects, thereby expanding the market share of Chinese photovoltaic products.
Second, in terms of technical assistance, China can establish technical training centers in the South and Southeast Asian regions to provide systematic technical training and support locally. These training centers can teach skills related to the installation, maintenance, and performance optimization of photovoltaic products, helping local technicians enhance their professional capabilities and ensuring the efficient operation of photovoltaic systems. Technical training can not only increase trust and reliance on Chinese photovoltaic products in South and Southeast Asian countries but also help cultivate a professional technical workforce in these countries, promoting the long-term development of the photovoltaic industry.
Besides, China can offer technology transfer and capacity-building support to help South and Southeast Asian countries improve their photovoltaic technology levels. This can be achieved through collaborative R&D projects and technical exchange activities, sharing China’s advanced photovoltaic technologies and experiences with these countries, enhancing their technical capabilities and innovation capacities in the photovoltaic industry chain. This approach not only helps improve the quality and competitiveness of photovoltaic products in South and Southeast Asian countries but also fosters deep cooperation between China and these countries in the photovoltaic sector, collectively addressing global energy challenges.
5.3 Strengthening international governance and cooperation
Strengthening international governance and cooperation is crucial for promoting the export of Chinese photovoltaic products to South and Southeast Asian countries. By improving governance levels and transparency, and establishing a stable and predictable trade environment, countries can jointly promote the development of the green economy. First, China should actively participate in the construction of the international governance system and enhance cooperation with international organizations. As a key member of the World Trade Organization (WTO) and other international organizations, China can actively participate in the formulation and improvement of global trade rules through these platforms, especially those related to green trade rules and standards. By promoting more transparent and fair international trade rules, China can reduce the uncertainties caused by technical trade barriers (TBT), creating more favorable conditions for Chinese photovoltaic products to enter South and Southeast Asian markets.
At the same time, China should strengthen bilateral and multilateral cooperation with South and Southeast Asian countries to promote the mutual recognition of technical standards and certification systems. By signing bilateral or multilateral agreements to unify and mutually recognize technical standards, trade frictions caused by inconsistent standards can be reduced. For example, China can jointly formulate technical standards for photovoltaic products with South and Southeast Asian countries and establish cooperative certification systems to ensure that the products and technical certifications of both parties are recognized in each other’s markets. This approach will help simplify the export process of photovoltaic products, reduce compliance costs for enterprises, and improve market access efficiency.
Moreover, China should enhance cooperation with South and Southeast Asian countries in the green energy sector to jointly advance the implementation of green projects. Through government-to-government cooperation projects, China can support South and Southeast Asian countries in developing photovoltaic power projects, providing technical support and financing schemes. This strategy not only promotes the export of Chinese photovoltaic products but also helps South and Southeast Asian countries improve their renewable energy utilization, achieving energy structure optimization and environmental protection goals.
Data availability statement
The original contributions presented in the study are included in the article/Supplementary Material, further inquiries can be directed to the corresponding author.
Author contributions
SC: Conceptualization, Data curation, Formal Analysis, Investigation, Methodology, Software, Visualization, Writing–original draft, Writing–review and editing.
Funding
The author(s) declare that no financial support was received for the research, authorship, and/or publication of this article.
Conflict of interest
The author declares that the research was conducted in the absence of any commercial or financial relationships that could be construed as a potential conflict of interest.
Publisher’s note
All claims expressed in this article are solely those of the authors and do not necessarily represent those of their affiliated organizations, or those of the publisher, the editors and the reviewers. Any product that may be evaluated in this article, or claim that may be made by its manufacturer, is not guaranteed or endorsed by the publisher.
Supplementary material
The Supplementary Material for this article can be found online at: https://www.frontiersin.org/articles/10.3389/fenvs.2024.1459950/full#supplementary-material
References
Alam, Q., and Mostafiz, F. (2022). The role of languages in international trade disputes. PMIS Rev. 1 (1), 1–38. doi:10.56567/pmis.v1i1.1
Aleluia, J., Tharakan, P., Chikkatur, A. P., Shrimali, G., and Chen, X. (2022). Accelerating a clean energy transition in Southeast Asia: role of governments and public policy. Renew. Sustain. Energy Rev., 159, 112226. doi:10.1016/j.rser.2022.112226
Ansari, D., and Holz, F. (2020). Between stranded assets and green transformation: fossil-fuel-producing developing countries towards 2055. World Dev., 130, 104947. doi:10.1016/j.worlddev.2020.104947
Auboin, M., and Ruta, M. (2013). The relationship between exchange rates and international trade: a literature review. World Trade Rev. 12 (3), 577–605. doi:10.1017/s1474745613000025
Babayigit, A., Boyen, H.-G., and Conings, B. (2018). Environment versus sustainable energy: the case of lead halide perovskite-based solar cells. MRS Energy and Sustain. 5, 15. doi:10.1557/mre.2017.17
Bao, X., and Qiu, L. D. (2010). Do technical barriers to trade promote or restrict trade? Evidence from China. Asia-Pacific J. Account. and Econ. 17 (3), 253–278. doi:10.1080/16081625.2010.9720865
Biermann, F., Davies, O., and van der Grijp, N. (2009). Environmental policy integration and the architecture of global environmental governance. Int. Environ. Agreements Polit. Law Econ. 9 (4), 351–369. doi:10.1007/s10784-009-9111-0
Biswas, A., and Roy, M. (2016). A study of consumers’ willingness to pay for green products. J. Adv. Manag. Sci. 4 (3), 211–215. doi:10.12720/joams.4.3.211-215
Can, B., Ahmed, Z., Ahmad, M., and Can, M. (2022). Do renewable energy consumption and green trade openness matter for human well-being? Empirical evidence from European Union countries. Soc. Indic. Res. 164 (3), 1043–1059. doi:10.1007/s11205-022-02981-y
Chen, X., and Mauzerall, D. L. (2021). The expanding coal power fleet in Southeast Asia: implications for future CO2 emissions and electricity generation. Earth's Future 9 (12), e2021EF002257. doi:10.1029/2021EF002257
Chua, S. C., and Oh, T. H. (2010). Review on Malaysia's national energy developments: key policies, agencies, programmes and international involvements. Renew. Sustain. Energy Rev. 14 (9), 2916–2925. doi:10.1016/j.rser.2010.07.031
Clark, R., Zucker, N., and Urpelainen, J. (2020). The future of coal-fired power generation in Southeast Asia. Renew. Sustain. Energy Rev., 121, 109650. doi:10.1016/j.rser.2019.109650
de Melo, J., and Solleder, J.-M. (2020). Barriers to trade in environmental goods: how important they are and what should developing countries expect from their removal. World Dev., 130, 104910. doi:10.1016/j.worlddev.2020.104910
Demiral, M., Akça, E. E., and Tekin, I. (2021). Predictors of global carbon dioxide emissions: do stringent environmental policies matter? Environ. Dev. Sustain. 23 (12), 18337–18361. doi:10.1007/s10668-021-01444-7
Deng, H., and Huang, J. (2018). What should China Learn from the CPTPP environmental provisions? Asian J. WTO and Int'l Health L and Pol'y 13, 511.
Erdiwansyah, M., Mamat, R., Sani, M. S. M., Khoerunnisa, F., and Kadarohman, A. (2019a). Target and demand for renewable energy across 10 ASEAN countries by 2040. Electr. J., 32(10), 106670. doi:10.1016/j.tej.2019.106670
Erdiwansyah, E., Mamat, R., Sani, M. S. M., and Sudhakar, K. (2019b). Renewable energy in Southeast Asia: policies and recommendations. Sci. Total Environ., 670, 1095–1102. doi:10.1016/j.scitotenv.2019.03.273
Fliess, B., and Kim, J. A. (2008). Non–tariff barriers facing trade in selected environmental goods and associated services. J. World Trade 42, 535–562. Available at:. doi:10.54648/trad2008023
Gao, L., and Bao, X. (2019) The impact of technical trade barriers on domestic exports: theory and empirical evidence. Int. Trade Econ. Explor. 38 (11), 20–34. doi:10.13687/j.cnki.gjjmts.2022.11.004
Guoda, G., Niu, X., and Qianjiang, Z. (2007). An empirical analysis of the impact of technical barriers on international trade--taking tea trade between China and Japan as an example. Int. Trade Issues (06), 74–80. doi:10.13510/j.cnki.jit.2007.06.013
Hui, Z., and Yuansong, T. (2021). An empirical study of trade potential of China’s photovoltaic product export to countries along the Belt and Road. J. Tianjin Univ. Commer. 41 (02), 28–38. doi:10.15963/j.cnki.cn12-1401/f.2021.02.004
Jackson, M. M., Lewis, J. I., and Zhang, X. (2021). A green expansion: China's role in the global deployment and transfer of solar photovoltaic technology. Energy Sustain. Dev. 60, 90–101. doi:10.1016/j.esd.2020.12.006
Li, L., and Zhu, H. (2020). Analysis on trade effect of green barriers and on agricultural product export and maritime transport in China. J. Coast. Res. 115 (SI), 477–480. doi:10.2112/jcr-si115-132.1
Li, Q., Long, R., Chen, H., Chen, F., and Wang, J. (2020). Visualized analysis of global green buildings: development, barriers and future directions. J. Clean. Prod., 245, 118775. doi:10.1016/j.jclepro.2019.118775
Mao, Y., and Lu, S. (2024). Intelligent analysis of import and export in green trade barrier based on big data analysis. Ecol. Chem. Eng. S 31 (1), 117–126. doi:10.2478/eces-2024-0009
Maskus, K. E., and Wilson, J. S. (2001). Quantifying the impact of technical barriers to trade: can it be done? Ann Arbor, MI: University of Michigan Press.
McNutt, P., Sekulic, W. R., and Dreifuerst, G. (2018). “Solar/photovoltaic DC systems: basics and safety,” in 2018 IEEE IAS Electrical Safety Workshop (ESW), 1–9. doi:10.1109/esw41044.2018.9063869
Melitz, J. (2008). Language and foreign trade. Eur. Econ. Rev. 52 (4), 667–699. doi:10.1016/j.euroecorev.2007.05.002
Owusu, P. A., and Asumadu-Sarkodie, S. (2016). A review of renewable energy sources, sustainability issues and climate change mitigation. Cogent Eng. 3 (1), 1167990. doi:10.1080/23311916.2016.1167990
Rehman, W. U., Wang, H., Manj, R. Z. A., Luo, W., and Yang, J. (2021). When silicon materials meet natural sources: opportunities and challenges for low-cost lithium storage. Small 17 (9), 1904508. doi:10.1002/smll.201904508
Riva Sanseverino, E., Le Thi Thuy, H., Pham, M.-H., Di Silvestre, M. L., Nguyen Quang, N., and Favuzza, S. (2020). Review of potential and actual penetration of solar power in Vietnam. Energies 13 (10), 2529. Available at:. doi:10.3390/en13102529
Roberts, D. (1998). Preliminary assessment of the effects of the WTO agreement on sanitary and phytosanitary trade regulations. J. Int. Econ. Law 1 (3), 377–405. doi:10.1093/jiel/1.3.377
Sokolova, Y., Davidson, N., and Mariev, O. (2024). Global energy transition and foreign environmental regulations: impacts on Russian regions’ export volumes. J. Environ. Manag., 352, 120001. doi:10.1016/j.jenvman.2023.120001
Song, L., and Mi, J. (2016). Port infrastructure and regional economic growth in China: a Granger causality analysis. Marit. Policy and Manag. 43 (4), 456–468. doi:10.1080/03088839.2015.1134831
Su, Y. (2021). “Influence and countermeasures of green trade barriers on agricultural products export based on data analysis technology,” in Cyber security Intelligence and analytics cham. Editors Z. Xu, R. M. Parizi, O. Loyola-González, and X. Zhang
Tang, J., Xiao, X., Han, M., Shan, R., Gu, D., Hu, T., et al. (2024). China’s sustainable energy transition path to low-carbon renewable infrastructure manufacturing under green trade barriers. Sustainability 16 (8), 3387. Available at:. doi:10.3390/su16083387
Wu, S., and Yang, Z. (2018). Analysis of the case of port co-operation and integration in Liaoning (China). Res. Transp. Bus. and Manag., 26, 18–25. doi:10.1016/j.rtbm.2018.02.007
Yao, M., and Cai, X. (2019). An overview of the photovoltaic industry status and perspective in China. IEEE Access 7, 181051–181060. doi:10.1109/ACCESS.2019.2959309
Yeung, H. W.-c. (2013). “Regional development and the competitive dynamics of global production networks: an East Asian perspective,” in Globalizing regional development in east Asia (Routledge), 5–31.
Zaman, K., and Abd-el Moemen, M. (2017). Energy consumption, carbon dioxide emissions and economic development: evaluating alternative and plausible environmental hypothesis for sustainable growth. Renew. Sustain. Energy Rev. 74, 1119–1130. doi:10.1016/j.rser.2017.02.072
Zhao, Y. (2007). Overcoming green barriers: China's first five years into the WTO. J. World Trade 41, 535–558. doi:10.54648/trad2007020
Zhu, J., Zhao, Y., and Zheng, L. (2024). The impact of the EU carbon border adjustment mechanism on China’s exports to the EU. Energies 17 (2), 509. Available at:. doi:10.3390/en17020509
Keywords: green trade barriers, export trade, photovoltaic products, ASEAN, China
Citation: Chen S (2024) The impact of green trade barriers on China’s photovoltaic products exports to ASEAN. Front. Environ. Sci. 12:1459950. doi: 10.3389/fenvs.2024.1459950
Received: 05 July 2024; Accepted: 25 September 2024;
Published: 08 October 2024.
Edited by:
Muhlis Can, BETA Akademi-SSR Lab, TürkiyeReviewed by:
Ihsan Oluç, Mehmet Akif Ersoy University, TürkiyeMohd Aminul Karim, Independent Researcher, Bangladesh
Copyright © 2024 Chen. This is an open-access article distributed under the terms of the Creative Commons Attribution License (CC BY). The use, distribution or reproduction in other forums is permitted, provided the original author(s) and the copyright owner(s) are credited and that the original publication in this journal is cited, in accordance with accepted academic practice. No use, distribution or reproduction is permitted which does not comply with these terms.
*Correspondence: Shumin Chen, MjExMjMxMTA3NUBtYWlsMi5nZHV0LmVkdS5jbg==