 Sujing Ding1
 Qiang Sun
 Yan Guo
94% of researchers rate our articles as excellent or good
Learn more about the work of our research integrity team to safeguard the quality of each article we publish.
Find out more
ORIGINAL RESEARCH article
Front. Environ. Sci. , 13 January 2025
Sec. Environmental Informatics and Remote Sensing
Volume 12 - 2024 | https://doi.org/10.3389/fenvs.2024.1459669
The Qilian Mountains and Huangshui River Basin (HRB) represent significant ecological functional areas and carbon reservoirs within China. The estimation and prediction of vegetation net primary productivity (NPP) in this area is beneficial for the management of China’s terrestrial ecosystems. Nevertheless, the existing estimation methods for vegetation NPP at the local scale are characterised by considerable uncertainty and error, and have not accounted for the influence of multi-factor interactions. Accordingly, this study initially sought to quantify the vegetation NPP data within the HRB from 2000 to 2019 through the implementation of an improved Carnegie-Ames-Stanford Approach (CASA) model. Subsequently, it endeavoured to elucidate the spatiotemporal evolution patterns and influencing factors of vegetation NPP within the HRB over the years. Subsequently, the ConvGRU spatiotemporal prediction model was employed to investigate the prospective trajectory of vegetation NPP in the HRB. The findings revealed a notable upward trajectory in the annual variation of vegetation NPP in the HRB between 2000 and 2019. The majority of regions have demonstrated a notable increase in vegetation NPP, although a few areas have exhibited a decline. Furthermore, the correlation between vegetation NPP and PRE, TEMP, SR, and NDVI exhibits regional disparities. Furthermore, the spatial variation characteristics of vegetation NPP in the HRB in the future also demonstrate an overall increasing trend. Additionally, the vegetation NPP in the HRB exhibits significant spatial distribution characteristics, with evident trends of hot spot contraction or cold spot expansion. This study provides pivotal methods and theoretical support for the assessment of carbon sequestration status in the HRB of the Qilian Mountains and analogous regions.
The capacity of terrestrial ecosystems to sequester carbon has played a significant role in mitigating climate change (Sha et al., 2022). It is considered an important cornerstone for achieving carbon neutrality goals in China and globally. The net primary productivity (NPP) of vegetation is a crucial factor in determining the carbon sink of terrestrial ecosystems. It characterises the carbon sequestration capacity of vegetation in nature and reflects the carbon balance capacity of ecosystems (Song et al., 2021; Zhi et al., 2024). Consequently, it is a significant indicator of regional climate change. The spatiotemporal evolution of vegetation NPP is of great significance in comprehending the driving mechanisms of vegetation change, predicting future carbon sink trends in terrestrial ecosystems, and managing the ecological environment (Lyu et al., 2023). A number of factors exert varying degrees of influence on regional vegetation NPP (Wei et al., 2022; Xi et al., 2023). It is essential to accurately estimate the spatiotemporal changes in regional vegetation NPP under a range of scenarios and quantify their response relationships with various factors.
The methods used to estimate vegetation NPP have evolved over time, moving from traditional field measurements to model simulation estimation and from single measured data to multi-source fusion data as technology has progressed (Liu et al., 2022). In the present era, ecosystem process models driven by remote sensing data have become the principal methodology for estimating vegetation NPP (He et al., 2021). The Carnegie-Ames-Stanford Approach (CASA) model is a popular choice due to its high computational accuracy, concise structure, and ease of obtaining data and parameters (Shi et al., 2023; Bai et al., 2023). This model incorporates a comprehensive account of the light energy use efficiency of environmental conditions and vegetation characteristics, thereby facilitating a more precise estimation of vegetation NPP. Some researchers have employed the CASA model and its improved variants to quantify and assess NPP in disparate regions, including the Yangtze River Basin and plain areas. These studies provided important references for understanding ecosystem functions and the sustainability of agricultural production (Yang et al., 2021; Wan et al., 2022; Zheng et al., 2020). Although the CASA model is effective at estimating larger scales, there are still uncertainties and systematic errors in its results for certain small-scale ecological regions. These errors may be attributed to the imprecise resolution of data, the selection of inappropriate model parameters, and the choice of inappropriate boundary and initial conditions (Su et al., 2022). Moreover, research has indicated that the primary source of uncertainty in ecosystem modelling is the value of maximum light energy utilisation efficiency (LUEmax). LUEmax is influenced by the type of vegetation present and exhibits pronounced seasonal fluctuations (Zhao et al., 2021). To enhance the accuracy of estimations, the constant LUEmax has been adjusted to a dynamic value that varies according to both space and season (Gan et al., 2021). It is of significant importance to predict future changes in vegetation NPP in the region, as this will inform ecological protection and governance measures.
The Huangshui River Basin (HRB) in the Qilian Mountains represents a vital ecological protection barrier and a primary water resource conservation area within the Hexi Corridor region of China (Gao et al., 2021; Li et al., 2024). This region plays a significant role in the economy, social development, and ecological security of Qinghai Province (Bi et al., 2023; Liu et al., 2023), including the Qinghai–Tibet Plateau and the northwest. However, the ecological environment in the HRB has been significantly degraded in recent years, which has the potential to negatively impact vegetation growth and ecosystem health. The majority of research on vegetation NPP in the HRB has focused on the spatiotemporal variation characteristics of past vegetation, based on existing data (Li et al., 2021). These studies have not been subjected to examination with regard to the effects of multiple factor interactions, and they exhibit a number of uncertain nonlinear characteristics (Dong et al., 2021).
This study employs an improved CASA model, drawing upon a multitude of data sources, to investigate the spatiotemporal alterations in the vegetation NPP over time within the HRB. Subsequently, the relationship between these changes and various factors is analysed, and future trends in vegetation NPP in the region are predicted. Subsequently, the future trends of vegetation NPP changes in the HRB are predicted in order to provide early warnings for future vegetation growth hazards. The research objectives are as follows: The study aims to simulate and estimate the vegetation NPP in the HRB from 2000 to 2019, predict the future trends of vegetation NPP in the HRB, and explore the spatiotemporal variation patterns of vegetation NPP in the HRB and analyse its response to different factors. The findings of this study offer theoretical and empirical support for the assessment of the carbon sink status in the HRB of the Qilian Mountains.
The HRB covers an area of approximately 32,900 km2 (102°57′-105°40′E, 35°30′-38°22′N), with the majority of the river’s course situated in the southern and northwestern regions of the Qilian Mountains in China. The Huangshui River is an important tributary in the upper reaches of the Yellow River (Figure 1). The Huangshui River and its largest tributary, the Datong River, flow through two valleys in the north and south, exhibiting geomorphic features such as valley terraces and floodplains (Lv et al., 2021). The terrain of the HRB exhibits a north-south gradient, with the highest elevations in the northwest and the lowest in the southeast. This is accompanied by a complex topography comprising high mountains and loess hills. The HRB experiences a typical temperate continental climate, characterised by abundant sunlight and significant temperature differences between day and night. The precipitation in the basin gradually decreases from the southeast to the northwest due to the uplift of the Qinghai–Tibet Plateau and the influence of the northwest monsoon. Consequently, the wind strength also increases in the same direction. The climate of the HRB is characterised by long, cold winters and short, cool summers. The HRB is predominantly comprised of temperate grasslands and deserts, with a plethora of plant species that are resilient to drought and cold (Hua et al., 2023). The vertical distribution of vegetation in the watershed is clearly discernible, with grassland, desert grassland, and desert occurring in a vertical sequence from the top to the bottom. The HRB’s geographical location and severe climatic conditions result in low vegetation coverage, a fragile ecosystem, and a need for long-term monitoring and prediction of early warnings.
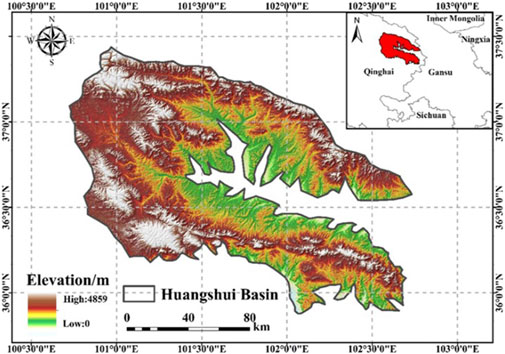
Figure 1. Overview of the research area.
In this study, normalized difference vegetation index (NDVI) data were used to estimate vegetation NPP data and analyze their response using the CASA model. The NDVI provides vegetation information and controls the photosynthesis rate in CASA estimation, thereby improving the simulation accuracy of CASA models (Xu et al., 2024). The NDVI data for the HRB from 2000 to 2019 were obtained from the LAADS database. The data were collected at 16-day intervals and had a spatial resolution of 250 m. At the same time, quality assurance (QA) information was provided to ensure the reliability of the data. The MODIS reprojection tool (MRT) was employed for data preprocessing. To reduce the effects of clouds on the data, we used maximum value composites (MVCs) to synthesize and trim the processed data into NDVI annual data. To reduce the effects of soil background and improve the information in the NDVI data, we excluded areas with NDVI values less than 0 throughout the study period and extracted feature attribute values (Akanbi et al., 2024).
Furthermore, a consistency analysis was conducted between the MODIS NPP data and the CASA NPP estimation results. The MODIS NPP data originate from the annual NPP dataset in the MOD17A3H version products. The dataset has a temporal resolution of 1 year and a spatial resolution of 500 m, and was processed through calibration and cloud removal. The dataset was then concatenated and cropped, with outliers removed, to obtain the NPP accuracy validation dataset from 2000 to 2019.
The environmental factors of temperature and precipitation exert a considerable influence on ecosystems, with a notable impact on the carbon cycle and energy flow of terrestrial ecosystems (Li et al., 2021; Ma et al., 2024). To achieve a more accurate simulation of these processes, we combined temperature (TEMP) and precipitation (PRE) data and conducted comprehensive research using the CASA model. The scarcity of data in the HRB has resulted in the introduction of significant interpolation errors. To enhance the precision of the simulation, we selected monthly average temperature and precipitation data from 110 out of 120 meteorological stations in the northwest region. The initial step is to preprocess any missing or abnormal values. Data with missing measurements for a period exceeding 6 months were excluded. In the case of data with less than 6 months of measurement, linear interpolation was conducted using ArcGIS Pro software. Finally, data with precipitation below 0 mm were replaced with the mean of the previous and subsequent months. Subsequently, the temperature and precipitation data were interpolated and cropped using ANUSPLIN software, thereby obtaining monthly temperature and precipitation distribution maps of the HRB from 2000 to 2019. Following the combination of the bands, the temperature and precipitation datasets were obtained.
There is evidence to suggest that solar radiation (SR) plays a role in providing energy input in CASA estimation (Huang et al., 2023). In this study, solar radiation data is employed to facilitate the simulation of vegetation growth status and carbon storage. A total of 118 radiation station data sets were selected through screening and preprocessing, and the inverse distance weighting method was employed for interpolation. Furthermore, data preprocessing was implemented to generate a solar radiation dataset for the HRB. It is important to recognise that uncertainty is an intrinsic aspect of the process of spatial interpolation. However, in the subsequent NPP prediction work, this uncertainty was neither quantified nor subjected to a thorough analysis to determine its propagation.
In order to ascertain the maximum solar energy utilisation rate in the CASA model, land use type data were employed. The dataset provides 23 different types of land use (Xiao et al., 2023). To extract land cover type data from the HRB, a mask was used, and the data were converted into an Alberts projection. The spatial resolution was then adjusted to match the NDVI data. Additionally, a dataset of land cover types suitable for the CASA model in the HRB was obtained. Table 1 provides specific information on the data used in this study.
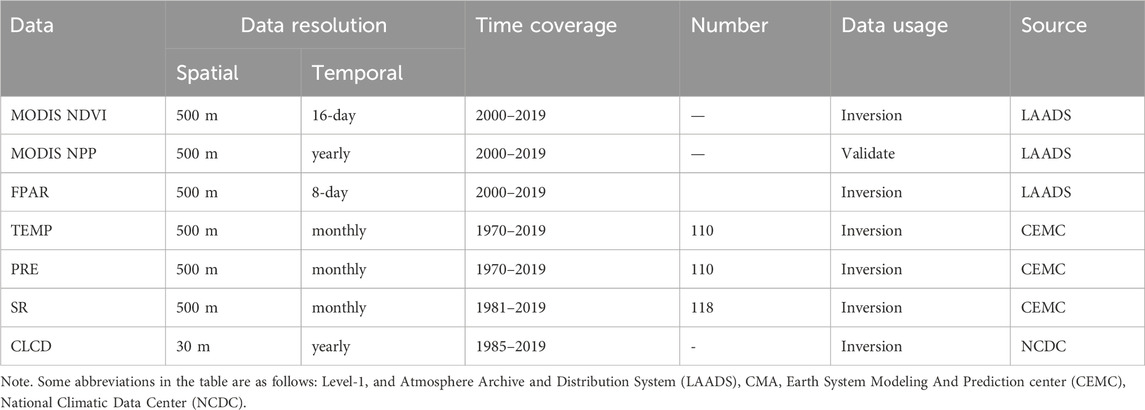
Table 1. Detailed information and sources of data used in this study.
In this study, multi-source data were employed to estimate vegetation NPP data using an improved CASA model, which revealed the spatiotemporal variation characteristics of vegetation NPP in the HRB from 2000 to 2019. Subsequently, the ConvGRU neural network prediction model was employed to investigate prospective trend alterations in vegetation NPP in the HRB. A quantitative analysis was conducted on the response mechanisms between vegetation NPP and TEMP, PRE, SR, and NDVI. Additionally, the spatial aggregation situation was explored. The technical roadmap is presented in Figure 2.

Figure 2. Overall technical roadmap.
The CASA model is a process-based remote sensing model that integrates ecosystem productivity with soil carbon and nitrogen fluxes (Yang et al., 2021). It can be used to estimate regional vegetation net productivity, taking into account the land cover changes caused by human activities. The model also improves the calculation of soil carbon cycling and total ecosystem nitrogen availability related to plant uptake demand (Chen et al., 2024). The present study employed the CASA model to estimate NPP in the HRB on a monthly basis, with the driving variables being NDVI, TEMP, PRE, and SR (Figure 3). The vegetation NPP is determined by two variables: the absorption of photosynthetic active radiation (APAR) and the conversion rate of light energy (LUE) (Lee et al., 2024). The calculation method is shown in Equation 1.
where
where
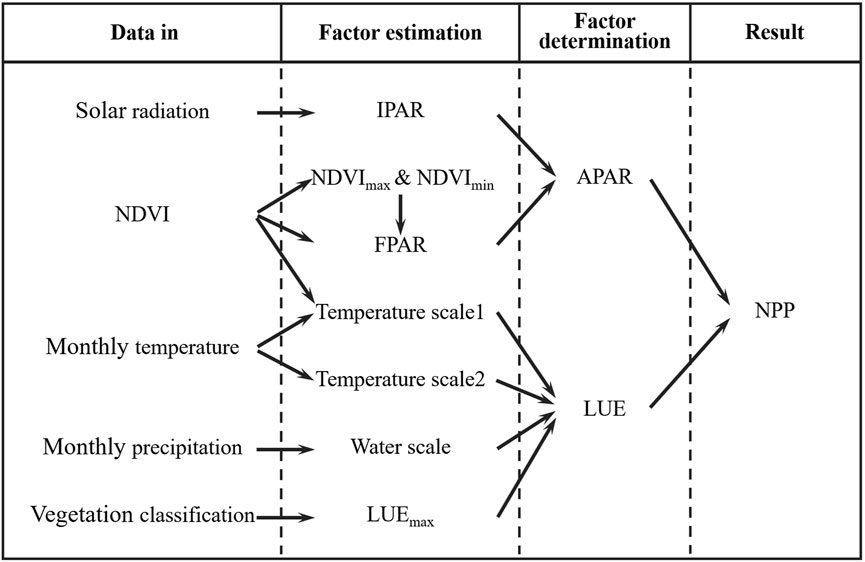
Figure 3. Process of estimating vegetation NPP using CASA model.
The traditional CASA model sets LUEmax as a fixed constant of 0.389 gC·MJ−1, thereby ignoring the regional differences caused by vegetation type diversity. In order to enhance the precision of NPP inversion, this study introduces the concept of seasonal adjustment factors based on vegetation indices, which allows for the dynamic simulation of LUEmax changes over specific time periods. To provide a more accurate reflection of the spatiotemporal variation in light energy utilisation efficiency under different vegetation types and environmental conditions. The calculation method is shown in Equations 4, 5.
where SNDVI is an additional NDVI seasonal adjustment factor; A and b are linear regression parameters of SNDVI over the years; NDVImax and NDVImin are the extreme values of monthly NDVI variation.
This paper employed Pearson correlation analysis to investigate the response relationship between the interannual mean of vegetation NPP and temperature, precipitation, radiation, and NDVI in the HRB, with the objective of exploring the impact of climate factors on vegetation NPP. Pearson correlation coefficients (PCCs) are a commonly employed statistical measure for determining the degree of directionality and correlation between two or more related variables (Guo et al., 2024). The value range of PCCs is [−1,1], with a value of 1 indicating a perfect positive correlation and a value of −1 indicating a perfect negative correlation. In this study, the correlation coefficient level was set to four positive and four negative levels based on the F-test results (Table 2).
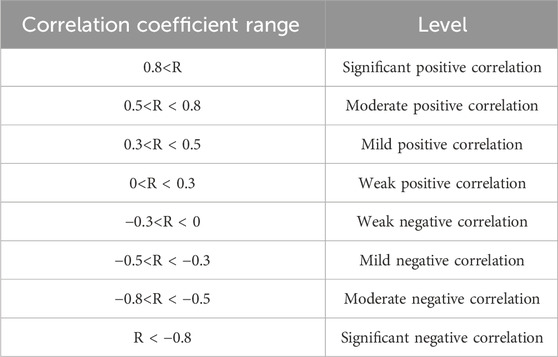
Table 2. Setting of correlation coefficient levels.
In this study, we employed a combined approach utilising Theil-Sen median (TS) trend analysis and the Mann-Kendall (MK) test to examine the alterations in vegetation NPP over the 2000–2019 and 2020–2030 timeframes. The TS trend analysis is a robust non-parametric statistical method for calculating trends that can produce reliable estimates of monotonic trends (Cao et al., 2023). The MK test is primarily employed to ascertain the statistical significance of a time series’ trend and to identify potential inflection points (Ding et al., 2024). The method does not require the sample to follow a specific distribution, thereby effectively avoiding the influence of a few outliers on the test results. A positive MK test result indicates an upward trend, whereas a negative result indicates a downward trend. The values 1.645, 1.96, and 2.32 represent the trend of the MK test at confidence levels of 0.1, 0.05, and 0.01, respectively. Furthermore, this article employs a significance level of 0.05 R2 to assess the efficacy of the single linear regression model.
Global Moran’s I index is a comprehensive tool for evaluating the aggregation, dispersion, or random distribution of elements in space, as well as quantifying the average correlation between all spatial units and their neighbouring units across the entire region (Wan et al., 2024). This study employed the Global Moran’s I index to examine the influence of diverse factors on the spatial clustering intensity of NPP. Given the spatial resolution of the NDVI dataset in the study area, which is 500 m, buffer zones were constructed with intervals of 500 m. NDVI values were extracted from each buffer zone individually in order to calculate the Global Moran’s I value, which reflects the spatial autocorrelation of vegetation NPP in the study area. A comparison of the Global Moran’s I values across years allows the trend of the spatial aggregation of vegetation NPP to be discerned. Moreover, the Global Moran’s I values between different influencing factors and vegetation NPP were calculated, and combined with spatial distribution maps to calculate the Global Moran’s I, Z values, and P values of each buffer zone (Lotfata, 2020). This was done in order to reveal the specific impact of each factor on the spatial aggregation pattern of vegetation NPP. The calculation method is shown in Equation 6.
where n represents the total number of spatial units in the study area, zi is the deviation between the attribute of element i and its average value, zj is the deviation between the attribute of element j and its average value, wij is the spatial weight between elements i and j, and S0 is the set of all spatial weights. The value of I is between [−1,1], and I > 0 indicates that the attribute values of all regions have a positive correlation in space; that is, the larger (smaller) the attribute values are, the easier they are to cluster together. I < 0 indicates that the attribute values of all regions have negative spatial correlation, meaning that the larger (smaller) the attribute values, the less likely they are to cluster together. When I = 0, it indicates that the area is randomly distributed and has no spatial correlation.
Cold and hot spot analysis identifies specific regions with significantly higher (hot spots) or lower (cold spots) attribute values compared to surrounding areas through spatial clustering analysis of attribute values in geographic data. This method aims to reveal the hidden distribution patterns in geographic data, explore potential spatial correlations and their inherent laws. Thus, it can compensate for the shortcomings of kernel density estimation method in quantitatively expressing hotspot areas (Deng and Cao, 2023). The calculation method is shown in Equation 7.
where
where
The convolutional neural network (ConvGRU) is a hybrid model that combines convolutional neural networks (CNN) and gated recurrent units (GRU), rendering it particularly suitable for processing data exhibiting spatiotemporal characteristics. In comparison to traditional machine learning models, ConvGRU, as a variant of Recurrent Neural Network (RNN), is capable of capturing spatial features (such as geographic location, terrain, etc.) within data through its convolutional layers, and of achieving parameter sharing through convolution operations (He et al., 2024). In particular, the ConvGRU employs convolutional layers in the computation of each gate, thereby facilitating the extraction and integration of spatial features through the sliding of the convolution kernel over the input data. The calculation method is shown in Equations 9–12.
Where ht represents the hidden state at time t; W and U are convolutional weights; b is the bias term; σ is the sigmoid function; tanh is a hyperbolic tangent function.
This study adopted a ConvGRU architecture and constructed an end-to-end deep learning model with the objective of providing high-precision spatiotemporal prediction capability for time-series NPP data in the HRB. This model follows the established Encoder-Predictor-Decoder paradigm, which is effective for capturing complex spatiotemporal dynamics (Figure 4). The Encoder performs sliding window and convolution kernel operations on the input temporal NPP raster data through convolutional layers. This process allows for the fine extraction of local spatial features, which are then encoded into high-level abstract representations (He et al., 2024). The Predictor is constituted by GRU units, which effectively merge the historical hidden states with the current convolution-enhanced feature inputs, thus generating hidden states that contain information regarding future trends. The Decoder is responsible for decoding the deep prediction information into precise output formats (predicted values, classification labels, etc.), thereby ensuring that the prediction results is accurate (He et al., 2023).
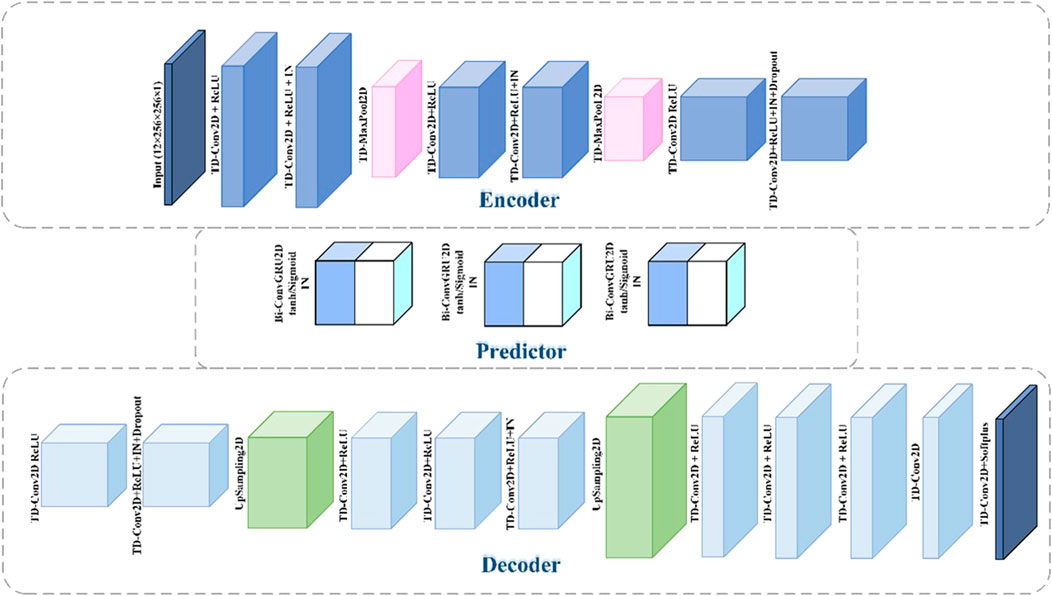
Figure 4. An end-to-end network model structure based on ConvGRU.
We used the annual NPP grid data obtained from the CASA model as input to predict the distribution of NPP in the study area for the next year. Within the time series range of all data, we used sliding windows to segment the dataset with a step size of 12 months. The last 23 time steps of the sample were extracted as test set labels, while the remaining samples were divided into training and validation sets using K-fold cross-validation (K = 5) (Fang et al., 2024). We attempted to compress the numerical scale of temporal NPP raster data using function fitting to accelerate convergence and prevent gradient vanishing or exploding.
In this study, we compared and validated the NPP dataset estimated using the CASA model with the NPP product dataset of the MOD17A3H series. Both datasets showed a stable upward trend in interannual NPP, with the initial maximum value remaining within 50.0 g·m−2 after linear fitting. The difference between the two datasets fluctuated between 1.2 and 72.6 g·m−2 (Figure 5). From 2000 to 2010, the overall MODIS NPP value was higher than the estimated CASA value, with the most significant difference occurring between 2002 and 2010. From 2011 to 2019, the estimated CASA value was higher than the MODIS NPP value, with the most significant difference occurring in 2017. Thereafter, the difference between the two showed a decreasing trend. We conducted a correlation test on the average annual values of the two types of data at the pixel scale over a period of 5 years (Figure 6). The correlation coefficients were 0.8251, 0.7568, 0.7409, and 0.7496, respectively, indicating a high overall correlation in the data. This suggests a positive correlation between the overall performance of the CASA model and the MODIS NPP product (Sun et al., 2023).
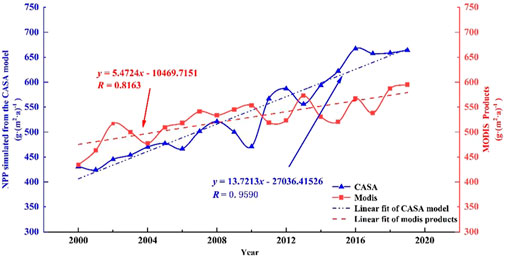
Figure 5. Data comparison verification. We compared the annual changes between the NPP dataset estimated by the CASA model and the NPP product dataset of the MOD17A3H series.
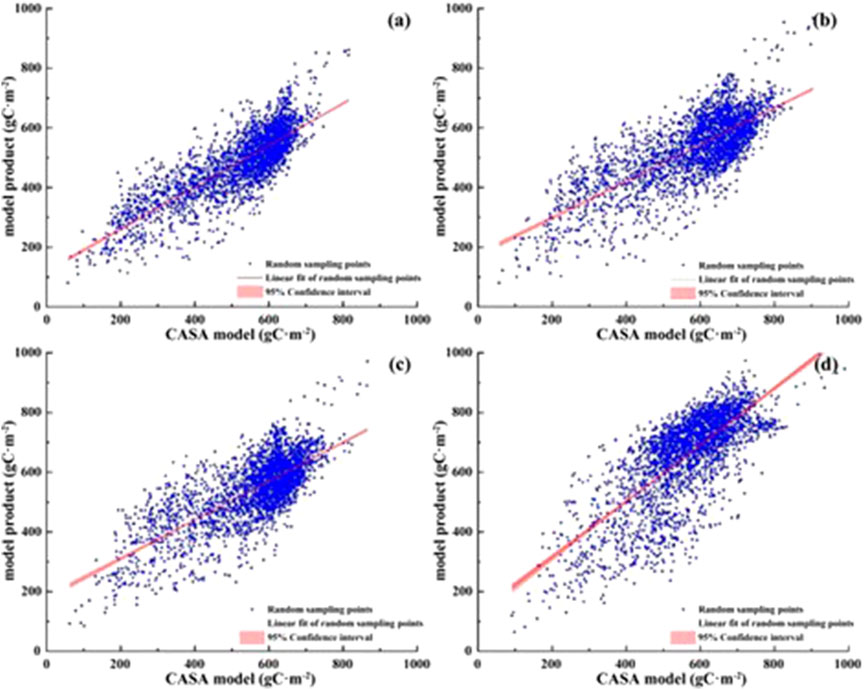
Figure 6. Data consistency analysis. We performed correlation testing between the NPP dataset estimated by the CASA model and the NPP product dataset of the MOD17A3H series. We conducted correlation tests on the mean values of two types of data (A) 2000–2004, (B) 2005–2009, (C) 2010–2014, and (D) 2015–2019 at the pixel scale over a period of 5 years.
While the MODIS NPP and CASA models show a strong correlation, there are still some differences between them. The MODIS NPP model primarily relies on satellite remote sensing data and uses spectral analysis and machine learning methods to estimate NPP. It focuses more on the feedback of surface NPP and is therefore greatly influenced by land type (Suryakanti and Prasad, 2024). The CASA model uses a comprehensive approach of ecology and environmental science based on ground observation data to estimate NPP. The accuracy and quality of various driving factors in the data influence NPP estimation (Wan et al., 2022; Jiang et al., 2020). The differences in data sources and mechanisms used by the two models result in variations in their estimates. Variations in results may also arise due to the use of different algorithms and technologies (Yan et al., 2021). Furthermore, the CASA model may introduce uncertainty in the estimation of NPP due to limitations in remote sensing data and errors generated during ground observation data processing. To verify and correct the final results, it is necessary to include more relevant driving factors (Xu et al., 2022). This may result in discrepancies between the NPP estimated by the CASA model and that obtained from MODIS data.
From 2000 to 2019, the vegetation NPP in the HRB showed a downward trend in some time periods but showed a significant growth trend overall (Figure 7). This trend in vegetation NPP reflects regional vegetation coverage and growth. To analyze this trend in depth, we conducted a time series analysis of the interannual mean NPP estimated by the CASA model in the HRB from 2000 to 2019. The HRB’s annual average vegetation NPP exhibited a significant growth trend, with a growth rate of 13.721 gC·m−2·a−1. R2 reached 0.9197. The range of variation was between 400 and 600 gC·m−2. It is noteworthy that the most pronounced downward trend occurred from 2008 to 2019, with a decline rate of 50 gC·m−2·a−1.
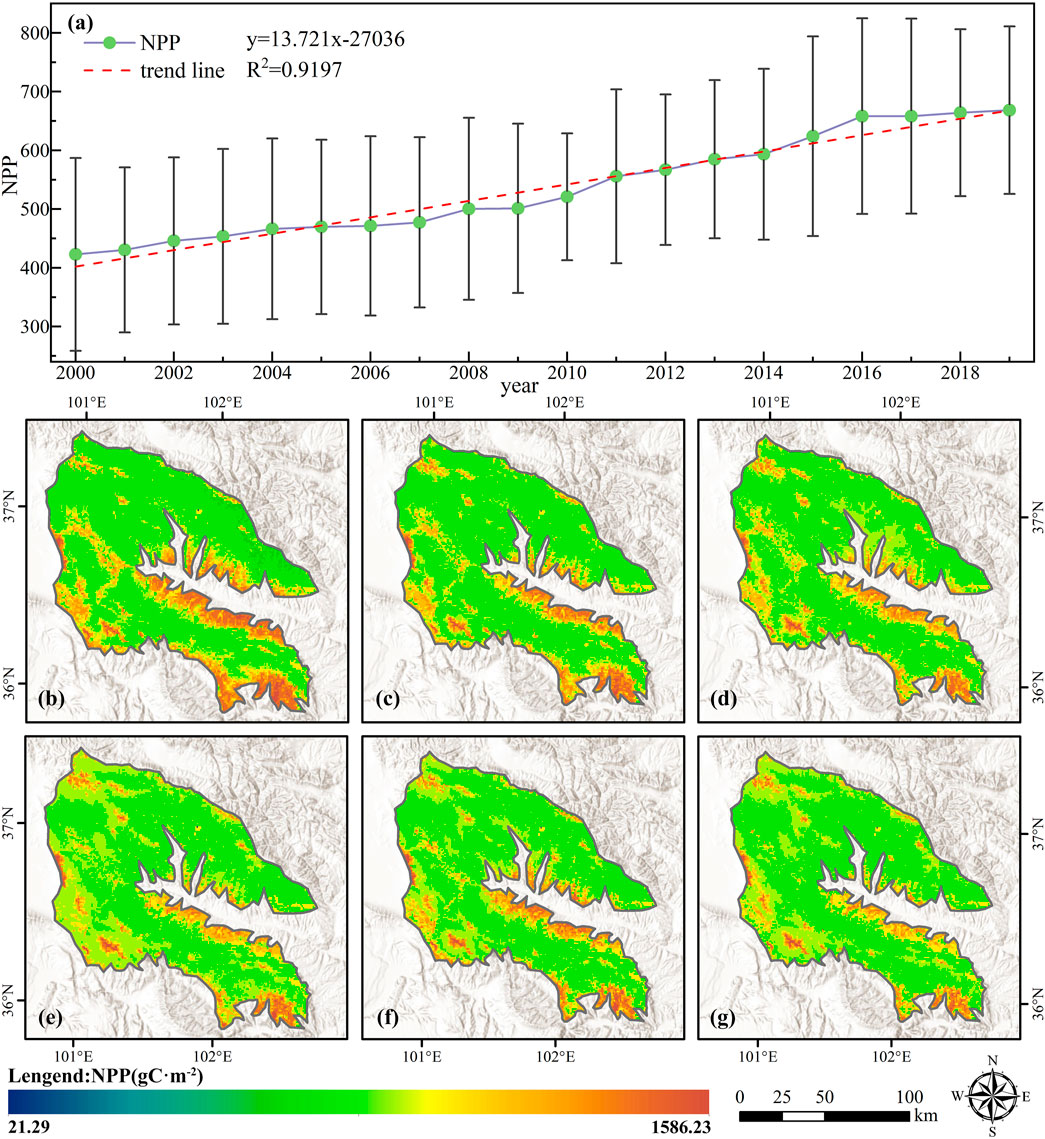
Figure 7. Interannual variation and spatial distribution of vegetation NPP in the HRB from 2000 to 2019. (A) interannual variation of vegetation NPP for many years; (B–G) spatial variation of vegetation NPP in the HRB with a 3-year interval. We used the same color band to represent changes.
The spatial variation of the vegetation NPP in the HRB showed a significant increasing trend over time (Figure 8). The growth trend in most regions is extremely significant (P < 0.01), with only a few regions failing the significance test (P > 0.1), and very few regions showing significant and extremely significant reductions (−0.05<P < 0). The growth rate of NPP in most areas of the HRB was at a relatively high level. In addition, the regions with a significant increase in NPP (>5 gC·m-2·a−1) were mainly distributed in the northwest and central southern boundary areas of the study area.
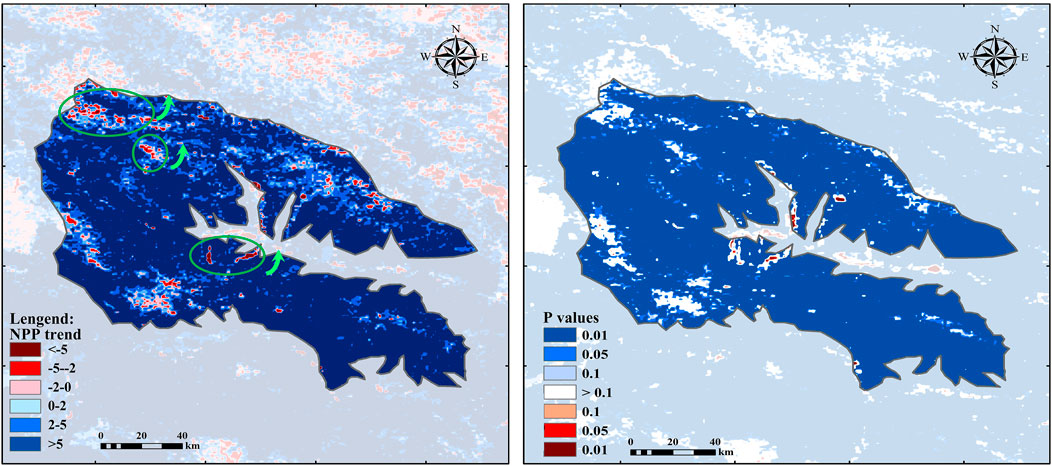
Figure 8. Spatial trend and significance analysis of vegetation NPP from 2000 to 2019.
The response relationship between vegetation NPP and TEMP, PRE, SR, and NDVI was analyzed based on the CASA model’s estimation of vegetation NPP results. Overall, PRE, SR, and NDVI had varying degrees of promoting effects on vegetation NPP, while TEMP had an inhibitory effect on vegetation NPP (Figure 9). The majority of regions showed a positive correlation between vegetation NPP and PRE, with a moderate positive correlation of approximately 79.20%. Only a few regions (0.96%) showed a weak negative correlation. Similarly, there were very few regions with a negative correlation between vegetation NPP and SR (<0.1%), with most regions showing a positive correlation, mainly moderate positive correlations (40.03%) or significant positive correlations (53.87%). Approximately two-thirds (67.22%) of the areas displayed a positive correlation between vegetation NPP and NDVI, while only 32.78% of the areas exhibited a negative correlation. Spatially, regions with a positive correlation were primarily concentrated in the eastern boundary of the basin, while regions with a negative correlation were mainly scattered in the center of the basin. Furthermore, 22.45% of the total area exhibited a positive correlation between vegetation NPP and TEMP, primarily concentrated in a weak positive correlation. Conversely, 77.54% of the areas displayed negative correlations, mainly weak negative correlations, with only a few areas demonstrating mild negative correlations. These areas were primarily distributed in the central boundary zone of the basin (Table 3).
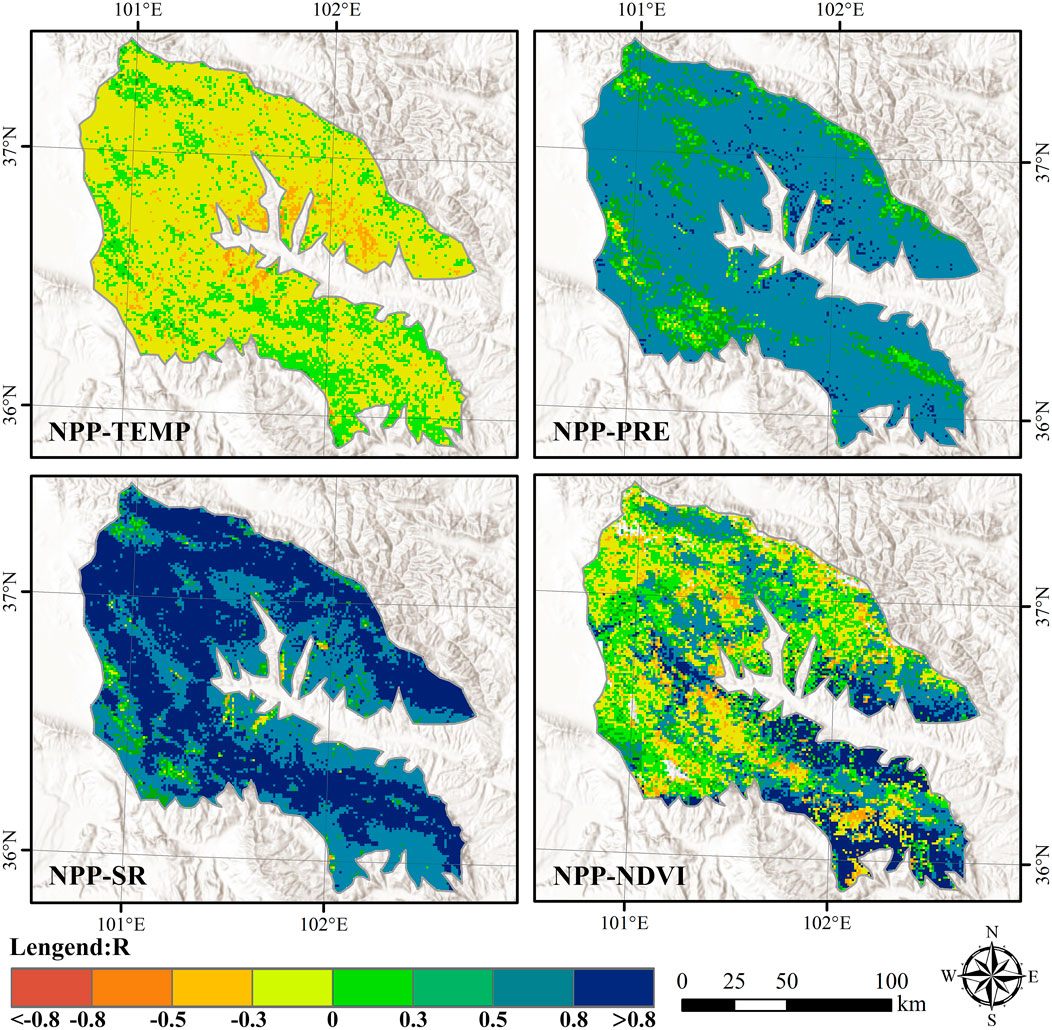
Figure 9. Spatial correlation between vegetation NPP and TEMP, PRE, SR, and NDVI from 2000 to 2019.
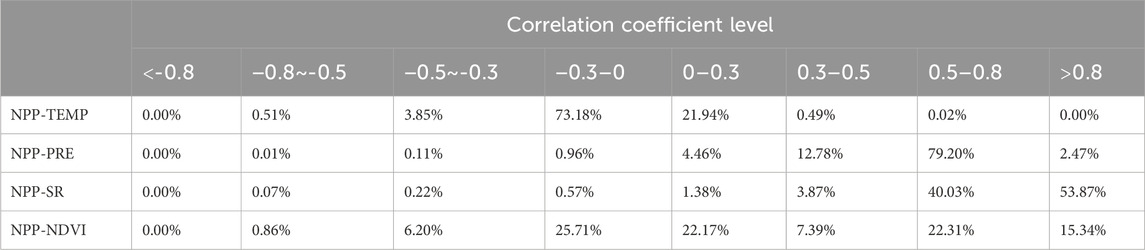
Table 3. Distribution proportion of correlation between vegetation NPP and various factors.
We used the ConvGRU model to predict future vegetation NPP in the HRB. The annual vegetation NPP in the watershed from 2020 to 2030 exhibited significant temporal variability (Figure 10). Over the past decade, the average annual growth rate was 3.1973 gC·m−2·a−1, with a range of 640–690 gC·m−2. The period from 2021 to 2022 exhibited a downward trend, with a decline rate of approximately 20 gC·m−2·a−1. Additionally, the spatial differences in the vegetation NPP prediction results in the HRB were not significant. The spatial variation characteristics of future vegetation NPP in the HRB showed an overall increasing trend (Figure 11). The NPP of vegetation in the central region of the watershed showed an increasing trend, with only a few areas exhibiting a contraction or decline trend. This growth trend is expanding.
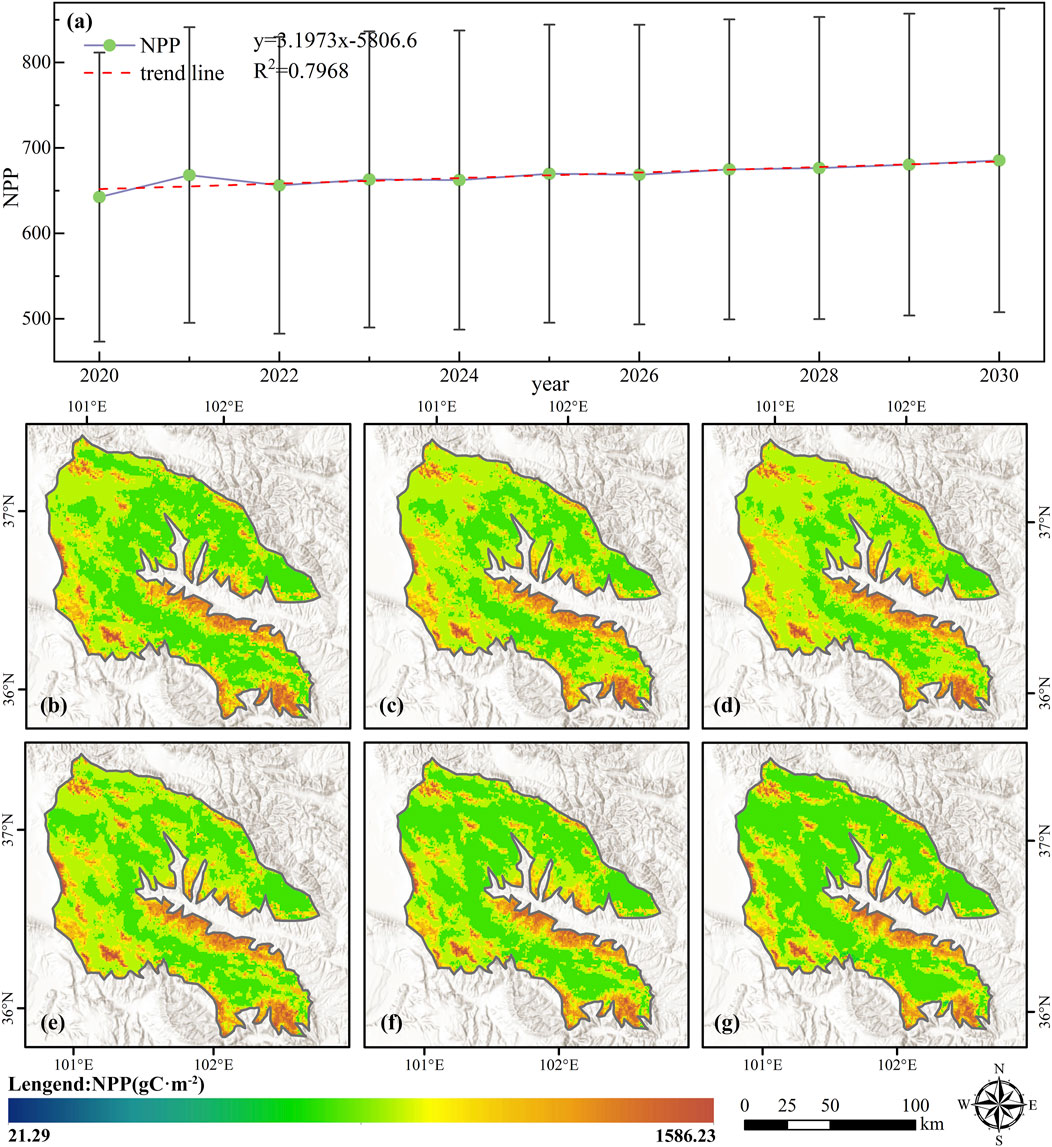
Figure 10. Interannual variation and spatial distribution of vegetation NPP in the HRB from 2020 to 2030. (A) interannual variation of vegetation NPP for many years; (B–G) spatial variation of vegetation NPP in the HRB with an interval of 1 year. We used the same color band to represent changes.
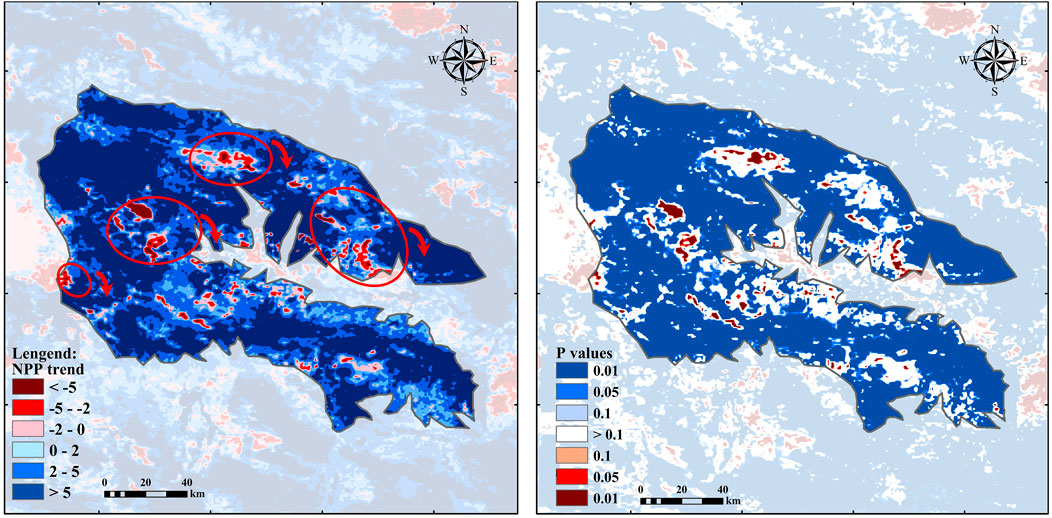
Figure 11. Spatial trend and significance analysis of vegetation NPP from 2020 to 2030.
We used global Moran’s I and Getis-Ord Gi* to explore the spatial clustering characteristics of past and future vegetation NPP. The aim was to identify spatial hot spot and cold spot areas and enhance our understanding of vegetation NPP changes in the HRB. The results showed a clear spatial positive correlation and significant spatial clustering of vegetation NPP in the HRB, indicating a non-random distribution (Figure 12). The global Moran index of vegetation NPP was 0.843 from 2000 to 2019 and 0.846 from 2020 to 2030. The Z-scores were 225.878 and 228.542, respectively, far exceeding the critical value of 2.58. This indicates more than 99% confidence that the NPP does not exhibit a random distribution in this region. The P-values were all 0, further indicating that the spatial pattern of vegetation NPP cannot generate random processes.
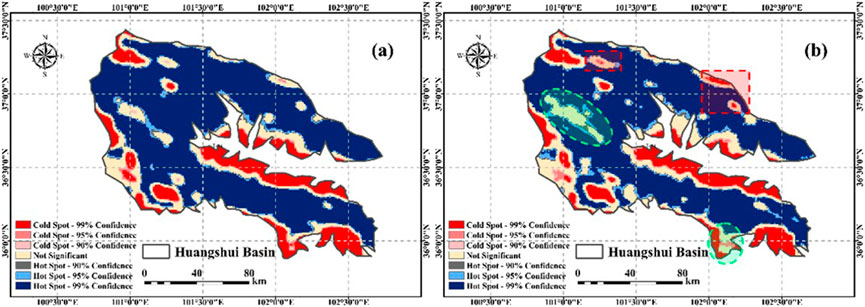
Figure 12. Spatial aggregation of vegetation NPP: (A) from 2000 to 2019; (B) from 2020 to 2030. The red box in the figure represents obvious hot or cold point expansion, while the green oval box represents obvious hot or cold point expansion.
To analyze the spatial clustering characteristics of NPP in more detail, we divided the vegetation NPP clustering areas into seven categories based on the height and significance level of Gi*. We then compared the distribution of vegetation NPP spatial hot and cold spots from 2000 to 2019 and from 2020 to 2030. There was little difference in the spatial distribution of NPP hot and cold points in 2000–2019 and 2020–2030. The majority of regions fell within a 99% confidence level, with only a few regions being insignificant. Hot spots were mainly concentrated in the central region of the basin, while cold spots were mainly distributed in the central and southern edge areas of the basin. Meanwhile, certain regions in the northern and northeastern parts of the HRB exhibited significant expansion of hot spots or contraction of cold spots, whereas the southern and western central areas displayed noticeable contraction of hot spots or expansion of cold spots.
In this study, we used the CASA model to estimate vegetation NPP in the HRB and analyzed the relationship between vegetation NPP and various factors to reveal the response mechanism. The results showed that PRE, SR, and NDVI had varying degrees of promoting effects on vegetation NPP, while TEMP had an inhibitory effect. An increase in PRE, SR, and NDVI can enhance vegetation productivity, while an increase in TEMP may decrease it. This is because appropriate PRE, SR, and higher NDVI values benefit vegetation photosynthesis (Xue et al., 2023), promoting productivity. However, excessive TEMP can cause rapid water evaporation and insufficient soil moisture, and inhibit vegetation growth (Qing et al., 2023). PRE is a crucial factor that affects vegetation NPP. Moderate PRE is beneficial for improving vegetation productivity, but excessive precipitation can lead to excess soil moisture (Ardilouze et al., 2022), which affects root respiration and reduces productivity. SR is also an important factor that affects vegetation NPP. An increase in SR helps improve the photosynthetic efficiency of vegetation, thereby enhancing productivity. The NDVI reflects the productivity status of vegetation to some extent, with higher values indicating higher productivity. However, excessively high NDVI values may indicate that the vegetation is too lush (Fan, 2023), leading to insufficient illumination of the lower vegetation and ultimately reducing overall productivity. The impact of temperature on vegetation NPP varies regionally; moderate temperatures can help improve productivity, while high or low temperatures may have a negative impact on productivity (Chen and Zhang, 2023).
The vegetation NPP in the HRB displays a clear positive spatial correlation and significant spatial clustering rather than a random distribution. This suggests a certain spatial correlation in vegetation productivity within the basin. Upon further observation, it was found that certain areas in the northern and northeastern parts of the watershed exhibited significant hot spot expansion or cold spot contraction. The vegetation in these areas is expected to maintain a positive growth trend, and the vegetation NPP is projected to remain stable. However, the southern corner of the basin and the central western region exhibited significant hot spot contraction or cold spot expansion, indicating that the vegetation in these areas may be at risk of degradation in the future, and the vegetation NPP is also expected to decline. In recent years, environmental problems in the HRB have become increasingly prominent. Illegal activities, such as small hydropower projects and the non-standard operation of tourism facilities, have caused serious damage to the environment and led to the degradation of the ecological landscape (Wang et al., 2023). These activities may lead to future ecological degradation of cold point areas in the watershed. Furthermore, when human activity reaches a certain intensity, it can negatively affect regional NPP (Shao and Yang, 2024). It is essential to fully consider the impact of human activities on the ecological environment and to take effective measures to reduce their negative impact.
This study employed a multi-source dataset to conduct a comprehensive analysis of the spatiotemporal dynamic changes of vegetation NPP in the HRB. Furthermore, it used ConvGRU model to predict future trends in this phenomenon. This initiative is designed to furnish scientific reference and data support for the formulation of ecological protection policies, continuous monitoring of vegetation status, and exploration of carbon cycling mechanisms. Nevertheless, the study is not without limitations. These include the presence of uneven data quality and missing data, limitations in spatiotemporal resolution, and challenges such as insufficient validation of neural network models and uncertainty in model parameter optimisation. To further enhance the credibility and accuracy of our research, we plan to adopt the following strategies: firstly, we will strengthen the data-sharing mechanism and establish a unified data quality standard to ensure the reliability and consistency of data sources; secondly, we will use emerging technologies such as high-resolution remote sensing technology and the integration of ground observation networks to improve the resolution of data in both temporal and spatial dimensions, thereby more accurately capturing the dynamic changes of vegetation NPP. Furthermore, cross-validation procedures will be incorporated, a range of performance indicators will be introduced, and a comparative analysis between models will be conducted to provide a more comprehensive depiction of the spatiotemporal evolution characteristics and future development trends of vegetation NPP in the HRB.
In this study, we estimated vegetation NPP data in the HRB from 2000 to 2019 using an improved CASA model. The spatiotemporal evolution patterns and influencing factors of vegetation NPP in the watershed were then revealed. The ConvGRU spatiotemporal prediction model was used to predict the vegetation NPP in the HRB from 2020 to 2029, and future spatiotemporal evolution trends were explored. The data suggest that there are notable spatiotemporal variations in the vegetation NPP within the HRB. While most areas showed an increasing trend in vegetation NPP, a few areas have experienced a decline. Additionally, there is a complex correlation between vegetation NPP and environmental factors. Vegetation NPP was negatively correlated with TEMP and positively correlated with PRE, and its correlation with SR and NDVI varied by region. The NPP of vegetation in most areas of the HRB is expected to continue to increase in the future. The spatial distribution of vegetation NPP in the region exhibits significant characteristics, with a clear trend of hot spot contraction or cold spot expansion. Analyzing and studying the spatiotemporal changes, future trends, and response mechanisms of vegetation NPP in the HRB can provide a reference for formulating small-scale regional ecological protection policies, monitoring vegetation changes, and researching regional carbon cycling.
The raw data supporting the conclusions of this article will be made available by the authors, without undue reservation.
SD: Conceptualization, Investigation, Methodology, Writing–original draft, Writing–review and editing. QS: Project administration, Writing–review and editing. YG: Formal Analysis, Funding acquisition, Methodology, Visualization, Writing–review and editing. XW: Formal Analysis, Methodology, Writing–review and editing.
The author(s) declare that financial support was received for the research, authorship, and/or publication of this article. This research was financially supported by the Central Government to Guide Local Scientific and Technological Development (YDZX20216200001803), and Key R&D Plan of Gansu Provincial Department of Science and Technology (23YFFA0057).
Author QS was employed by China 22MCC Group Co., Ltd.
The remaining authors declare that the research was conducted in the absence of any commercial or financial relationships that could be construed as a potential conflict of interest.
All claims expressed in this article are solely those of the authors and do not necessarily represent those of their affiliated organizations, or those of the publisher, the editors and the reviewers. Any product that may be evaluated in this article, or claim that may be made by its manufacturer, is not guaranteed or endorsed by the publisher.
Akanbi, O. D., Bhuvanagiri, D. C., Barcelos, E. I., Nihar, A., Hernandez, B. G., Yarus, J. M., et al. (2024). Integrating multiscale geospatial analysis for monitoring crop growth, nutrient distribution, and hydrological dynamics in large-scale agricultural systems. J. Geovisualization Spatial Analysis 8, 9. doi:10.1007/s41651-023-00164-y
Ardilouze, C., Materia, S., Batté, L., Benassi, M., and Prodhomme, C. (2022). Precipitation response to extreme soil moisture conditions over the Mediterranean. Clim. Dyn. 58, 1927–1942. doi:10.1007/s00382-020-05519-5
Bai, W. Q., He, L., He, Z. W., Wang, X. M., Zhao, Y., Qu, R., et al. (2023). Analysis of spatial and temporal variation of vegetation NPP in Daning River Basin and its driving forces. Int. J. Remote Sens. 44 (19), 6194–6218. doi:10.1080/01431161.2023.2264501
Bi, W. X., Wang, K., Weng, B. S., Zhang, D. W., Dong, Z. Y., Shi, X. L., et al. (2023). Effects of land use changes on the soil-vegetation ecosystem in winter in the Huangshui River Basin, China. Ecol. Indic. 154, 110675. doi:10.1016/j.ecolind.2023.110675
Cao, S. P., He, Y., Zhang, L. F., Sun, Q., Zhang, Y. L., Li, H. Z., et al. (2023). Spatiotemporal dynamics of vegetation net ecosystem productivity and its response to drought in Northwest China. GISci. Remote Sens. 60 (1), 2194597. doi:10.1080/15481603.2023.2194597
Chen, J. L., Shao, Z. F., Huang, X., and Hu, B. (2024). Multi-source data-driven estimation of urban net primary productivity: a case study of Wuhan. Int. J. Appl. Earth Obs. Geoinf. 127, 103638. doi:10.1016/j.jag.2023.103638
Chen, X., and Zhang, Y. P. (2023). Impacts of climate, phenology, elevation and their interactions on the net primary productivity of vegetation in Yunnan, China under global warming. Ecol. Indic. 154, 110533. doi:10.1016/j.ecolind.2023.110533
Deng, Z. Y., and Cao, J. S. (2023). Incorporating ecosystem services into functional zoning and adaptive management of natural protected areas as case study of the Shennongjia region in China. Sci. Rep. 13, 18870. doi:10.1038/s41598-023-46182-0
Ding, Y. J., Zhang, L. F., He, Y., Cao, S. P., Wei, X., Guo, Y., et al. (2024). Spatiotemporal evolution of agricultural drought and its attribution under different climate zones and vegetation types in the Yellow River Basin of China. Sci. Total Environ. 914, 169687. doi:10.1016/j.scitotenv.2023.169687
Dong, B. Q., Qin, T. L., Wang, Y., Zhao, Y., Liu, S. S., Feng, J. M., et al. (2021). Spatiotemporal variation of nitrogen and phosphorus and its main influencing factors in Huangshui River basin. Environ. Monit. Assess. 193, 292. doi:10.1007/s10661-021-09067-1
Fan, D. L. (2023). Research on the establishment of NDVI long-term data set based on a novel method. Sci. Rep. 13, 9838. doi:10.1038/s41598-023-36939-y
Fang, Y. M., Zhang, L. F., He, Y., Yang, W., Huo, T. B., Zhang, Q., et al. (2024). The displacement analysis and prediction of a creeping ancient landslide at suoertou, zhouqu county, China. IEEE J. Sel. Top. Appl. Earth Obs. Remote Sens. 17, 4139–4163. doi:10.1109/jstars.2024.3357520
Gan, R., Zhang, L., Yang, Y. T., Wang, E. L., Woodgate, W., Zhang, Y. Q., et al. (2021). Estimating ecosystem maximum light use efficiency based on the water use efficiency principle. Environ. Res. Lett. 16 (10), 104032. doi:10.1088/1748-9326/ac263b
Gao, X., Huang, X. X., Lo, K., Dang, Q. W., and Wen, R. Y. (2021). Vegetation responses to climate change in the qilian mountain nature reserve, northwest China. Glob. Ecol. Conserv. 28, e01698. doi:10.1016/j.gecco.2021.e01698
Guo, D., Song, X. N., Hu, R. H., Cai, S. H., Zhu, X. M., and Hao, Y. B. (2021). Grassland type-dependent spatiotemporal characteristics of productivity in Inner Mongolia and its response to climate factors. Sci. Total Environ. 775, 145644. doi:10.1016/j.scitotenv.2021.145644
Guo, Y., Zhang, L. F., He, Y., Cao, S. P., Li, H. Z., Ran, L., et al. (2024). LSTM time series NDVI prediction method incorporating climate elements: a case study of Yellow River Basin, China. J. Hydrol. 629, 130518. doi:10.1016/j.jhydrol.2023.130518
He, Q. N., Ju, W. M., Dai, S. P., He, W., Song, L., Wang, S. H., et al. (2021). Drought risk of global terrestrial gross primary productivity over the last 40 Years detected by a remote sensing-driven process model. J. GEOPHYS RES-BIOGEO 126 (6), e2020JG005944. doi:10.1029/2020jg005944
He, Y., Yao, S., Chen, Y., Yan, H. W., and Zhang, L. F. (2023). Spatio-temporal prediction of time-series InSAR Land subsidence based on ConvLSTM neural network. Geomatics Inf. Sci. Wuhan Univ., 1–21. doi:10.13203/j.whugis20220657
He, Y., Zhao, Z. A., Zhu, Q., Liu, T., Zhang, Q., Yang, W., et al. (2024). An integrated neural network method for landslide susceptibility assessment based on time-series InSAR deformation dynamic features. Int. J. Digit. Earth. 17 (1), 2295408. doi:10.1080/17538947.2023.2295408
Hua, C. Y., He, J. Y., Fang, Z. T., Zhu, M. Y., Cui, Z. J., and Ren, L. J. (2023). Risk assessment for potentially toxic metals in Huangshui River, the Upper Yellow River, Qinghai Province, China, employing the species sensitivity distributions. PROCESS Saf. Environ. 178, 370–380. doi:10.1016/j.psep.2023.08.056
Huang, C. Q., Sun, C. Z., Nguyen, M., Wu, Q., He, C., Yang, H., et al. (2023). Spatio-temporal dynamics of terrestrial Net ecosystem productivity in the ASEAN from 2001 to 2020 based on remote sensing and improved CASA model. Ecol. Indic. 154, 110920. doi:10.1016/j.ecolind.2023.110920
Jiang, Y. L., Guo, J., Peng, Q., Guan, Y. L., Zhang, Y., and Zhang, R. P. (2020). The effects of climate factors and human activities on net primary productivity in Xinjiang. Int. J. Biometeorol. 64, 765–777. doi:10.1007/s00484-020-01866-4
Lee, M., Yoo, C., and Chang, K. H. (2024). Unexpected contribution of cloud seeding to NPP increase during drought. Hydrol. Res. 55 (1), 17–32. doi:10.2166/nh.2023.075
Li, H. W., Wu, Y. P., Liu, S. G., and Xiao, J. F. (2021). Regional contributions to interannual variability of net primary production and climatic attributions. Agric. For. Meteorol. 303, 108384. doi:10.1016/j.agrformet.2021.108384
Li, J., Liu, S. S., Chen, J., Zhao, Y., Abebe, S. A., Dong, B. Q., et al. (2024). Response of stream water quality to the vegetation patterns on arid slope: a case study of Huangshui River basin. Environ. Sci. Pollut. Res. 31, 9167–9182. doi:10.1007/s11356-023-31759-z
Liu, Y. H., Han, X. Z., Weng, F. Z., Xu, Y. M., Zhang, Y. P., and Tang, S. H. (2022). Estimation of terrestrial net primary productivity in China from fengyun-3D satellite data. J. Meteorol. Re. 36, 401–416. doi:10.1007/s13351-022-1183-6
Liu, Z. F., Lei, H. C., Sheng, H. Y., and Wang, Y. Z. (2023). Analysis of soil organic matter influencing factors in the Huangshui River Basin by using the optimal parameter-based geographical detector model. Geocarto Int. 38 (1), 2246935. doi:10.1080/10106049.2023.2246935
Lotfata, A. (2020). Using geographically weighted models to explore obesity prevalence association with air temperature, socioeconomic factors, and unhealthy behavior in the USA. J. Geovisualization Spatial Analysis 6, 14. doi:10.1007/s41651-022-00108-y
Lv, X. Z., Liu, S. S., Li, S. P., Ni, Y. X., Qin, T. L., and Zhang, Q. F. (2021). Quantitative estimation on contribution of climate changes and watershed characteristic changes to decreasing streamflow in a typical basin of Yellow River. Front. Earth Sci. 9, 752425. doi:10.3389/feart.2021.752425
Lyu, J. Q., Fu, X. H., Lu, C., Zhang, Y. Y., Luo, P. P., Guo, P., et al. (2023). Quantitative assessment of spatiotemporal dynamics in vegetation NPP, NEP and carbon sink capacity in the Weihe River Basin from 2001 to 2020. J. Clean. Prod. 428, 139384. doi:10.1016/j.jclepro.2023.139384
Ma, B., Wang, Y. L., Zhao, K. K., Stirling, E., Lv, X. F., Yu, Y. J., et al. (2024). Biogeographic patterns and drivers of soil viromes. Nat. Ecol. Evol. 8, 717–728. doi:10.1038/s41559-024-02347-2
Qing, Y. M., Wang, S., Yang, Z. L., and Gentine, P. (2023). Soil moisture−atmosphere feedbacks have triggered the shifts from drought to pluvial conditions since 1980. Commun. Earth Environ. 4, 254. doi:10.1038/s43247-023-00922-2
Sha, Z. Y., Bai, Y. F., Li, R. R., Lan, H., Zhang, X. L., Li, J., et al. (2022). The global carbon sink potential of terrestrial vegetation can be increased substantially by optimal land management. Commun. Earth Environ. 3, 8. doi:10.1038/s43247-021-00333-1
Shao, S., and Yang, Y. (2024). Analysis of change process of NPP dominated by human activities in Northwest Hubei, China, from 2000 to 2020. Environ. Sci. Pollut. Res. 31, 19831–19843. doi:10.1007/s11356-024-32370-6
Shi, S., Shi, Z. X., Sun, Z. Q., Gong, W., Xu, L., Chen, B., et al. (2023). Potentiality of ultraspectral sensor in biophysical and biochemical vegetation parameter inversion. Int. J. Remote Sens. 44 (22), 7187–7210. doi:10.1080/01431161.2023.2283903
Song, L. Y., Li, M. Y., Xu, H., Guo, Y., Wang, Z., Li, Y. C., et al. (2021). Spatiotemporal variation and driving factors of vegetation net primary productivity in a typical karst area in China from 2000 to 2010. Ecol. Indic. 132, 108280. doi:10.1016/j.ecolind.2021.108280
Su, S. T., Zeng, Y., Zhao, D., Zheng, Z. J., and Wu, X. H. (2022). Optimization of net primary productivity estimation model for terrestrial vegetation in China based on CERN data. Acta Ecol. Sin. 42 (4), 1276–1289. doi:10.5846/stxb202011263031
Sun, Q., Zhang, L. F., He, Y., Yao, S., Cao, S. P., and Zhao, Z. A. (2023). Spatio-temporal changes and driving force analysis of vegetation net primary productivity in Gannan Tibetan Autonomous Prefecture. Pratacultural Sci. 40 (7), 1729–1741. doi:10.11829/j.issn.1001-0629.2022-0204
Suryakanti, D., and Prasad, V. S. (2024). Impact assessment of COSMIC-2 bending angle in the GSI 4D-EnVar analysis scheme operational at NCMRWF. Int. J. Remote Sens. 45 (2), 376–392. doi:10.1080/01431161.2023.2297174
Wan, R. X., Qian, S. Y., Ruan, J. H., Zhang, L., Zhang, Z., Zhu, S. Y., et al. (2024). Modelling monthly-gridded carbon emissions based on nighttime light data. J. Environ. Manage. 354, 120391. doi:10.1016/j.jenvman.2024.120391
Wan, W., Liu, Z., Li, J. H., Xu, J. N., Wu, H. Q., and Xu, Z. H. (2022). Spatiotemporal patterns of maize drought stress and their effects on biomass in the Northeast and North China Plain from 2000 to 2019. Agric. For. Meteorol. 315, 108821. doi:10.1016/j.agrformet.2022.108821
Wang, Y. G., Ding, X. L., Chen, Y., Zeng, W. H., and Zhao, Y. X. (2023). Pollution source identification and abatement for water quality sections in Huangshui River basin, China. J. Environ. Manage. 344, 118326. doi:10.1016/j.jenvman.2023.118326
Wei, X. D., Yang, J., Luo, P. P., Lin, L. G., Lin, K. L., and Guan, J. M. (2022). Assessment of the variation and influencing factors of vegetation NPP and carbon sink capacity under different natural conditions. Ecol. Indic. 138, 108834. doi:10.1016/j.ecolind.2022.108834
Xi, Z. L., Chen, G. Z., Xing, Y. Q., Xu, H. D., Tian, Z. Y., Ma, Y., et al. (2023). Spatial and temporal variation of vegetation NPP and analysis of influencing factors in Heilongjiang Province, China. Ecol. Indic. 154, 110798. doi:10.1016/j.ecolind.2023.110798
Xiao, J. Z., Song, F., Su, F. L., Shi, Z. Y., and Song, S. (2023). Quantifying the independent contributions of climate and land use change to ecosystem services. Ecol. Indic. 153, 110411. doi:10.1016/j.ecolind.2023.110411
Xu, C., Du, X. P., Fan, X. T., Giuliani, G., Hu, Z. Y., Wang, W., et al. (2022). Cloud-based storage and computing for remote sensing big data: a technical review. Int. J. Digit. Earth. 15 (1), 1417–1445. doi:10.1080/17538947.2022.2115567
Xu, Y., Lu, Y. G., Zou, B., Xu, M., and Feng, Y. X. (2024). Unraveling the enigma of NPP variation in Chinese vegetation ecosystems: the interplay of climate change and land use change. Sci. Total Environ. 912, 169023. doi:10.1016/j.scitotenv.2023.169023
Xue, Y. Y., Bai, X. Y., Zhao, C. W., Tan, Q., Li, Y. B., Luo, G. J., et al. (2023). Spring photosynthetic phenology of Chinese vegetation in response to climate change and its impact on net primary productivity. Agric. For. Meteorol. 342, 109734. doi:10.1016/j.agrformet.2023.109734
Yan, Y. C., Wu, C. J., and Wen, Y. Y. (2021). Determining the impacts of climate change and urban expansion on net primary productivity using the spatio-temporal fusion of remote sensing data. Ecol. Indic. 127, 107737. doi:10.1016/j.ecolind.2021.107737
Yang, H. F., Zhong, X. N., Deng, S. Q., and Xu, H. (2021). Assessment of the impact of LUCC on NPP and its influencing factors in the Yangtze River basin, China. CATENA 206, 105542. doi:10.1016/j.catena.2021.105542
Zhao, C. L., Zhu, W. Q., and Xie, Z. Y. (2021). Comparative evaluation of simulation methods for vegetation maximum light use efficiency. Natl. Remote Sens. Bull. 0, 1–12. doi:10.11834/jrs.20211394
Zheng, Z. T., Zhu, W. Q., and Zhang, Y. J. (2020). Seasonally and spatially varied controls of climatic factors on net primary productivity in alpine grasslands on the Tibetan Plateau. Glob. Ecol. Conserv. 21, e00814. doi:10.1016/j.gecco.2019.e00814
Keywords: vegetation net primary productivity, spatiotemporal evolution patterns, future prediction, Huangshui River Basin in Qilian Mountains, ConvGRU
Citation: Ding S, Sun Q, Guo Y and Wei X (2025) The spatiotemporal evolution and prediction of vegetation NPP in the Huangshui River Basin of Qilian Mountains. Front. Environ. Sci. 12:1459669. doi: 10.3389/fenvs.2024.1459669
Received: 04 July 2024; Accepted: 30 December 2024;
Published: 13 January 2025.
Edited by:
Phaedon Kyriakidis, Cyprus University of Technology, CyprusReviewed by:
Sintayehu Adefires Abebe, Debre Markos University, EthiopiaCopyright © 2025 Ding, Sun, Guo and Wei. This is an open-access article distributed under the terms of the Creative Commons Attribution License (CC BY). The use, distribution or reproduction in other forums is permitted, provided the original author(s) and the copyright owner(s) are credited and that the original publication in this journal is cited, in accordance with accepted academic practice. No use, distribution or reproduction is permitted which does not comply with these terms.
*Correspondence: Yan Guo, MTIyMjIwMzZAc3R1Lmx6anR1LmVkdS5jbg==
Disclaimer: All claims expressed in this article are solely those of the authors and do not necessarily represent those of their affiliated organizations, or those of the publisher, the editors and the reviewers. Any product that may be evaluated in this article or claim that may be made by its manufacturer is not guaranteed or endorsed by the publisher.
Research integrity at Frontiers
Learn more about the work of our research integrity team to safeguard the quality of each article we publish.