- Department of Earth Sciences, The University of Western Ontario, London, ON, Canada
Land-based sources are the greatest contributors of plastic pollution found in aquatic environments. Although plastic debris items spilling into natural watercourses from stormwater outflow sites have been investigated, this study provides details of the plastic items that can be trapped within stormwater drains prior to release. We examined macroplastic (>5 mm) and large microplastic (1–5 mm) debris that accumulated in LittaTrapTM devices at six drains over four seasonal periods in London, Ontario, Canada. Flotation, visual identification, microscopy and Fourier transform infrared spectroscopy (FTIR) were used to determine the drivers of plastic debris deposition. Macroplastics (MaPs) and microplastics (MPs) were identified in all 36 samples, and the totals ranged from 5–158 MaPs and 18–359 MPs per trap. Out of the 118 different MaPs found, the most common items were cigarette butts, wrappers, and expanded polystyrene. The main MPs were fragments, foams, and fibres. The most common macroplastic applications were “smoking”, “food/beverage packaging”, “household”, and non-food or beverage “packaging”. Microplastic particle compositions were mainly polyethylene and polypropylene, but other polymer types fall within the applications of construction (paints and resins), automotive/transportation, and electronics. The summer samples contained the greatest averages of plastic debris, and the drains located in busy pedestrian areas were associated with the highest debris counts. The results support pedestrian traffic as the main driver of plastic debris accumulation in urban London stormwater drains, which is controlled by seasonal weather conditions.
1 Introduction
The global increase in plastic debris is an urgent environmental concern (UNEP, 2023). Plastic pollution has been found in both terrestrial and aquatic environments, and its presence has been widely associated with a broad range of detrimental effects. These effects vary from micro-level disruptions in cellular functions of aquatic organisms (Issac and Kandasubramanian, 2021), to macro-level ecosystem interactions and instability (Kumar et al., 2021). The ubiquity of plastic pollution serves as a marker of modern human consumption and disposal behaviors that began during the Great Acceleration, which is currently considered the base of the proposed Anthropocene epoch (Broadgate et al., 2015; Head et al., 2022).
Under the most optimistic scenario, it is estimated that 710 million tonnes of plastic will enter the environment between 2016 and 2040 (Lau et al., 2020). Although various sources contribute to plastic pollution in aquatic environments, 80% of anthropogenic litter has been found to originate from land-based sources (da Costa et al., 2016; Coyle et al., 2020). The most prevalent types of land-based sources include, but are not limited to, littered waste (van Emmerik et al., 2023), ineffective waste management systems (Jambeck et al., 2015), stormwater runoff from urban areas (Grbić et al., 2020), industry spillage causing the release of plastic debris (Corcoran et al., 2020), atmospheric deposition (Smyth et al., 2021), and agricultural practices (Huang et al., 2020). Urban areas are major contributors of plastic pollution. Impervious surfaces allow plastic litter from sidewalks, streets, and open areas to be transported by runoff into stormwater drains and ponds (Shruti et al., 2021; Baker et al., 2022). Stormwater can contain plastic debris of various sizes that enter storm drains and are ultimately discharged into nearby natural catchments (Browne et al., 2010; Leslie et al., 2017). A number of litter removal devices have been engineered to trap trash in stormwater basins, such as bioretention cells, trash wheels, and catch basin inserts (Lau et al., 2001; Ambrose and Winfrey, 2015). These innovative capture devices typically trap macroplastics (MaPs; >5 mm) but allow for the transfer of microplastics (MPs; <5 mm) into natural watercourses.
We investigated the number, types, and sources of plastic debris items that are normally transferred from terrestrial to aquatic settings through urban stormwater drains. The debris was captured in LittaTrap™ devices provided by Enviropod International (https://www.enviropod.com). Our main objectives, in consultation with our collaborators from The City of London, were to: 1) Compare the efficiency of the standard 5 mm mesh LittaTrap™ basket to the 1 mm mesh performance liner in trapping large microplastic (1–5 mm) particles, 2) Determine whether seasonality, weather conditions, and human activity affect plastic debris abundance, and 3) Identify the main debris sources by considering polymer composition and item applications.
2 Materials and methods
2.1 Study area
The study took place within the downtown core of London, Ontario, Canada, through which the Thames River flows (Figure 1A). The river, known as Deshkaan Ziibi (Antler River) by the Anishnaabe peoples, is approximately 273 km long with a total drainage basin of 5,825 km2. The Upper Thames River is composed of north, middle, and south branches that converge into the Lower Thames River, which flows into Lake St. Clair (Figure 1B). The city of London, with a population of 422,324 in 2021 (Statistics Canada, 2023), offers garbage, recycling, yard waste, and food waste collection, and has three Envirodepots (recyclables, yard waste) and one landfill site. Accepted plastics for recycling include plastic containers, plastic bottles, and tubs with RIC #1 through #7. Not all plastic items are recyclable in London, such as expanded polystyrene, and plastic bags, straws, cutlery, and wrap.
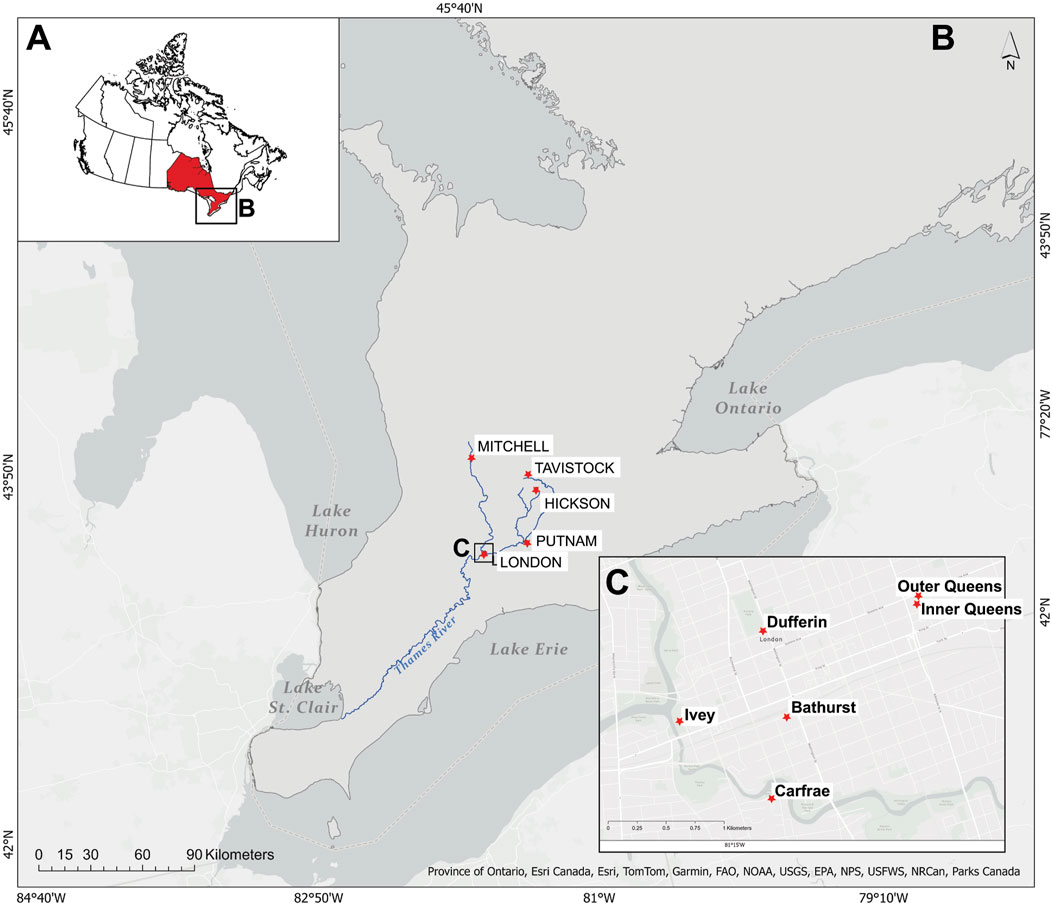
Figure 1. (A) Location of the study area in southern Canada. (B) Location of London and the Thames River in relation to the Great Lakes Huron, Ontario, and Erie in North America. The white dashed line transecting each lake marks the boundary between Canada on the north and the United States to the south. (C) Location of each studied stormwater drain in London.
2.2 Sample collection
Samples were collected seasonally from six stormwater drains within the downtown core (Figure 1C; Supplementary Datasheet 1). These drains were classified as high priority zones by The City of London based on the abundance of MaPs found in previously installed patented LittaTrap™ baskets. Each trap, composed of a mesh liner with 5 mm openings, is designed to act as a catch basin to prevent MaPs and other debris items from entering the storm drain system (Supplementary Datasheet 1). The Dufferin stormwater drain is situated on the traffic- and pedestrian-heavy Dufferin Road, which borders the south end of Victoria Park. This downtown park is the site of numerous festivals and events throughout the year, but particularly during the warm, summer months. The Inner and Outer Queens stormwater drains are both located in a parking lot behind an addiction treatment center (e.g., methadone, alcohol, benzodiazepine). The Outer Queens drain is situated at the lot’s northeast corner, roughly 70 m from the back of the building, whereas the Inner Queens drain is within 10 m of the building. The Bathurst drain is located on Bathurst Street in front of a Salvation Army shelter and community centre. The Ivey Park drain is located at the center of a children’s splash pad, approximately 50 m east of the Thames River and 40 m south of Kensington Bridge on traffic-heavy Riverside Drive. The Carfrae drain is the only site in a residential area, located 40 m south of the Thames River.
We collected the debris that accumulated in the standard, 5 mm mesh LittaTrap™ baskets in October 2021 following a 22-day deployment and compared the results with debris collected seasonally from 1 mm mesh performance liners. The samples captured in the 5 mm mesh are henceforth referred to as the “standards.” The performance liners with 1 mm openings were installed in each LittaTrap™ to determine the effectiveness of large microplastic capture (1–5 mm) for a 22-day period, once per season: i) November 25 to 16 December 2021 for autumn, ii) March 10 to 31 March 2022 for winter, iii) May 26 to 16 June 2022 for spring, and iv) August 25 to 14 September 2022 for summer. Debris that accumulated during each sampling period was removed and emptied into 22L stainless steel cans with locking lids to avoid airborne plastic contamination of the sample. All cans were transported back to the laboratory for debris processing.
2.3 Sample processing
During the first stage of processing, the debris from each can was poured onto a 45.7 × 61.0 × 2.5 aluminum tray and any visible MaPs and other anthropogenic items were removed from the organic material (e.g., leaves, sediment), rinsed with reverse osmosis (RO) water, placed in aluminum pie plates, covered with aluminum foil, and placed in a drying oven set to 60°C for 24 h. The remaining debris was placed back into the can and was processed using a density separation method similar to the U of T Trash Team’s (https://uofttrashteam.ca) detailed waste characterization protocol (Sherlock et al., 2023). Each can was filled with RO water up to ¾ full. The debris-water mixture was thoroughly stirred with a large metal spoon and was left to settle for 3 min to allow low-density particles to float to the water surface. Any anthropogenic debris visible at this second stage was also removed and added to the items stored from stage 1. A 28 cm diameter stainless steel sieve was used to press into the sample toward the bottom of the can. This forced additional low-density material to rise between the outside edge of the sieve and inside wall of the can while trapping large organic debris items at the bottom. The overlying water and small, low-density material in the can were then poured through 5 mm and underlying 1 mm VWR USA Standard Testing Sieves. This process was repeated three times. Each time, the items captured in the 5 mm sieve (macroplastic size) and in the 1 mm sieve (large microplastic size) were rinsed, covered with aluminum foil and dried in a laboratory oven at 60°C for a minimum of 24 h. Once all anthropogenic items from the two size categories were dry, each particle was visually or microscopically identified, measured, and recorded (Figure 2).
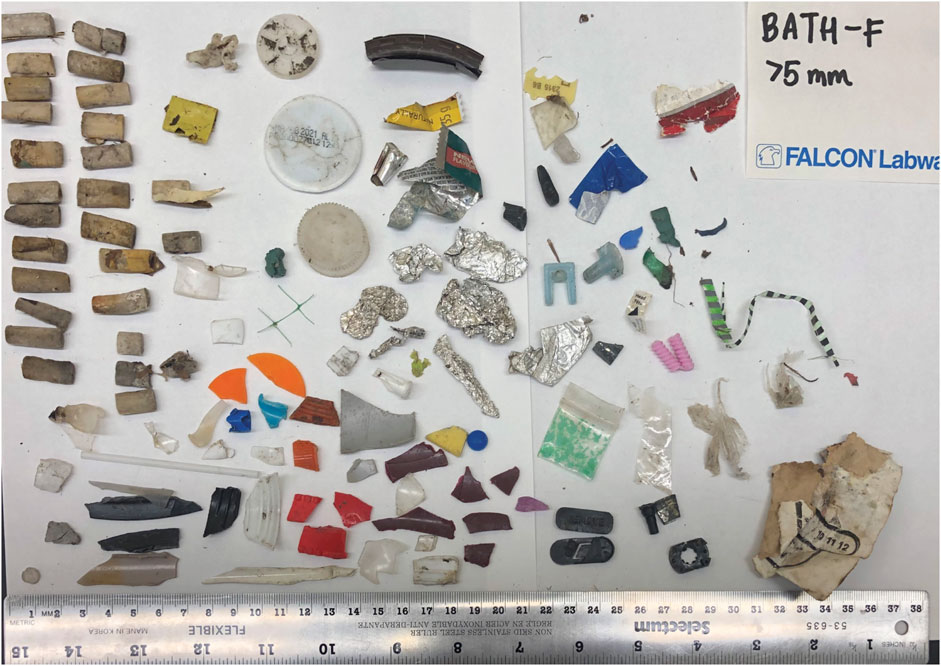
Figure 2. Examples of macroplastic debris items studied from the Bathurst stormwater drain LittaTrap™. Cigarette butts, fragments, intact debris (e.g., bottle cap), and non-plastic debris (foil) are separated into groups in this sample.
Macroplastic items were categorized using a visual characterization method. This method involved recording known items (e.g., cigarette butts, bottle caps, food wrappers), using attached labels or markings for identification, and conducting online searches for comparison by using Resin Identification Codes (RIC). For microplastic particles, each petri dish containing a processed sample was examined using a Nikon SMZ1500 stereomicroscope (3.75x to 258x magnification), each particle was photographed using a Nikon DXM1200 digital camera and was measured in NIS elements D 4.30. Each particle was removed with a stainless-steel dental pick or tweezers and was categorized according to general colour, regardless of shade (e.g., red, blue, brown), size, and type (pellet, fragment, intact fragment, foam, fibre, film, rubber, and non-plastic). The type categories in this study are the most common categories used for plastic debris items in the published literature. Table 1 displays the characterization method used to create the database for this study. Each particle was placed onto double-sided 3M adhesive tape adhered to a glass microscope slide and was circled with a black, fine-tip permanent marker. Once a slide was filled with particles, it was stored within an air-tight box.
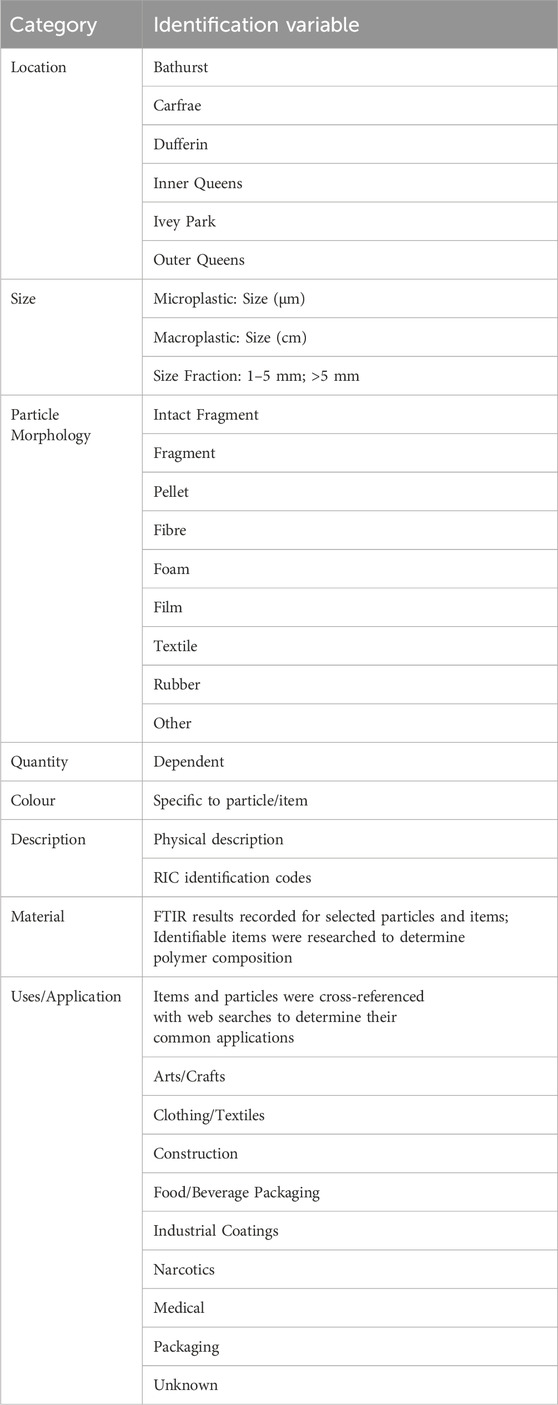
Table 1. Categories and identification procedure used to describe each macroplastic item and microplastic particle found in the LittaTrap™ samples.
2.4 Compositional analysis
A total of 206 1–5 mm size particles were selected using an online random number generator to be analyzed by Fourier Transform Infrared Spectroscopy (FTIR) at Surface Science Western, London, Canada. Particles were transferred to a diamond compression cell, condensed, and analyzed using a Bruker Tensor II spectrometer in transmission mode, using a Hyperion 2000 microscope. Large MPs were analyzed using a micro-attenuated total reflectance (mATR) attachment equipped with a germanium crystal. Spectra were collected from wavenumbers 4,000 to 600 cm−1 with a resolution of 4 cm−1. The results were baseline corrected, and also corrected for possible contamination from water vapour, carbon dioxide, and the adhesive tape.
2.5 Statistical analysis
Bar and pie graphs were created in Microsoft Excel for Microsoft 365 MSO, and maps were made using ArcGIS Pro 3.3. The scatter plot and statistical analyses comparing the number of MaPs and MPs with total precipitation, average wind speed, and seasonality were conducted using R version 4.3.1 & RStudio 2023.09.1 Build 494. The total precipitation and average wind speed data were accessed from (https://london.weatherstats.ca).
2.6 Quality assurance and quality control
A total of 16 procedural laboratory blanks were collected to determine the levels of contamination during working hours in the laboratory. The laboratory blanks were acquired by placing empty glass petri dishes on counters during processing and during microscopic examination of individual samples. The petri dishes were examined for MPs and the average number of particles, which were only fibers, was subtracted from each sample. All processing tools were thoroughly rinsed with RO water, dried with compressed air, and covered with aluminum foil when not in use. All laboratory surfaces were wiped with damp cotton towels before and after use, including chairs, work benches, sinks, and metal microscope enclosures. Clean-air measures were enforced using filters and HEPA air purifiers. Individuals entering the lab at any time were required to wear white cotton lab coats.
3 Results
3.1 Macroplastics
3.1.1 Quantification
The morphology of each macro- and micro-particle from every sample was recorded (Supplementary Table 1), and these included fragments (unidentifiable source), intact fragments (identifiable source), foams, textiles (e.g., woven synthetic fabric, rope, line, thread), films (thin, flexible plastics), rubber, and visible non-plastics. A total of 1,450 plastic debris items were counted from all samples (Table 2). The greatest number of MaPs were found in samples from the Bathurst site, with a total of 568 items. Most MaPs were found in the spring (158) and autumn (152) samples (Figure 3A). The Dufferin samples, containing the second-highest count of MaPs (274) contained the greatest number in the summer sample (119) followed by the spring (65). In contrast, the Inner Queens samples, with 267 total MaPs, had the most items in the standard (89) followed by the summer (62). The Outer Queens samples contained 186 MaPs, with the greatest numbers in the summer (59) and spring (51 items). The Carfrae and Ivey Park samples contained lower counts of MaPs overall, with 84 and 71 items, respectively. The Carfrae winter sample contained the majority of its MaPs (28) compared with the other seasons. In contrast to the Bathurst, Carfrae, and Outer Queens sites, the Ivey Park site had the highest number of MaPs in its standard (26 items) (Figure 3A).
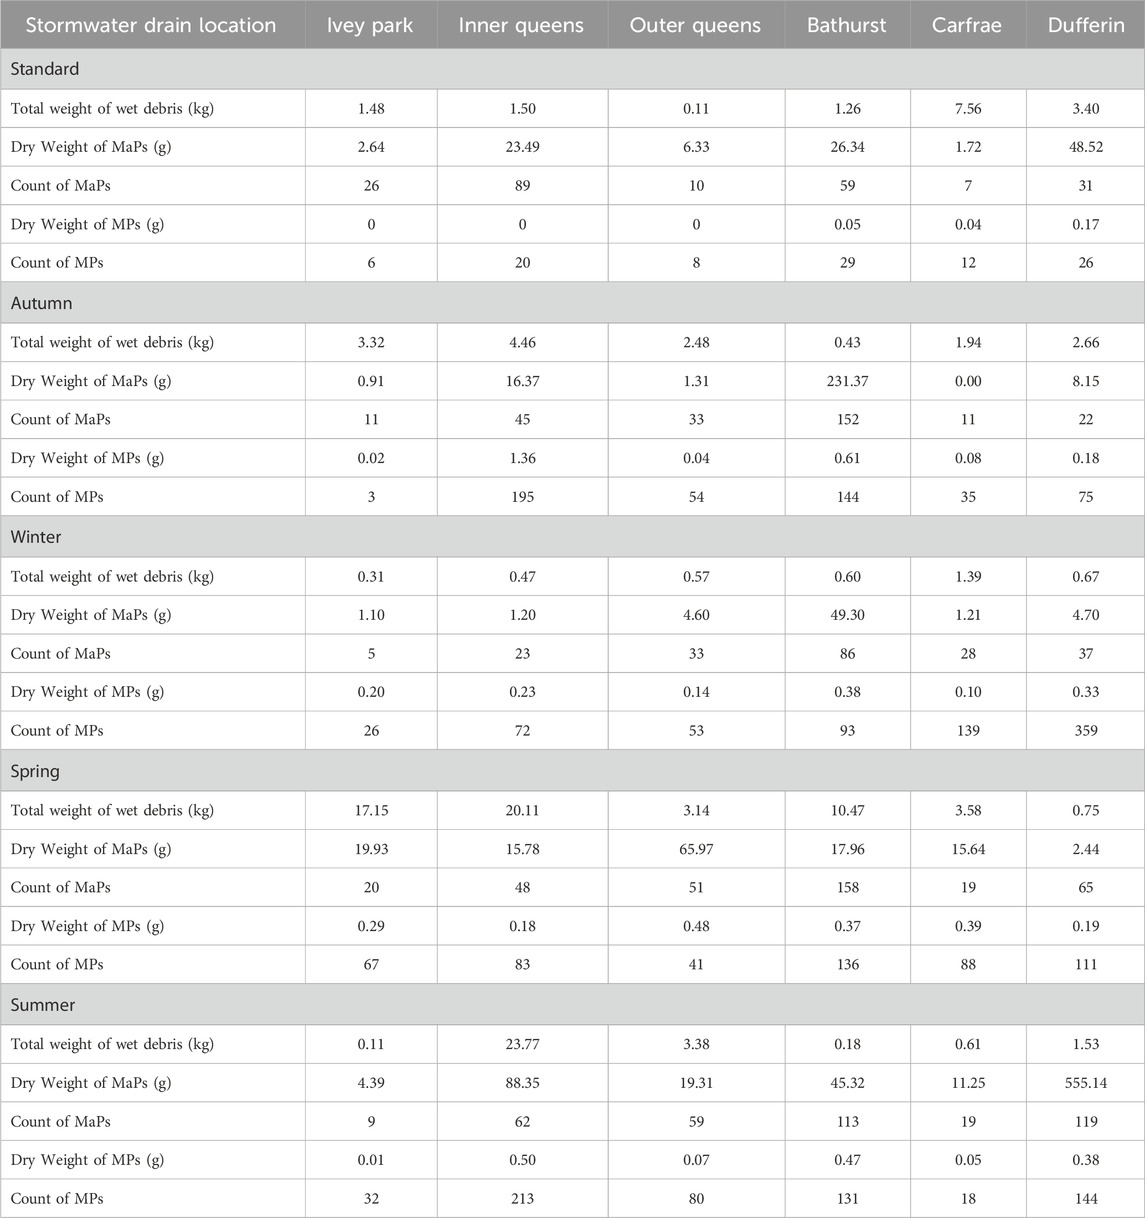
Table 2. Summary of plastic counts and weights from traps at each stormwater drain in the standards and from each seasonal, 22-day period.
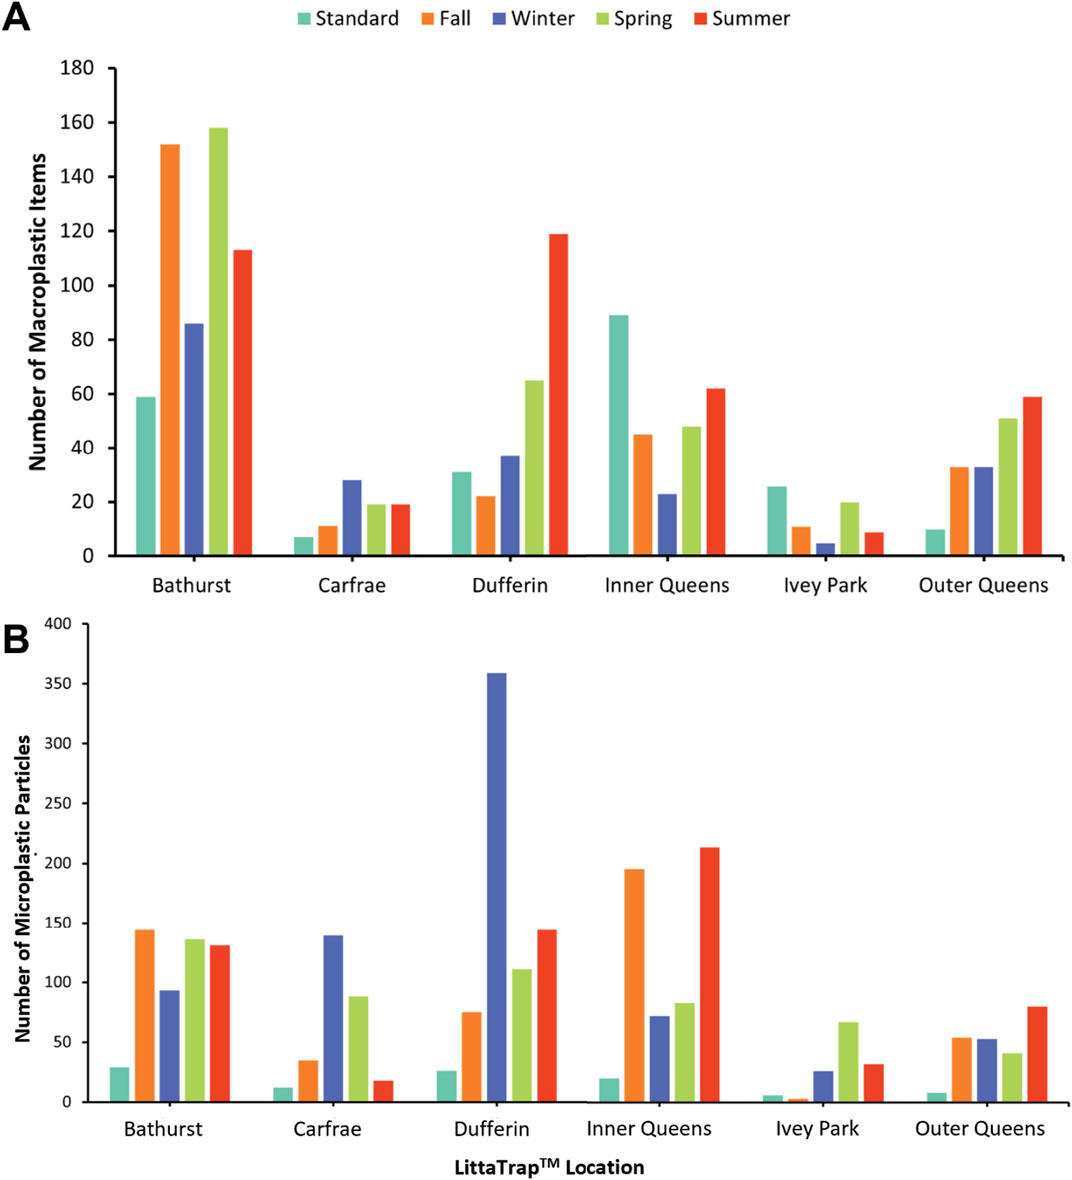
Figure 3. Number of items identified in each trap during each seasonal period (>1 mm mesh size) and in the standards (>5 mm mesh size). (A) Number of macroplastic items and (B) Number of microplastic particles. Note how the Bathurst, Dufferin, and Inner Queens sites have the greatest number of plastic debris items in both size classes.
3.1.2 Morphology, types and polymers
With respect to MaPs, fragments and intact fragments were the most prevalent item types across all sites, with their proportions ranging from 16.7% to 61.3% per site (Figure 4A). Visual analysis of all debris revealed a diverse range of items (Figure 5). Cigarette butts were most common, constituting 455 (31.4%) of the total items surveyed. Fragments and wrappers were also common, accounting for 313 (21.6%) and 121 (18.3%) of the total items, respectively. Using the visual polymer identification process, 572 items (39.4%) were unidentifiable. Of the remaining 878 items, cellulose acetate (cigarette butts) was the most common polymer, making up 51.8% of the total (Figure 6A). Polypropylene, HDPE, and EPS were also prominent, at 10.5%, 9.3%, and 5.9%, respectively. Other polymers represented by at least 12 items included rubber, polycarbonate (PC), polyvinyl chloride (PVC), PET, PE (general), alkyds, acrylic, and linear low-density polyethylene (LLDPE).
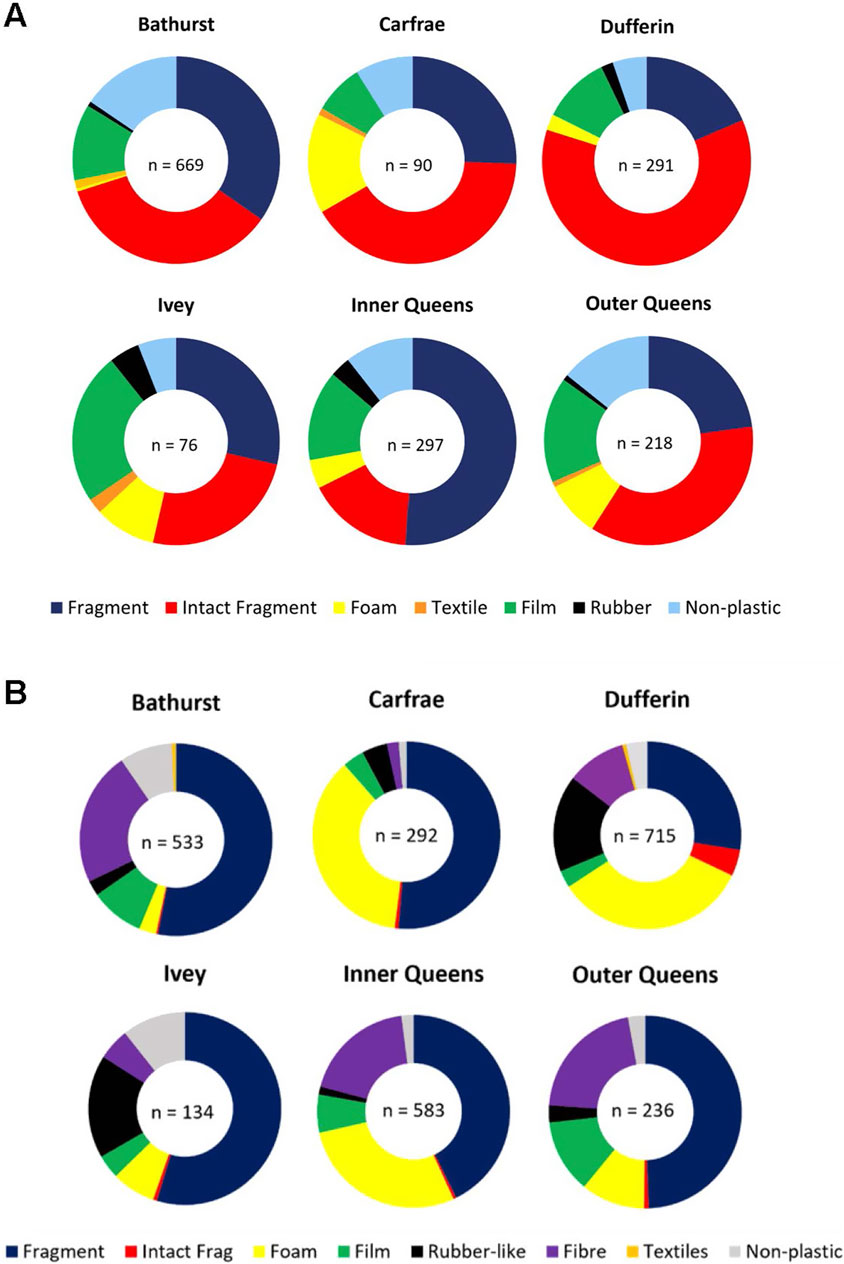
Figure 4. Graphs showing the relative proportions of different (A) macroplastic and (B) microplastic morphologies at each LittaTrap™ location for all seasonal periods combined.
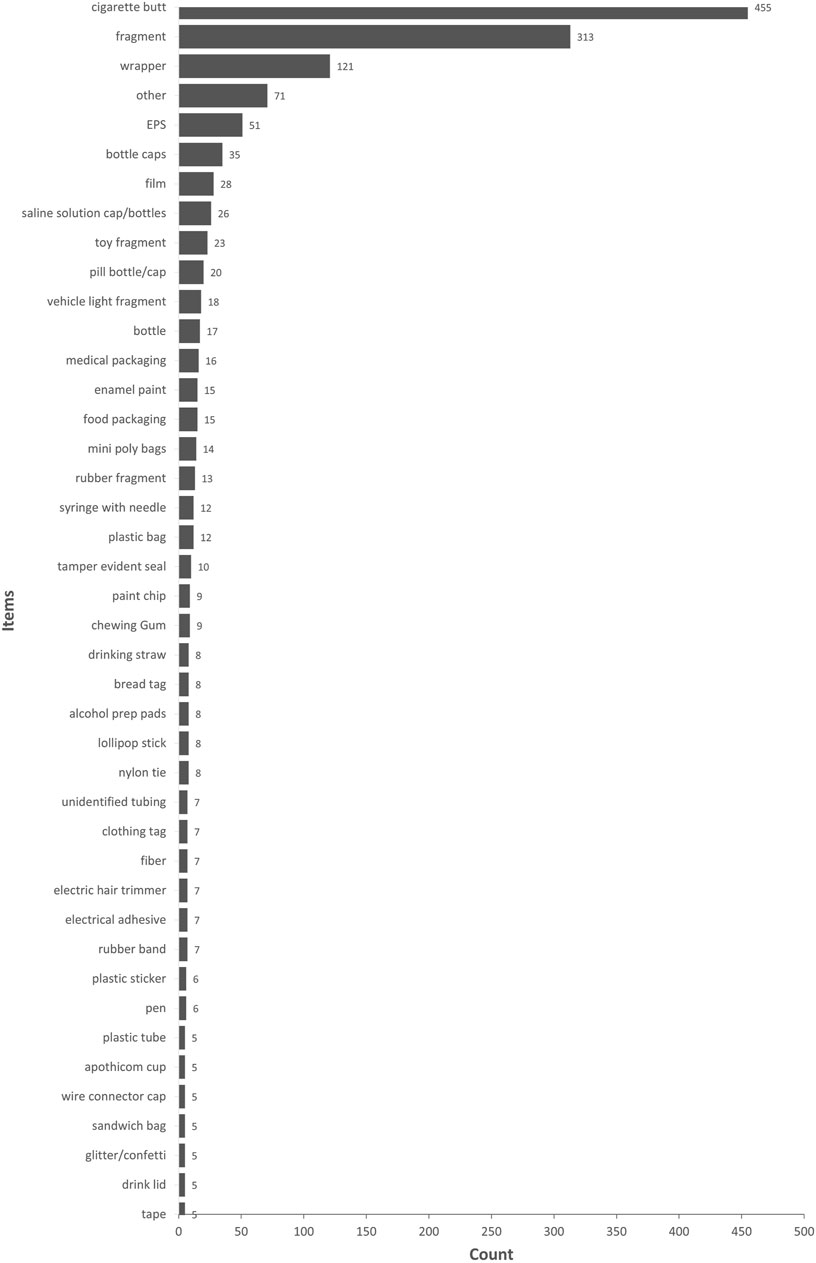
Figure 5. Plastic items determined for macroplastic debris items found in LittaTrap™ devices from all seasonal periods and all locations combined.
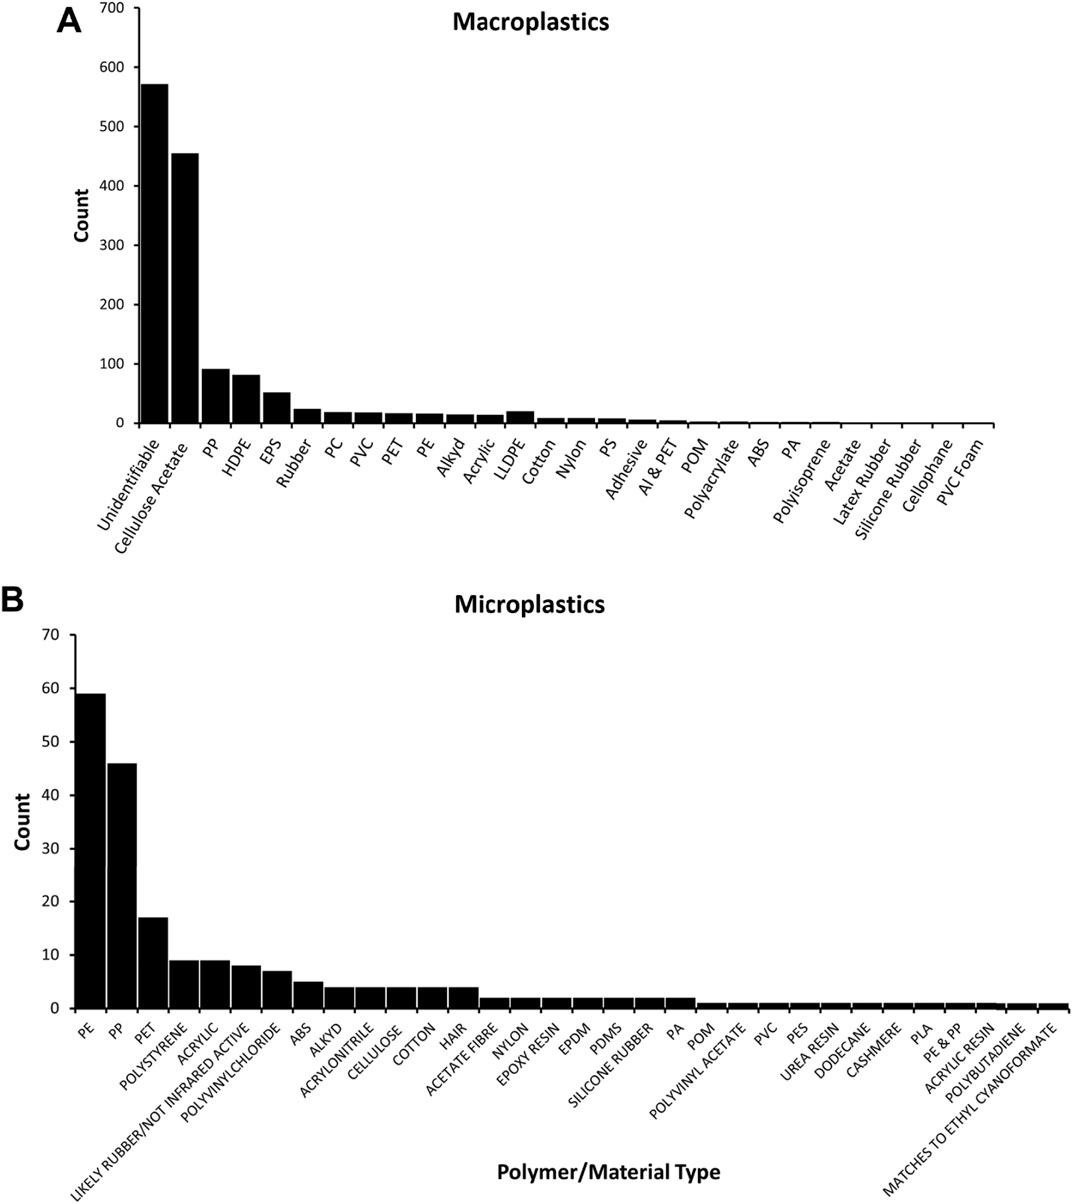
Figure 6. Composition of plastic debris items as determined by: (A) visual identification method for MaPs and (B) FTIR for particles between 1 mm and 5 mm.
3.1.3 Applications
Macroplastics that were able to be linked to a specific application are presented in Figure 7. The most common application is “Smoking,” which includes cigarette butts, coated filter papers, and lighters. The second most common application is “Food/Beverage Packaging”, and includes candy wrappers, bottle caps, bottles, lollipop sticks, drink lids, and packaging film. In descending order of abundance, the following applications are represented by the macroplastic debris: Narcotics (syringes, saline solution bottles/caps, apothicom cups, tourniquet bands); Packaging (mini poly bags, sandwich bags, plastic bags, bubble wrap, packing foam); Household (push pins, toys, pens, electric hair trimmers, clips); Medical (pill bottle caps, medical packaging, surgical masks, prep pads, pill bottles); Construction (wire connector caps, nylon ties, tile spacers, stakes, tubing, duct tape); and Non-food related wrappers.
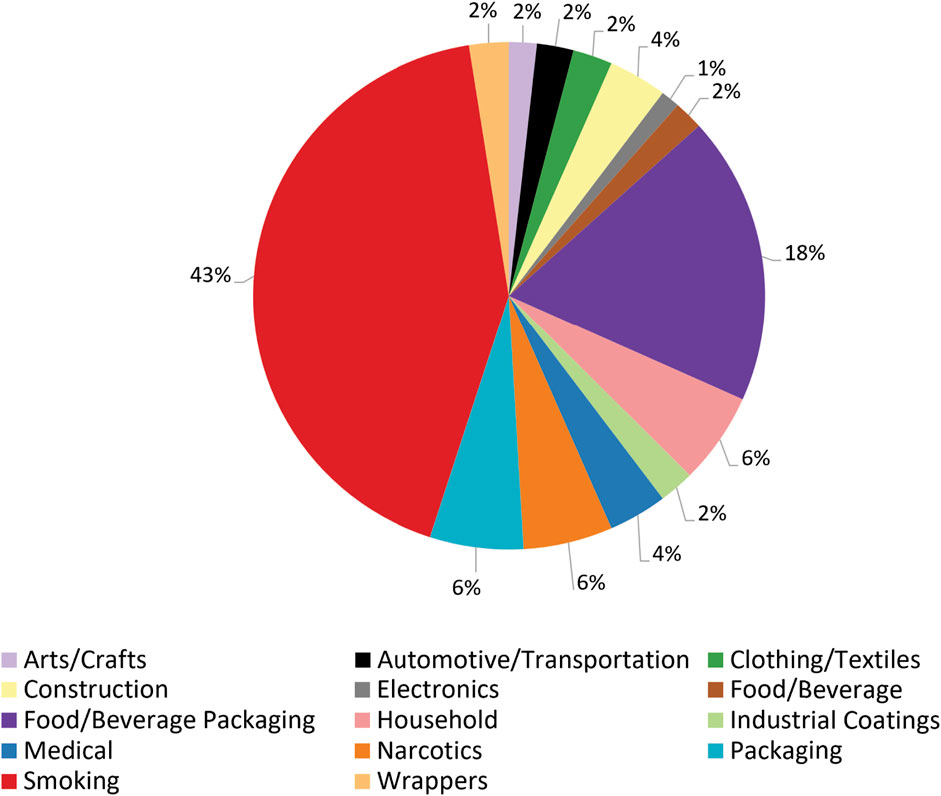
Figure 7. Pie graph showing the applications represented by the identified MaPs found in traps from all seasons and in the standards.
3.2 Microplastics
3.2.1 Quantification
Similar to the macroplastic proportions, the greatest microplastic counts were in samples from the Bathurst, Dufferin, and Inner Queens sites (Figure 3B). Of the Bathurst samples, the majority of the MPs were found in the autumn sample (144), followed by the spring (136) and summer (131). In contrast, the Dufferin samples displayed the highest microplastic counts in the winter sample (359), followed by the summer (144), and spring (111). Samples from the Inner Queens site contained 213 particles (summer), 195 particles (autumn), and 83 particles (spring). Similar to the Dufferin site, the Carfrae samples had the highest microplastic count in the winter (139), and the second-highest number of MPs was in the spring sample (88). The Outer Queens site contained relatively consistent microplastic counts across the seasons, with the highest count in the summer sample (80), followed by autumn (54), winter (53), and spring (41). The Ivey site had low microplastic counts throughout all seasons with the greatest number of MPs in the spring (67), followed by the summer sample (32).
3.2.2 Morphology and polymers
Much like the macroplastic results, fragments were the most common morphology of microplastic, accounting for 45.0% of the total MPs (Figure 4B). Foams and fibres were also widespread, comprising 23.3% and 15.4%, respectively. A total of 206 MPs were selected for FTIR using a random number generator, and 168 were synthetic polymers. The most common polymers were PE (59 particles) and PP (46 particles) (Figure 6B). Seventeen particles were composed of PET, whereas polystyrene (PS), acrylic, PVC, and acrylonitrile butadiene styrene (ABS) were determined from 9, 9, 8, and 5 particles, respectively. Other less common polymers, represented by 2-4 fragments were alkyds, acrylonitrile, acetate, nylon, epoxy resin, ethylene propylene diene terpolymer (EPDM), and silicone rubber. Seven additional polymers were represented by 1 particle each (Figure 6B). Representative spectra from each category are included in Supplementary Datasheet 2.
4 Discussion
4.1 Effectiveness of 1 mm vs. 5 mm LittaTrap™
A comparison of the autumn (>1 mm) and standard (>5 mm) samples revealed no correlation for MaPs, but the numbers of MPs at all but Ivey Park were greater in the autumn sample than in the standard (p-value of 0.035 using a Welch t-test). The Ivey Park sample, however, contained only 6 particles in the standard and 3 particles in the autumn sample, which are not statistically reliable numbers. As expected, the results indicate that installing a finer mesh in the LittaTrap™ devices increases the capture of plastic debris from runoff. In terms of efficiency, the 1 mm mesh was 5.0, 3.0, 3.0, 9.8, and 6.75 times more effective at capturing MPs in the Bathurst, Carfrae, Dufferin, Inner Queens, and Outer Queens samples, respectively, than the 5 mm size mesh. Although the larger, 5 mm mesh did capture some MPs, this occurred mainly through entanglement with organic debris or blockage of the mesh with MaPs. Our collaborators at The City of London were concerned that installing the finer, 1 mm mesh would result in overflow at the drain site. This, however, did not happen throughout the 22-day sampling periods, which demonstrates that no additional maintenance would be required to capture a greater amount of plastic waste. This finding may not be the same in urban centers with population densities greater than that of downtown London.
4.2 Effects of seasonal variation
The movement of urban plastic debris into aquatic systems is controlled by humans and their activities, as well as weather conditions, such as precipitation amount and wind speed (Tasseron et al., 2023). These factors are heavily controlled by seasons, particularly in locations such as London, Ontario, that have a temperate climate. Although the number of data points for each location (one per season) precluded determination of a statistically significant result, descriptively, the means vary (Figure 8). There appears to be a seasonal pattern in macroplastic and microplastic accumulation, with the highest means recorded for the summer and spring, followed by autumn and winter. Increased input of plastic debris during the spring and summer can be attributed to warmer temperatures leading to increased pedestrian traffic, more outdoor activities with single-use plastics, and release of items during the spring snowmelt. Eslami et al. (2023) found that the summer months generate the most waste due to vacations and social gatherings. However, a comparison of the number of MaPs in the standards collected on October 25th and the 1 mm mesh autumn samples collected on December 16 shows that temperature alone cannot account for the relative number of MaPs across all sites. The standards from Dufferin, Inner Queens, and Ivey Park contained 1.4 times, 2.0 times, and 2.4 times more MaPs compared to the autumn samples, but the Bathurst and Outer Queens standards contained 2.6 times and 3.3 times fewer MaPs compared to their autumn counterparts.
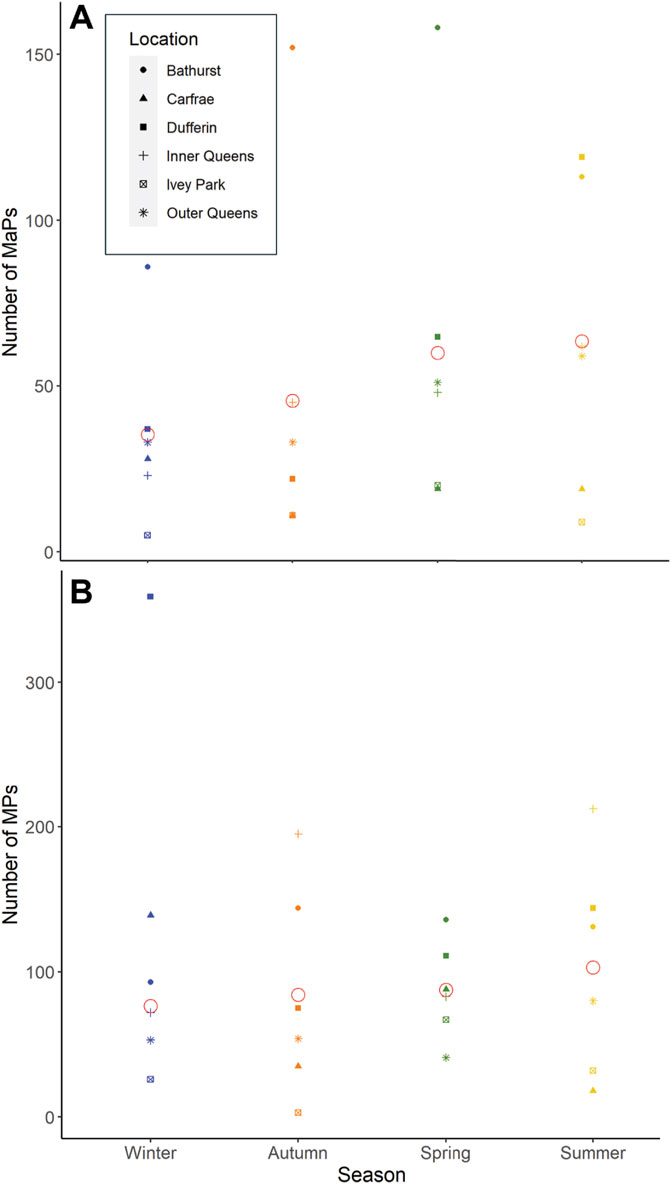
Figure 8. Graphs displaying the number of (A) macroplastic and (B) microplastic items in LittaTrap™ devices during each seasonal period at each location. Note how the summer and spring samples have the greatest means of plastic debris.
We investigated the relationship between number of plastic items, average windspeed (km/h), and total precipitation during each 22-day period using data from (https://london.weatherstats.ca). There were no correlations found between average windspeed and abundances of MaPs (r = 0.154; p-value = 0.41), nor MPs (r = 0.216; p-value = 0.25). Each 22-day period may not have been long enough to capture this relationship, indicating the complexity of variables in urban locations. In terms of total precipitation and macroplastic abundances, a positive relationship was expected, but samples from all sites and seasons differed significantly from the standards as well as from one another (r = 0.05; p-value = 0.77). A lack of correlation between precipitation and MaPs may be explained by diverse stormwater runoff characteristics, wherein flow direction and intensity, land use, and drainage systems can influence deposition. Bauer-Civiello (2019) studied plastic debris items that were transported from urban storm drains into a tropical river in Australia. Fewer debris items were found during the wet season than in the post-wet season. The author suggested that the frequency at which plastic and other debris items accumulate may be dependent on variance in rainfall rather than total amount. In addition, item transport mechanisms are complex and could cause debris to adhere to rough surfaces such as vegetation and soil, compared with asphalt.
A greater amount of precipitation was also expected to lead to a higher number of MPs (Axelsson and van Sebille, 2017; de Jesus Piñon-Colin et al., 2020). The seasonal precipitation totals were compared with the total number of MPs in each sample from all sites and no correlation was determined (r = −0.166; p-value = 0.38). A total of 115.8 mm of rain fell during the standard sampling period, whereas 72.7 mm of rain fell during the autumn sampling period. However, all sites, except for Ivey Park, contained more MPs in the autumn samples compared to the standards, which would not be expected if abundances were controlled by amount of precipitation. This may be explained by routine maintenance and cleaning of urban areas through city efforts. For example, at Ivey Park, the regular use of the splash pad in which the drain is located would lead to increased flushing of plastic particles during the warmer months.
4.3 Human influence on number of plastic debris items
The population of London, Ontario grew by 5.1% between 2015 and 2020 and is forecasted to grow by another 5% from 2020 to 2025 (Watson & Associates Economists Ltd, 2022). With population growth, a forecasted increase in retail and commercial spaces will follow. These increases will cause greater pressure on stormwater management systems, as they divert run-off and associated debris into urban drains. The debris, which is largely composed of plastic, will increase and items will be washed into the Thames River. Of all sampling sites, the Dufferin location was expected to contain the most plastic debris, as it is located near a busy main road and a frequented park in the downtown core. This was the case for MPs, but not for MaPs, which were most abundant overall in the Bathurst samples. This may be a result of the Bathurst site’s proximity to a homeless shelter and community centre. The area has constant pedestrian traffic, which would be associated with greater littering of trash. In contrast, the Dufferin site contained a notably high number of MaPs in the summer sample only. This result can be explained by the increase in outdoor activities (e.g., festivals, road races) and pedestrians in the central downtown core where the Dufferin site is located.
The Inner Queens and Outer Queens sites are in the same parking lot, and except for in the standards, the macroplastic abundances are similar, but the number of MPs between sites is not. The variations between the number of MPs captured from the two sites could be due to the location of the Inner Queens drain in the center of the parking lot rather than at the lot’s corner where the Outer Queens site is situated. In contrast, the Carfrae site is in a residential area and thus, it was correctly hypothesized that fewer MaPs would be found at this location. It was also the site with the third fewest number of MPs. Similarly, the Ivey Park site contained very little plastic debris, with the lowest counts of MaPs and MPs overall. This result was also anticipated because it is in the middle of a children’s splash pad. The lowest number of MaPs and MPs at Ivey Park were collected during the summer sampling period, which coincides with the greatest use and regular cleaning of the splash pad for health and safety purposes.
4.4 Potential sources of plastic debris
The predominant macroplastic waste items trapped in the London, Ontario stormwater drains belonged to the Smoking and Food/Beverage packaging applications (Figure 7). It is estimated that over 4 trillion cigarette butts, composed of cellulose acetate, are littered each year globally (Webler and Jakubowski, 2022). All sample sites in the present study contained cigarette butts, with the highest proportions found in the Bathurst (177; 38%) and Outer Queens (65; 14%) traps. This finding is consistent with the observations made by Healton et al. (2011), in which cigarettes accounted for 25%–50% of all litter collected from roads and streets. Our results are consistent with those of Arturo and Corcoran (2022), who, in a study of 21,952 macroplastic debris items collected from 66 beaches of the Laurentian Great Lakes, determined that the most frequently identified parent companies were producers of foods and beverages, as well as cigarettes. The same item types accounted for 24% of the branded debris in a recent global audit of MaPs in the environment (Cowger et al., 2024). In addition, the Global Ocean Trash Index and the Great Canadian Shoreline Cleanup (GCSC), which are two programs that operate continually, also show that cigarette butts and food packaging are the most commonly found plastic items (Ocean Conservancy, 2023; Ocean Wise, 2023).
The predominance of food and beverage packaging in waste audits underscores the challenge with single-use plastics. The World Economic Forum (2016) estimated that 95% of food packaging is thrown away after a single use. We found that white MPs constituted the greatest percentage of total MPs in the mesh liners (29.2%) (Supplementary Table 1). Giacovelli (2018) considered the origins of white and transparent MPs found in stormwater to be derived from single-use plastics and referred to these as “white pollution.” The widespread production of single-use plastics for food packaging is driven by the demand for convenience by the consumer, low cost for the supplier, and lengthened preservation of the product. The onus should be on plastic producers to create alternatives to single-use plastics for their food packaging, such as recyclables, sustainable substitutes, additive manufacturing products, or reusable materials (Cruz Sanchez et al., 2020; Diggle and Walker, 2020; Gillies, 2020).
Rubber-like particles, characterized by their elasticity and irregular margins, were found at four of the six drain sites (Carfrae, Dufferin, Inner Queens, and Ivey) (Supplementary Table 1). Rubber-like particles accounted for 8% of total MPs and 2% of total MaPs. The microplastic polymers consistent with rubber include EPDM, silicone rubber, and polybutadiene, as well as non-infrared active black particles that texturally resemble rubber. Black, rubber-like macroplastic particles (Figure 9A) were included in the automotive application because these types of fragments have been considered tire- or road-wear pollution by numerous researchers (Kole et al., 2017; Svensson and Andersson-Sköld, 2021). In contrast, translucent rubber-like particles (Figure 9B) found in the Ivey Park samples could represent degraded silicone caulking sourced from within the park’s playground. These rubber-like particles were included in the Construction application, which accounts for 4% of all macroplastic applications. Four microplastic particles were composed of silicones, which are also considered to be construction related.
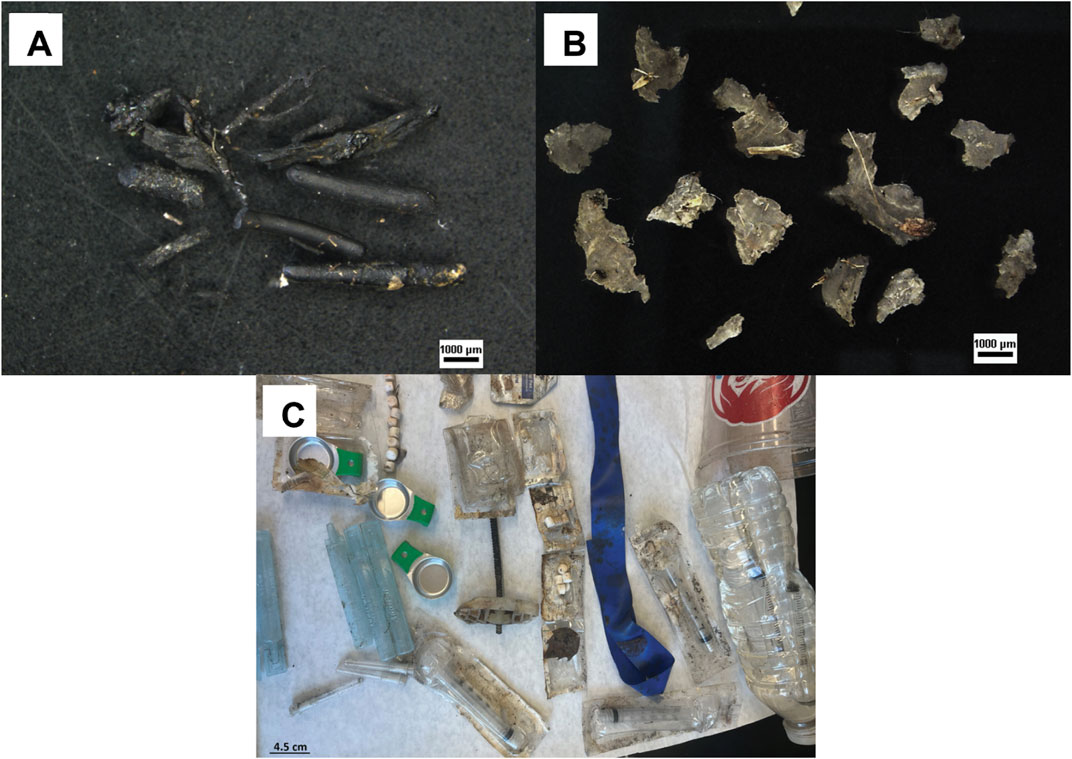
Figure 9. Characteristics of plastic debris indicative of sources. (A) Black, rubber-like microplastics are included in the Automotive application, as they may be tire- or road-wear particles. (B) Transparent rubber-like microplastic particles found in the Ivey Park samples that may be associated with breakdown of silicone caulking (Construction application). (C) Common macroplastic items associated with the Narcotics application in the Bathurst summer sample.
The Narcotics application accounts for 6% of the total MaPs found in this study. Narcotics-related paraphernalia were identified in samples from the Bathurst, Dufferin, Inner Queens, and Outer Queens sites. This covered a broad range of items, including sterile needle filters, syringes, syringe packaging, saline solution bottles, tourniquet bands, apothicom cups, and prescription bottles (Figure 9C). The Inner Queens site contained the most drug-related debris, and while collecting samples from this location, we witnessed individuals actively involved in drug use and purchasing. The presence of narcotics-related items provides a key example of how public health and environmental issues intersect.
Macroplastic fragments composed of enamel, silicone and paints were found in samples from the Carfrae, Dufferin, Inner Queens, Ivey, and Outer Queens sites. These items form part of the Industrial Coatings application. Ten microplastic particles (alkyds, silicone rubber, and resins) and two synthetic, mineral-organic particles (polydimethysiloxane; PDMS) also reflect this category (Figure 6B). Alkyds are commonly in the form of paint chips, which have been identified globally (Gaylarde et al., 2021). The abundance of these particles in both MaPs and MPs of the present study is not surprising because most structures, signs, crosswalks, roads, and vehicles are covered with paints or coatings.
4.5 Summary
The results of this study prove that the 1 mm LittaTrap™ performance liner is much more effective at trapping 1–5 mm MPs in stormwater drains than the standard 5 mm liner. The quantity and types of plastic debris trapped in stormwater drains are predominantly influenced by human activities, which are partially dependent on seasonal weather conditions. The winter samples are associated with the lowest number of MaPs and MPs at most sites, which can be directly related to decreased pedestrian traffic and outdoor public events when the temperatures are cold and the ground has more snow cover, which immobilizes plastic debris. Although there was a pronounced seasonal signature in overall abundances of plastic debris, there was no statistical correlation between average wind speed, total precipitation, and plastic debris amounts. Continuous monitoring of plastic debris in each stormwater drain over a multi-year period would be needed to unravel the complexity of these interactions.
A crucial driver of plastic debris accumulation in urban stormwater drains is the location of the drain itself. The sites with the greatest amounts of both MaPs and MPs were Bathurst, Dufferin, and Inner Queens, which are all associated with heavy pedestrian traffic. The Bathurst site is located next to a homeless shelter, the Dufferin site next to a park in the downtown core where festivals, road races, and other events take place, and Inner Queens is in the middle of a parking lot frequented by narcotics users and buyers. The sites with the lowest amounts of plastic debris are in a children’s splash pad (Ivey), on a quiet and high-sloping street (Carfrae), and on the very edge of a parking lot (Outer Queens). The most common identifiable macroplastic items were related to the tobacco, food and beverage, and narcotics industries. The predominance of PE and PP MPs indicates that various types of packaging constitute common microscopic debris. Tire and road wear and construction activities account for the bulk of the remaining MPs analyzed by FTIR.
In the future, expanding the geographic area of the study would be beneficial. By introducing additional LittaTraps™ within and beyond the city core, other variables that potentially control plastic deposition could be tested. Some of these include land use, topographic slope, and percentage of impervious surfaces surrounding each drain. Collecting and analyzing water samples from stormwater pipe outlets that discharge into the Thames River and its smaller tributaries would also offer valuable assessment of the proportion of plastic waste that is escaping into natural watercourses. Combining our data with future results from other cities will provide a more comprehensive understanding of how plastic debris is transferred from terrestrial to aquatic settings. Our findings will be used for public awareness campaigns with the goal of mitigating plastic pollution in London, Ontario.
Data availability statement
The datasets presented in this study can be found in online repositories. The names of the repository/repositories and accession number(s) can be found in the article/Supplementary Material.
Author contributions
NK: Conceptualization, Data curation, Formal Analysis, Investigation, Methodology, Resources, Software, Visualization, Writing–original draft. PC: Conceptualization, Funding acquisition, Investigation, Methodology, Project administration, Resources, Software, Supervision, Validation, Writing–review and editing.
Funding
The author(s) declare that financial support was received for the research, authorship, and/or publication of this article. This project was supported by a Natural Sciences and Engineering Research Council (NSERC) Discovery Grant and an Alliance Grant (Plastics Science for a Cleaner Future) to PC. The latter funding source comes through the project, Source-specific identification, characterization and control of microplastics across a remote, rural and urban gradient (PI: Jill Crossman).
Acknowledgments
The authors wish to thank Patrick Donnelly and Brad Weber from The City of London for helping initiate the project and for their support throughout our research. We are grateful to Barry Orr from The City of London for his valuable knowledge and assistance in the field. We greatly appreciate the help received from Douglas Woolford and Becky Sarazen for their statistical knowledge and FTIR training, respectively.
Conflict of interest
The authors declare that the research was conducted in the absence of any commercial or financial relationships that could be construed as a potential conflict of interest.
Publisher’s note
All claims expressed in this article are solely those of the authors and do not necessarily represent those of their affiliated organizations, or those of the publisher, the editors and the reviewers. Any product that may be evaluated in this article, or claim that may be made by its manufacturer, is not guaranteed or endorsed by the publisher.
Supplementary material
The Supplementary Material for this article can be found online at: https://www.frontiersin.org/articles/10.3389/fenvs.2024.1459259/full#supplementary-material
References
Ambrose, R. F., and Winfrey, B. K. (2015). Comparison of stormwater biofiltration systems in Southeast Australia and Southern California. WIREs Water 2, 131–146. doi:10.1002/wat2.1064
Arturo, I. A., and Corcoran, P. L. (2022). Categorization of plastic debris on sixty-six beaches of the laurentian great lakes, North America. Environ. Res. Lett. 17, 045008. doi:10.1088/1748-9326/ac5714
Axelsson, C., and van Sebille, E. (2017). Prevention through policy: urban macroplastic leakages to the marine environment during extreme rainfall events. Mar. Pollut. Bull. 124, 211–227. doi:10.1016/j.marpolbul.2017.07.024
Baker, N., Sullivan, D., Selbig, W., Haefner, R., Lampe, D., Bayless, R., et al. (2022). Green infrastructure in the great lakes—assessment of performance, barriers, and unintended consequences. U.S. Geol. Surv. Circ. 1469. doi:10.3133/cir1496
Bauer-Civiello, A. M. (2019). From people to reefs: marine debris and plastic pollution in North Queensland. Doctoral dissertation, James Cook University. Available at: https://researchonline.jcu.edu.au/63755/2/JCU_36755_Bauer-Civiello_2019_thesis.pdf.
Broadgate, S. W. W., Deutsch, L., Gaffney, O., and Ludwig, C. (2015). The trajectory of the Anthropocene: the great acceleration. Anthropocene Rev 2, 81–98. doi:10.1177/2053019614564785
Browne, M. A., Galloway, T. S., and Thompson, R. C. (2010). Spatial patterns of plastic debris along estuarine shorelines. Environ. Sci. Technol. 44, 3404–3409. doi:10.1021/es903784e
Corcoran, P. L., de Haan Ward, J., Arturo, I. A., Belontz, S. L., Moore, T., Hill-Svehla, C. M., et al. (2020). A comprehensive investigation of industrial plastic pellets on beaches across the Laurentian Great Lakes and the factors governing their distribution. STOTEN 747, 141227. doi:10.1016/j.scitotenv.2020.141227
Cowger, W., Willis, K. A., Bullock, S., Conlon, K., Wang, M., Erdle, L. M., et al. (2024). Global producer responsibility for plastic pollution. Sci. Adv. 10, eadj8275. doi:10.1126/sciadv.adj8275
Coyle, R., Hardiman, G., and Driscoll, K. O. (2020). Microplastics in the marine environment: a review of their sources, distribution processes, uptake and exchange in ecosystems. Case Stud. Chem. Environ. Engin. 2, 100010. doi:10.1016/j.cscee.2020.100010
Cruz Sanchez, F. A., Boudaoud, H., Camargo, M., and Pearce, J. M. (2020). Plastic recycling in additive manufacturing: a systematic literature review and opportunities for the circular economy. J. Clean. Product. 264, 121602. doi:10.1016/j.jclepro.2020.121602
da Costa, J. P., Santos, P. S. M., Duarte, A. C., and Rocha-Santos, T. (2016). Nanoplastics in the environment – sources, fates and effects. STOTEN 566– 567, 15–26. doi:10.1016/j.scitotenv.2016.05.041
de Jesus Piñon-Colin, T., Rodriguez-Jimenez, R., Rogel-Hernandez, E., Alvarez-Andrade, A., and Toyohiko Wakida, F. (2020). Microplastics in stormwater runoff in a semiarid region, Tijuana, Mexico. STOTEN 704, 135411. doi:10.1016/j.scitotenv.2019.135411
Diggle, A., and Walker, T. R. (2020). Implementation of harmonized Extended Producer Responsibility strategies to incentivize recovery of single-use plastic packaging waste in Canada. Waste Manag. 110, 20–23. doi:10.1016/j.wasman.2020.05.013
Eslami, S., Kabir, G., and Ng, K. T. W. (2023). Waste generation modeling using system dynamics with seasonal and educational considerations. Sustainability 15, 9995. doi:10.3390/su15139995
Gaylarde, C. C., Baptista Neto, J. A., and Monteiro da Fonseca, E. (2021). Paint fragments as polluting microplastics: a brief review. Mar. Pollut. Bull. 162, 111847. doi:10.1016/j.marpolbul.2020.111847
Giacovelli, C. (2018). Single-use plastics, a roadmap for sustainability. Available at: https://stgwedocs.unep.org/handle/20.500.11822/25496 (Accessed September 14, 2023).
Grbić, J., Helm, P., Athey, S., and Rochman, C. M. (2020). Microplastics entering northwestern Lake Ontario are diverse and linked to urban sources. Water Res. 174, 115623. doi:10.1016/j.watres.2020.115623
Head, M. J., Steffen, W., Fagerlind, D., Zinke, J., Poirier, C., Syvitski, J., et al. (2022). The Great Acceleration is real and provides a quantitative basis for the proposed Anthropocene Series/Epoch. Episodes 45, 359–376. doi:10.18814/epiiugs/2021/021031
Healton, C. G., Cummings, K. M., O'Connor, R. J., and Novotny, T. E. (2011). Butt really? The environmental impact of cigarettes. Tob. Control 20, i1. doi:10.1136/tc.2011.043729
Huang, Y., Liu, Q., Jia, W., Yan, C., and Wang, J. (2020). Agricultural plastic mulching as a source of microplastics in the terrestrial environment. Environ. Poll. 260, 114096. doi:10.1016/j.envpol.2020.114096
Issac, M. N., and Kandasubramanian, B. (2021). Effect of microplastics in water and aquatic systems. Environ. Sci. Pollut. Res. 28, 19544–19562. doi:10.1007/s11356-021-13184-2
Jambeck, J. R., Geyer, R., Wilcox, C., Siegler, T. R., Perryman, M., Andrady, A., et al. (2015). Plastic waste inputs from land into the ocean. Science 347, 768–771. doi:10.1126/science.1260352
Kole, P. J., Löhr, A. J., Van Belleghem, F., and Ragas, A. (2017). Wear and tear of tyres: a stealthy source of microplastics in the environment. Intern. J. Environ. Res. Publ. Health 14, 1265. doi:10.3390/ijerph14101265
Kumar, R., Verma, A., Shome, A., Sinha, S., Jha, P. K., Vara Prasad, P. V., et al. (2021). Impacts of plastic pollution on ecosystem services, sustainable development goals, and need to focus on circular economy and policy interventions. Sustainability 13, 9963. doi:10.3390/su13179963
Lau, S.-L., Khan, E., and Stenstrom, M. K. (2001). Catch basin inserts to reduce pollution from stormwater. Water Sci. Technol. 44, 23–34. doi:10.2166/wst.2001.0381
Lau, W. W. Y., Shiran, Y., Bailey, R. M., Cook, E., Palardy, J. E., Koskella, J., et al. (2020). Evaluating scenarios toward zero plastic pollution. Science 369, 1455–1461. doi:10.1126/science.aba9475
Leslie, H. A., Brandsma, S. H., van Velzen, M. J. M., and Vethaak, A. D. (2017). Microplastics en route: Field measurements in the Dutch river delta and Amsterdam canals, wastewater treatment plants, North Sea sediments and biota. Environ. Intern. 101, 133–142. doi:10.1016/j.envint.2017.01.018
Ocean Conservancy (2023). #SeatheChange. Available at: https://oceanconservancy.org/wpcontent/uploads/2021/09/Annual-Report_FINAL_Digital.pdf (Accessed September 19, 2023).
Ocean Wise (2023). Cigarette butts, plastic and food wrappers remain top litter items on Canadian shorelines. Available at: https://ocean.org/blog/cigarette-butts-plastic-and-food-wrappersremain-top-litter-items-on-canadian-shorelines/(Accessed September 19, 2023).
Sherlock, C., Gutierrez, R. F., David, M., and Rochman, C. M. (2023). A methodology for quantifying and characterizing litter from trash capture devices (TCDs) to measure impact and inform upstream solutions. FACETS 8, 1–12. doi:10.1139/facets-2022-0034
Shruti, V. C., Pérez-Guevara, F., Elizalde-Martínez, I., and Kutralam-Muniasamy, G. (2021). Current trends and analytical methods for evaluation of microplastics in stormwater. Trends Environ. Anal. Chem. 30, e00123. doi:10.1016/j.teac.2021.e00123
Smyth, K., Drake, J., Li, Y., Rochman, C., Van Seters, T., and Passeport, E. (2021). Bioretention cells remove microplastics from urban stormwater. Water Res. 191, 116785. doi:10.1016/j.watres.2020.116785
Statistics Canada (2023). 2021 census of population geographic summary. Available at: https://www12.statcan.gc.ca/census-recensement/2021/search-recherche/productresults-resultatsproduits-eng.cfm?LANG=E&GEOCODE=2021A00053539036.
Svensson, N., and Andersson-Sköld, Y. (2021). Dispersion and fate models for microplastics from tyre and road wear. VTI rapport 1061A, Swed. Natl. Road Transp. Res. Inst. (VTI), 38pp. Available at: https://www.oneplanetnetwork.org/sites/default/files/from-crm/Dispersion%2520and%2520fate%2520models%2520for%2520microplastics%2520from%2520tyre%2520and%2520road%2520wear.pdf.
Tasseron, P., Begemann, F., Joosse, N., van der Ploeg, M., van Driel, J., and van Emmerik, T. (2023). Amsterdam urban water system as entry point of river plastic pollution. Environ. Sci. Pollut. Res. 30, 73590–73599. doi:10.1007/s11356-023-26566-5
UNEP (2023). Turning off the Tap: how the world can end plastic pollution and create a circular economy. Available at: https://www.unep.org/resources/turning-off-tap-end-plastic-pollutioncreate-circular-economy (Accessed September 2, 2023).
van Emmerik, T. H. M., González-Fernández, D., Laufkötter, C., Blettler, M., Lusher, A., Hurley, R., et al. (2023). Focus on plastics from land to aquatic ecosystems. Environ. Res. Lett. 18, 040401. doi:10.1088/1748-9326/acc0869326/acc086
Watson & Associates Economists Ltd (2022). Population, housing and employment growth projection study, 2021–2051. Available at: https://getinvolved.london.ca/20924/widgets/87832/documents/86405 (Accessed September 12, 2023).
Webler, T., and Jakubowski, K. (2022). Attitudes, beliefs, and behaviors about cigarette-butt littering among college-aged adults in the United States. Intern. J. Environ. Res. Publ. Health 19, 8085. doi:10.3390/ijerph19138085
World Economic Forum (2016). The new plastics economy: rethinking the future of plastics. Available at: https://www3.weforum.org/docs/WEF_The_New_Plastics_Economy.pdf (Accessed October 16, 2023).
Keywords: microplastics, macroplastics, stormwater, urban, LittaTrapTM, Thames River, Laurentian Great Lakes
Citation: Kozikowski N and Corcoran PL (2024) Pedestrian traffic is the main driver of macro- and large microplastic debris deposition in urban stormwater drains. Front. Environ. Sci. 12:1459259. doi: 10.3389/fenvs.2024.1459259
Received: 04 July 2024; Accepted: 31 October 2024;
Published: 15 November 2024.
Edited by:
Freija Mendrik, University of Plymouth, United KingdomReviewed by:
Nadia Valentina Martínez-Villegas, Instituto Potosino de Investigación Científica y Tecnológica (IPICYT), MexicoMatthew Ross, MacEwan University, Canada
Copyright © 2024 Kozikowski and Corcoran. This is an open-access article distributed under the terms of the Creative Commons Attribution License (CC BY). The use, distribution or reproduction in other forums is permitted, provided the original author(s) and the copyright owner(s) are credited and that the original publication in this journal is cited, in accordance with accepted academic practice. No use, distribution or reproduction is permitted which does not comply with these terms.
*Correspondence: Patricia L. Corcoran, cGNvcmNvckB1d28uY2E=
 Nina Kozikowski
 Patricia L. Corcoran