- 1School of Architecture and Civil Engineering, Chengdu University, Chengdu, China
- 2Hubei Key Laboratory of Water System Science for Sponge City Construction, Wuhan University, Wuhan, China
- 3State Key Laboratory of Water Resources Engineering and Management, Wuhan University, Wuhan, China
Under the current increasingly serious water pollution situation in urban, the comprehensive treatment and protecting measures in urban small catchment are the necessary step to the water pollution treatment, not only focus on the water bodies themself. In this paper, the Luojiagang river channel and its catchment in Wuhan, which has been heavily impacted by water pollution, are taken as an example for the comparative assessment of pollution control measures in order to explore the effective and sustainable schemes including the LID (Low Impact Development---LID) by using SWMM model (Storm Water Management Model---SWMM). Through the comparison of pollution treatment measures based on scenarios simulation with the baseline scenarios, it was found that the reduction effects of pollutant peak concentrations at the outlet node of Luojiagang River had the decreasing order of: the combined measures (COS) > LID control > the water diversion from Donghu Lake (WAD) > the sewage treatment (SET) > the sediment dredging (SED), and the reduction effects of total pollutant load had the decreasing order of: LID > COS > SET > SED > WAD. The results show that the control of non-point source pollution is the key for the improvement of water quality in Luojiagang River, and LID plays important role in the reduction of both pollutant peak concentrations and load. This study has the implication for the decision making of the water pollution controlling schemes in urban small catchment.
1 Introduction
With the rapid expansion of cities and the growth of population, the issue of water pollution has become a matter of great concern that cannot be overlooked (Huang et al., 2019). Over 80% of urban rivers have demonstrated considerable levels of pollution, with some exhibiting a blackened and unpleasant odor (Qu and Fan, 2010). The occurrence of eutrophication and foul odors in urban water bodies has not only impacted the local environment but also the quality of life for residents in the surrounding areas. Furthermore, the water quality-induced water shortage poses a significant threat to the safety of urban water supply (Tao and Xin, 2014). Frequent incidents of urban water pollution reflect the gravity of the situation, making the treatment and management of urban water pollution a necessity for safeguarding economic and social development, as well as rebuilding ecological civilization. Urban landscapes and the unplanned urbanization are host to a suite of contaminants that impact on water quality, where the major contributors to pollution and the novel contaminants continue to pose new challenges to comprehensive assessment, monitoring and treatment regimes (McGrane, 2016; Khan et al., 2022).
During recent years, the significant changes have been observed in the structure and water cycle of urban water systems through the construction of rainwater and sewage pipelines, water diversion projects, and gate operations (Grimm et al., 2008; Li Q. et al., 2019). The natural water network in urban areas has been transformed into a complex water network that combines natural and engineering features through a series of construction projects such as channels, gates, and pumping stations (Follstad Shah et al., 2019; Gessner et al., 2014; McGrane, 2016). In addition to its own water system connectivity, the complex urban water network is closely related to the processes of water intake, water use, and wastewater discharge, which makes its water cycle processes very complex (Kuhlemann et al., 2020), and its hydrological processes and pollution patterns are influenced by both natural factors and human intervention. Moreover, the complex urban water network is influenced by multiple sources of pollution, including point and non-point source, even the pollution arising from misconnections (Revitt and Ellis, 2016), posing additional challenges to urban water pollution management. The processes of pollutant generation, transmission and treatment in urban water networks and the impact of human regulation on the water environment need further exploration (Ehleringer et al., 2016).
The implementation of water pollution control in urban water networks involves a combination of point source pollution control, non-point source pollution control, and water body restoration measures. To address point-source pollution, an approach that involves collecting and treating wastewater is adopted, complemented by a range of policies and technologies to mitigate industrial pollution sources (Pan and Tang, 2021). Facing the challenges of the non-point sources, that are mainly produced by the untreated runoff (Charters et al., 2021; Müller et al., 2020) from impermeable urban surfaces, LID (Low Impact Development---LID) practices has gained significant popularity (Rong et al., 2021). Techniques such as bioretention cells, pervious pavements, and green roofs have demonstrated their effectiveness in several studies (Baek et al., 2015; Seo et al., 2017; Zhu et al., 2019; Liu et al., 2019; Liu, 2020). Due to the complexity of urban water issues, de Oliveira et al. (2022) pointed out that traditional engineering approaches alone (gray infrastructure) are not able to meet all the challenges of sustainability posed by growing urban population and consumption. A mix of green (such as LID), blue and grey infrastructures is likely to result in the best adaptation strategy as these three alternatives tend to complement each other (Alves et al., 2019). In China, the construction of sponge cities has emerged as a promising approach towards reducing urban waterlogging and non-point source pollution (Li Z. et al., 2019; Nguyen et al., 2019), in which the combination of gree, blue and grey is emphasized. But in practise, the combination of gree, blue and grey still exists many difficulties, such as how to determine the combining schemes and assess their effects assessment for the decision making etc.
In this context, a study taking a urban small catchment in Wuhan as an example is carried out for the comparison and analyzing of the effects of different water pollution treatment measures, which can provide valuable guidance to the decision making of the water pollution contoling schemes in urban small catchment. The detailed tasks in this paper include: (1) establishing a hydrological and water quality model of the Luojiagang catchment based on SWMM; (2) simulating the evolution trend of water quality in the catchment under different treatment measures, including LID and traditional engineering approaches; and (3) comparing and assessing the effects of different treatment measures to provide a reference for actual water environment treatment options.
2 Material and methods
2.1 Study area
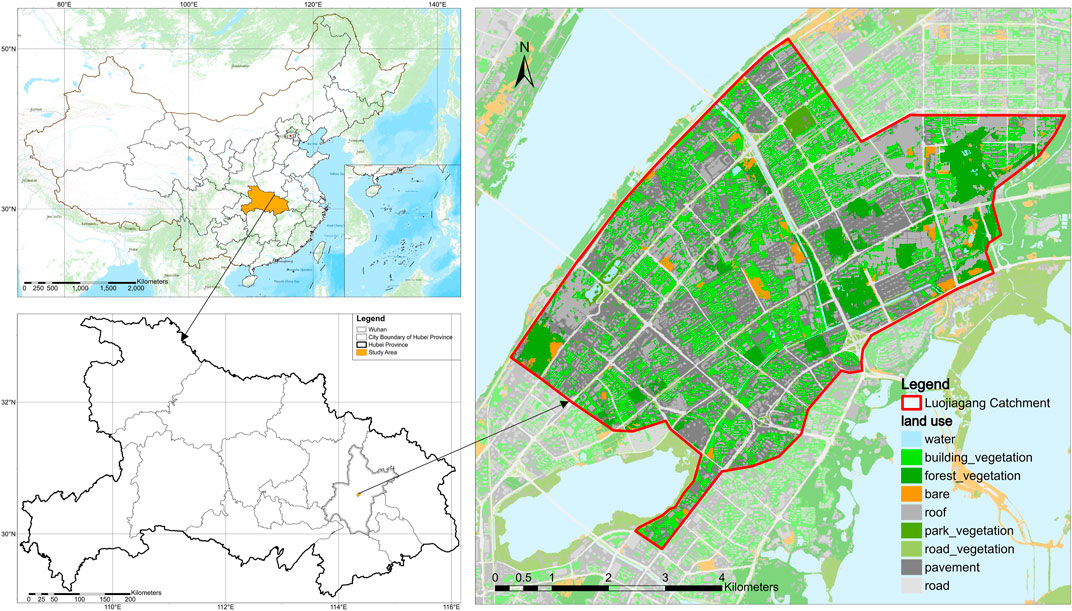
The Luojiagang catchment, which includes the two main rivers, the Luojiagang River and the Shahugang River, is situated in Wuhan’s core city and extends across three administrative districts: Hongshan, Wuchang, and Qingshan (Figure 1). Its total size is roughly 27.91 km2. With a 3.85 km overall length, the Luojiagang River begins at Shahugang River in the south and terminates at Luojialu Pumping Station in the east. The Luojiagang River divides the Shahugang River into two sections, the eastern section of which begins at Xudong Street and receives tailwater discharge from the upstream Shahu Sewage Treatment Plant and the midstream Erlangmiao Sewage Treatment Plant as well as sporadic domestic sewage discharge, and the western section of which begins at Renhe Road and is connected to the Donghu Lake by the Xingouqu River. During the flood season, the Xingou gate is opened, thereby permitting the influx of water accumulated in the East Lake to cascade into the Shahugang River. The eastern and western sectors of the Shahugang River converge and amalgamate into the Luojiagang River, culminating in the eventual discharge of the waterway into the Yangtze River. The surface of the Luojiagang catchment exhibits relatively gentle terrain with locally concentrated high-rise buildings. The elevation of the region ranges between 11.46 m and 40.36 m. The majority of the catchment is urbanized. Overall, impermeable surfaces constitute a significant proportion of the study area, resulting in high runoff coefficients, short runoff formation times, limited infiltration capacities, and intensified pollutant scouring.
Luojiagang catchment faces substantial water environmental issues due to domestic sewage discharge, overflow merging, and indiscriminate garbage dumping, leading to the formation of a black-odorous water body. In recent years, a significant portion of the Luojiagang catchment has had sewage collection pipelines constructed and pollution outlets along the riverbanks intercepted to mitigate the impact of combined sewer overflows on the water body. Additionally, a comprehensive channel remediation project has been implemented to align with the requirements of the Donghu Lake Ecological Water Network Project. The implementation of the above measures has yielded initial results in the treatment of foul-smelling water in Luojiagang River. However, the issue of water pollution has not been completely eradicated. In order to further investigate the specific causes of pollution in Luojiagang and analyze the water quality trend of the river under different treatment measures, this study will conduct hydrological and water quality simulations of the Luojiagang catchment based on the SWMM model. The findings will serve as a reference for future treatment efforts.
2.2 SWMM model
The Storm Water Management Model (SWMM) was developed by the United States Environmental Protection Agency (EPA) as a dynamic rainfall-runoff simulation program. It models the runoff volume and water quality of a single rainfall event or a long-term sequence by constructing catchments, drainage pipes, rainwater nodes, and treatment facilities (Gironás et al., 2010).
The basic operating unit of the SWMM model is the sub-catchment, which can be used to simulate hydrological and hydraulic processes, water quality, and sewage in various forms. Each sub-catchment is divided into three parts: impervious areas without depression storage, impermeable areas with depression storage, and pervious areas. SWMM provides three infiltration models, namely, Horton infiltration formula, Green-Ampt infiltration formula, and the Soil Conservation Service (SCS) Curve Number method. The pipe network section offers three runoff simulation methods: steady flow, kinematic wave, and dynamic wave. The steady flow method is the simplest to calculate as it maintains a constant flow at each time step. The kinematic wave method takes into account the pipe channel equation and uses hydraulic continuity and momentum conservation equations for calculation. The dynamic wave method considers additional factors such as node water flow, continuity equation, among others. Each method has its pros and cons and should be applied based on specific requirements.
The SWMM software can simulate the entire process of pollutant generation, runoff, and migration. By subdividing sub-catchments into different land use areas, it can simulate the pollution transmission of drainage systems by setting pollutant accumulation and washout characteristics for each land use type. The accumulation process refers to the continuous increase of pollutants on the surface caused by natural and human activities before rainfall occurs. SWMM software primarily employs power function models, exponential function models, and saturation function models to simulate pollutant accumulation. The washout process involves erosion of the underlying soil layer during runoff production and the dissipation of certain pollutants. The SWMM software mainly uses exponential function models, performance curve washout models, and event mean concentration function models to simulate pollutant washout.
2.3 Scenario definition
Due to severe pollution in Luojiagang River, four treatment measures are proposed based on the current situation and treatment conditions of non-point water pollution in the cathment, which include water diversion from Donghu Lake (WAD), sewage treatment (SET), sediment dredging (SED), and LID control (LID). Each measure has three levels of intensity, and a combination of low, medium, and high levels of intensity are set according to the actual situation for simulating the water environmental trend in Luojiagang River through hydrodynamic and water quality modeling. The baseline scenario (BAS) has a water diversion flow from Donghu Lake of 3 m3/s, a total nitrogen release rate of 268 mg/m2/d, and a total phosphorus release rate of 158 mg/m2/d for sediment, without direct discharge sewage treatment and LID facilities.
Because the water quality of Donghu Lake is better than that of Luojiagang River, scientifically diverting water from Donghu Lake to the Yangtze River through Luojiagang River during the rainy season can not only prevent urban waterlogging but also improve the water quality of Luojiagang River. Considering the actual factors of water diversion project construction, the low, medium, and high water diversion discharges are set at 5 m3/s (WAD1), 7 m3/s (WAD2), and 9 m3/s (WAD3), respectively.
A sewage interception pipeline has been installed along the west side of Luojiagang River to collect wastewater and discharge it into the Erlangmiao Sewage Treatment Plant. However, the degree of interception still needs improvement, and direct discharge of untreated sewage into the river still occurs in some areas. In light of the limited proportion of combined sewers in the study area and the high treatment efficacy of the local sewage treatment plant, the main measure of sewage treatment is set to collect and treat direct sewage in this study. To this end, the low, medium, and high direct sewage treatment rates were set to 20% (SET1), 40% (SET2), and 60% (SET3), respectively.
Sediment dredging is a common engineering measure to control black and odorous water bodies (Gu et al., 2016; Liu et al., 2015). The sediment of Luojiagang River and Shahugang River is seriously polluted because of the discharge of tail water and direct sewage from sewage plants all year round. Sediment dredging in these two rivers is an approach for pollution control in this area. The low, medium, and high sediment release rates were set at 80% (SED1), 50% (SED2), and 20% (SED3) of the baseline scenario.
The construction of sponge cities has become an essential part of environmental protection policies across various cities (Nguyen et al., 2019). It aims to reduce runoff levels and minimize pollution caused by rainfall runoff. To achieve this goal, many cities use low-impact development measures (LID) to build decentralized and small-scale sponge structures, including rain gardens, green roofs, bioretention cells, and artificial wetlands, among others (Hu et al., 2019). In this study, bioretention cells are chosen as a typical example of LID control measures for simulation due to their varying forms and strong applicability. Combining information from relevant literature (Rossman and Simon, 2022; Huang et al., 2022; Li et al., 2021) and the study area, the twelve parameters of the bioretention cells were determined (Table 1). The area proportions of low, medium, and high LID control were set at 10% (LID1), 20% (LID2), and 30% (LID3), respectively.
The above scenarios are single scenarios, and the simulated pollution control rate can reflect the treatment effect of each measure. In practice, the remediation of water environment is usually a systematic project, which requires multiple means to work at the same time. In order to examine the effectiveness of different pollution control measures in the actual management of water environments, this study combines the single scenarios previously examined into three combination scenarios: COS1, COS2, and COS3. COS1 is comprised of the scenarios WAD1, SET1, SED1, and LID1, and the remaining two combinations are similar.
Rainfalls with return periods of 0.25, 1, and 5 years were selected to represent light rain, moderate rain, and heavy rain in Wuhan City for water quality simulation analysis under different scenarios (Figure 2). For simplification, the BAS with a 1a rainfall return period was abbreviated as “1a-BAS”, and similar abbreviations were used for the other scenarios.
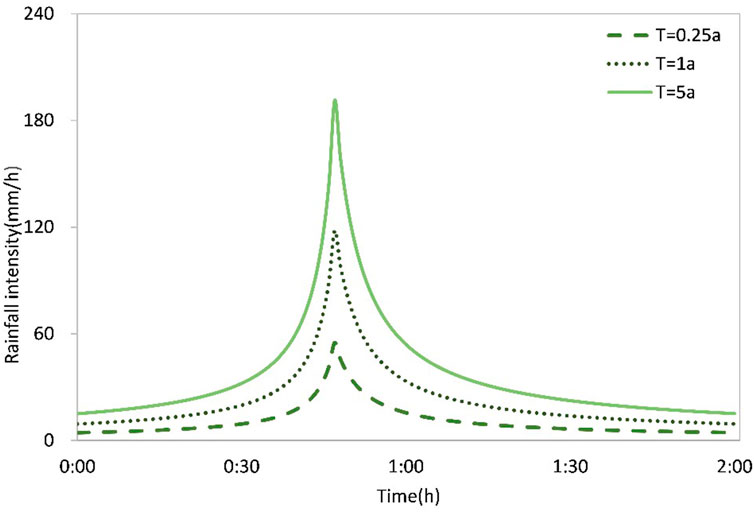
Figure 2. The design rainfall with different return periods (based on the Wuhan local standard: rainstorm intensity formula and design rainstorm profile of Wuhan, DB4201/T 641-2020).
3 Model setup and calibration
3.1 Model setup
The SWMM model was constructed with hydrological, water quality, and hydraulic modules. The hydrological module simulates surface runoff processes, the water quality module modeled the accumulation and flushing processes of pollutants in the underlying surface, and the hydraulic module was used to simulate the transport of water and pollutants.
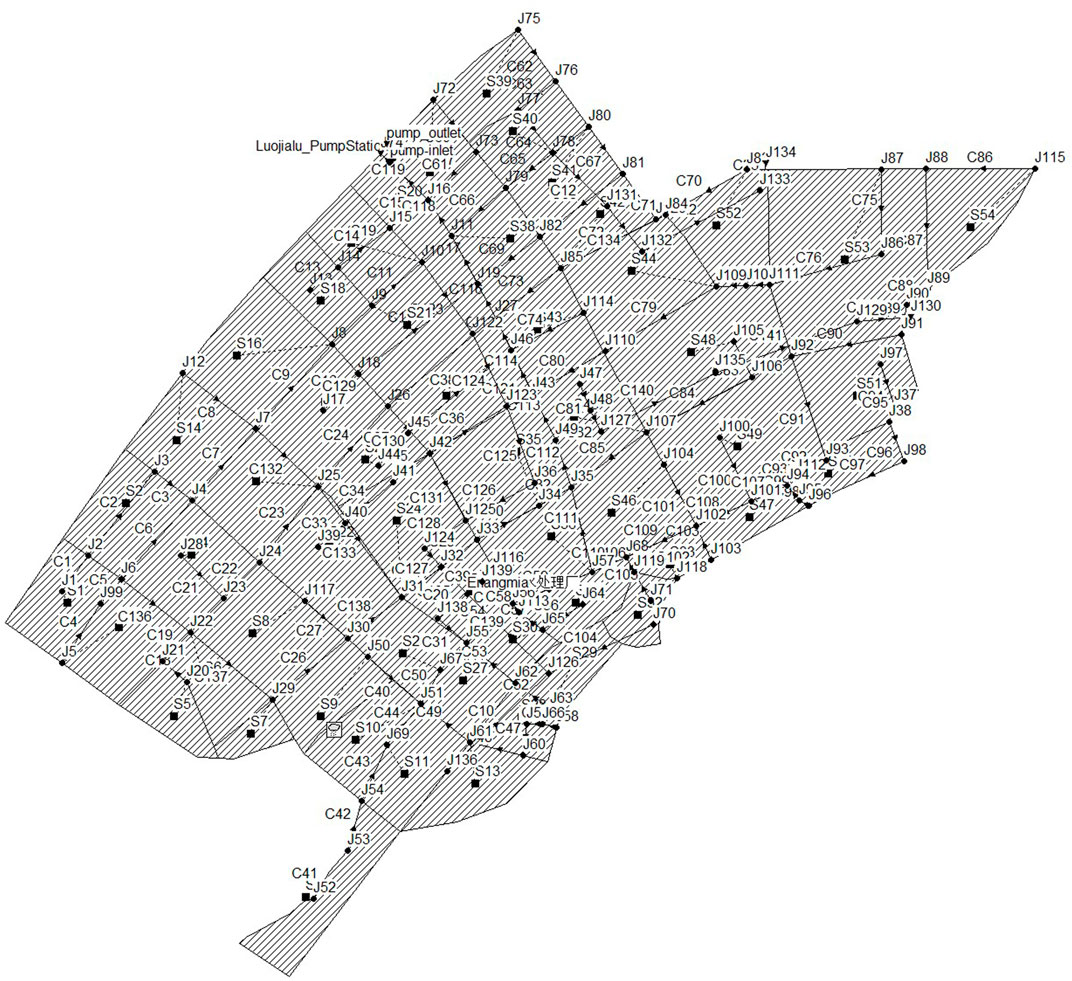
The Luojiagang catchment was divided into 54 sub-catchments using a manual division method based on pipe network structure, the location of rainwater wells, topography, and land use. The land use types in the study area were categorized into five types: roofs, pavements, hard ground surfaces, construction land, and green land, of which the first three were impermeable surfaces and the latter two are permeable surfaces. The infiltration process in the permeable areas was calculated using the Horton model. The runoff calculation for surface runoff was based on the nonlinear reservoir method, where the continuity equation and Manning’s formula were solved iteratively to obtain the runoff volume.
Due to the complex structure of the stormwater and sewage pipe networks in the study area, the kinematic wave model was selected for network simulation. The accumulation process of pollutants was modeled using the saturation function, and the flushing process was modeled using the exponential function. Key factors affecting water quantity and quality in the study area, such as the discharge of Donghu Lake, domestic sewage, sewage treatment plant operations, pump station discharges, and pollutant releases from sediment were integrated into the sub-catchments and the pipe network framework to construct a SWMM-based hydrological and water quality model for the Luojiagang catchment (Figure 3).
3.2 Model calibration
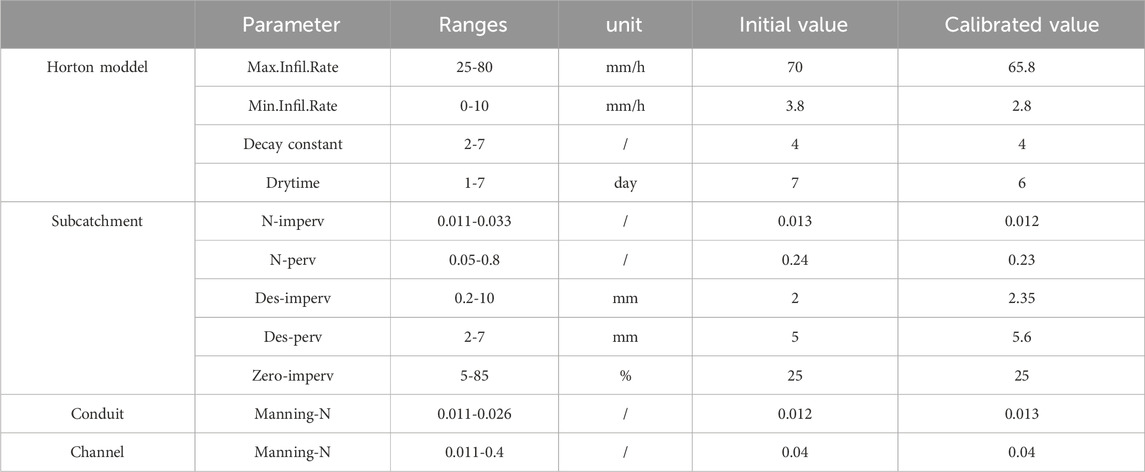
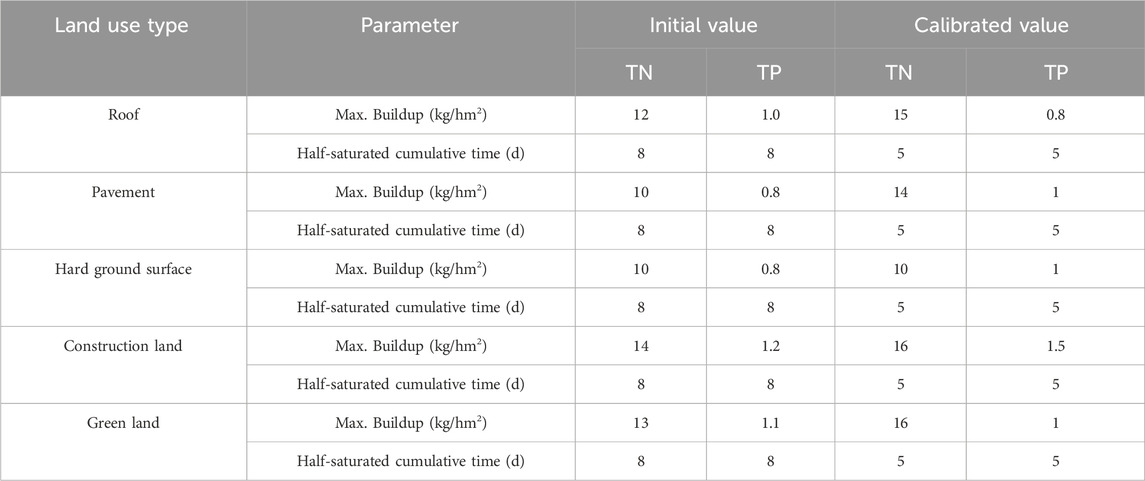
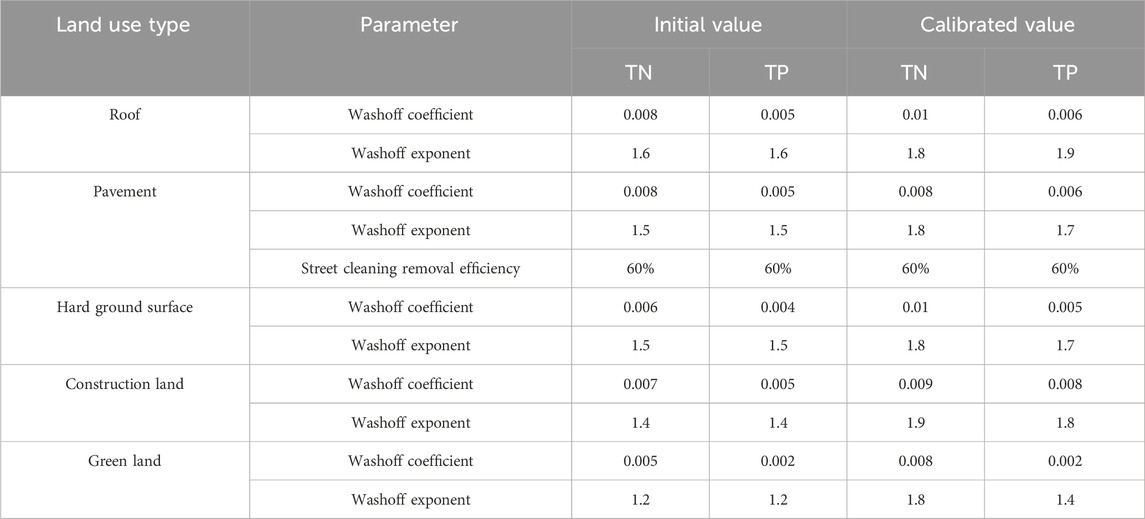
The SWMM model required the setting of numerous parameters, some of which can be obtained from actual engineering data and software such as ArcGIS, referred to as data parameters, while other parameters need to be obtained by referring to the value range of relevant literature and through parameter calibration, referred to as empirical parameters. The initial values of each parameter were determined based on different data, and then the model parameters were calibrated according to actual measured data (the initial values and calibrated values of hydrological, hydraulic, and water quality parameters are shown in Tables 2–4).
Water quality simulation was based on water quantity simulation, so the calibration and adjustment of hydrological and hydraulic parameters were required first. The Nash-Sutcliffe efficiency coefficient was used as the evaluation index for calibration of hydrological and hydraulic parameters, and a value closer to 1 indicated better simulation performance, and NSEthreshold = 0.65 has been reported in the literature as a lower limit of a valid goodness-of-fit (Ritter and Muñoz-Carpena, 2013). The period from June 11 to June 30, 2019 was designated as the calibration period, while the period from May 14 to May 31, 2019 was identified as the validation period. Daily precipitation data measured at the Hubei University precipitation station was inputted, and the measured discharge at the Luojiagang catchment export node J16 was compared with the simulated discharge (Figure 4) to determine the simulation performance of the parameters. After multiple parameter adjustments, the Nash efficiency coefficient during the calibration period was calculated to be 0.81, and during the verification period, it was 0.75, meeting the simulation requirements of the model. Although the Nash efficiency coefficient indicated that the model has the satisfied accuracy, the more rainfall-runoff events are still needed for the calibration and validation in order to guarantee the accuracy of the model under the different rainfall scenario in future.
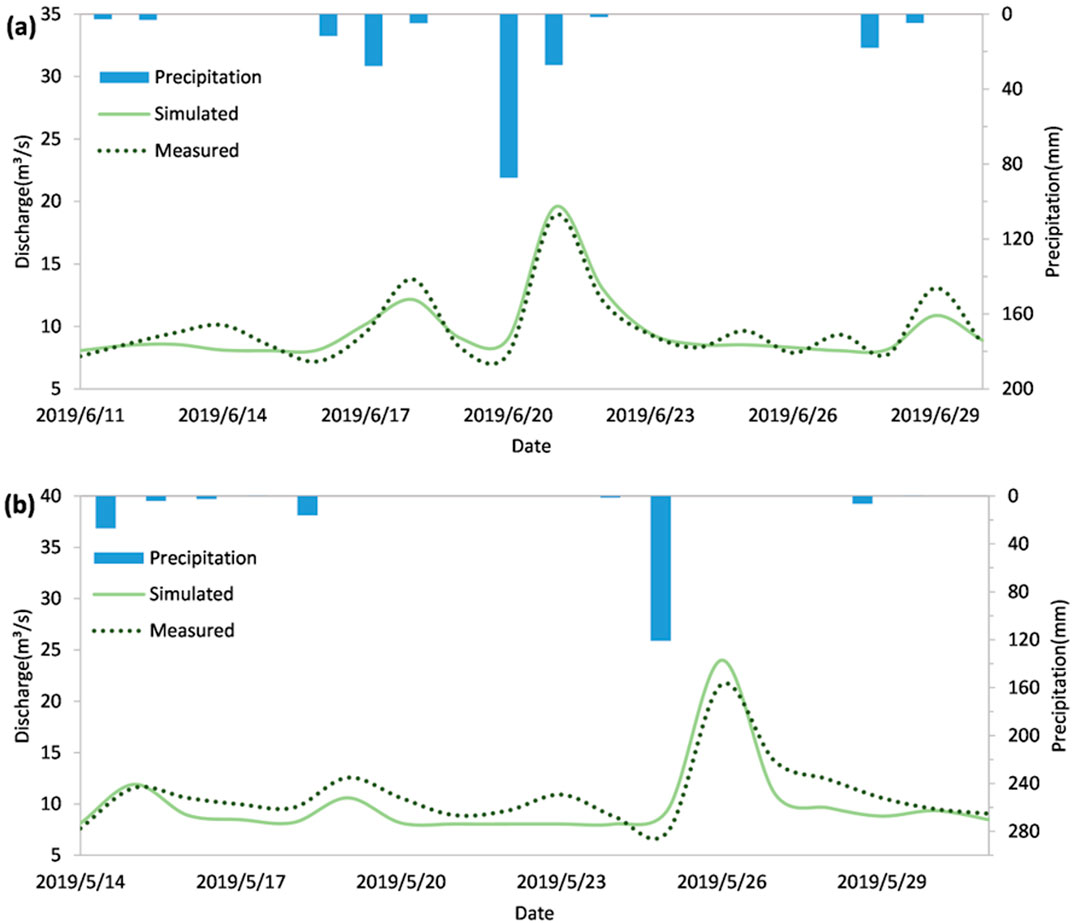
Figure 4. The measured discharge compared with the simulated discharge at the Luojiagang catchment export node J16 in (A) calibration and (B) validation.
In terms of water quality parameter calibration, the relative error was utilized as the performance indicator for simulated parameters. Calibration and validation were conducted by comparing the simulated and measured concentrations at river nodes J16, J19, J43, and J56 on June 6, 2019 and May 11, 2019, respectively (Figure 5). Following numerous adjustments, the relative error’s absolute value ranged from 3.10% to 15.79% during calibration and 0.56%–15.14% during validation (Figure 6). Accounting for measurement and monitoring errors and various interfering factors affecting river water quality, the degree of accuracy achieved was adequate to fulfill this model’s simulation requirements.
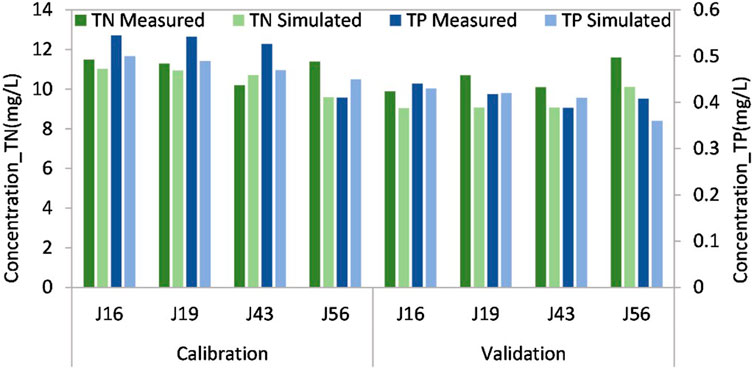
Figure 5. The comparison of measured and simulated concentrations of TN and TP at nodes J16, J19, J43, and J56.
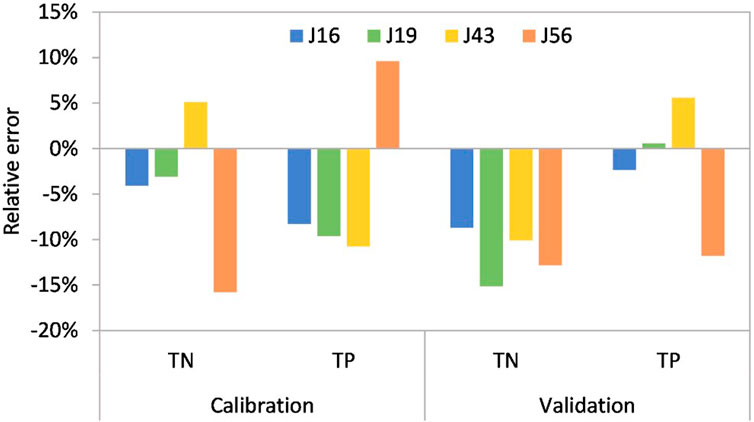
Figure 6. The relative error between measured and simulated concentrations at nodes J16, J19, J43, and J56.
4 Results and discussion
A hydrological and water quality model for the Luojiagang catchment based on SWMM was established to simulate the water dynamics and water quality conditions during the rainy season, and TN and TP were used as typical pollutants. Single and combined scenarios were designed for the four measures of East Lake water diversion, sewage treatment, dredging of sediment, and sponge city governance to simulate the trend of the water environment in Luojiagang River. By analyzing the pollution reduction effect of each governance measure and identifying the key links of pollution in the Luojiagang catchment, the purpose of providing scientific references for the water environment management in the Luojiagang catchment was achieved.
4.1 Analysis of the baseline scenario
In order to analyze the variation process and the rules of the runoff discharge and pollutants concentration in different rainfall intensity events in the Luojiagang catchment, the three baseline scenarios (BAS) of rainfall were selected respectively as the designing rainfall with a return period of 0.25, 1, and 5 years (Figure 2). The baseline scenarios of the land use types, the sub-catchments, the channels and the pipe network framework were kept the same as the situation of SWMM model setup and calibration, which were described by the paramenters in Tables 2–4. Then, the treatment scenarios (defined in Section 2.3), the water diversion from Donghu Lake (WAD), the sewage treatment (SET), the sediment dredging (SED) and the LID control (LID), will be applied for the scenario analysis of the effects of water pollution treatments which are compared with the baseline scenarios. By the comparisons, the function of the treatment scenarios will be evaluated, and the treatment scheme will be recomended.
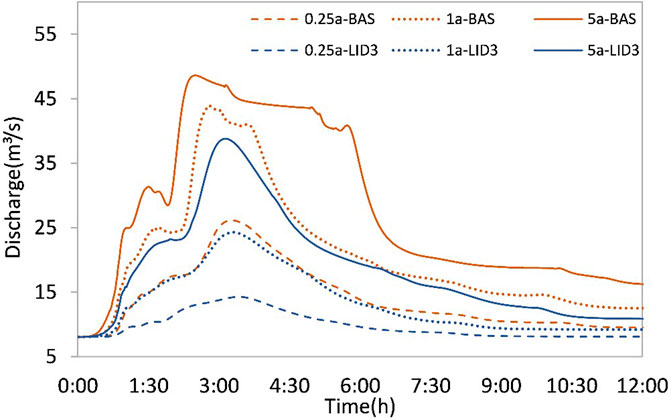
By inputting the three disigning rainfall into the SWMM model, the runoff process at the J16 outlet node of the Luojiagang catchment was obtained (Figure 7). It was observed that the discharge hydrograph at the outlet node J16 exhibited a double peak, with a smaller first peak and a larger second peak. The first peak was generated by direct rainfall on the river channel and rainfall runoff from the surrounding catchments of the river channel, while the second peak appeared after the rainfall had ended and was generated by rainfall on the underlying surface of the catchment through the pipe network, reflecting the lag effect of the urban drainage system on rainfall.
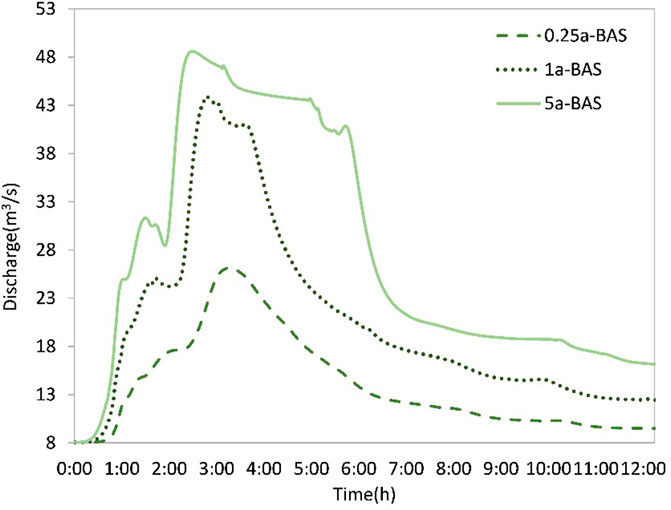
Figure 7. The discharge hydrograph at outlet node J16 of the Luojiagang catchment in baseline scenario with a return period of 0.25a, 1a, and 5a respectively.
In accordance with observed trends, higher volumes of rainfall correspond to earlier peak times, while smaller amounts of rainfall correspond to later peak times. In the scenario 0.25a-BAS, the second peak was relatively smooth, but when the rainfall intensity was greater, the runoff line showed a gap, indicating that some areas were limited by the overcurrent capacity of the pipe network. In the scenario 5a-BAS, the second peak showed a slightly gradual plateau, indicating that the pipe network of the catchment had reached its maximum overcurrent capacity and excess rainfall runoff was stored in rainwater wells, forming a stable flow in the pipe network. In the scenario 5a-BAS, some simulated rainwater nodes overflowed, indicating that the rainwater pipe network system in the study area needs to be improved.
From the outlet node J16 water quality process simulation (Figure 8), it was observed that the concentrations of TN and TP exhibited similar trends with a bimodal distribution of water quality. The first peak was mainly formed by surface runoff near the river channel during early rainfall events, when most surface pollutants were washed into the river, resulting in high levels of water pollution, reflecting an initial rain effect. While the second peak has a relatively low pollution degree due to the large rainfall and less residual surface pollutants.
In the scenarios 0.25a-BAS, the two peaks were smoother with smaller differences in peak values. However, the higher rainfall intensity resulted in more pronounced flushing effects, leading to the significantly higher and sharper first peak values. As the accumulation of pollutants on the underlying surface was constant, the second peak values decreased as the rainfall intensity increased. Since other factors influencing water quality in the study area remained consistent, the analysis of the baseline scenario simulation reflected the impact of surface source pollution brought about by rainfall runoff in the study area under different rainfall intensities. The number of drought days in the early stage of this study was 10 days. Based on the simulated water quality process, it was evident that a significant volume of pollutants accumulated on the underlying surface, and the initial rainwater carried a high degree of pollution, which exerted a substantial impact on the water environment of the river. It was noteworthy that the river retained a considerable level of contamination even after 2 h of rainfall, and the pollution did not return to pre-rainfall levels until 12 h later. The contamination of the river resulting from a 2-h bout of precipitation had yet to revert to its pre-rainfall state, even after 12 h had elapsed, indicating that reducing surface source pollution is of utmost importance for water environment management in the Luojiagang catchment.
4.2 Pollutant concentration processes in different treatment scenarios
Based on the analysis of the scenario BAS, rainfall with a return period of 0.25, 1, and 5 years was selected to represent light rain, moderate rain, and heavy rain in Wuhan for the water quality simulation analysis under different treatment measures.
After comparing the pollutant concentrations and runoff processes under different treatment measures (Figure 9), it can be observed that due to the ongoing processes of water diversion from Donghu Lake, direct sewage discharge, and the release of endogenous pollutants, dilution of pollutants through WAD, SET, and SED has already played a significant role in reducing the concentration of pollutants prior to rainfall, while LID facilities had no impact on the concentration of pollutants in the river before rainfall, as their role was primarily focused on the storage and purification of rainfall runoff.
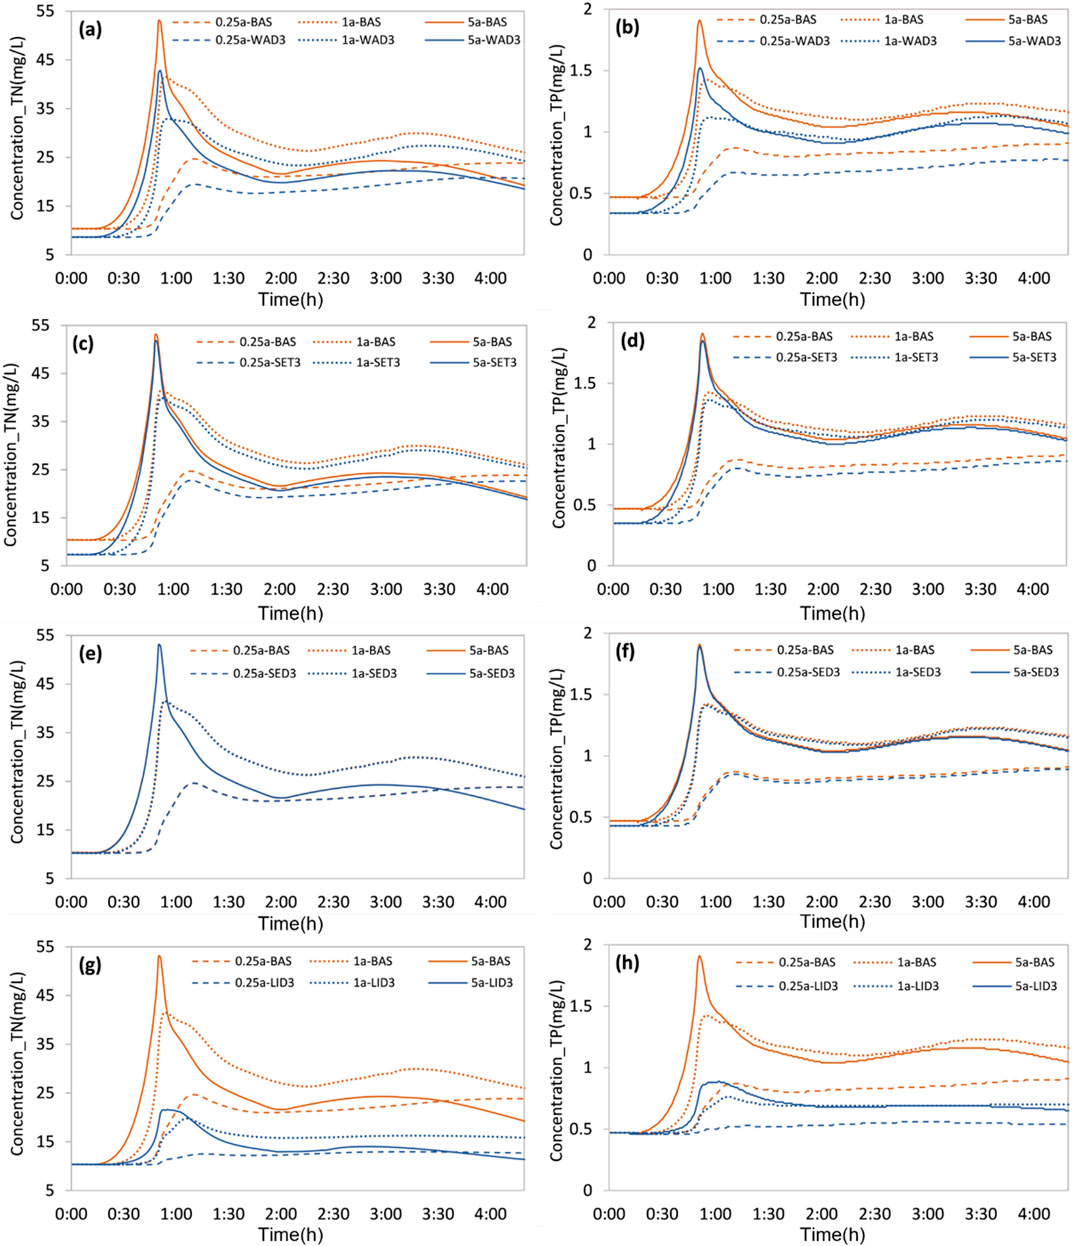
Figure 9. The evolution of TN (A, E, G) and TP (B, F, H) concentration at node J16 in different scenario: WAD (A, B), SET (C, D), SED (E, F), and LID (G, H).
Of the four treatment measures, including WAD, SET, SED, and LID, the first three primarily impacted pollutant concentration. Under these three treatment measures, the pollutant concentrations of varying treatment intensities tended to converge during rainfall processes due to the fact that the constant water diversion discharge proportionally reduces as the runoff from rainwater accelerates, the constant direct discharge of sewage proportionally reduces, and the introduction of non-point source pollution reduces the proportion of endogenous pollution, respectively.
LID differed from the previous three measures in that it had a significant reduction effect on both runoff volume and pollutant concentration (Figures 9G, H; Figure 10). LID had a significant effect on reducing the first peak discharge, indicating the effectiveness of LID facilities in increasing infiltration and decreasing surface runoff. During rainfall conditions with a return period of 5 years, LID3 displayed a smooth curve. Similarly, under a return period of 0.25 years, LID aided in reducing the fluctuation of the runoff hydrograph, which pointed towards its ability to significantly minimize the overflow of the pipeline network. Additionally, during a rainfall event, pollutant reduction effect of LID increased with the rise in the rainfall intensity and reached its peak when the rainfall reached its peak. Afterward, it gradually reverted to the initial level.
Upon comparing the results of different rainfall return periods, it was found that the total runoff increased as the return period increased. This resulted in a decline of both the dilution effect of WAD and the attenuation effect of SED on pollutants, along with a reduction in the direct discharge contribution to pollution in the Luojiagang catchment. Consequently, the dilution effect of SET on pollution also diminished. Particularly in scenario 5a-SET3, pollutant concentration showed a small difference before the peak arrival as compared to scenario 5a-BAS. A smaller return period resulted in a delayed peak concentration time for the four treatment measures of WAD, SET, SED, and LID.
Upon evaluation of the pollution reduction effects of various measures, it was discovered that the concentration of total nitrogen and total phosphorus exhibited significant decrease in scenarios LID3, without changing the trend. The results suggested that LID facilities prove to be an effective means of reducing non-point source pollution in the Luojiagang catchment. LID demonstrated the most significant decrease in pollutant concentration, in coherence with previous analyses. Non-point source pollution accounted for a notable portion of pollution in the Luojiagang catchment and mitigating it could alleviate the pollution situation. Furthermore, WAD exhibited a significant reduction in pollutant concentration that ranked second, indicating that enhancing hydrological connectivity can prove an effective means of curbing pollution in the Luojiagang River. In contrast, SET and SED exhibited minimal decrease in pollutant concentration relative to the baseline scenario, signaling that point source wastewater discharge and endogenous pollution constitute a small fraction of pollution in the Luojiagang catchment.
4.3 Comparison of pollutant reduction rates and treatment effects
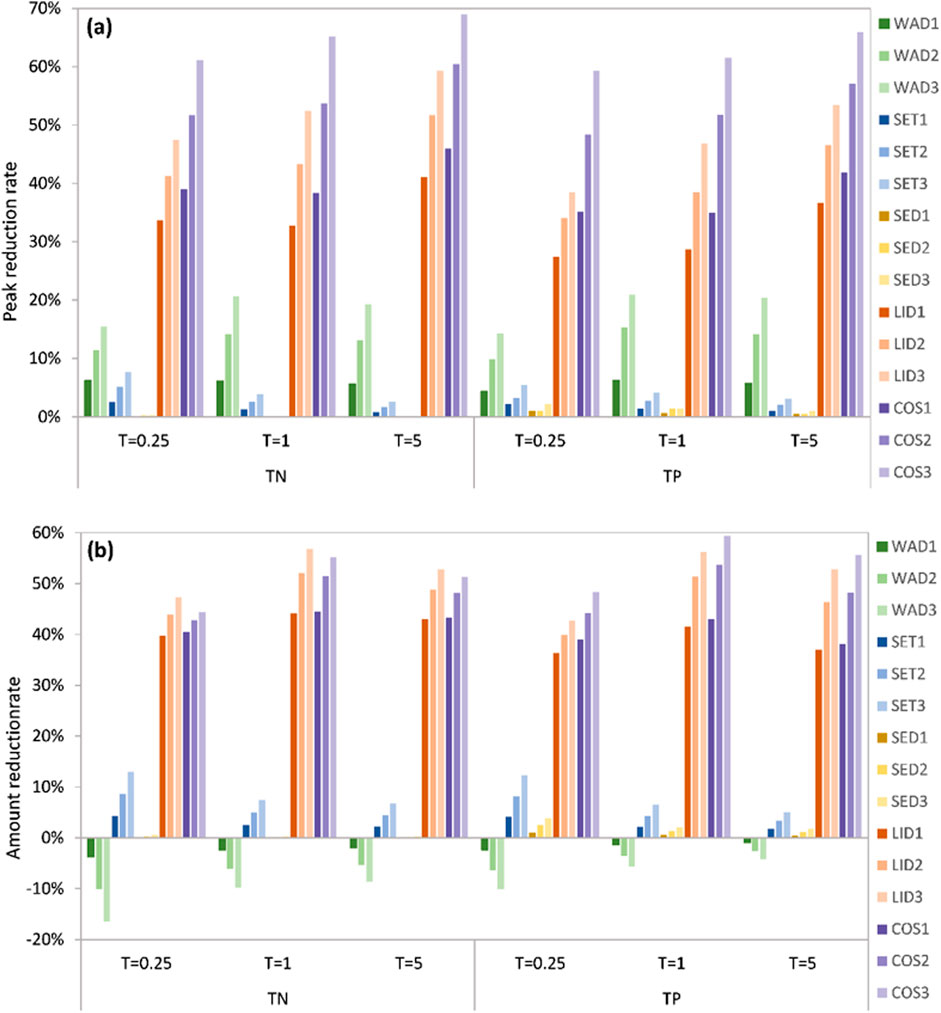
The pollution reduction rates, including (i) the reduction rate of pollutant peak concentration and (ii) the reduction rate of total pollutant contents within 24 h after the start of rain (in the following referred to as peak reduction rate and total reduction rate), were calculated across various scenarios in relation to the baseline scenario (Figure 11). This enabled a quantitative evaluation of the effectiveness of different pollution control measures and intensities, which differed from the qualitative analysis based on the pollution concentration process line in the previous section. The peak reduction rates for each treatment scenario are ranked from highest to lowest as follows: COS > LID > WAD > SET > SED, and the total reduction rates are ranked from highest to lowest as follows: LID > COS > SET > SED > WAD. These rankings highlighted the efficacy of various measures in addressing water pollution in the Luojiagang catchment. Furthermore, non-point source pollution was the most prominent contributor to pollution levels in the area, while domestic sewage and endogenous pollution played a relatively minor role.
An increase in discharge at Luojiagang River, attributed to the water diversion from Donghu Lake, resulted in a rise in the overall amount of pollutants passing through the outlet node. The peak reduction rate also increased in proportion to the diversion volume, reflecting the significance of hydrological connectivity in river water environments and proving the efficacy of the Great Donghu Lake ecological water network connection project in enhancing water quality within urban rivers. The peak reduction rate recorded the highest value in scenario 1a-WAD, indicating that the WAD plays the best role under moderate rainfall conditions. In practical applications, it is crucial to consider construction costs and the safety of the river during the rainy season while determining a reasonable route and volume for water diversion. Simply opting for higher diversion rates is not always the most feasible solution. It should be noted that while the WAD had the lowest total reduction rate in the simulated scenarios, the dilution effect of pollution is just one aspect of the purpose. Furthermore, the water diversion will also have an impact on the river and lake community structures (Dai et al., 2020). More importantly, the Donghu Lake Ecological Water Network Project can establish a hydraulic connection between the Yangtze River and Donghu Lake through water diversion (Guo and Kang, 2012), laying the foundation for ecological restoration projects.
The higher the degree of sewage treatment, the higher the peak reduction rate and total reduction rate. The smaller the rain intensity, the higher the reduction rate of peak concentrations of pollutants and the total reduction rate of sewage treatment measures. At present, most of the areas in the Luojiagang catchment have realized rainwater and sewage diversion, and the degree of domestic sewage interception is high. The direct sewage not connected to the sewage network should be further investigated and rectified to improve the sewage treatment rate.
The lower the release rate of pollutants in the sediment, the lower the pollutant concentration in the Luojiagang catchment, with the best water pollution control effect under light rain conditions. The impact of sediment dredging on the pollutant concentration in the river is very small, which reflects the effectiveness of previous endogenous pollution control work. Furthermore, the dredging effect was represented as a decrease in the endogenous release rate in the simulation. However, the practical application of dredging in different regions yielded inconsistent results. In some cases, dredging effectively reduced pollution loads (Chen et al., 2018), while in others, various complex factors such as dredging technology, dredging depth, and the environmental conditions of the water body itself influenced the effectiveness of pollution control after dredging (Chen et al., 2020; Weng, 2017; Zhu et al., 2022). Dredging alone cannot achieve long-term pollution control effectiveness, which requires reducing external loads (Liu et al., 2016
As the area of LID facilities increased, the peak reduction rates and total reduction rates also increased. The peak reduction rates of LID were highest during heavy rainfall, while the total reduction rates were highest during moderate rainfall. LID measures showed significant effectiveness in reducing both pollutant peak concentration and total pollutant load, indicating the importance of non-point source pollution in river pollution in urban centers and highlighting the necessity of sponge city construction. When the construction area of LID facilities accounted for 10%, the peak reduction rate of TN reached over 30%. Nevertheless, the peak reduction rates increase became less pronounced as the construction area of LID facilities rose to 20% or 30%. Therefore, the LID with a construction area of 10% was a cost-effective solution with good treatment results. Water management efforts in the Luojiagang catchment should focus on promoting the construction of LID facilities, enhancing urban vegetation, optimizing rainfall utilization, and strengthening pollution source regulations (e.g., roads, and construction sites, garbage, sewage, and dry-wet deposition at rainwater outlets) to diminish non-point source pollution. The effectiveness of LID facilities in controlling pollutants is influenced by various factors, not just the construction area mentioned here. In practical applications, factors such as the type of LID facility, functional design criteria, engineered design features, plant growth, and cost control all need to be further considered (Beryani et al., 2021; Glaister et at., 2017; Chaves et al., 2024).
The peak reduction rates by combined measures were higher than those of any individual measure, while the total reduction rates were second only to LID control. Notably, the total reduction rates achieved under combined conditions are equivalent to the sum of each individual condition, demonstrating that the impact of each measure is independent. This result denotes that the collective reduction in emissions accomplished by the diverse measures can be aggregated, thereby enabling the selection of the optimal and feasible conglomeration of remedial measures to alleviate pollution from varying origins, and ultimately achieve an enhanced water environment governance effect.
The treatment scenarios set in the SWMM simulation for this study are relatively simple and do not take into account the actual situation for more detailed settings. Specifically, the water diversion measures only consider the changes in water flow rate, and do not take into account the changes in pollutant levels caused by the changes in hydraulic conditions such as flow velocity resulting from water diversion (Yang et al., 2021). In addition, the sediment dredging is reflected in the variation of endogenous release rate, but actual engineering conditions were not taken into account. Moreover, the LID control measures were only represented by biological retention ponds and only considered the area of deployment, without taking into account more types of LID facilities and detailed deployment plans, which can impact the effectiveness of LID measures (Lee et al., 2022; Ma and Zhao, 2022). However, our goal is not to form a detailed treatment plan but to focus on the presentation effects of the four measures in the Luojiagang catchment. Therefore, simple scenario settings can still serve as a reference for water environment management in the region.
5 Conclusion
Under the current increasingly serious water pollution situation in urban, the comprehensive treatment and protecting measures in urban small catchment are the necessary step to the water pollution treatmen, not only focus on the water bodies themself. The comprehensive water pollution control measures, including the LID source control in a catchment and the treatment measures of the polluted water bodies, are getting more and more attention. But the effects evaluation and planning decision of the different schemes are facing the challenges of the complicated variety of the water pollution control measures and their combination. In order to explore the effects of the water pollution control measures and help the planning decision making, in this study, the Luojiagang river channel and its catchment in Wuhan, which has been heavily impacted by water pollution, are taken as an example for the comparative assessment of pollution control measures including the LID by using SWMM model. The results of this study provided scientific reference and practicable guidance for the water environment management in urban small catchment, and the following conclusions can be drawn.
(1) Through the comparison of pollution treatment measures based on scenarios simulation with the baseline scenarios, it was found that the reduction effects of pollutant peak concentrations at the outlet node of Luojiagang River had the decreasing order of: COS > LID control > WAD > SET > SED, and the reduction effects of total pollutant load had the decreasing order of: LID > COS > SET > SED > WAD.
(2) The results show that the control of non-point source pollution is the key for the improvement of water quality in Luojiagang River, and LID plays important role in the reduction of both pollutant peak concentrations and load. Therefore, while promoting the construction of LID facilities, it is essential to target non-point source pollution control.
(3) The total pollutant reduction rate of the combined measures was basically equal to the sum of the individual measures, indicating that the effects of various measures are independent and their governance effects can be overlapped.
(4) This study shows the implication for the decision of the water pollution contoling schemes in urban small catchment. In order to create a practical and comprehensive water environment management plan, future study will give more thought to the actual engineering conditions and further refine the model, especially in terms of the layout plan for LID facilities.
Data availability statement
The original contributions presented in the study are included in the article/supplementary material, further inquiries can be directed to the corresponding author.
Author contributions
JL: Conceptualization, Methodology, Writing–original draft. XZ: Funding acquisition, Project administration, Resources, Writing–review and editing. HG: Data curation, Investigation, Visualization, Writing–review and editing.
Funding
The author(s) declare that financial support was received for the research, authorship, and/or publication of this article. This research was supported by the Key Research and Development Program of Hubei Province (No. 2021BCA128), the Ministry of Water Resources of the People’s Republic of China (SKS-2022014).
Conflict of interest
The authors declare that the research was conducted in the absence of any commercial or financial relationships that could be construed as a potential conflict of interest.
Publisher’s note
All claims expressed in this article are solely those of the authors and do not necessarily represent those of their affiliated organizations, or those of the publisher, the editors and the reviewers. Any product that may be evaluated in this article, or claim that may be made by its manufacturer, is not guaranteed or endorsed by the publisher.
References
Alves, A., Gersonius, B., Kapelan, Z., Vojinovic, Z., and Sanchez, A. (2019). Assessing the Co-Benefits of green-blue-grey infrastructure for sustainable urban flood risk management. J. Environ. Manag. 239, 244–254. doi:10.1016/j.jenvman.2019.03.036
Baek, S.-S., Choi, D.-H., Jung, J.-W., Lee, H.-J., Lee, H., Yoon, K.-S., et al. (2015). Optimizing low impact development (LID) for stormwater runoff treatment in urban area, Korea: experimental and modeling approach. Water Res. 86, 122–131. doi:10.1016/j.watres.2015.08.038
Beryani, A., Goldstein, A., Al-Rubaei, A. M., Viklander, M., Hunt III, W. F., and Blecken, G. T. (2021). Survey of the operational status of twenty-six urban stormwater biofilter facilities in Sweden. J. Environ. Manage. 297, 113375. doi:10.1016/j.jenvman.2021.113375
Charters, F. J., Cochrane, T. A., and O’Sullivan, A. D. (2021). The influence of urban surface type and characteristics on runoff water quality. Sci. Total Environ. 755, 142470. doi:10.1016/j.scitotenv.2020.142470
Chaves, M. T. R., Farias, T. R. L., and Eloi, W. M. (2024). Comparative analysis of bioretention design strategies for urban runoff infiltration: a critical overview. Eco. Eng. 207, 107352. doi:10.1016/j.ecoleng.2024.107352
Chen, C., Kong, M., Wang, Y.-Y., Shen, Q.-S., Zhong, J.-C., and Fan, C.-X. (2020). Dredging method effects on sediment resuspension and nutrient release across the sediment-water interface in Lake Taihu, China. Environ. Sci. Pollut. Res. 27, 25861–25869. doi:10.1007/s11356-019-06192-w
Chen, M., Cui, J., Lin, J., Ding, S., Gong, M., Ren, M., et al. (2018). Successful control of internal phosphorus loading after sediment dredging for 6years: a field assessment using high-resolution sampling techniques. Sci. Total Environ. 616–617, 927–936. doi:10.1016/j.scitotenv.2017.10.227
Dai, J., Wu, S., Wu, X., Lv, X., Sivakumar, B., Wang, F., et al. (2020). Impacts of a large river-to-lake water diversion project on lacustrine phytoplankton communities. J. Hydrology 587, 124938. doi:10.1016/j.jhydrol.2020.124938
de Oliveira, J. A. P., Bellezoni, R. A., Shih, W., and Bayulken, B. (2022). Innovations in urban green and blue infrastructure: tackling local and global challenges in cities. J. Clean. Prod. 362, 132355. doi:10.1016/j.jclepro.2022.132355
Ehleringer, J. R., Barnette, J. E., Jameel, Y., Tipple, B. J., and Bowen, G. J. (2016). Urban water – a new frontier in isotope hydrology. Isotopes Environ. Health Stud. 52, 477–486. doi:10.1080/10256016.2016.1171217
Follstad Shah, J. J., Jameel, Y., Smith, R. M., Gabor, R. S., Brooks, P. D., and Weintraub, S. R. (2019). Spatiotemporal variability in water sources controls chemical and physical properties of a semi-arid urban river system. JAWRA J. Am. Water Resour. Assoc. 55, 591–607. doi:10.1111/1752-1688.12734
Gessner, M. O., Hinkelmann, R., Nützmann, G., Jekel, M., Singer, G., Lewandowski, J., et al. (2014). Urban water interfaces. J. Hydrology 514, 226–232. doi:10.1016/j.jhydrol.2014.04.021
Gironás, J., Roesner, L. A., Rossman, L. A., and Davis, J. (2010). A new applications manual for the Storm water management model (SWMM). Environ. Model. and Softw. 25, 813–814. doi:10.1016/j.envsoft.2009.11.009
Glaister, B. J., Fletcher, T. D., Cook, P. L., and Hatt, B. E. (2017). Interactions between design, plant growth and the treatment performance of stormwater biofilters. Eco. Eng. 105, 21–31. doi:10.1016/j.ecoleng.2017.04.030
Grimm, N. B., Faeth, S. H., Golubiewski, N. E., Redman, C. L., Wu, J., Bai, X., et al. (2008). Global change and the ecology of cities. Science 319, 756–760. doi:10.1126/science.1150195
Gu, X., Chen, K., Zhang, L., and Fan, C. (2016). Preliminary evidence of nutrients release from sediment in response to oxygen across benthic oxidation layer by a long-term field trial. Environ. Pollut. 219, 656–662. doi:10.1016/j.envpol.2016.06.044
Guo, X. M., and Kang, L. (2012). Research on tactics of water diversion of lake dong. Adv. Mater. Res. 356–360, 2358–2361. doi:10.4028/www.scientific.net/amr.356-360.2358
Hu, M., Zhang, X., Li, Y., Yang, H., and Tanaka, K. (2019). Flood mitigation performance of low impact development technologies under different storms for retrofitting an urbanized area. J. Clean. Prod. 222, 373–380. doi:10.1016/j.jclepro.2019.03.044
Huang, J., Zhang, Y., Arhonditsis, G. B., Gao, J., Chen, Q., Wu, N., et al. (2019). How successful are the restoration efforts of China’s lakes and reservoirs? Environ. Int. 123, 96–103. doi:10.1016/j.envint.2018.11.048
Huang, J. J., Xiao, M., Li, Y., Yan, R., Zhang, Q., Sun, Y., et al. (2022). The optimization of Low Impact Development placement considering life cycle cost using Genetic Algorithm. J. Environ. Manag. 309, 114700. doi:10.1016/j.jenvman.2022.114700
Khan, I., Zakwan, M., Koya Pulikkal, A., and Lalthazula, R. (2022). Impact of unplanned urbanization on surface water quality of the twin cities of Telangana state, India. Mar. Pollut. Bull. 185, 114324. doi:10.1016/j.marpolbul.2022.114324
Kuhlemann, L.-M., Tetzlaff, D., and Soulsby, C. (2020). Urban water systems under climate stress: an isotopic perspective from Berlin, Germany. Hydrol. Process. 34, 3758–3776. doi:10.1002/hyp.13850
Lee, J., Kim, J., Lee, J. M., Jang, H. S., Park, M., Min, J. H., et al. (2022). Analyzing the impacts of sewer type and spatial distribution of LID facilities on urban runoff and non-point source pollution using the Storm water management model (SWMM). Water 14, 2776. doi:10.3390/w14182776
Li, G., Xiong, J., Zhu, J., Liu, Y., and Dzakpasu, M. (2021). Design influence and evaluation model of bioretention in rainwater treatment: a review. Sci. Total Environ. 787, 147592. doi:10.1016/j.scitotenv.2021.147592
Li, Q., Wang, F., Yu, Y., Huang, Z., Li, M., and Guan, Y. (2019). Comprehensive performance evaluation of LID practices for the sponge city construction: a case study in Guangxi, China. J. Environ. Manag. 231, 10–20. doi:10.1016/j.jenvman.2018.10.024
Li, Z., Xiao, J., Evaristo, J., and Li, Z. (2019). Spatiotemporal variations in the hydrochemical characteristics and controlling factors of streamflow and groundwater in the Wei River of China. Environ. Pollut. 254, 113006. doi:10.1016/j.envpol.2019.113006
Liu, C., Shao, S., Shen, Q., Fan, C., Zhou, Q., Yin, H., et al. (2015). Use of multi-objective dredging for remediation of contaminated sediments: a case study of a typical heavily polluted confluence area in China. Environ. Sci. Pollut. Res. 22, 17839–17849. doi:10.1007/s11356-015-4978-5
Liu, C., Zhong, J., Wang, J., Zhang, L., and Fan, C. (2016). Fifteen-year study of environmental dredging effect on variation of nitrogen and phosphorus exchange across the sediment-water interface of an urban lake. Environ. Pollut. 219, 639–648. doi:10.1016/j.envpol.2016.06.040
Liu, J. H. (2020). “Discussion on urban non-point source pollution simulation and prevention measures,” in Tianhe district of Guangzhou under the background of sponge city construction (Guangzhou, China: Guangdong University of Technology).
Liu, W., Wei, W., Chen, W., Deo, R. C., Si, J., Xi, H., et al. (2019). The impacts of substrate and vegetation on stormwater runoff quality from extensive green roofs. J. Hydrology 576, 575–582. doi:10.1016/j.jhydrol.2019.06.061
Ma, Y., and Zhao, H. (2022). The role of spatial patterns of low impact development in urban runoff pollution control within parcel based catchments. Front. Environ. Sci. 10, 926937. doi:10.3389/fenvs.2022.926937
McGrane, S. J. (2016). Impacts of urbanisation on hydrological and water quality dynamics, and urban water management: a review. Hydrological Sci. J. 61, 2295–2311. doi:10.1080/02626667.2015.1128084
Müller, A., Österlund, H., Marsalek, J., and Viklander, M. (2020). The pollution conveyed by urban runoff: a review of sources. Sci. Total Environ. 709, 136125. doi:10.1016/j.scitotenv.2019.136125
Nguyen, T. T., Ngo, H. H., Guo, W., Wang, X. C., Ren, N., Li, G., et al. (2019). Implementation of a specific urban water management - sponge City. Sci. Total Environ. 652, 147–162. doi:10.1016/j.scitotenv.2018.10.168
Pan, D., and Tang, J. (2021). The effects of heterogeneous environmental regulations on water pollution control: quasi-natural experimental evidence from China. Sci. Total Environ. 751, 141550. doi:10.1016/j.scitotenv.2020.141550
Qu, J., and Fan, M. (2010). The current state of water quality and technology development for water pollution control in China. Crit. Rev. Environ. Sci. Technol. 40, 519–560. doi:10.1080/10643380802451953
Revitt, D. M., and Ellis, J. B. (2016). Urban surface water pollution problems arising from misconnections. Sci. Total Environ. 551, 163–174. doi:10.1016/j.scitotenv.2016.01.198
Ritter, A., and Muñoz-Carpena, R. (2013). Performance evaluation of hydrological models: statistical significance for reducing subjectivity in goodness-of-fit assessments. J. Hydrology 480, 33–45. doi:10.1016/j.jhydrol.2012.12.004
Rong, G., Hu, L., Wang, X., Jiang, H., Gan, D., and Li, S. (2021). Simulation and evaluation of low-impact development practices in university construction: a case study of Anhui University of Science and Technology. J. Clean. Prod. 294, 126232. doi:10.1016/j.jclepro.2021.126232
Rossman, L. A., and Simon, M. A. (2022). Storm water management model User’s manual version 5.2, center for environmental solutions and emergency response office of research and development. Washington, DC: US Environmental Protection Agency. Available at: https://www.epa.gov/system/files/documents/2022-04/swmm-users-manual-version-5.2.pdf.
Seo, M., Jaber, F., Srinivasan, R., and Jeong, J. (2017). Evaluating the impact of low impact development (LID) practices on water quantity and quality under different development designs using SWAT. Water 9, 193. doi:10.3390/w9030193
Tao, T., and Xin, K. (2014). Public health: a sustainable plan for China’s drinking water. Nature 511, 527–528. doi:10.1038/511527a
Weng, J. (2017). Post-dredging effect assessment based on sediment chemical quality in urban rivers of Yangzhou. Environ. Monit. Assess. 189, 246. doi:10.1007/s10661-017-5963-x
Yang, H., Wang, J., Li, J., Zhou, H., and Liu, Z. (2021). Modelling impacts of water diversion on water quality in an urban artificial lake. Environ. Pollut. 276, 116694. doi:10.1016/j.envpol.2021.116694
Zhu, L., Zhang, H., Li, Y., Sun, W., Song, C., Wang, L., et al. (2022). Dredging effects on nutrient release of the sediment in the long-term operational free water surface constructed wetland. J. Environ. Manage. 322, 116160. doi:10.1016/j.jenvman.2022.116160
Keywords: urban, SWMM model, water pollution treatment, scenario simulation, Wuhan
Citation: Liu J, Zhang X and Gui H (2024) Comparative assessment of pollution control measures for urban water bodies in urban small catchment by SWMM. Front. Environ. Sci. 12:1458858. doi: 10.3389/fenvs.2024.1458858
Received: 03 July 2024; Accepted: 09 October 2024;
Published: 21 October 2024.
Edited by:
Jahangeer Jahangeer, University of Nebraska-Lincoln, United StatesReviewed by:
Sughosh Madhav, Jamia Millia Islamia, IndiaQizi Fu, Hunan University, China
Mohammad Zakwan, Maulana Azad National Urdu University, India
Copyright © 2024 Liu, Zhang and Gui. This is an open-access article distributed under the terms of the Creative Commons Attribution License (CC BY). The use, distribution or reproduction in other forums is permitted, provided the original author(s) and the copyright owner(s) are credited and that the original publication in this journal is cited, in accordance with accepted academic practice. No use, distribution or reproduction is permitted which does not comply with these terms.
*Correspondence: Xiang Zhang, emhhbmd4aWFuZ0B3aHUuZWR1LmNu
 Jie Liu
 Xiang Zhang
 Haijiao Gui2,3