 Bruno Andreas Walther
 Franco Pasolini
 Špela Korez Lupše1†
 Melanie Bergmann
- 1Alfred-Wegener-Institut Helmholtz-Zentrum für Polar- und Meeresforschung, Bremerhaven, Germany
- 2Department of Life and Environmental Science, Università di Cagliari, Cagliari, Italy
Plastic production and plastic waste have increased to such an extent that it has become globally ubiquitous. Several studies already have investigated the meso- and microplastic pollution along the German Baltic and North Sea coasts, but were all limited to a few locations. To obtain representative bulk samples from sandy beaches along the entire German coast, we initiated a citizen-science project entitled “Microplastic Detectives.” Here, we describe in detail 1) how we recruited, instructed, and engaged citizen scientists, 2) why we chose bulk sampling over reduced-volume sampling, and 3) the laboratory methods we used. The citizen scientists collected 1,139 samples from 71 locations along the German coast, totalling 2.2 tons of sand. After drying, sieving with a 1 mm sieve, and visual inspection of the retained fraction under a binocular microscope, all putative plastic particles ≥1 mm were analysed by attenuated total reflectance Fourier transform infrared (ATR-FTIR) spectroscopy. 177 out of 1,139 samples (15.5%) contained a total of 260 plastic particles, with a large right-skewed variation among locations. Most of the particles were fragments, foils, foams, fibres, and pellets (96.2% in total), and 89.6% of the particles were made of polyethylene, polypropylene, polyester, and polystyrene. The unweighted mean pollution densities were 4.12 particles m−2, 0.17 particles kg−1 and 0.27 particles L−1, and the weighted mean pollution densities were 3.77 particles m−2, 0.11 particles kg−1 and 0.18 particles L−1. These densities are lower than in other similar studies, but previous studies had important methodological differences. We discuss how these differences could have influenced the results and make recommendations for improving future studies. Two important recommendations are 1) to use random or stratified random sampling and 2) to run transects perpendicular (rather than parallel) to the waterline. Our study highlights that large-scale, scientifically rigorous monitoring of meso- and microplastic pollution is possible at the national level, and possibly even at much larger spatial and temporal scales. With the help of local authorities, such a monitoring program could be established.
1 Introduction
Plastic pollution has become a hallmark of the Anthropocene (Waters et al., 2016; Zalasiewicz et al., 2016) because plastic production and pollution have grown exponentially since World War II (Geyer, 2020) and are predicted to continue on this path (Borrelle et al., 2020; Lau et al., 2020). Therefore, it is not surprising that plastic pollution has become ubiquitous (Tekman et al., 2022) and has been documented in the marine (Bergmann et al., 2017a), freshwater (Koutnik et al., 2021), terrestrial (Schwarz et al., 2023), polar (Bergmann et al., 2022; Walther and Bergmann, 2022), and atmospheric realm (Allen et al., 2022). Over time, plastics break down into smaller particles due to the action of UV light, temperature and mechanic abrasion (Arp et al., 2021) with a 50-fold increase in the ocean expected by 2,100 (Everaert et al., 2018). This irreversible plastic pollution has begun to impact species, populations, and ecosystems to varying degrees, running the entire spectrum from interactions causing no detectable harm to severe harm (Bergmann et al., 2015; Tekman et al., 2022), and could lead to irreversible harm unless severe reductions in production and pollution are achieved (MacLeod et al., 2021; Persson et al., 2022).
Owing to various pollution sources, macro-, meso- and microplastics now also prevail in the Baltic and North Seas. They have been found in large numbers in the water column (Hänninen et al., 2021; Roscher et al., 2021; Narloch et al., 2022; She et al., 2022), sublittoral sediments (Lorenz et al., 2019; Näkki et al., 2019; Kukkola et al., 2022), beach sediments (Supplementary Table S10), and many species (Tekman et al., 2022), including zooplankton (Setälä et al., 2014), mussels (Halbach et al., 2022), demersal species (Pagter et al., 2020), fishes (Lenz et al., 2016; Rummel et al., 2016), seabirds (van Franeker et al., 2011), seals (Unger et al., 2017; Philipp et al., 2020), porpoises (Unger et al., 2017; van Franeker et al., 2018), and whales (Unger et al., 2016).
Citizen-science is rapidly expanding into many fields of research. It is defined as scientific research conducted in partnership between professional scientists and institutions with people who are not professionally working as scientists in the relevant scientific field (Kullenberg and Kasperowski, 2016). It involves public participation and collaboration in scientific research with the aim of increasing scientific knowledge; this participation can range from data collection to the interpretation and dissemination of scientific results. Topics can cover almost every realm of science, and the degree of participation can also vary greatly (Shirk et al., 2012). Its importance for plastic pollution research is evident from at least eight reviews that have already been published (Thiel et al., 2014; Cigliano et al., 2015; Hidalgo-Ruz and Thiel, 2015; Zettler et al., 2017; Kawabe et al., 2022; Popa et al., 2022; Severin et al., 2022; Raman et al., 2023) and evaluated challenges and opportunities (Nelms et al., 2022). Several citizen-science projects have assessed macro-debris pollution, which consists mainly of debris made of plastic in the Baltic Sea and North Sea region (e.g., Falk-Andersson et al., 2019; Honorato-Zimmer et al., 2019; Schöneich-Argent et al., 2019; Turrell, 2019). To the best of our knowledge, there are only eight examples worldwide of citizen science projects investigating meso- and microplastic pollution in coastal marine environments (e.g., Hidalgo-Ruz and Thiel, 2013; Gewert et al., 2017; Doyen et al., 2019; Carbery et al., 2020; Nel et al., 2020; Paradinas et al., 2021; Jones et al., 2022; Pasolini et al., 2023).
Given the scarcity of comparable data on the large-scale distribution of microplastic pollution along German coastlines, we devised a citizen-science project to expand the scale of observations and quantify meso- and microplastic pollution along German Baltic Sea and North Sea beaches. The involvement of citizen scientists allowed us to sample the entire German coastline to detect variation in pollution levels but also to generate publicity for this environmental issue (Kiessling et al., 2021). This project was called “Microplastic Detectives” (Mikroplastikdetektive in German) and involved citizen scientists in three out of the four stages of the project. During the first stage, a realistic sampling concept was developed through discussion and joint initial sampling with professionally trained scientists and citizen scientists. During the second stage, various groups of citizen scientists were recruited to collect samples on sandy beaches of the Baltic and North Seas. During the laboratory stage, macro-, meso- and microplastic particles were extracted from the sand samples. Throughout the project, but especially during the final stage, the results were disseminated to the public via social and traditional media, involving the citizen scientists in the media work.
In this paper, we describe in detail 1) how we arrived at the particular sampling method through discussions with professional and citizen scientists, 2) the levels of plastic pollution detected at 71 sampling locations, 3) statistical analyses relating independent variables to pollution levels, and 4) reviewing and comparing our results with previous studies.
2 Materials and methods
2.1 Size definitions
Definitions of size categories for plastic pollution vary (Hartmann et al., 2019). We used the following definitions which are commonly (but not always) used: megaplastics (>100 cm), macroplastics (2.5–100 cm, abbreviated as MA), mesoplastics (5–25 mm, abbreviated as ME), microplastics (0.0001–5 mm, abbreviated as MP), and nanoplastics (1–100 nm). Since we focus mainly on meso- and microplastic particles, we also calculated amounts for both categories combined (abbreviated as MM). For calculations which included macro-, meso- and microplastic particles, we summarize them as plastic particles (abbreviated as PP).
2.2 Sampling methodology
In Supplementary Text S1.1, we describe in detail how we arrived at the major strategic decisions for our sampling methodology based on discussions with several professional and citizen scientists during the first few months of the project. Since the project was only funded for 20 months (September 2021–April 2023), we decided to collect samples from sandy beaches but not to sieve these samples on site (Supplementary Text S1.1; Supplementary Figure S1). This option avoided possible bias introduced by differences in sample pre-processing by different citizen scientists. Rather, the citizen scientists were instructed to send whole sand samples to our institute in metal boxes (in other words, to conduct bulk sampling instead of in situ volume-reduced sampling, see Hanvey et al., 2017). Once this decision was reached, detailed sampling instructions were shared (Supplementary Text S2), which we summarize below.
2.3 Recruiting citizen scientists
The next step was to engage citizen scientists to sample as many beaches along the German coastlines of the Baltic Sea and North Sea as possible. Supplementary Text S1.2 describes in detail how we recruited citizen scientists through a combination of contacting “the usual suspects” of relevant non-governmental organisations (NGOs) and government agencies, followed by “snowball sampling,” which resulted in approximately 100 contacts with various individuals and citizen scientists affiliated with NGOs (Supplementary Text S4). Each potential participant received the sampling instructions (Supplementary Text S2), a project summary (Supplementary Text S5), background information (Supplementary Text S6) and all sampling equipment (listed under “Material and equipment provided by the Alfred Wegener Institute” in Supplementary Text S2.2). Since many publications refer to “sand samples” as “sediment samples,” we emphasize that all our samples were indeed sand samples from sandy beaches.
2.4 Collecting sand samples
The citizen scientists decided when and where to take the samples. On the chosen sandy beach, the citizen scientists selected a random point from which to start measuring the sampling grid using our instructions (see detailed instructions in Supplementary Text S2.2). At most locations, the length of the grid was 100 m along the water’s edge, and the width was determined by the width of the beach (Figure 1). At each of the 20 sampling points, a stainless-steel frame (24 × 24 cm sampling area = 0.0576 m2) was pushed into the sand (only the first three locations listed in Supplementary Table S4 had a sampling area of 0.36 m2 due to a misunderstanding). Using a metal shovel, a metal container (195 × 153 × 76 mm, Tinware Direct) was filled with sand from within the sampling frame, so that several centimetres of sand were evenly removed from the sand surface. At some locations, the grid was modified because the citizen scientists chose to sample fewer than five collection lines because of spatial or temporal constraints, resulting in different sample sizes (Supplementary Table S4). The citizen scientists sealed all the containers with adhesive tape and sent them to the Alfred Wegener Institute in Bremerhaven, Germany. Metadata (data collection sheet “Location,” photos, additional information such as suggestions for improvement) were emailed to BAW and entered into a database.
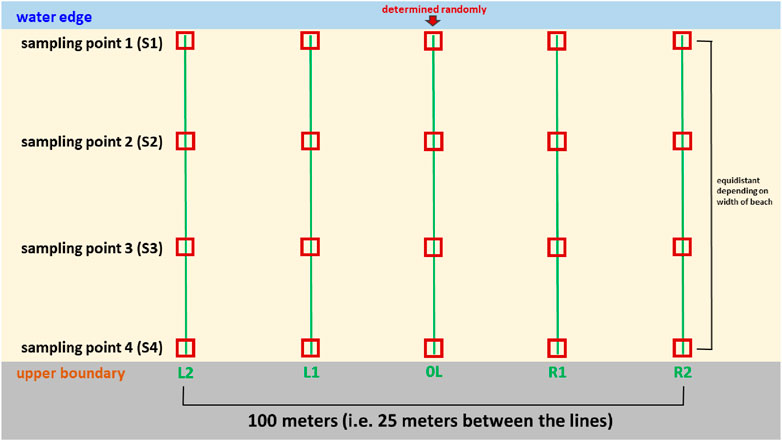
Figure 1. Sampling grid used to establish sampling points (dark red squares) for the 71 sampling locations (Supplementary Table S4). The location of the first collection line (green line) was determined randomly. The width of the beach was measured along this randomly placed zero line (0L), and four sampling points were placed along this line equidistantly. The other four collection lines were placed parallel to the zero line at 25 m distance along the water’s edge, with two lines to the left (L1 and L2) and two lines to the right (R1 and R2) of the zero line. The upper boundary of the beach was determined by a hard boundary (e.g., the beginning of vegetation, or rock surface, or icy cover).
For each sampling location, we categorized independent variables such as the location’s region (Baltic Sea, North Sea, river Elbe, or river Weser) and its island status (island or coastline), which were deduced from the geographic coordinates (Supplementary Table S4; Figure 2).
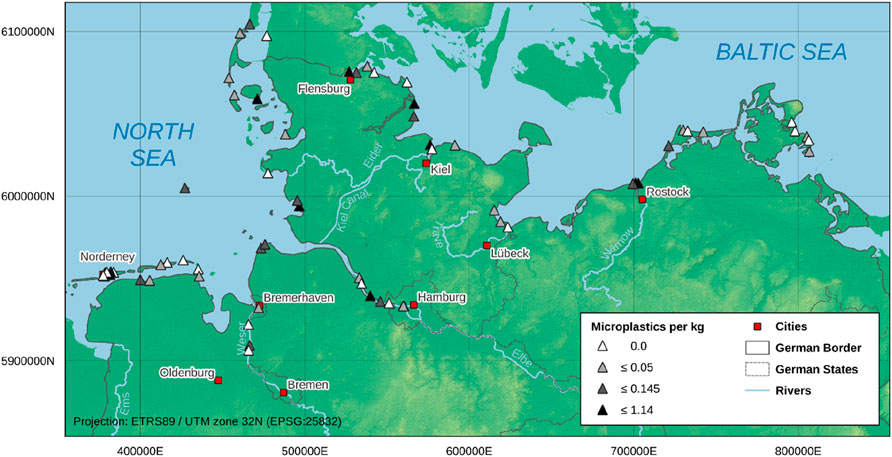
Figure 2. Map of the 71 sampling locations along the German coast (Supplementary Table S4). All inland locations are situated on beaches along the Elbe and Weser rivers. A close-up map of Norderney (westernmost sampling locations) is shown in Supplementary Figure S15 (map sources: OpenStreetMap contributors; GeoBasis-DE / BKG (2024); SRTM data (2014, NASA), processed by mundialis).
2.5 Laboratory work
Details of the entire laboratory work flow are provided in Supplementary Text S7. Each sand sample was dried at 50°C for 1–3 days until dry, which is the upper temperature limit for drying sand samples recommended by Goli et al. (2022). Temperatures between 50°C and 60°C are commonly used (e.g., Kunz et al., 2016; Chen and Chen, 2020), as higher temperatures could change the chemical and morphological structure of polymers (Munno et al., 2018; Pfeiffer and Fischer, 2020; Primpke et al., 2020; Goli et al., 2022). The dry weight of each sand sample was determined (Kompakt Waagen Kern EMB-Series 6000-1, accurate to 0.1 g), as was its volume using a glass beaker. The sand was poured into a 5-mm steel sieve stacked on top of a 1-mm steel sieve (A Rocha International, 2018). The contents of the two sieves were then inspected to remove any obvious non-plastic materials such as vegetation, large stones, shells, etc. if no plastic particles were attached to these materials.
To minimise contamination of the samples with airborne PP, a high-performance air purifier (DustBox 1000 VSC Hochleistungs-Luftreiniger H14) ran continuously alongside the laboratory ventilation system. White laboratory coats made of cotton were worn by all laboratory workers, and synthetic textiles avoided. All samples were immediately covered with aluminium lids when not in use.
In addition, we set our lower boundary of PP to 1 mm a priori, assuming that plastics ≥1 mm would not easily become airborne and contaminate our samples (thus our range for microplastics was restricted to 1–5 mm). To test this, we filled a bowl with a 500 cm2 surface area with Milli-Q water and placed it next to the laboratory equipment, so that the water could catch airborne particles (=blank). At the end of five working days in the laboratory, we filtered the water from the bowl through a 5-μm pore size filter paper using a vacuum pump connected to a collecting flask via a rubber tube (Lee et al., 2019). Since there were no plastic particles on any of the examined filters, we concluded that there was no airborne contamination of our sand samples with plastic particles ≥1 mm.
2.6 Visual examination
The contents remaining in the sieves were first visually examined under a binocular microscope (Olympus SZX16) under 2× or 5× magnification. For that purpose, we transferred a subsample onto a glass Petri dish and spread it in such a way that the particles formed a single particle layer with no particles lying on top of each other obscuring the view of particles below (Supplementary Figures S13, S14). We then visually scrutinised the contents for putative PP. Since most of it consisted of sand particles and bicarbonate shells, fragments and organic material (e.g., stems, algae), it usually took only a few minutes to pick out putative plastic particles with tweezers for analysis. A photo was taken, and then each particle was placed in a labelled container (see Supplementary Text S7).
Every putative PP particle was analysed by attenuated total reflectance Fourier transform infrared (ATR-FTIR) spectroscopy. Non-suspect particles were all particles that were clearly sand particles or complete or broken shells, which 1) made up most of the contents of the fraction retained in the 1-mm sieve and 2) can be easily distinguished via visual examination after training (e.g., Esiukova, 2017; Section 2.3 in Kunz et al., 2016; Section 2.2 in Bancin et al., 2019). Any particle that did not clearly belong into the category of non-suspect particle was analysed by ATR-FTIR. In most cases, our initial visual classifications were confirmed as plastics. But in some cases, they turned out to be made of bicarbonate, cellulose, glass, coal, or metal. If the analysis showed that the particle was made of a plastic polymer, we recorded the following data.
2.6.1 Plastic shape
Fragments: These included all particles that were likely fragments of previously larger particles. Fragments are characterized by an irregular shape, as well as signs of breaking, cutting, or abrasion.
Foils: These included all particles that were thin, sheet-like, flexible, and likely originated from bags, packing foil, or other similar foil type items.
Foams: These included all particles that were soft and flexible and appeared like Styrofoam or other foamy or spongy plastic materials.
Fibres: Some fibres in our samples were tangled together in larger bundles that could not be disentangled for individual fibre count. In those cases, each bundle was counted as one fibre in a sample. Consequently, the number of fibres only represents a minimum estimate.
Pellets: These included all industrial resin pellets (also called nurdles) which are a primary microplastic and occurred as cylindrical or spherical particles.
Rare shapes: There were several items whose shape is self-explanatory, namely cigarette filter, bottle cap, button, stick, and plastic cap.
2.6.2 Particle size
The maximum length was defined as the longest possible distance between two endpoints of the particle and was measured with a calliper to an accuracy of ±0.1 mm in order to categorize the particle as macro-, meso-, or microplastic.
2.6.3 Particle colour
The colour was determined visually.
2.7 Polymer identification
An ATR-FTIR spectrometer (ALPHA Basis Modul A250/DII, Bruker Optics) was used to identify the polymer type of putative PP in combination with reference spectra in the libraries of the installed OPUS software and the freeware siMPle (Primpke et al., 2018; Primpke et al., 2020; Supplementary Text S8). We set the hit quality index (HQI) at ≥0.70 (i.e. at least a 70% match with the reference spectrum) (Renner et al., 2019). Each particle was analysed only once if the HQI was ≥0.70. At a lower HQI, we analysed the particle three times in different orientations, and particles were considered plastic if the resulting mean HQI was ≥0.70.
2.8 Calculation of unweighted and weighted averages
Since the amount of sand collected at each sampling location varied (Supplementary Table S4), we used two methods to calculate a mean for the pollution level.
The first one is to use each of the 71 sampling locations as one unweighted datapoint (even though the sampled area and the mass and volume of sand recovered from each location could differ). This calculation results in an unweighted average (or mean) because each sample is given the same importance despite differences in the area or amount of sand being different (this is the “usual” way of calculating a mean). The second method is to use each of the 71 sampling locations as a weighted datapoint (with the weight of the datapoint depending on the amount of area, mass, or volume). This calculation results in a weighted average (or mean) because each sample is given an importance (or weight) according to the amount of area, mass, or volume. In our case, calculating the weighted mean is essentially the same as simply dividing the total number of PP by the total area or total mass or volume of sand (Supplementary Text S9). The unweighted means are given with ±1 standard deviation.
2.9 Statistical analyses
We used the non-parametric Mann-Whitney U test and Spearman’s rank correlation because most data were not normally distributed (e.g., Figures 3–6; Supplementary Figure S16). All p-values are two-tailed, and a level of p < 0.05 was considered statistically significant.
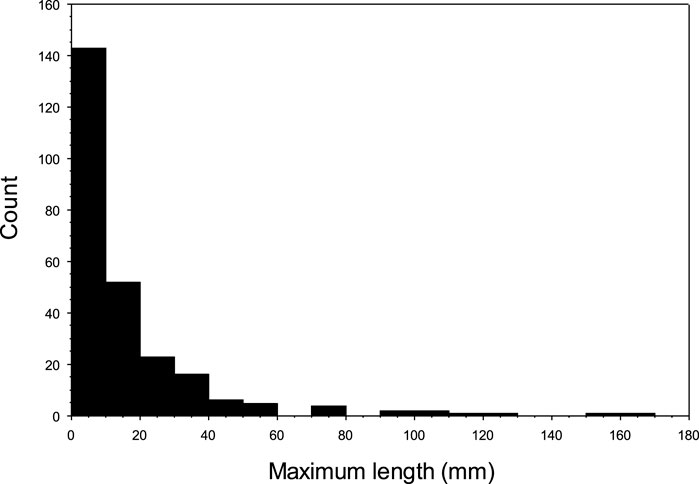
Figure 3. Size frequency histogram of 258 plastic particles found in 1,139 sand samples along the German coast.
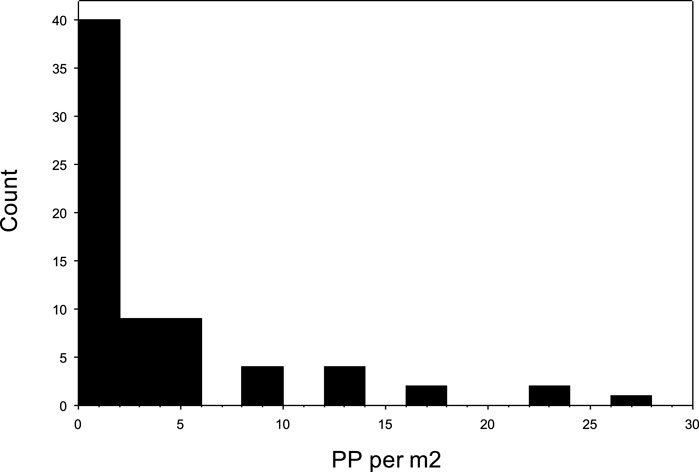
Figure 4. Frequency histogram of plastic particles per unit area at 71 sampling locations along the German coast.
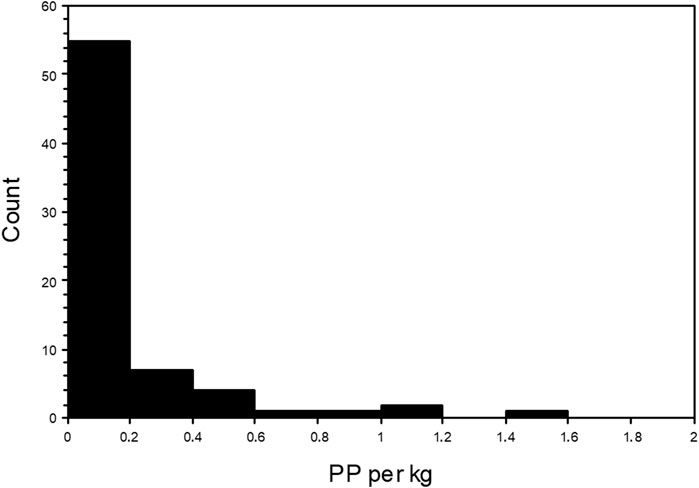
Figure 5. Frequency histogram of the number of plastic particles per unit mass at 71 sampling locations along the German coast.
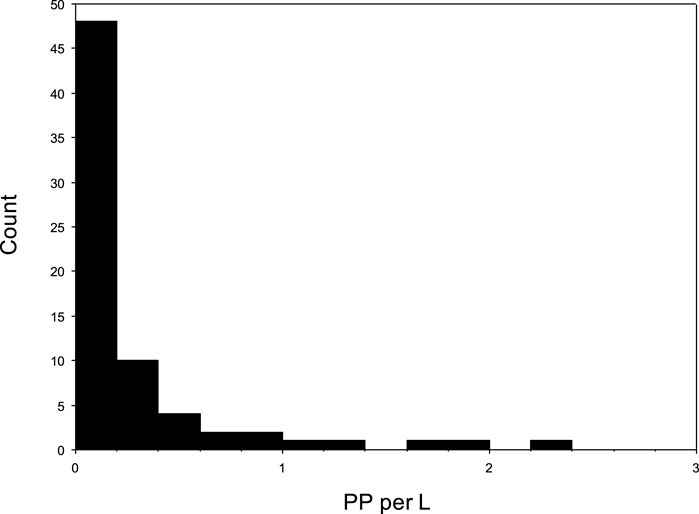
Figure 6. Frequency histogram of plastic particles per unit volume at 71 sampling locations along the German coast.
2.10 Comparison to previous studies
In order to compare our results to similar studies, we conducted a search for studies, which 1) sampled sandy sediments on beaches, 2) were conducted along the Baltic or North Sea coasts, and 3) focussed on meso- and microplastic densities (in N kg−1 sediment). The literature search was conducted with Google Scholar and Web of Science using combinations of the following keywords: Baltic Sea, North Sea, microplastic, mesoplastic, beach, sand, and sediment), the database LITTERBASE (Bergmann et al., 2017a; Bergmann et al., 2018), and cross-referencing.
3 Results
3.1 Summary information about collections
Seventy-one locations were sampled between September 2021 and December 2022 (Supplementary Table S4) by approximately 300 participants from 30 organizations (Supplementary Text S4), who collected 1,139 samples along the Baltic and North Sea coasts (Supplementary Table S4; Figure 2). Since ten samples were damaged during transport, 1,129 samples were analysed. In total, an area of 68.36 m2 was sampled, and 2,245.562 kg and 1,423.180 L of sand analysed (Table 1).
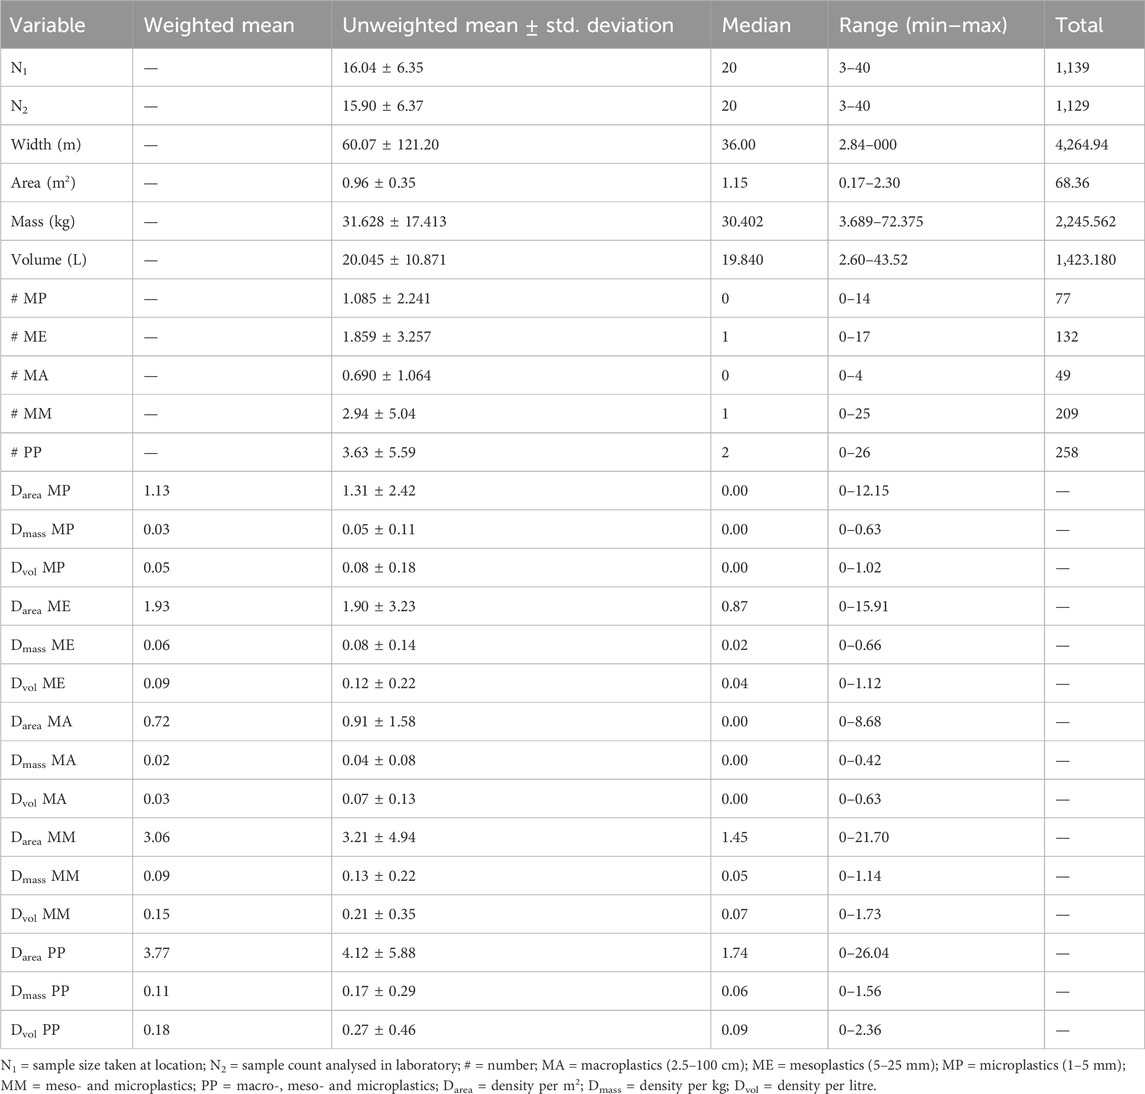
Table 1. Summary data of 71 sampling locations and plastic pollution levels (data for each sampling location are presented in Supplementary Tables S4–S6; width, area, mass, and volume of each sampling location are given in Supplementary Table S4).
3.2 Quantities and frequency of plastic pollution
One hundred seventy-seven out of 1,139 samples (15.5%) contained a total of 260 plastic particles. The highest levels of plastic particles were found at Hohe Düne (26.04 N m−2), Övelgönne 1 (22.57 N m−2), and Wassersleben (22.57 N m−2). Nineteen out of 71 locations (27%) contained no plastic particles (Supplementary Table S5).
Across all locations, the mean number of microplastics, mesoplastics, and macroplastics recovered was 1.09 MP, 1.86 ME, and 0.69 MA, respectively (Table 1). Since these means are biased due to different sample sizes (area, mass, and volume in Supplementary Table S4), we calculated the densities per area (m2), mass (kg), and volume (L) for each of the 71 locations, and then used these densities to calculate the weighted and unweighted mean pollution levels for microplastics (MP), mesoplastics (ME), macroplastics (MA), meso- and microplastics (MM), and macro-, meso- and microplastics (PP) (Table 1). For MM, the mean density was 3.06 and 3.21 N m−2, 0.09 and 0.13 N kg−1 sediment, and 0.15 and 0.21 N L−1 (always giving the weighted before the unweighted mean). For PP, the mean density was 3.77 N m−2 and 4.12 N m−2, 0.11, and 0.17 N kg−1 sediment, and 0.18 and 0.27 N L−1. Each mean pollution level was higher as an unweighted mean than as a weighted mean with the exception of the density per m2 for mesoplastics (Darea ME). All ranges included zero values, and 1) the mid-value of the range was always considerably higher than the values of the mean (both weighted and unweighted), and 2) the median was always lower than the mean (both weighted and unweighted), indicating uneven, right-skewed distributions of the pollution densities (Figures 4–6).
3.3 Characteristics of plastic particles
Two hundred and sixty plastic particles were recovered from the 1,139 samples, of which 77 were microplastics (29.6%), 132 were mesoplastics (50.8%), and 49 were macroplastics (18.8%), with two particles not measured (Table 2). The size frequency distribution showed a right-skewed (or positively skewed) distribution (Figure 3). Of the ten shape categories, fragments, foils, foams, fibres, and pellets were the most abundant, accounting for 96.2% of particles (Table 2). White colour was by far the most frequent colour (Table 2).
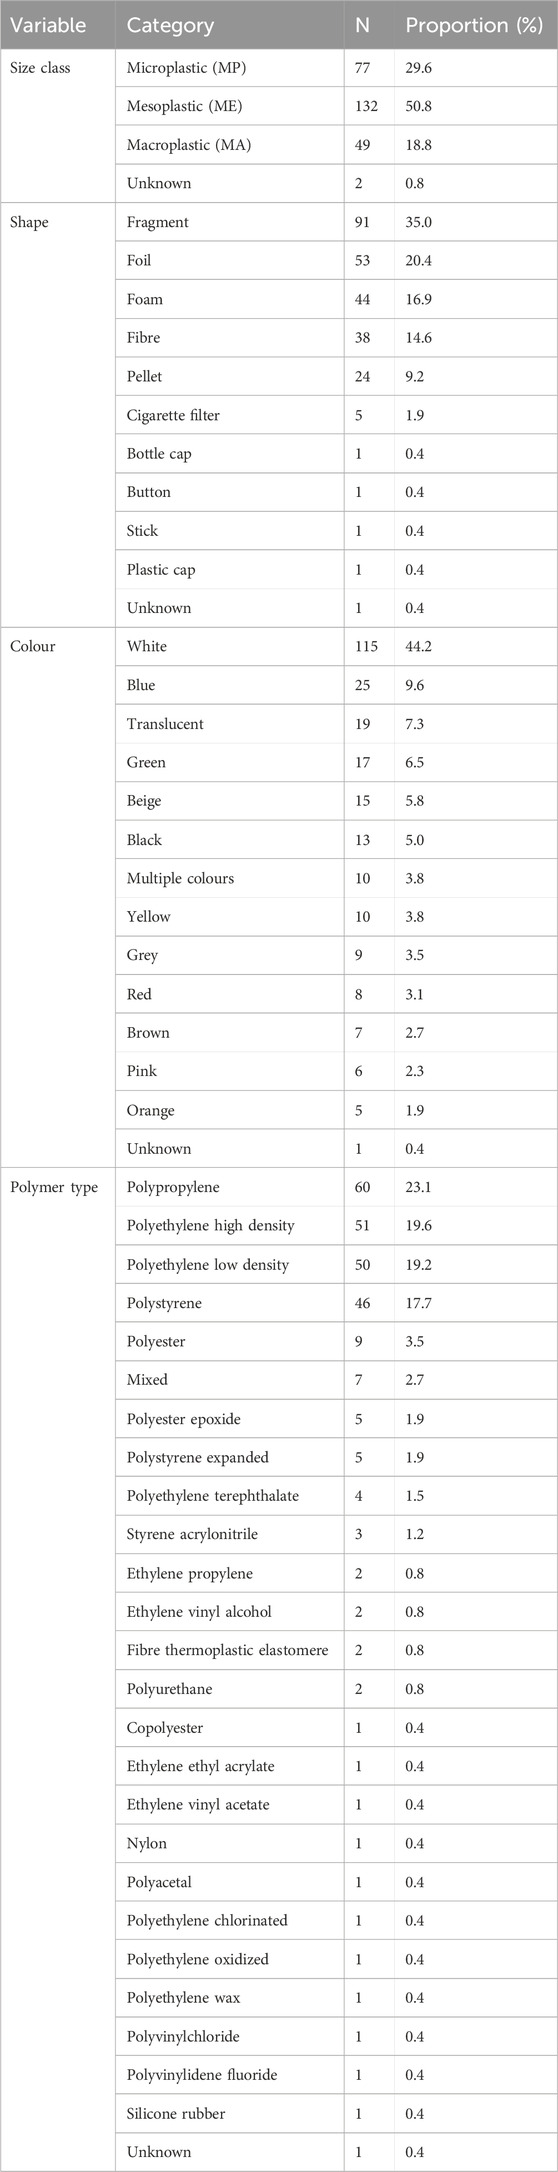
Table 2. Summary of characteristics of 260 plastic particles (Supplementary Table S7) found at 71 sampling locations along the German coast (Figure 2) given as numbers (N) and proportion.
We identified 25 polymer types (Table 2), with the four most common polymer types being much more abundant than the others, resulting in a right-skewed distribution with a distinct break between the abundant and rare types (Supplementary Figure S16). Polyethylene (five types: high density, low density, chlorinated, oxidized, wax), polypropylene (one type only), polyester (three types: normal, epoxide, copolyester), and polystyrene (three types: normal, expanded, acrylonitrile) accounted for 89.6% of all plastic particles.
3.4 Plastic pollution related to independent variables
As expected, the three measures of pollution (density per area, density per mass, and density per volume) were highly autocorrelated (Spearman’s rank correlation and n = 71 for all; Darea PP versus Dmass PP, Z = 7.77, rho = 0.93, p < 0.0001; Darea PP versus Dvol PP, Z = 7.79, rho = 0.93, p < 0.0001; Dmass PP versus Dvol PP, Z = 8.36, rho = 0.99, p < 0.0001). The results for the other categories of plastic particles (MP, ME, MA, and MM) were essentially the same.
There was a positive relationship between the four sampling points (from the water’s edge to the beach’s upper boundary, see Figure 1) and the number of plastic particles (PP) recovered, although this relationship was not statistically significant (Supplementary Table S8; Spearman’s rank correlation, n = 4, Z = 1.39, rho = 0.80, p = 0.17). Only 16.3% of all recovered plastic particles came from sampling point 1, but 33.9% from sampling point 4. The results for other categories of plastic particles (MP, ME, MA, and MM) were similar.
When we tested for differences between categories of region and island status, the results were again essentially the same for all categories of plastic particles, so we only report results for the category PP here (Supplementary Table S9). Baltic Sea samples had lower pollution levels of Dmass PP and Dvol PP, but the difference was not significant. There was no significant difference for pollution levels between ocean locations and river locations. Furthermore, there was no significant difference in pollution levels between coastal and island locations, which was also the case when we restricted the comparison to North Sea locations. However, when we limited this comparison to the Baltic Sea, pollution levels were higher in coastal than in island locations, but these differences were just outside the significance level (p = 0.06, see Supplementary Table S9).
When we considered only the 20 locations with the highest Darea PP, Dmass PP, and Dvol PP among the 71 locations, we noticed that the North Sea island of Norderney accounted for five, nine, and nine locations, respectively, of these 20 locations. Since Norderney contributed a total of 13 locations (Supplementary Figure S15), 38.5%, 69.2%, and 69.2% of all Norderney locations belonged to the 20 most polluted locations. Therefore, we also compared the 13 Norderney locations with the remaining 20 North Sea locations. We found no significant difference for Darea, but the Norderney locations had significantly higher pollution levels in terms of mass and volume (Supplementary Table S9).
3.5 Comparison to previous studies
Our literature search yielded 17 comparable studies conducted between ∼2009 and 2019 (Supplementary Table S10). As they vary considerably in 1) the number of locations sampled, 2) the number of samples, 3) sampling design (random or non-random), 4) amount of sediment sampled, 5) size definition of microplastics, 6) extraction method (e.g., visual inspection or density separation), 7) identification approach (visual, ATR-FTIR, Raman spectroscopy), and reporting (unweighted mean, weighted mean, median, and range), comparisons are difficult.
Our study had the lowest unweighted mean density (0.14 MP kg−1) compared to the densities of the 12 previous studies (range 1.77–160.3 MP kg−1) (Supplementary Table S11). Our study also had the lowest median density (0.05 MP kg−1) compared to the previous studies (range 4–293 MP kg−1).
However, many of these studies counted microplastics <1 mm, whereas our study only counted microplastics ≥1 mm. If we only include data from previous studies that reported densities of microplastics ≥1 mm, the following five values were reported: 0.0 MP kg−1, 0.7 MP kg−1, and 16.1 MP kg−1 for three different locations in Kiel (Schröder et al., 2021), 0.7 MP kg−1 in the Russian Baltic Sea (Esiukova et al., 2020) and 3.2 MP kg−1 in the German/Polish Baltic Sea (Esiukova et al., 2021) (mean of these five values: 4.14 ± 6.80 MP kg−1) (Supplementary Table S10). These values thus overlap with our mean density of 0.14 MP kg−1. Furthermore, several mean densities reported in global reviews were also lower than our mean density (Supplementary Table S10).
Focussing again on the unweighted mean density, the mean density for the Baltic Sea (n = 10 studies, 64.2 ± 58.7 MP kg−1) was higher than the mean density for the North Sea (n = 4 studies, 27.6 ± 45.4 MP kg−1), but this difference was not significant (Supplementary Table S11; Mann-Whitney U test, U = 12.0, p = 0.26). However, the mean density for locations in Poland and Russia (n = 7 studies, 86.1 ± 53.2 MP kg−1) was significantly higher than the mean density for the other locations (n = 8 studies, 28.4 ± 42.9 MP kg−1; Mann-Whitney U test, U = 8.0, p = 0.02).
4 Discussion
4.1 Comparison to similar studies
Many of the results of our citizen science study are quite typical when compared to similar studies. First, we found the typical size distribution where smaller particles are more abundant than larger particles (Figure 3). Such a size distribution has been shown in many studies (e.g., Chubarenko et al., 2018; Hengstmann et al., 2018; Chubarenko et al., 2020; Esiukova et al., 2020; Urban-Malinga et al., 2020; Mazurkiewicz et al., 2022; but see Schröder et al., 2021).
Likewise, many studies also found that the most common shape categories were fragments, foils, foams, fibres, and pellets (e.g., Esiukova, 2017). Almost 90% of our particles were made from four polymer types (polyethylene, polypropylene, polyester, and polystyrene), reflecting the polymers most commonly used to make plastic products, particularly single-use plastics (Hanvey et al., 2017; UNEP, 2018). Again, similar results were found in previous similar studies (e.g., Dekiff et al., 2014; Graca et al., 2017; Haseler et al., 2019; Urban-Malinga et al., 2020; Schröder et al., 2021; Lenz et al., 2023). In this regard, our results reflect the current situation, which has also been documented in previous studies of sandy beaches on the Baltic and North Sea coasts (Urban-Malinga et al., 2020; Schröder et al., 2021; Hengstmann et al., 2018).
However, our results are less typical when we compare our pollution levels (Table 1) with those of other studies (Supplementary Tables S10, S11). Our unweighted mean densities of 3.21 MM m−2, 0.13 MM kg−1, and 0.21 MM L−1 are clearly the lowest estimates when compared to similar previous studies (Supplementary Table S11). There could be three reasons for these lower pollution levels.
(1) The methodologies of the studies varied widely as has been noted in many previous studies (see Section 3.5; Supplementary Table S10). One difference that probably explains many of the much higher reported pollution levels of the other studies is that they included microplastics < 1 mm. The lower detection limit plays a fundamental role because smaller size categories tend to be much more abundant. For example, earlier studies showed that microplastics ≤25 μm make up 88% of MP in sea ice, 82% in water, and 80% in sediment samples (e.g., Bergmann et al., 2017b; Peeken et al., 2018; Tekman et al., 2020). Focusing on studies with a detection limit of ≥1 mm, the resulting mean value is only 4.14 MM kg−1 (Section 3.5), which is closer to our density, but still about thirty times higher.
(2) Many previous studies did not take random samples, but often selected accumulation or deposition areas, such as drift and wrack lines (Hanvey et al., 2017). For example, the targeted sampling of wrack lines could be a reason for the very high microplastic levels found at Russian and Polish Baltic Sea beaches (Esiukova, 2017; Chubarenko et al., 2018; Chubarenko et al., 2020; Esiukova et al., 2020; Esiukova et al., 2021). As only few previous studies applied a random or a stratified random sampling approach, the reported densities of many studies could be positively biased (Walther and Moore, 2005; Hanvey et al., 2017). Some studies lack detailed information on sampling strategies, making evaluation and comparison even more difficult.
(3) Studies from Poland and Russia reported pollution densities significantly higher than those from the other countries (row 3 in Supplementary Table S11; Section 3.5). This difference could be real, as modelling of microplastic density in the surface waters of the Baltic Sea estimated much higher concentrations for the Polish and Russian coast than for the German coast (Figure 6 in Murawski et al., 2022). However, most of these samples also came from wrack lines (Esiukova, 2017; Chubarenko et al., 2018; Chubarenko et al., 2020; Esiukova et al., 2020; Esiukova et al., 2021). The high microplastic densities reported for Poland and Russia may thus reflect higher than usual concentrations or targeted sampling, or both.
Although our pollution densities are lower than in previous reports, we believe that they are a good reflection of reality because 1) our sampling scheme was random, 2) our sampling locations were spread over the entire North and Baltic Sea coasts with few gaps, and 3) we sampled a much larger amount of sand (2.2 metric tons) than any previous study. It should also be noted that our means are still higher than those of some of the studies listed in the global reviews (Supplementary Table S10).
4.2 Suggestions for future studies
In order to evaluate if our pollution levels are unrealistically low or whether the pollution levels in the Polish and Russian studies are biased, researchers from the region would need to at least agree on a 1) standardized stratified random sampling approach with sufficient sampling effort, e.g., by utilizing resampling curves (Bancin et al., 2019) and 2) harmonized laboratory procedures (Fisner et al., 2017; Hanvey et al., 2017). As areas of low and high microplastic density tend to run parallel to the waterline (e.g., drift and wrack lines, see references in Supplementary Table S11), thus reflecting depositional patterns, sampling transects should be perpendicular to the waterline, rather than parallel as in many previous studies. Alternatively, samples should be taken in a grid (Figure 1) or a combination of both (e.g., multiple parallel and equidistant transects all perpendicular to the waterline, similar to Bravo et al., 2009; Heo et al., 2013; Hengstmann et al., 2018; Bancin et al., 2019). Otherwise, the results will never be comparable (Hanvey et al., 2017), and we will continue to grope in the dark trying to discern reasons for differences in pollution levels.
Data reporting also varied between studies (Supplementary Table S10); e.g. very few studies reported all three pollution dimensions (m−2, kg−1, L−1), means were only calculated as unweighted means and never as weighted means, medians or ranges were not reported, results only sometimes included different size categories or presented size categories only as histograms (as in Figure 3), total numbers were not always reported (as in Tables 1, 2), and percentages for the size classes, shapes, colours, and polymer types of plastic particles (as in Table 1) were not always reported. In many cases, the raw data were not presented or available and thus did not satisfy the FAIR (Findable, Accessible, Interoperable, and Reusable) criteria (Jenkins et al., 2022). Therefore, we urge future researchers to provide their raw data and to report their results more comprehensively (see also Hanvey et al., 2017).
Another reason for lower pollution levels on German beaches could be that many beaches are subject to daily grooming during the high season. Although raking devices target primarily macroplastics, they could also incidentally remove smaller plastics. The removal of larger items could also reduce the potential for fragmentation into smaller particles compared to less groomed beaches. In addition, regular raking could promote the burial of plastics into deeper layers beyond the reach of surface sampling (as conducted in this and most other studies). The net benefit of mechanical grooming for beach biodiversity is controversial (Zielinski et al., 2019; Bergmann et al., 2023).
4.3 Heterogeneous distribution of plastic pollution
Another almost universal feature of plastic pollution studies is that pollution levels tend to be highly heterogeneous, with many areas of low pollution levels and a few hot spots (e.g., Walther et al., 2018; Bancin et al., 2019; Turrell, 2019; Yen et al., 2022). This is due to differences in source emissions, geographical features, ocean currents, the shape, buoyancy, and chemical composition of plastic particles, and the distribution and behaviour of marine organisms (including biofouling) (Rezania et al., 2018). Our results concur with this view. First, we found right-skewed distributions for pollution levels (Figures 4–6). Second, we found that the pollution levels of coastal locations were higher than those of island locations in the Baltic Sea, although the results were not statistically significant. We are not aware of any other studies that compared coastal sites with nearby islands, so this may be a novel finding. Third, we show that the North Sea island of Norderney had significantly higher pollution levels than all other North Sea locations (0.43 PP kg−1 versus 0.08 PP kg−1; Supplementary Table S9). Dekiff et al. (2014) recorded an even higher density of 1.77 MP kg−1 on Norderney but this could be explained by their lower detection limit (0.5 mm versus 1.0 mm). Another reason could be that Norderney has the highest number of visitors of all the East Frisian islands (Statista, 2024).
We also found that pollution levels increased from the waterline towards the top of the beach, although this was not statistically significant (Section 3.4). This could be due to landward winds blowing plastics towards the back of the beach. However, Bancin et al. (2019) found that the backshore (similar to sampling point 2 in our study) had higher pollution levels than areas further up the beach (similar to sampling points 3 and 4 in our study). To better understand the reasons for the heterogeneous two- or even three-dimensional distribution of plastic particles across beach areas (Turra et al., 2014; Chubarenko et al., 2018), a combination of intensive sampling, modelling, and experimentation would be required since many factors influence the distribution of plastics across and within individual beaches.
4.4 Bulk samples collected in situ are advantageous for citizen science projects
While the numerical results and the geographical coverage of our study are noteworthy, we would argue that the main contribution of this study is to demonstrate that large-scale and scientifically rigorous monitoring of meso- and microplastic pollution at the national level is possible in a relatively short time frame with the support of citizen scientists. We also demonstrated the many advantages and few disadvantages of citizen scientists sending bulk samples to the laboratory (Supplementary Table S1). For example, it is almost impossible even for professional scientists to accurately determine the mass and volume of sand samples in situ, as it is impossible to determine the dry weight of sand on the beach when it is wet. Therefore, our method may be suitable for international studies if it is possible to send out bulk samples, which would also be required for studies targeting plastics <1 mm that are too small to be picked out in the field.
In this context, it is important to mention two important details here. We were lucky to find a tinplate container that was 1) of the right size, 2) strong enough to withstand postal transport if properly packaged (e.g., with additional wrapping with newspapers and cardboard), 3) not too expensive and (4) would not leak sand if properly sealed. In previous projects, less rigid containers were often crushed and sand leaked out. Of all the equipment sent to the citizen scientists (Supplementary Text S2.2), the containers were by far the most important to get right. Another important one was the rigid sampling frame. There are many ways to determine a sampling area (e.g., drawing a circle with a stick and a string, making a square with hooks and string), but we provided solid metal sampling frames that were purpose-built to eliminate any errors in using a standard sampling area.
An important part of citizen science projects is building mutual trust between scientists and participants through personal relationships, regular peer-to-peer communication and fast response times (Supplementary Text S1.2; Dittmann et al., 2023; Thiel et al., 2023). Although it was risky and labor-intensive to assemble and send out all the equipment to the citizen scientists, once they received it, they felt compelled to use it in almost all cases. Many citizen scientists even returned the equipment, although they were allowed to keep it. We could have continued and expanded the scheme for a long time with the same materials, given the enthusiasm of most participants, and the many new requests for participation after the end of the project (see also Serra-Gonçalves et al., 2019). The approach could also support monitoring schemes for the European Marine Strategy Framework Directive (EU, 2008; EU, 2010; MSFD Technical Subgroup on Marine Litter, 2013), as the assessment of the abundance of marine debris (including meso- and microplastic) is a descriptor of the ecological status of water bodies, including coastal environments. In addition, media coverage of the project’s collection activities in various regional media raised public awareness of plastic pollution (Supplementary Table S2).
4.5 Environmental impacts and potential policy recommendations
To address the environmental impacts posed by microplastics, a comprehensive and multi-faceted policy approach is necessary (Stock et al., 2022; Syberg et al., 2024). Based on the findings outlined in the Discussion above, the following recommendations are proposed:
1. Implement standardized reporting guidelines, which requires all studies to report pollution levels in multiple dimensions (per square meter, per kilogram, per litre) and to include comprehensive data on particle sizes, shapes, colours, and polymer types (Fisner et al., 2017; Hanvey et al., 2017).
2. Enforce stricter regulations on waste management and encourage the circular economy, particularly in coastal and island areas where the highest microplastic contamination is prevalent (da Costa et al., 2020; Mihai et al., 2021).
3. Promote policies that reduce the production and use of single-use plastics, instead favouring, e.g., biodegradable alternatives (UNEP, 2018; da Costa et al., 2020; Walther et al., 2021; Stock et al., 2022; Walther et al., 2022; Bergmann et al., 2023; Baztan et al., 2024).
4. Develop national and international monitoring programs that leverage citizen science projects, as these have proven effective in large-scale and timely data collection (Hidalgo-Ruz and Thiel, 2015; Walther et al., 2018; Uhrin et al., 2022; Yen et al., 2022).
5. Fund research to understand the sources and distribution patterns of microplastics (e.g., Borrelle et al., 2020; Lau et al., 2020; Eibes and Gabel, 2022).
6. Increase public awareness campaigns to educate people about the sources and impacts of microplastics (Dittmann et al., 2023; Syberg et al., 2024). This can be achieved through media coverage, educational programs, and partnerships with local communities.
By implementing these policy recommendations, governments and organizations can better address the widespread and harmful effects of microplastics on the environment and human health (Vethaak and Legler, 2021; Gündoğdu et al., 2024).
5 Conclusion
Citizen science is rapidly expanding into more and more areas of scientific research, raising public awareness of the need for science and increasing the scale of observations. Our study is an example of how collaboration between professional and citizen scientists can produce insightful and novel data.
Citizen scientists are keen and able to quickly adopt sampling protocols, even relatively complicated ones with well-written and well-rehearsed instructions (e.g., Walther et al., 2018; Yen et al., 2022; Pasolini et al., 2023). We therefore foresee many productive scientist-citizen collaborations in the future.
While the results of our research are broadly typical of similar studies, our study is a major step forward because it is the first to provide data on the large-scale distribution of plastic pollution along the entire German coast using standardised methods. This would not have been possible without the support of citizen scientists. The data can be used as baseline for monitoring purposes. Repeated campaigns could enable the large-scale monitoring schemes needed to evaluate the effectiveness of new regulations.
Data availability statement
The original contributions presented in the study are included in the article/Supplementary Material, further inquiries can be directed to the corresponding author.
Author contributions
BW: Conceptualization, Data curation, Formal Analysis, Investigation, Methodology, Project administration, Visualization, Writing–original draft, Writing–review and editing. FP: Writing–original draft, Writing–review and editing, Data curation. ŠK: Writing–original draft, Writing–review and editing, Methodology. MB: Writing–original draft, Writing–review and editing, Conceptualization, Funding acquisition, Investigation, Methodology, Project administration, Resources, Supervision.
Funding
The author(s) declare that financial support was received for the research, authorship, and/or publication of this article. BW was funded by the Dr. Ernst Weiße-Stiftung, FP by an Erasmus studentship, and MB by the Helmholtz-Gemeinschaft Deutscher Forschungszentren.
Acknowledgments
First and foremost, we thank the approximately 300 citizen scientists and approximately 30 organizations who participated enthusiastically in our “Mikroplastikdetektive” project (see also Supplementary Text S1). Special thanks go to Valeria Bers, Thorsten Dahl, Rainer Himmighofen, Tim Hinzmann, Gabriele Michaelis, Kay Pommerenck, Bernd Quellmalz, and Jan Scholz who put in particularly great efforts to contribute to the success of this project. We thank Sebastian Primpke for instruction on the ATR-FTIR setup and installation of simple and gratefully acknowledge Tabea Hepfner, Sarah Lorenzana, Stefanie Meyer and Anja Pappert for assistance in the laboratory, J. Johannes Lemburg and Matthias Littmann for making the metal sampling frames. For comments and discussions, we also thank Valeria Bers, Holger Freund, Steffen Gruber, Lars Gutow, Mirco Haseler, Mathias Heckroth, Sven Hille, Mandy Hinzmann, Tim Hinzmann, Tim Kiessling, Katrin Knickmeier, Doris Knoblauch, Linda Mederake, Sebastian Primpke, Lisa Roscher, Rosanna Isabel Schöneich-Argent, Dorothea Seeger, Robert Sluka, Martin Thiel, Frank Timrott, Jennifer Timrott, Eric Walter, and Katharina Weinberg. We would like to thank Andreas Walter and Peter Konopatzky for their assistance in the preparation of Figure 2. We acknowledge support by the Open Access Publication Funds of Alfred-Wegener-Institut Helmholtz-Zentrum für Polar- und Meeresforschung.
Conflict of interest
The authors declare that the research was conducted in the absence of any commercial or financial relationships that could be construed as a potential conflict of interest.
Publisher’s note
All claims expressed in this article are solely those of the authors and do not necessarily represent those of their affiliated organizations, or those of the publisher, the editors and the reviewers. Any product that may be evaluated in this article, or claim that may be made by its manufacturer, is not guaranteed or endorsed by the publisher.
Supplementary material
The Supplementary Material for this article can be found online at: https://www.frontiersin.org/articles/10.3389/fenvs.2024.1458565/full#supplementary-material
References
Allen, D., Allen, S., Abbasi, S., Baker, A., Bergmann, M., Brahney, J., et al. (2022). Microplastics and nanoplastics in the marine-atmosphere environment. Nat. Rev. Earth Environ. 3, 393–405. doi:10.1038/s43017-022-00292-x
A Rocha International (2018). Guidelines for sampling microplastics on sandy beaches. London, UK: A Rocha International. Available at: https://www.arocha.org/wp-content/uploads/2018/01/Microplastic-sampling-protocol.pdf.
Arp, H. P. H., Kuhnel, D., Rummel, C., MacLeod, M., Potthoff, A., Reichelt, S., et al. (2021). Weathering plastics as a planetary boundary threat: exposure, fate, and hazards. Environ. Sci. Technol. 55, 7246–7255. doi:10.1021/acs.est.1c01512
Bancin, L. J., Walther, B. A., Lee, Y.-C., and Kunz, A. (2019). Two-dimensional distribution and abundance of micro- and mesoplastic pollution in the surface sediment of Xialiao Beach, New Taipei City, Taiwan. Mar. Pollut. Bull. 140, 75–85. doi:10.1016/j.marpolbul.2019.01.028
Baztan, J., Jorgensen, B., Almroth, B. C., Bergmann, M., Farrelly, T., Muncke, J., et al. (2024). Primary plastic polymers: urgently needed upstream reduction. Camb. Prism. Plast. 2, e7. doi:10.1017/plc.2024.8
Bergmann, M., Arp, H. P. H., Almroth, B. C., Cowger, W., Eriksen, M., Dey, T., et al. (2023). Moving from symptom management to upstream plastics prevention: the fallacy of plastic cleanup technology. One Earth 6, 1439–1442. doi:10.1016/j.oneear.2023.10.022
Bergmann, M., Collard, F., Fabres, J., Gabrielsen, G. W., Provencher, J. F., Rochman, C. M., et al. (2022). Plastic pollution in the arctic. Nat. Rev. Earth Environ. 3, 323–337. doi:10.1038/s43017-022-00279-8
Bergmann, M., Tekman, M. B., and Gutow, L. (2017a). Sea change for plastic pollution. Nature 544, 297. doi:10.1038/544297a
Bergmann, M., Tekman, M. B., Walter, A., and Gutow, L. (2018). “Tackling marine litter—LITTERBASE,” in Building bridges at the science-stakeholder interface: towards knowledge exchange in Earth System Science. Editor G. Krause (Springer), 85–92.
Bergmann, M., Wirzberger, V., Krumpen, T., Lorenz, C., Primpke, S., Tekman, M. B., et al. (2017b). High quantities of microplastic in arctic deep-sea sediments from the HAUSGARTEN observatory. Environ. Sci. Technol. 51, 11000–11010. doi:10.1021/acs.est.7b03331
Borrelle, S. B., Ringma, J., Law, K. L., Monnahan, C. C., Lebreton, L., McGivern, A., et al. (2020). Predicted growth in plastic waste exceeds efforts to mitigate plastic pollution. Science 369, 1515–1518. doi:10.1126/science.aba3656
Bravo, M., Gallardo, M. Á., Luna-Jorquera, G., Núñez, P., Vásquez, N., and Thiel, M. (2009). Anthropogenic debris on beaches in the SE Pacific (Chile): results from a national survey supported by volunteers. Mar. Pollut. Bull. 58, 1718–1726. doi:10.1016/j.marpolbul.2009.06.017
Carbery, M., MacFarlane, G. R., O’Connor, W., Afrose, S., Taylor, H., and Palanisami, T. (2020). Baseline analysis of metal (loid) s on microplastics collected from the Australian shoreline using citizen science. Mar. Pollut. Bull. 152, 110914. doi:10.1016/j.marpolbul.2020.110914
Chen, M. C., and Chen, T. H. (2020). Spatial and seasonal distribution of microplastics on sandy beaches along the coast of the Hengchun Peninsula, Taiwan. Mar. Pollut. Bull. 151, 110861. doi:10.1016/j.marpolbul.2019.110861
Chubarenko, I., Esiukova, E., Khatmullina, L., Lobchuk, O., Grave, A., Kileso, A., et al. (2020). From macro to micro, from patchy to uniform: analyzing plastic contamination along and across a sandy tide-less coast. Mar. Pollut. Bull. 156, 111198. doi:10.1016/j.marpolbul.2020.111198
Chubarenko, I. P., Esiukova, E. E., Bagaev, A. V., Bagaeva, M. A., and Grave, A. N. (2018). Three-dimensional distribution of anthropogenic microparticles in the body of sandy beaches. Sci. Total Environ. 628–629, 1340–1351. doi:10.1016/j.scitotenv.2018.02.167
Cigliano, J. A., Meyer, R., Ballard, H. L., Freitag, A., Phillips, T. B., and Wasser, A. (2015). Making marine and coastal citizen science matter. Ocean. Coast. Manage. 115, 77–87. doi:10.1016/j.ocecoaman.2015.06.012
da Costa, J. P., Mouneyrac, C., Costa, M., Duarte, A. C., and Rocha-Santos, T. (2020). The role of legislation, regulatory initiatives and guidelines on the control of plastic pollution. Front. Environ. Sci. 8, 104. doi:10.3389/fenvs.2020.00104
Dekiff, J. H., Remy, D., Klasmeier, J., and Fries, E. (2014). Occurrence and spatial distribution of microplastics in sediments from Norderney. Environ. Pollut. 186, 248–256. doi:10.1016/j.envpol.2013.11.019
Dittmann, S., Kiessling, T., Mederake, L., Hinzmann, M., Knoblauch, D., Böhm-Beck, M., et al. (2023). Sharing communication insights of the citizen science program Plastic Pirates—best practices from 7 years of engaging schoolchildren and teachers in plastic pollution research. Front. Environ. Sci. 11, 1233103. doi:10.3389/fenvs.2023.1233103
Doyen, P., Hermabessiere, L., Dehaut, A., Himber, C., Decodts, M., Degraeve, T., et al. (2019). Occurrence and identification of microplastics in beach sediments from the Hauts-de-France region. Environ. Sci. Pollut. Res. 26, 28010–28021. doi:10.1007/s11356-019-06027-8
Eibes, P. M., and Gabel, F. (2022). Floating microplastic debris in a rural river in Germany: distribution, types and potential sources and sinks. Sci. Total Environ. 816, 151641. doi:10.1016/j.scitotenv.2021.151641
Esiukova, E. (2017). Plastic pollution on the Baltic beaches of Kaliningrad region, Russia. Mar. Pollut. Bull. 114, 1072–1080. doi:10.1016/j.marpolbul.2016.10.001
Esiukova, E., Khatmullina, L., Lobchuk, O., Grave, A., Kileso, A., Haseler, M., et al. (2020). From macro to micro: dataset on plastic contamination along and across a sandy tide-less coast (the Curonian Spit, the Baltic Sea). Data Brief 30, 105635. doi:10.1016/j.dib.2020.105635
Esiukova, E., Lobchuk, O., Haseler, M., and Chubarenko, I. (2021). Microplastic contamination of sandy beaches of national parks, protected and recreational areas in southern parts of the Baltic Sea. Mar. Pollut. Bull. 173, 113002. doi:10.1016/j.marpolbul.2021.113002
EU (2008). Directive 2008/56/EC of the European Parliament and of the Council of 17 June 2008 establishing a framework for community action in the field of marine environmental policy (Marine Strategy Framework Directive). J. Eur. Union. Available at: https://eur-lex.europa.eu/legal-content/EN/TXT/PDF/?uri=CELEX:32008L0056&from=EN.
EU (2010). Commission Decision of 1 September 2010 on criteria and methodological standards on good environmental status of marine waters (notified under document C(2010) 5956). J. Eur. Union. Available at: https://eur-lex.europa.eu/legal-content/EN/TXT/PDF/?uri=CELEX:32010D0477(01).
Everaert, G., Van Cauwenberghe, L., De Rijcke, M., Koelmans, A. A., Mees, J., Vandegehuchte, M., et al. (2018). Risk assessment of microplastics in the ocean: modelling approach and first conclusions. Environ. Pollut. 242, 1930–1938. doi:10.1016/j.envpol.2018.07.069
Falk-Andersson, J., Berkhout, B. W., and Abate, T. G. (2019). Citizen science for better management: lessons learned from three Norwegian beach litter data sets. Mar. Pollut. Bull. 138, 364–375. doi:10.1016/j.marpolbul.2018.11.021
Fisner, M., Majer, A. P., Balthazar-Silva, D., Gorman, D., and Turra, A. (2017). Quantifying microplastic pollution on sandy beaches: the conundrum of large sample variability and spatial heterogeneity. Environ. Sci. Pollut. Res. 24, 13732–13740. doi:10.1007/s11356-017-8883-y
Gewert, B., Ogonowski, M., Barth, A., and MacLeod, M. (2017). Abundance and composition of near surface microplastics and plastic debris in the Stockholm Archipelago, Baltic Sea. Mar. Pollut. Bull. 120, 292–302. doi:10.1016/j.marpolbul.2017.04.062
Geyer, R. (2020). “A brief history of plastics,” in Mare slasticum – the plastic sea: combating plastic pollution through science and art. Editors M. Streit-Bianchi, M. Cimadevila, and W. Trettnak (Cham, Switzerland: Springer), 31–48.
Goli, V. S. N. S., Paleologos, E. K., Farid, A., Mohamed, A.-M. O., O’Kelly, B. C., El Gamal, M. M., et al. (2022). Extraction, characterisation and remediation of microplastics from organic solid matrices. Environ. Geotech. 40, 259–292. doi:10.1680/jenge.21.00072
Graca, B., Szewc, K., Zakrzewska, D., Dołęga, A., and Szczerbowska-Boruchowska, M. (2017). Sources and fate of microplastics in marine and beach sediments of the Southern Baltic Sea—a preliminary study. Environ. Sci. Pollut. Res. 24, 7650–7661. doi:10.1007/s11356-017-8419-5
Gündoğdu, S., Bour, A., Köşker, A. R., Walther, B. A., Napierska, D., Mihai, F.-C., et al. (2024). Review of microplastics and chemical risk posed by plastic packaging on the marine environment to inform the Global Plastics Treaty. Sci. Total Environ. 946, 174000. doi:10.1016/j.scitotenv.2024.174000
Halbach, M., Vogel, M., Tammen, J. K., Rüdel, H., Koschorreck, J., and Scholz-Böttcher, B. M. (2022). 30 years trends of microplastic pollution: mass-quantitative analysis of archived mussel samples from the North and Baltic Seas. Sci. Total Environ. 826, 154179. doi:10.1016/j.scitotenv.2022.154179
Hänninen, J., Weckström, M., Pawłowska, J., Szymańska, N., Uurasjärvi, E., Zajaczkowski, M., et al. (2021). Plastic debris composition and concentration in the arctic ocean, the North Sea and the Baltic Sea. Mar. Pollut. Bull. 165, 112150. doi:10.1016/j.marpolbul.2021.112150
Hanvey, J. S., Lewis, P. J., Lavers, J. L., Crosbie, N. D., Pozo, K., and Clarke, B. O. (2017). A review of analytical techniques for quantifying microplastics in sediments. Anal. Meth. 9, 1369–1383. doi:10.1039/c6ay02707e
Hartmann, N. B., Huffer, T., Thompson, R. C., Hassellov, M., Verschoor, A., Daugaard, A. E., et al. (2019). Are we speaking the same language? Recommendations for a definition and categorization framework for plastic debris. Environ. Sci. Technol. 53, 1039–1047. doi:10.1021/acs.est.8b05297
Haseler, M., Weder, C., Buschbeck, L., Wesnigk, S., and Schernewski, G. (2019). Cost-effective monitoring of large micro-and meso-litter in tidal and flood accumulation zones at south-western Baltic Sea beaches. Mar. Pollut. Bull. 149, 110544. doi:10.1016/j.marpolbul.2019.110544
Hengstmann, E., Tamminga, M., Bruch, C. V., and Fischer, E. K. (2018). Microplastic in beach sediments of the Isle of Rügen (Baltic Sea) - implementing a novel glass elutriation column. Mar. Pollut. Bull. 126, 263–274. doi:10.1016/j.marpolbul.2017.11.010
Heo, N. W., Hong, S. H., Han, G. M., Hong, S., Lee, J., Song, Y. K., et al. (2013). Distribution of small plastic debris in cross-section and high strandline on Heungnam Beach, South Korea. Ocean. Sci. J. 48, 225–233. doi:10.1007/s12601-013-0019-9
Hidalgo-Ruz, V., and Thiel, M. (2013). Distribution and abundance of small plastic debris on beaches in the SE Pacific (Chile): a study supported by a citizen science project. Mar. Environ. Res. 87-88, 12–18. doi:10.1016/j.marenvres.2013.02.015
Hidalgo-Ruz, V., and Thiel, M. (2015). “The contribution of citizen scientists to the monitoring of marine litter,” in Marine anthropogenic litter. Editors M. Bergmann, L. Gutow, and M. Klages (Springer Open), 429–447. doi:10.1007/978-3-319-16510-3_16
Honorato-Zimmer, D., Kruse, K., Knickmeier, K., Weinmann, A., Hinojosa, I. A., and Thiel, M. (2019). Inter-hemispherical shoreline surveys of anthropogenic marine debris - a binational citizen science project with schoolchildren. Mar. Pollut. Bull. 138, 464–473. doi:10.1016/j.marpolbul.2018.11.048
Jenkins, T., Persaud, B., Cowger, W., Szigeti, K., Roche, D. G., Clary, E., et al. (2022). Current state of microplastic pollution research data: trends in availability and sources of open data. Front. Environ. Sci. 10, 912107. doi:10.3389/fenvs.2022.912107
Jones, J. S., Guézou, A., Medor, S., Nickson, C., Savage, G., Alarcón-Ruales, D., et al. (2022). Microplastic distribution and composition on two Galápagos island beaches, Ecuador: verifying the use of citizen science derived data in long-term monitoring. Environ. Pollut. 311, 120011. doi:10.1016/j.envpol.2022.120011
Kawabe, L., Ghilardi-Lopes, N., Turra, A., and Wyles, K. (2022). Citizen science in marine litter research: a review. Mar. Pollut. Bull. 182, 114011. doi:10.1016/j.marpolbul.2022.114011
Kiessling, T., Knickmeier, K., Kruse, K., Gatta-Rosemary, M., Nauendorf, A., Brennecke, D., et al. (2021). Schoolchildren discover hotspots of floating plastic litter in rivers using a large-scale collaborative approach. Sci. Total Environ. 789, 147849. doi:10.1016/j.scitotenv.2021.147849
Koutnik, V. S., Leonard, J., Alkidim, S., DePrima, F. J., Ravi, S., Hoek, E. M., et al. (2021). Distribution of microplastics in soil and freshwater environments: global analysis and framework for transport modeling. Environ. Pollut. 274, 116552. doi:10.1016/j.envpol.2021.116552
Kukkola, A., Senior, G., Maes, T., Silburn, B., Bakir, A., Kröger, S., et al. (2022). A large-scale study of microplastic abundance in sediment cores from the UK continental shelf and slope. Mar. Pollut. Bull. 178, 113554. doi:10.1016/j.marpolbul.2022.113554
Kullenberg, C., and Kasperowski, D. (2016). What is citizen science? A scientometric meta-analysis. PLoS ONE 11, e0147152. doi:10.1371/journal.pone.0147152
Kunz, A., Walther, B. A., Löwemark, L., and Lee, Y.-C. (2016). Distribution and quantity of microplastic on sandy beaches along the northern coast of Taiwan. Mar. Pollut. Bull. 111, 126–135. doi:10.1016/j.marpolbul.2016.07.022
Lau, W. W., Shiran, Y., Bailey, R. M., Cook, E., Stuchtey, M. R., Koskella, J., et al. (2020). Evaluating scenarios toward zero plastic pollution. Science 369, 1455–1461. doi:10.1126/science.aba9475
Lee, H., Kunz, A., Shim, W. J., and Walther, B. A. (2019). Microplastic contamination of table salts from Taiwan, including a global review. Sci. Rep. 9, 10145. doi:10.1038/s41598-019-46417-z
Lenz, M., Brennecke, D., Haeckel, M., Knickmeier, K., and Kossel, E. (2023). Spatio-temporal variability in the abundance and composition of beach litter and microplastics along the Baltic Sea coast of Schleswig-Holstein, Germany. Mar. Pollut. Bull. 190, 114830. doi:10.1016/j.marpolbul.2023.114830
Lenz, R., Enders, K., Beer, S., Sørensen, T. K., and Stedmon, C. A. (2016). Analysis of microplastic in the stomachs of herring and cod from the North Sea and Baltic Sea. Kongens Lyngby, Denmark: DTU Aqua National Institute of Aquatic Resources. Available at: https://www.researchgate.net/profile/Thomas_Sorensen6/publication/302423216_Analysis_of_microplastic_in_the_stomachs_of_herring_and_cod_from_the_North_Sea_and_Baltic_Sea/links/5730714208ae744151911fcc.pdf.
Lorenz, C., Roscher, L., Meyer, M. S., Hildebrandt, L., Prume, J., Loder, M. G. J., et al. (2019). Spatial distribution of microplastics in sediments and surface waters of the southern North Sea. Environ. Pollut. 252, 1719–1729. doi:10.1016/j.envpol.2019.06.093
MacLeod, M., Arp, H. P. H., Tekman, M. B., and Jahnke, A. (2021). The global threat from plastic pollution. Science 373, 61–65. doi:10.1126/science.abg5433
Mazurkiewicz, M., Martinez, P. S., Konwent, W., Deja, K., Kotwicki, L., and Węsławski, J. M. (2022). Plastic contamination of sandy beaches along the southern Baltic–a one season field survey results. Oceanologia 64, 769–780. doi:10.1016/j.oceano.2022.07.004
Mihai, F.-C., Gündoğdu, S., Markley, L. A., Olivelli, A., Khan, F. R., Gwinnett, C., et al. (2021). Plastic pollution, waste management issues, and circular economy opportunities in rural communities. Sustainability 14, 20. doi:10.3390/su14010020
MSFD Technical Subgroup on Marine Litter (2013). Guidance on monitoring of marine litter in European seas. Ispra, Italy: Joint Research Centre Institute for Environment and Sustainability. Available at: http://publications.jrc.ec.europa.eu/repository/bitstream/JRC83985/lb-na-26113-en-n.pdf.
Munno, K., Helm, P. A., Jackson, D. A., Rochman, C., and Sims, A. (2018). Impacts of temperature and selected chemical digestion methods on microplastic particles. Environ. Toxicol. Chem. 37, 91–98. doi:10.1002/etc.3935
Murawski, J., She, J., and Frishfelds, V. (2022). Modeling drift and fate of microplastics in the Baltic Sea. Front. Mar. Sci. 9, 886295. doi:10.3389/fmars.2022.886295
Näkki, P., Setälä, O., and Lehtiniemi, M. (2019). Seafloor sediments as microplastic sinks in the northern Baltic Sea–negligible upward transport of buried microplastics by bioturbation. Environ. Pollut. 249, 74–81. doi:10.1016/j.envpol.2019.02.099
Narloch, I., Gackowska, A., and Wejnerowska, G. (2022). Microplastic in the Baltic Sea: a review of distribution processes, sources, analysis methods and regulatory policies. Environ. Pollut. 315, 120453. doi:10.1016/j.envpol.2022.120453
Nel, H. A., Smith, G. H. S., Harmer, R., Sykes, R., Schneidewind, U., Lynch, I., et al. (2020). Citizen science reveals microplastic hotspots within tidal estuaries and the remote Scilly Islands, United Kingdom. Mar. Pollut. Bull. 161, 111776. doi:10.1016/j.marpolbul.2020.111776
Nelms, S. E., Easman, E., Anderson, N., Berg, M., Coates, S., Crosby, A., et al. (2022). The role of citizen science in addressing plastic pollution: challenges and opportunities. Environ. Sci. Policy 128, 14–23. doi:10.1016/j.envsci.2021.11.002
Pagter, E., Frias, J., Kavanagh, F., and Nash, R. (2020). Differences in microplastic abundances within demersal communities highlight the importance of an ecosystem-based approach to microplastic monitoring. Mar. Pollut. Bull. 160, 111644. doi:10.1016/j.marpolbul.2020.111644
Paradinas, L. M., James, N. A., Quinn, B., Dale, A., and Narayanaswamy, B. E. (2021). A new collection tool-kit to sample microplastics from the marine environment (sediment, seawater, and biota) using citizen science. Front. Mar. Sci. 8, 657709. doi:10.3389/fmars.2021.657709
Pasolini, F., Walther, B. A., and Bergmann, M. (2023). Citizen scientists reveal small but concentrated amounts of fragmented microplastic on Arctic beaches. Front. Environ. Sci. 11, 1210019. doi:10.3389/fenvs.2023.1210019
Peeken, I., Primpke, S., Beyer, B., Gütermann, J., Katlein, C., Krumpen, T., et al. (2018). Arctic sea ice is an important temporal sink and means of transport for microplastic. Nat. Commun. 9, 1505. doi:10.1038/s41467-018-03825-5
Persson, L., Carney Almroth, B. M., Collins, C. D., Cornell, S., de Wit, C. A., Diamond, M. L., et al. (2022). Outside the safe operating space of the planetary boundary for novel entities. Environ. Sci. Technol. 56, 1510–1521. doi:10.1021/acs.est.1c04158
Pfeiffer, F., and Fischer, E. K. (2020). Various digestion protocols within microplastic sample processing—evaluating the resistance of different synthetic polymers and the efficiency of biogenic organic matter destruction. Front. Environ. Sci. 8, 572424. doi:10.3389/fenvs.2020.572424
Philipp, C., Unger, B., Fischer, E. K., Schnitzler, J. G., and Siebert, U. (2020). Handle with care—microplastic particles in intestine samples of seals from German waters. Sustainability 12, 10424. doi:10.3390/su122410424
Popa, C. L., Dontu, S. I., Savastru, D., and Carstea, E. M. (2022). Role of citizen scientists in environmental plastic litter research—a systematic review. Sustainability 14, 13265. doi:10.3390/su142013265
Primpke, S., Cross, R. K., Mintenig, S. M., Simon, M., Vianello, A., Gerdts, G., et al. (2020). Toward the systematic identification of microplastics in the environment: evaluation of a new independent software tool (siMPle) for spectroscopic analysis. Appl. Spectrosc. 74, 1127–1138. doi:10.1177/0003702820917760
Primpke, S., Wirth, M., Lorenz, C., and Gerdts, G. (2018). Reference database design for the automated analysis of microplastic samples based on Fourier transform infrared (FTIR) spectroscopy. Anal. Bioanal. Chem. 410, 5131–5141. doi:10.1007/s00216-018-1156-x
Raman, N. V., Dubey, A., Millar, E., Nava, V., Leoni, B., and Gallego, I. (2023). Monitoring contaminants of emerging concern in aquatic systems through the lens of citizen science. Sci. Total Environ. 874, 162527. doi:10.1016/j.scitotenv.2023.162527
Renner, G., Nellessen, A., Schwiers, A., Wenzel, M., Schmidt, T. C., and Schram, J. (2019). Data preprocessing and evaluation used in the microplastics identification process: a critical review and practical guide. Trends Anal. Chem. 111, 229–238. doi:10.1016/j.trac.2018.12.004
Rezania, S., Park, J., Din, M. F. M., Taib, S. M., Talaiekhozani, A., Yadav, K. K., et al. (2018). Microplastics pollution in different aquatic environments and biota: a review of recent studies. Mar. Pollut. Bull. 133, 191–208. doi:10.1016/j.marpolbul.2018.05.022
Roscher, L., Fehres, A., Reisel, L., Halbach, M., Scholz-Böttcher, B., Gerriets, M., et al. (2021). Microplastic pollution in the weser estuary and the German North Sea. Environ. Pollut. 288, 117681. doi:10.1016/j.envpol.2021.117681
Rummel, C. D., Loder, M. G. J., Fricke, N. F., Lang, T., Griebeler, E. M., Janke, M., et al. (2016). Plastic ingestion by pelagic and demersal fish from the North Sea and Baltic Sea. Mar. Pollut. Bull. 102, 134–141. doi:10.1016/j.marpolbul.2015.11.043
Schöneich-Argent, R. I., Hillmann, F., Cordes, D., Wansing, R. A. D., Merder, J., Freund, J. A., et al. (2019). Wind, waves, tides, and human error? – Influences on litter abundance and composition on German North Sea coastlines: an exploratory analysis. Mar. Pollut. Bull. 146, 155–172. doi:10.1016/j.marpolbul.2019.05.062
Schröder, K., Kossel, E., and Lenz, M. (2021). Microplastic abundance in beach sediments of the kiel fjord, western Baltic Sea. Environ. Sci. Pollut. Res. 28, 26515–26528. doi:10.1007/s11356-020-12220-x
Schwarz, A., Lensen, S., Langeveld, E., Parker, L., and Urbanus, J. H. (2023). Plastics in the global environment assessed through material flow analysis, degradation and environmental transportation. Sci. Total Environ. 875, 162644. doi:10.1016/j.scitotenv.2023.162644
Serra-Gonçalves, C., Lavers, J. L., and Bond, A. L. (2019). Global review of beach debris monitoring and future recommendations. Environ. Sci. Technol. 21, 12158–12167. doi:10.1021/acs.est.9b01424
Setälä, O., Fleming-Lehtinen, V., and Lehtiniemi, M. (2014). Ingestion and transfer of microplastics in the planktonic food web. Environ. Pollut. 185, 77–83. doi:10.1016/j.envpol.2013.10.013
Severin, M. I., Hooyberg, A., Everaert, G., and Catarino, A. (2022). “Using citizen science to understand plastic pollution: Implications for science and participants,” in Living in the plastic age. perspectives from humanities, social sciences and environmental sciences. Editor J. Kramm (Frankfurt/M., Germany: Völker Campus), 133–168.
She, J., Buhhalko, N., Lind, K., Mishra, A., Kikas, V., Costa, E., et al. (2022). Uncertainty and consistency assessment in multiple microplastic observation datasets in the Baltic Sea. Front. Mar. Sci. 9, 886357. doi:10.3389/fmars.2022.886357
Shirk, J. L., Ballard, H. L., Wilderman, C. C., Phillips, T., Wiggins, A., Jordan, R., et al. (2012). Public participation in scientific research: a framework for deliberate design. Ecol. Soc. 17, art29. doi:10.5751/es-04705-170229
Statista (2024). Anzahl der Übernachtungen auf den Ostfriesischen Inseln in den Jahren 2021 und 2022. Available at: https://de.statista.com/statistik/daten/studie/885970/umfrage/uebernachtungen-auf-den-ostfriesischen-inseln/.
Stock, F., Reifferscheid, G., Brennholt, N., and Kostianaia, E. (2022). Plastics in the aquatic environment - Part II: stakeholders’ role against pollution. Cham, Switzerland: Springer. doi:10.1007/978-3-030-84114-0
Syberg, K., Almroth, B. C., Fernandez, M. O., Baztan, J., Bergmann, M., Thompson, R. C., et al. (2024). Informing the plastic treaty negotiations on science-experiences from the scientists’ coalition for an effective plastic treaty. Microplast. Nanoplast. 4, 14. doi:10.1186/s43591-024-00091-9
Tekman, M. B., Walther, B. A., Peter, C., Gutow, L., and Bergmann, M. (2022). Impacts of plastic pollution in the oceans on marine species, biodiversity and ecosystems. Berlin, Germany: WWF Germany. Available at: https://www.wwf.de/fileadmin/fm-wwf/Publikationen-PDF/Plastik/WWF-Impacts_of_plastic_pollution_in_the_ocean_on_marine_species__biodiversity_and_ecosystems.pdf.
Tekman, M. B., Wekerle, C., Lorenz, C., Primpke, S., Hasemann, C., Gerdts, G., et al. (2020). Tying up loose ends of microplastic pollution in the Arctic: distribution from the sea surface through the water column to deep-sea sediments at the HAUSGARTEN observatory. Environ. Sci. Technol. 54, 4079–4090. doi:10.1021/acs.est.9b06981
Thiel, M., Álvarez, J. B., Diaz, M., De Veer, D., Dittmann, S., Guevara-Torrejón, V., et al. (2023). Communication strategies in an international school citizen science program investigating marine litter. Front. Environ. Sci. 11, 1270413. doi:10.3389/fenvs.2023.1270413
Thiel, M., Penna-Díaz, M. A., Luna-Jorquera, G., Sala, S., Sellanes, J., and Stotz, W. (2014). Citizen scientists and marine research: volunteer participants, their contributions and projection for the future. Oceanogr. Mar. Biol. Ann. Rev. 52, 257–314. doi:10.1201/b17143-6
Turra, A., Manzano, A. B., Dias, R. J. S., Mahiques, M. M., Barbosa, L., Balthazar-Silva, D., et al. (2014). Three-dimensional distribution of plastic pellets in sandy beaches: shifting paradigms. Sci. Rep. 4, 4435. doi:10.1038/srep04435
Turrell, W. (2019). Spatial distribution of foreshore litter on the northwest European continental shelf. Mar. Pollut. Bull. 142, 583–594. doi:10.1016/j.marpolbul.2019.04.009
Uhrin, A. V., Hong, S., Burgess, H. K., Lim, S., and Dettloff, K. (2022). Towards a North Pacific long-term monitoring program for ocean plastic pollution: a systematic review and recommendations for shorelines. Environ. Pollut. 310, 119862. doi:10.1016/j.envpol.2022.119862
UNEP (2018). Single-use plastics: a roadmap to sustainability. Nairobi, Kenya: United Nations Environment Programme. Available at: https://www.unep.org/resources/report/single-use-plastics-roadmap-sustainability.
Unger, B., Herr, H., Benke, H., Böhmert, M., Burkhardt-Holm, P., Dähne, M., et al. (2017). Marine debris in harbour porpoises and seals from German waters. Mar. Environ. Res. 130, 77–84. doi:10.1016/j.marenvres.2017.07.009
Unger, B., Rebolledo, E. L. B., Deaville, R., Gröne, A., Ijsseldijk, L. L., Leopold, M. F., et al. (2016). Large amounts of marine debris found in sperm whales stranded along the North Sea coast in early 2016. Mar. Pollut. Bull. 112, 134–141. doi:10.1016/j.marpolbul.2016.08.027
Urban-Malinga, B., Zalewski, M., Jakubowska, A., Wodzinowski, T., Malinga, M., Pałys, B., et al. (2020). Microplastics on sandy beaches of the southern Baltic Sea. Mar. Pollut. Bull. 155, 111170. doi:10.1016/j.marpolbul.2020.111170
van Franeker, J. A., Blaize, C., Danielsen, J., Fairclough, K., Gollan, J., Guse, N., et al. (2011). Monitoring plastic ingestion by the northern fulmar Fulmarus glacialis in the North Sea. Environ. Pollut. 159, 2609–2615. doi:10.1016/j.envpol.2011.06.008
van Franeker, J. A., Bravo Rebolledo, E. L., Hesse, E., Ijsseldijk, L. L., Kühn, S., Leopold, M., et al. (2018). Plastic ingestion by harbour porpoises Phocoena phocoena in The Netherlands: establishing a standardised method. Ambio 47, 387–397. doi:10.1007/s13280-017-1002-y
Vethaak, A. D., and Legler, J. (2021). Microplastics and human health. Science 371, 672–674. doi:10.1126/science.abe5041
Walther, B. A., and Bergmann, M. (2022). Plastic pollution of four understudied marine ecosystems: a review of mangroves, seagrass meadows, the Arctic Ocean and the deep seafloor. Emerg. Top. Life Sci. 6, 371–387. doi:10.1042/ETLS20220017
Walther, B. A., Kunz, A., and Hu, C.-S. (2018). Type and quantity of coastal debris pollution in Taiwan: a 12-year nationwide assessment using citizen science data. Mar. Pollut. Bull. 135, 862–872. doi:10.1016/j.marpolbul.2018.08.025
Walther, B. A., Kusui, T., Yen, N., Hu, C.-S., and Lee, H. (2022). “Plastic pollution in East Asia: macroplastics and microplastics in the aquatic environment and mitigation efforts by various actors,” in Plastics in the aquatic environment - Part I: current status and challenges. Editors F. Stock, G. Reifferscheid, N. Brennholt, and E. Kostianaia (Cham, Switzerland: Springer), 353–403. doi:10.1007/698_2020_508
Walther, B. A., and Moore, J. L. (2005). The concepts of bias, precision and accuracy, and their use in testing the performance of species richness estimators, with a literature review of estimator performance. Ecography 28, 815–829. doi:10.1111/j.2005.0906-7590.04112.x
Walther, B. A., Yen, N., and Hu, C.-S. (2021). Strategies, actions, and policies by Taiwan’s ENGOs, media, and government to reduce plastic use and marine plastic pollution. Mar. Policy 126, 104391. doi:10.1016/j.marpol.2021.104391
Waters, C. N., Zalasiewicz, J., Summerhayes, C., Barnosky, A. D., Poirier, C., Gałuszka, A., et al. (2016). The Anthropocene is functionally and stratigraphically distinct from the Holocene. Science 351, aad2622. doi:10.1126/science.aad2622
Yen, N., Hu, C.-S., Chiu, C.-C., and Walther, B. A. (2022). Quantity and type of coastal debris pollution in Taiwan: a rapid assessment with trained citizen scientists using a visual estimation method. Sci. Total Environ. 822, 153584. doi:10.1016/j.scitotenv.2022.153584
Zalasiewicz, J., Waters, C. N., do Sul, J. A. I., Corcoran, P. L., Barnosky, A. D., Cearreta, A., et al. (2016). The geological cycle of plastics and their use as a stratigraphic indicator of the Anthropocene. Anthropocene 13, 4–17. doi:10.1016/j.ancene.2016.01.002
Zettler, E., Takada, H., Monteleone, B., Mallos, N., Eriksen, M., and Amaral-Zettler, L. (2017). Incorporating citizen science to study plastics in the environment. Anal. Meth. 9, 1392–1403. doi:10.1039/C6AY02716D
Keywords: sand samples, plastic pollution, citizen science, Germany, microplastics, Baltic Sea, North Sea
Citation: Walther BA, Pasolini F, Korez Lupše Š and Bergmann M (2024) Microplastic detectives: a citizen-science project reveals large variation in meso- and microplastic pollution along German coastlines. Front. Environ. Sci. 12:1458565. doi: 10.3389/fenvs.2024.1458565
Received: 02 July 2024; Accepted: 13 August 2024;
Published: 25 September 2024.
Edited by:
Ahmet Erkan Kideys, Middle East Technical University, TürkiyeReviewed by:
Giuseppe Suaria, National Research Council, ItalyMeng Chuan Ong, University of Malaysia Terengganu, Malaysia
Copyright © 2024 Walther, Pasolini, Korez Lupše and Bergmann. This is an open-access article distributed under the terms of the Creative Commons Attribution License (CC BY). The use, distribution or reproduction in other forums is permitted, provided the original author(s) and the copyright owner(s) are credited and that the original publication in this journal is cited, in accordance with accepted academic practice. No use, distribution or reproduction is permitted which does not comply with these terms.
*Correspondence: Bruno Andreas Walther, YmF3YWx0aGVyMjAwOUBnbWFpbC5jb20=
†ORCID: Špela Korez Lupše, orcid.org/0000-0003-0900-1950
‡Present address: Bruno Andreas Walther, Institut für Botanik, Heinrich-Heine-Universität Düsseldorf, Düsseldorf, Germany