- Center for Environment and Development, College of Development Studies, Addis Ababa University, Addis Ababa, Ethiopia
The study examines the dynamics of urban expansion and changes in land use in Addis Ababa from 1993 to 2023 using satellite data and GIS analysis, as well as the benefit transfer approach for valuing ecosystem services. In addition, an expert survey was conducted using the analytical hierarchy process (AHP) method to determine the factors driving urban expansion. Results reveal oscillations in urban expansion rates and intensities over the three-decade period. While the 2003–2013 decade witnessed rapid urban growth, subsequent years showed a slowdown. The overall period (1993–2023) has an intensity index greater than 1, indicating that urban areas expanded faster than the city’s overall growth during the entire time frame. Land cover analysis revealed a significant decrease in green areas and croplands and a remarkable increase in built-up areas. In aggregate, the natural land cover was reduced by 128.6% whereas built-up increased by 224.7%. This shift signifies a transition from natural and agricultural land uses to urbanization and development. Moreover, the study evaluates changes in ecosystem service values (ESVs), indicating a consistent decline over time, particularly in forestlands and urban green areas. The significant alteration in land use that built up caused to ecosystems has resulted in an annual loss of 90.7 million USD from 1993 to 2023 in terms of ecosystem service value. The most significant impacts were observed in food production, climate regulation, and habitat ecosystem services. The encroachment of built-up areas on different land use categories leads to substantial losses in ecosystem service values. Socioeconomic factors, notably population growth and migration, emerge as primary drivers of urban expansion, emphasizing the interconnectedness of demographic changes and land use patterns. Overall, the findings underscore the complex interplay between urban expansion, land use dynamics, and ecosystem services in Addis Ababa, highlighting the importance of informed urban planning and policy interventions to mitigate adverse environmental impacts.
1 Introduction
Urban areas represent human civilization in its most condensed form because of their dense population and active social and economic activities (Liu et al., 2018). Approximately 56.2% of people live in cities (UNDESA, 2018). The fastest rates of urbanization and growth are seen in developing nations, especially in Sub-Saharan Africa, where in 2030 it is predicted that two-thirds of the world’s population will live in cities (UN, 2018).
Urban expansion is a type of urbanization (Liu et al., 2016) that can take several different forms, such as increased building densities in areas that have already been developed, filling in the remaining open spaces in developed areas, or developing new areas that were previously used for non-urban areas (Indrawati et al., 2020). Urban expansion is the largest alteration to the natural landscape (Indrawati et al., 2020; Pickett et al., 2016). Natural and semi-natural systems undergo an irreversible process that turns them become impermeable surfaces, affecting the region’s and even the global ecology and ecosystem (Liu et al., 2016; Zheng and Qingyun, 2021).
Urban expansion is a major threat to human existence and the standard of living, even though it has significantly accelerated urbanization and economic development (Bai et al., 2017; Zheng and Qingyun, 2021). The phenomenon of urban expansion yields a paradoxical result: although it raises living standards for the populace, it also gives rise to ecological and environmental problems (Tang et al., 2005; Wang et al., 2020; Wu et al., 2019). These problems include modifications to the urban microclimate (Kasim et al., 2018; Liu et al., 2019), the destruction and fragmentation of natural habitats (Wang et al., 2020), the production of anthropogenic pollutants (Bai et al., 2017; Chen L. et al., 2019), and the irreversible alteration of land use land cover (Kumar et al., 2019). Rapid urban expansion is a major factor in changing landscapes and can lead to more serious environmental issues, such as land use conversion. The ramifications transcend geographical boundaries and affect all cities and metropolitan areas worldwide (Indrawati et al., 2020).
Timely detection of spatiotemporal changes in the local eco-environment is made possible by the efficient collection of spatial and temporal data on the land surface through the use of remote sensing (Alawamy et al., 2020; Puplampu and Boafo, 2021; Trinder and Liu, 2020). Technological developments in remote sensing are essential to the surveillance of land use land cover change (LULCC). It is necessary to use satellite imaging and remote sensing methods to comprehend and measure changes in land cover because they offer important insights into how ecosystems are dynamic and how human activity is causing these changes (Nguyen et al., 2020). A thorough evaluation of the advantages provided by ecosystems is also made possible by the financial quantification of ecosystem service values. This study utilizes the benefit transfer strategy developed by Costanza et al. (2017) to assess how land use transformations affect ecosystem services.
Ecosystem services (ESs) refer to the essential natural conditions and utilities that enable ecosystems and ecological processes to furnish life-sustaining products and benefits (Dai et al., 2021). An ecosystem constitutes a dynamic interplay of biotic and abiotic environmental elements collaborating to deliver ESs. Alterations in ecosystem functions, configurations, and dynamics serve as the most tangible indicators of the influence of human activities on the natural environment, directly or indirectly affecting ecosystem functions, configurations, and dynamics (Mao et al., 2019). Ecosystems can promote human wellbeing. Advantages such as regulating, supplying, and cultural services can impact people directly, or indirectly through supporting services (Millennium Ecosystem Assessment, 2005). Human activity has altered ecosystems in recent decades, yet they offer and sustain an environment favorable to human survival (Chen W. et al., 2019; Wu et al., 2019). Anthropogenic activities worldwide have put the delivery of these services in jeopardy. Land use change is the primary human activity affecting ecosystem services (Fan et al., 2018; Lin et al., 2021) due to urbanization (Moisa and Gemeda, 2021). Furthermore, modifications in land use diminish biodiversity and the ability of an ecosystem to offer services (Narducci et al., 2019; Shrestha and Acharya, 2021).
Ecosystem service values serve as vital metrics for understanding the benefits provided by natural ecosystems to human wellbeing and society. These values are typically assessed using various valuation methods, including market-based, revealed preference, and stated preference approaches. Market-based valuation relies on observable market transactions or prices, such as the trade of agricultural products or the costs of water purification services, to estimate the value of ecosystem services. Revealed preference methods analyze consumer behavior, such as expenditures on recreational activities or tourism in natural areas, to infer the value of ecosystem services. Conversely, stated preference methods involve surveys or hypothetical scenarios to determine people’s willingness to pay for ecosystem services (Costanza et al., 2014; 2017).
Researchers have highlighted the importance of valuing ecosystem services across various categories, including provisioning, regulating, supporting, and cultural services (Gashaw et al., 2018; Peng et al., 2020; Trinder and Liu, 2020). Provisioning services involve the production of essential resources such as food, water, and timber, which are crucial for human survival and economic activities (Song and Deng, 2017; Tolessa et al., 2021). Regulating services, which include climate regulation, air and water quality regulation, and natural hazard mitigation, contribute significantly to environmental stability and human health (Kusi et al., 2023). Supporting services, such as soil formation, nutrient cycling, and pollination, are essential for maintaining ecosystem productivity and resilience (Tolessa et al., 2017). Cultural services, encompassing recreational, aesthetic, spiritual, and educational benefits derived from nature, are crucial in enhancing human wellbeing and cultural identity.
Recent studies have underscored the importance of quantifying ecosystem service values to inform decision-making processes related to land use planning, environmental management, and conservation efforts. By assigning monetary values to ecosystem services, policymakers, businesses, and communities can better understand the trade-offs associated with various land management strategies and prioritize actions that enhance societal welfare and environmental sustainability (Berihun et al., 2021; Msofe et al., 2020; Muleta and Biru, 2019; Trinder and Liu, 2020). Furthermore, ecosystem service valuation can raise awareness about natural ecosystems’ crucial role in supporting human societies and incentivize investments in conservation and restoration initiatives. The economic value of ecosystem services at the local and national levels enables the proper assessment of trade-offs that arise between the provision of ecosystem services and changes in land use. Consequently, when the value of ecosystem services is recognized on both a local and national level, trade-offs between them are minimized (Aryal et al., 2021). Understanding the value of all ecosystem services resulting from changes in land use is crucial because these changes have been the primary cause of the degradation of all (Chen et al., 2019; Costanza et al., 2014).
While monetizing ecosystem services can clarify their value for policymakers and help secure conservation funding, recent critiques highlight key limitations. One concern is that monetary valuation often simplifies the complex nature of ecosystems by prioritizing easily measurable services, which can overshadow intangible benefits like cultural value and biodiversity. This approach risks commodifying nature, neglecting intrinsic and cultural values crucial to communities (Schröter et al., 2014; Trinder and Liu, 2020). Additionally, Gómez-Baggethun & Ruiz-Pérez (2011) suggest that economic valuation may favor productive ecosystems, leading to biased conservation efforts that ignore habitats vital for biodiversity.
The suburbs of Addis Ababa have experienced a notable degree of landscape deterioration, mostly as a result of population pressure (rural-urban and urban-urban migration), rapid urbanization, and infrastructure development (Deribew and Dalacho, 2019). Large-scale, unwelcome development projects on the fringes of cities harm human health, the environment, and natural resources in addition to creating certain socioeconomic difficulties (Mohamed and Worku, 2019). Changes in land use and land cover are typically primarily driven by social, economic, and natural processes (Li et al., 2017). Furthermore, urban planning and policies are the main driving factors for urban expansion (Terfa et al., 2019).
While much research have been done on how land use and cover have changed over time in Ethiopia (Fitawok et al., 2020; Kiros Weldegebriel and Yeshitela, 2021; Zewdie et al., 2018), not much has been done to track the spatiotemporal changes brought on by urban growth in metropolitan areas and the factors that are driving this development. Ecosystems have been impacted by Ethiopia’s notable changes in land usage and cover. The majority of current studies on how land use change affects Ethiopian ecosystems have been conducted in rural areas; urban settings have been the subject of just a small number of studies (Degefu et al., 2021; Woldesemayat and Genovese, 2021). Nevertheless, this study examined both the effects of Addis Ababa’s urban expansion on ecological services and its spatiotemporal oscillations. It also examines the primary drivers and factors for the urban growth of the metropolis.
Understanding that urban expansion has changed a city’s land use and land cover provides municipal administrators with direction on how to conserve and manage these changes in the landscape. This investigation looks at the economic value of ecosystem services at the city level. Through historical studies of the landscape modification of the natural land covers, better approaches for managing ecosystems and land can be developed, addressing the dynamics of urban expansion and their consequences on urban ecosystems. This will enable sustainable development.
This study fills a knowledge vacuum about the connection between the environment and the rate of urban expansion and how the encroachment of physical structures impacts the monetary worth of natural capital. Additionally, it provides new insights into the body of knowledge already available on how urbanization affects ecosystems. The study aims to examine how the city has expanded over the past three decades, how constructed land has replaced natural land covers, and how this has eventually impacted ecosystems. It also assesses the elements that drive urban expansion.
2 Data and methods
2.1 Study area
The study area was chosen based on which Addis Ababa is the country’s capital and largest metropolitan city or regional city; the primary hub for politics, business, and industry; a rapidly urbanizing country with the majority of its population living in cities. It is located in the middle of the country, with the administration of Sheger City surrounding it.
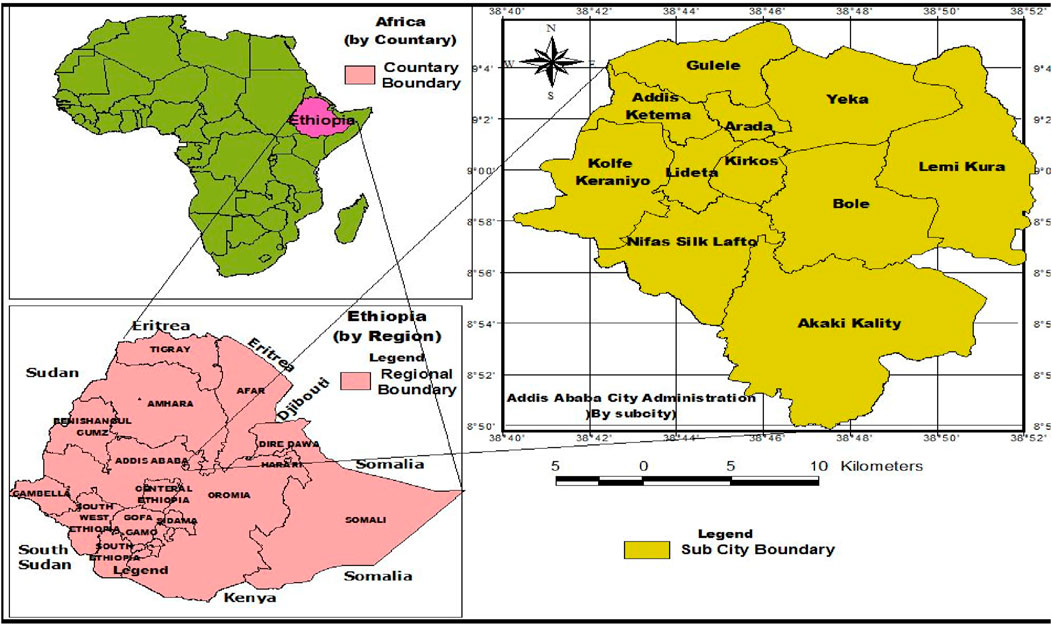
The capital of Ethiopia and the diplomatic hub of Africa is the metropolitan Addis Ababa. It is among the cities in the continent with the quickest growth. At an average altitude of 2,380 m, the city is situated between 8°50′00″N-9°06′00″ N and 38°39′00″E−38°55′00″E (Figure 1). By 2037, the population of the city is projected to reach 5,132,000 (CSA, 2013). However, UN-HABITAT forecasts a more significant increase, predicting that the population will rise to 12 million by 2024 (UN-HABITAT, 2008). The average daily lowest and maximum temperatures for 30 years (1990–2020) are 9.01°C and 38.75°C, respectively, with an average annual rainfall of 1,255 mm.
2.2 Data collection
2.2.1 Satellite data acquisition
Several images from Landsat TM, ETM+, and OLI/TIRS for selected years (one every 10 years) were obtained for the study area from the USGS Earth Explorer website. The acquired Landsat data is geo-referenced using the Universal Transverse Mercator (UTM) coordinate system and the World Geodetic System (WGS 84) datum. In this study, the supervised maximum likelihood strategy was applied to the land use/land cover categorization (LULC) and the identification of matched biomes using ArcGIS 10.3. Images were selected with less than 10% cloud cover to study how land use has changed and how much has been urbanized. In addition to satellite imagery, field observations, and Google Earth maps were employed as supplementary data sources. Ground truth points for LULC (Land use land cover) mapping were created using Google Earth. Table 1 lists and provides a brief description of the Landsat images utilized in the current study.

Table 1. List of landsat images used in the current study, including their characteristics and acquisition dates.
2.2.1.1 Images classification and accuracy evaluation
For LULC classifications, Landsat images from four distinct years 1993, 2003, 2013, and 2023 were used. Using a maximum likelihood technique, supervised classification was used to classify these images. The LULC types in the study area were categorized into six groups: bare land, water bodies, green space, cropland, built-up regions, and forest land.
The identified LULC classes are defined as follows: bare land (areas devoid of vegetation, settlement, or cultivation); cropland (mostly a mosaic of farms); built-up (buildings and roads); water body (small ponds or rivers); forest land (dense forest); and green space (small patches of forest, plantation/vegetation along rivers, and grassland). The confusion/error matrix was used to evaluate the classification accuracy of the images. An equalized random sampling technique was employed to ensure an unbiased and equitable assessment. For each LULC class, fifty random points were created to validate the classified land cover distribution developed in the study. The actual ground truth conditions of the different land uses in the study area were confirmed using old Google Earth images. The following metrics were used to evaluate the accuracy of the land cover classification: overall accuracy, producer accuracy, user accuracy, and the Kappa index of agreement, also known as the Kappa coefficient.
2.2.2 Data for ecosystem service values
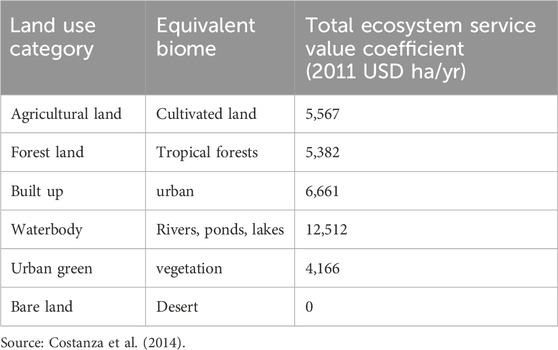
The global ecosystem services value coefficients produced by Costanza et al. (2014), utilizing the benefits transfer approach to ecosystem service value were used in this analysis. The global coefficients used by Costanza et al. (2014) were selected because of their widespread use by researchers in areas with little data, such as Africa. Moreover, the data have been updated from Costanza et al.(1998) global coefficients while accounting for important objections. The criticisms were due to static values for ecosystems, without accounting for changes over time, such as ecosystem degradation or land-use change; the classification of ecosystem services in the 1997 study was seen as too simplified, with overlaps between categories potentially leading to double-counting; and did not include some services that became more recognized in ecological research over time, such as climate regulation and carbon sequestration. The most appropriate biome was selected for each form of land use: cultivated land for cropland, tropical forest for forest land, urban for built-up areas, rivers, ponds, and lakes for water bodies, vegetation for green space, and desert for bare land (Table 2).
The total ecosystem service values for each land use category were used as proxy indicators for the impact of landscape change induced by urban expansion on ecosystem services in Addis Ababa (Table 3).

Table 3. The values of individual ecosystem service value function (ESVf) per unit area for individual land use categories (US$/ha/year).
2.2.3 Expert survey and interviews
Responses to the expert survey were gathered from a wide range of specialists who are informed about urbanization and its causes. Information on a variety of issues, including population growth, economic development, infrastructure investment, land use policies, political factors, and environmental considerations, that influence urban expansion is intended to be gathered through the survey questionnaire. Purposive sampling, expert judgment sampling, and non-probability sampling techniques were employed because of the specific knowledge needed. Rather than being chosen at random, experts were chosen based on their qualifications, expertise, and connection to the study question. Through paired comparisons, experts were asked to evaluate each criterion’s relative importance in promoting urban expansion. Experts assess the relative relevance of each aspect by comparing it to every other factor. Experts determine which criterion is more significant for each set of criteria and then issue numerical ratings accordingly. Scores are assigned from 1 (equal importance) to 9 (high importance).
Professionals from land management, housing and infrastructure development, environmental institutions, and urban and regional planning from the city to district level participated in the expert surveys to gather information and ideas. The questionnaire designs were based on previous research on the factors driving urban expansion. Out of the 120 questionnaires that were distributed, 111 were collected.
2.3 Methods of analysis
2.3.1 Techniques for assessing urbanization and changes in land use
2.3.1.1 Measuring urban expansion
The methods most commonly employed to quantify urban expansion are spatial matrices. Annual Urban Expansion Rate (AUER) and the Urban Expansion Intensity Index (UEII) have been employed in this study based on the availability of data. The AUER measures the average annual rate of land development between two time periods. It is not reliant on the size of the spatial unit and is a modified version of the compound growth rate formula (Equation 1) (Terfa et al., 2019).
where d is the research period for a specific amount of time, Astart and Aend are the corresponding urban regions in the beginning and last periods, and AUER is the standardized annual urban growth rate (%).
The second is the Urban Expansion Intensity Index (UEII), which shows the percentage of a geographical unit’s urban expansion relative to the entire research region and study length and describes the degree of differentiation of urban growth (Equation 2) (Sun et al., 2020).
where TA is the total size of the city, UEII is the intensity of urban expansion throughout the period t and t + n; Ut + n and Ut represent the urban land area of the built-up at that time t + n and t.
The UEII result shows a spatial unit’s intensity of urban expansion in the whole research area. The following are the criteria for UEII value: a speed greater than 1.92 is classified as “high speed,” a speed between 1.92 and 1.05 as “fast,” a speed between 1.05 and 0.59 as “medium speed,” a speed between 0.59 and 0.28 as “low speed,” a speed between 0.28 and 0 as “slow,” and values below zero as “decreasing intensity” (Al-Sharif et al., 2014).
2.3.1.2 Land use land cover change detection
The Land Use transition matrix (post-classification) approach was used in this study to identify changes in LULC in Addis Ababa City between 1993 and 2023. The following periods’ rates of change were calculated: 1993–2003, 2003–2013, and 2013–2023. The current study estimated the computed areas of land use and land cover (LULC) classes for the years 1993, 2003, 2013, and 2023. The formula proposed by Puyravaud (2003) was used to calculate the LULC change rate (Equation 3).
where r is the percentage change rate annually; Ai and Af are the initial and final LULC areas, respectively, and Δt is the time interval in years during the LULC change being examined. ln is the base of the natural logarithm function.
where MC is marginal change, P (%) is percentage change, Ai is the class area (ha) at the initial time, and Af is the class area (ha) at the final time (Equations 4, 5) (Puyravaud, 2003).
2.3.2 An assessment of ecosystem services
2.3.2.1 Estimation of ESV
Using the methodology described by Costanza et al. (2014), the total value of the ecosystem services for 1993, 2003, 2013, and 2023 represented by each land use category in Addis Ababa was determined. To calculate the ecosystem service value, each biome’s proxy value coefficient and land use land cover change were used (Equation 6).
where ESVf is the ecosystem service value of function f, Ak is the area (ha) and VCfk is the value coefficient of function f (US $ ha−1 year−1) for land use category k. The value coefficients were obtained from Costanza et al.(2014).
The average ecosystem services value (ESVavr) was computed with the help of the following equation (Equation 7) developed by Costanza et al. (1998).
where Ua is the total geographic area of the urban region and ESVt is the total ecosystem services value for a given study year.
2.3.2.2 Sensitivity and elasticity of ESV
The elasticity of ecosystem service values (ESV) with respect to land use changes was analyzed to assess the responsiveness of ESV to variations in land use categories (Costanza et al., 2017; .Wang et al., 2006). This analysis is essential for understanding the percentage change in ESV in response to a percentage change in value coefficients, given the inherent uncertainties in these coefficients and the fact that the biomes used as proxies do not perfectly align with the land use categories. In this study, elasticity was evaluated by adjusting the ESV coefficients by 50% for each land use category, providing insights into how sensitive ESV is to changes in land use values (Arowolo et al., 2018; Kindu et al., 2016) as follows using Equation 8.
where i, j, and k stand for the starting, modified values, and LULC categories, respectively; CS is the coefficient of sensitivity; ESV is the projected total value of ecosystem services; and VC is the value coefficient. The predicted ESV is elastic concerning VC changes if CS > 1. Additionally, complete elasticity is represented by CS = 1 and complete inelasticity by CS = 0. The predicted ESV is inelastic to changes in VC when CS < 1, and its findings are reliable even if the VC values used as proxy biomes have a low degree of accuracy (Kindu et al., 2016; Sannigrahi et al., 2018; Tolessa et al., 2021).
2.3.3 Analytic hierarchy process (AHP)
When analyzing complicated situations with several criteria and alternatives, the Analytic Hierarchy Process (AHP) is a structured decision-making process that is frequently employed. Using AHP to analyze the factors driving urban development based on expert surveys offers a methodical way to rank and assess the relative significance of different elements impacting urban growth. The drivers and reasons for Addis Ababa’s urban expansion were analyzed using a pairwise comparison matrix based on expert opinions from different institutions.
AHP is a theory of measurement based on pairwise comparisons that use expert opinion to create priority scales that demonstrate how much one component influences or matters more than another (Saaty, 2008). When two attributes are compared side by side, the significance of each is ascertained through comparison. The results are expressed numerically on a scale ranging from 1 to 9, where 1 denotes equal importance for both attributes and 9 denotes absolute importance for one over the other (Saaty, 2008). The reciprocal property, which is demonstrated via AHP comparisons, asserts that if two attributes, I and J, are compared and I has a value of x, then the value of the J attribute is 1/x. To determine which criteria or attribute has greater weight than the others, the method computes the normalized value, criteria weight, and consistency ratio. For consistency in judgment, a consistency ratio of less than or equal to 0.1 is considered acceptable. The final ranking of the judgments was obtained by taking the geometric mean of the final rankings supplied by each expert (St, 2022). Consistency ratios of 0.06–0.09 were obtained for all matrices that fall within the permitted range. Additionally, the drivers of urban expansion were ranked based on expert opinions to identify the most significant factors.
3 Results
3.1 Urban expansion of Addis Ababa from 1993 to 2023
Over the past three decades, there have been oscillations in the city’s urban expansion based on the rate and intensity of urban expansion.
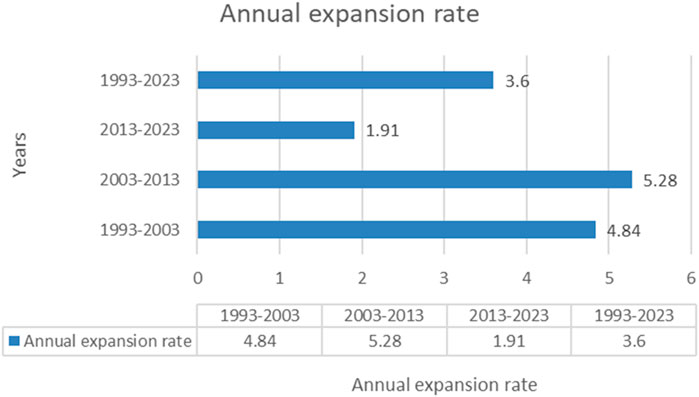
The percentage rise in urban areas per year during each period is shown by the yearly expansion rate. Figure 2 showed the years 2003–2013 had the highest yearly expansion rate, reflecting a decade of fast urban growth. We saw a slower yearly growth rate in the following period (2013–2023), which may indicate a slowing in urban expansion. The total period (1993–2023) exhibits a moderate yearly growth rate, which throughout the 30 years reflects consistent but uneven urban growth.
“Urban area growth” is the physical expansion of a city’s built-up land. “City growth” includes not only physical expansion but also population, economic, and service development. The rate at which urban areas are growing relative to the growth of the entire city area is measured by the urban expansion intensity index. Urban areas are growing faster than the city as a whole when the value is greater than 1 as Figure 3 indicates. The period from 2003 to 2013 saw the highest intensity index, suggesting that during that time, urban expansion exceeded overall city growth. The intensity index for the following period (2013–2023) is lower, indicating that urban expansion was comparatively slower than overall city growth. An intensity index larger than one for the entire period (1993–2023) indicates that urban areas grew more quickly than the city as a whole during that time. The yearly expansion rate sheds light on how quickly cities are growing over given periods. The intensity index provides insight into the relationship between total city growth and urban expansion. The period spanning from 2003 to 2013 exhibits the highest expansion rate and intensity index, suggesting a moment of rapid urbanization. The following time frame (2013–2023) exhibits a lower intensity index and a slower pace of expansion, indicating a more moderate period of urban growth. Therefore, the identification of the major drivers of urban expansion in Addis Ababa based on experts’ perceptions was carried out to know which factors are driving the urban expansion in the city.

Figure 3. The urban expansion intensity index of Addis Ababa from 1993–2003; 2003–2013; 2013–2023; and 1993–2023.
Table 4 shows the major drivers and triggering factors for urban expansion identified from the literature (Seto et al., 2012; United Nations Human Settlements Programme. and United Nations. Economic Commission for Africa, 2008).
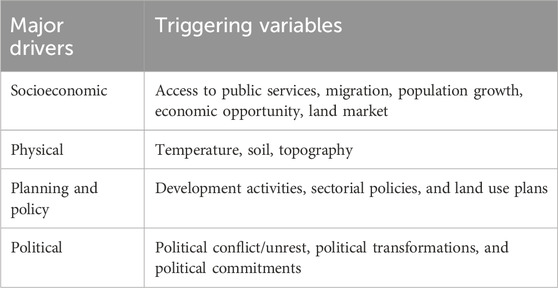
Table 4. Identification of major factors/drivers for urban expansion as identified from the literature.
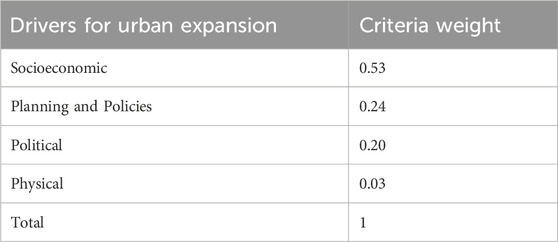
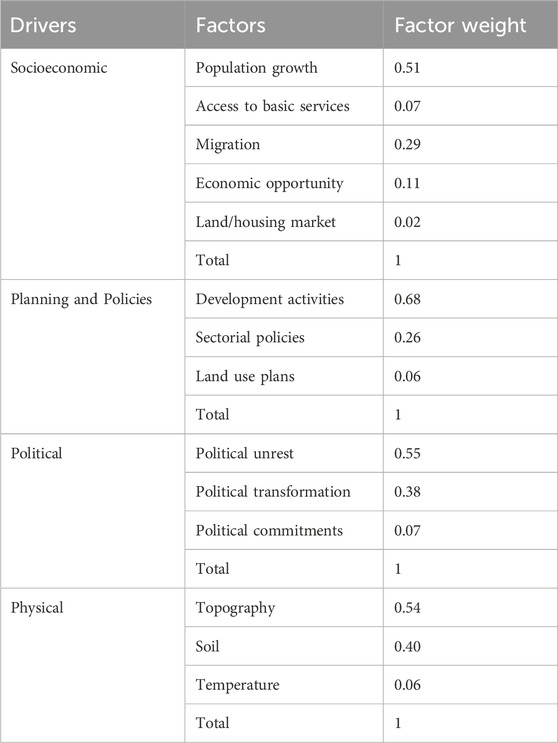
According to expert surveys, socioeconomic considerations are identified as the primary drivers of urban expansion, as illustrated in Table 5. These factors typically encompass housing demand, employment opportunities, economic growth, population increase, and income levels. Urban growth often mirrors socioeconomic trends, such as population increases driving up housing demand and stimulating business development. Planning and policy also play a crucial role in determining the nature and extent of urban expansion. Effective land use regulations, zoning laws, infrastructure development plans, and urban planning strategies significantly influence where and how urban expansion occurs. The emphasis experts place on planning and policy underscores the importance of proactive and well-designed planning efforts in managing urban growth sustainably. Political factors, including political stability, governance institutions, and transitions, also impact urban development. Political decisions related to taxation, public services, investment priorities, and regulatory frameworks can either facilitate or hinder urban expansion. Political upheaval and transformations have contributed to the proliferation of informal settlements, highlighting the significant role political considerations play in shaping the urban landscape. Physical factors, such as topography, soil type, and climate, also affect urban growth. While these environmental aspects are considered less influential compared to social, planning, and political factors, they remain important in assessing land suitability for development and influencing urban growth patterns. Overall, the interplay between socioeconomic, planning, political, and physical factors determine the trajectory of urban expansion, with socioeconomic and planning factors being the most influential according to expert assessments.
Within the realm of socioeconomic factors, population growth, and migration are identified as the primary drivers of urban expansion, as depicted in Table 6. The burgeoning population exerts pressure on urban areas, necessitating the development of housing, infrastructure, and services. Additionally, access to essential services and economic opportunities significantly influence urban expansion dynamics, as they contribute to the attractiveness of urban areas and fuel migration from rural and other urban regions. Economic factors such as business opportunities, income levels, and job availability further influence migration patterns and urban growth rates. While factors related to land and housing markets contribute to urban expansion, their impact is comparatively less pronounced.
In terms of planning and policies, development activities hold the highest weight, indicating their pivotal role in shaping urban expansion trajectories. These activities encompass various initiatives, including real estate projects, infrastructure investments, and urban redevelopment schemes, all of which significantly influence the spatial patterns and intensity of urban growth. Sectorial policies related to social services, transportation, industry, and agriculture also impact land use decisions and development patterns. Effective coordination of sector-specific policies can address socioeconomic challenges and foster sustainable urban development. Furthermore, zoning regulations and land use plans play crucial roles in guiding land allocation and ensuring balanced urban development. Political factors, while less influential than socioeconomic and planning factors, still impact urban expansion dynamics. Political unrest and instability can disrupt urban development processes and deter investment, leading to uncertain patterns of urban expansion. Conversely, stable political environments with clear policy agendas are conducive to sustainable urban growth. Political commitments to investment priorities and urban development goals can significantly shape the outcomes of urban expansion, highlighting the importance of strong political will and effective governance structures. Regarding physical factors, topography emerges as the most influential, followed by soil characteristics. The terrain’s features influence the spatial organization and growth potential of urban areas, while soil attributes affect land use decisions and infrastructure development patterns.
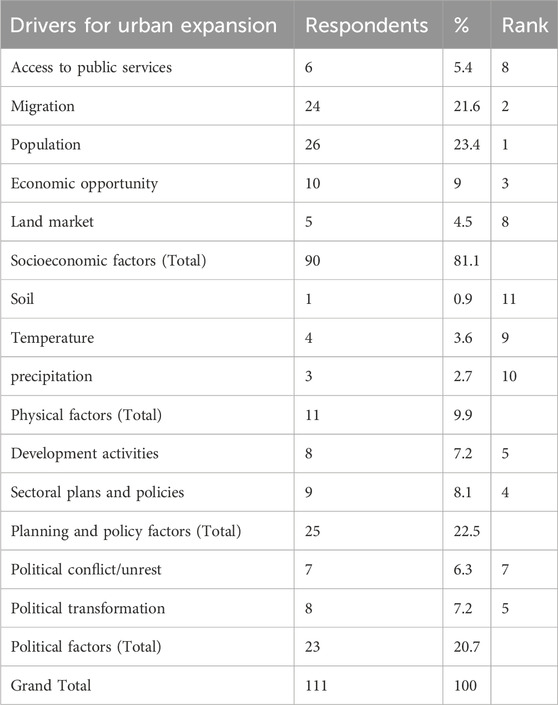
The analysis of expert perceptions on the drivers of urban expansion reveals a nuanced understanding of the factors influencing this phenomenon as it is indicated in Table 7. Population growth emerges as the most significant driver, with 23.4% of respondents highlighting its importance. Closely following is migration, deemed crucial by 21.6% of the experts. Economic opportunity is also a notable driver, identified by 9% of respondents. Together, these socioeconomic factors dominate the landscape, accounting for 81.1% of the total responses, underscoring their central role in urban expansion. Planning and policy factors, including sectoral plans and development activities, are recognized by 22.5% of experts, indicating a significant but secondary influence. Within this category, sectoral plans and policies are seen as particularly impactful, with 8.1% of respondents emphasizing their role. Political factors, encompassing political conflict and transformation, are identified by 20.7% of respondents as drivers of urban expansion, highlighting the influence of governance and stability on urban growth. Political transformation, in particular, is noted by 7.2% of experts. Physical factors, such as soil, temperature, and precipitation, are considered the least influential, collectively accounting for only 9.9% of responses. Among these, temperature is the most acknowledged physical driver, though still relatively minor at 3.6%. Overall, experts point to population growth, migration, and economic opportunities as the primary forces driving urban expansion, while planning, policy, and political factors also play significant, albeit secondary, roles. Physical factors are deemed the least impactful in this context.
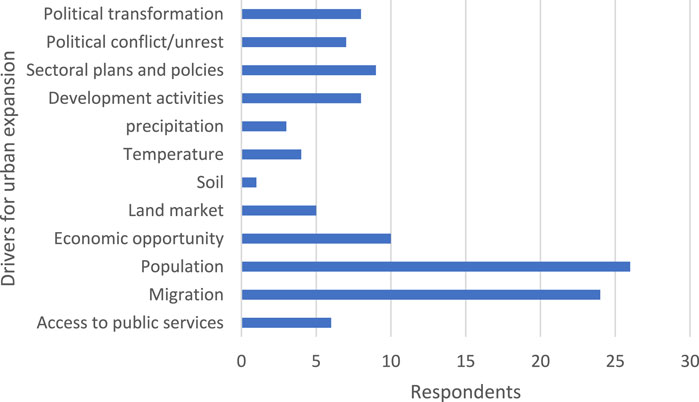
Figure 4 revealed that most experts state that population growth and migration are the primary drivers of urban expansion in the city, followed by economic opportunity and sectoral plans and policies.
3.2 Dynamics of land use land cover change due to urban expansion from 1993 to 2023
Urban expansion in the city leads to changes in land use and land cover, significantly impacting ecosystem service values. The changes in Addis Ababa’s land use and land cover between 1993 and 2023 were examined using satellite imagery, and ArcGIS was used for processing. With an overall kappa statistic of 0.83, the categorization accuracy was 89.6%. This satisfies the minimal requirements needed to use the result for additional analysis (Congalton, 1991).
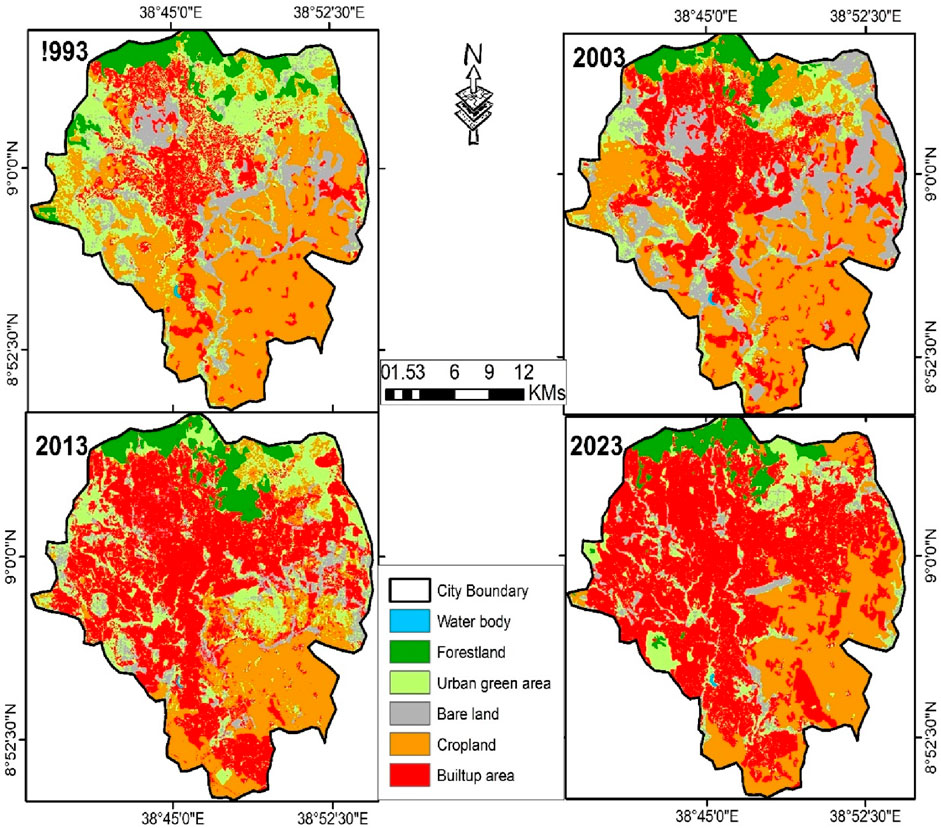
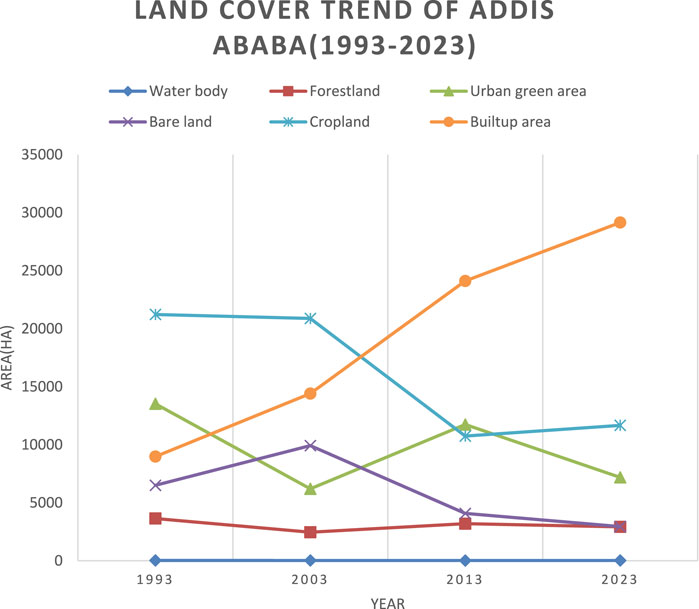
Figure 5 clearly illustrates the increasing trend of built-up areas and the corresponding decrease in natural land covers from 1993 to 2023.
Table 8 shows the percentage of water bodies remained consistently low throughout the years, ranging from 0.0% to 0.1%. This indicates a minimal change in the area covered by water bodies in Addis Ababa over the studied period. The percentage of forestland decreased from 6.8% in 1993 to 5.4% in 2023. This suggests a decline in the proportion of the city covered by forests, possibly due to urbanization and land use changes. The percentage of urban green areas decreased from 25.1% in 1993 to 13.3% in 2023. This significant reduction may indicate increased urbanization and development, resulting in the conversion of green areas to other land uses. The percentage of bare land decreased from 12.1% in 1993 to 5.5% in 2023. This reduction could be attributed to land development, conversion to other land uses, or changes in natural conditions. The percentage of cropland fluctuated with reduction from 1993 to 2023. Cropland covered 39.4% in 1993 and decreased to 21.7% in 2023. The percentage of built-up area increased significantly from 16.7% in 1993 to 54.1% in 2023.
Figure 6 indicates substantial urbanization and development, with more land being converted for built-up purposes. The trends suggest a shift towards increased urbanization and growth in Addis Ababa, leading to a decrease in green areas (urban green areas and forestland) and an increase in built-up areas. The city’s land cover has undergone dynamic changes, with implications for biodiversity, ecosystem services, and urban planning.
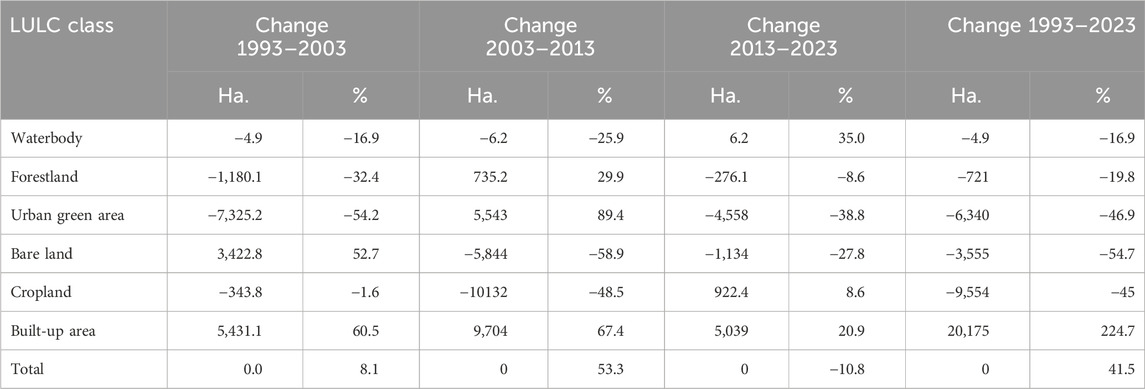
The area covered by water bodies decreased by 16.9% and 25.9% from 1993 to 2003 and 2003 to 2013 respectively, and increased by 35% from 2013 to 2023 (Table 9). Overall, there was a 16.9% decrease in water body area from 1993 to 2023. The negative changes may be due to anthropogenic activities or natural variations. Forestland experienced a substantial decrease of 32.4% from 1993 to 2003, followed by an increase of 29.9% from 2003 to 2013. However, there was a decline of 8.6% from 2013 to 2023, resulting in an overall decrease of 19.8% from 1993 to 2023. This suggests a complex pattern of forestland change over the years. The urban green area witnessed a significant decrease of 54.2% from 1993 to 2003, followed by a substantial increase of 89.4% from 2003 to 2013. However, there was a subsequent decrease of 38.8% from 2013 to 2023. Overall, there was a dramatic decrease of 46.9% in urban green areas from 1993 to 2023, indicating a substantial transformation of green spaces. Bare land increased by 52.7% from 1993 to 2003, followed by a substantial decrease of 58.9% from 2003 to 2013. There was a further decrease of 27.8% from 2013 to 2023, resulting in an overall decrease of 54.7% from 1993 to 2023. These changes were influenced by urban development or natural processes. Cropland experienced a small decrease of 1.6% from 1993 to 2003, followed by a significant decrease of 48.5% from 2003 to 2013. However, there was a subsequent increase of 8.6% from 2013 to 2023. Overall, there was a considerable decrease of 45% in cropland from 1993 to 2023, indicating a shift in land uses away from agriculture. The built-up area increased substantially, with a 60.5% increase from 1993 to 2003, a 67.4% increase from 2003 to 2013, and a 20.9% increase from 2013 to 2023. Overall, there was a remarkable increase of 224.7% in built-up areas from 1993 to 2023, highlighting significant urbanization and development. The overall trends suggest rapid urbanization and development in Addis Ababa, with a substantial increase in built-up areas at the expense of green spaces, cropland, and other land cover types. The fluctuations in certain land cover types, such as forestland and urban green areas, highlight the dynamic and complex nature of land use changes over time.
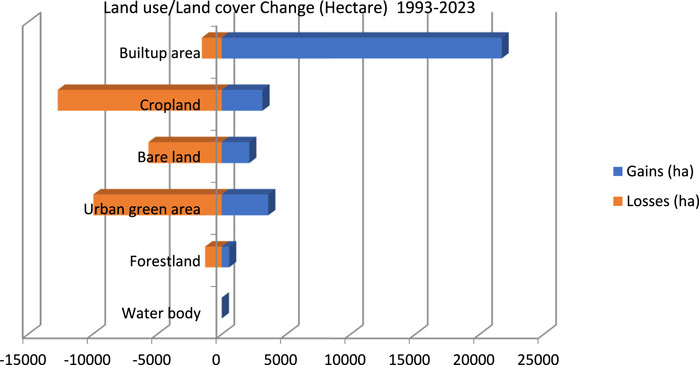
Table 10 demonstrates that the water body area shows persistence, with no gains or losses. The net change is a decrease of 5 ha, representing a 20.8% reduction from the initial area in 1993. Forestland has a persistence of 73.6%, indicating that a substantial portion of the initial forest area remains unchanged. The gains in forestland are 567 ha (1.82%), while the losses are 1,288 ha (4.1%), resulting in a net change of −721 ha (a 2.3% decrease). Urban green area has a lower persistence of 30.6%, indicating significant changes over the years. The gains are 3,597 ha (11.5%), and the losses are substantial at −9,937 ha (31.9%). The net change is a decrease of −6,340 ha (a 20.4% reduction). Bare land has a persistence of 20.2%, with gains of 2,121 ha (6.81%) and losses of −5,676 ha (18.2%). The net change is a decrease of −3,555 ha (an 11.4% reduction). Cropland has a high persistence of 79.3%, indicating stability in this land use type. The gains are 3,149 ha (10.1%), while the losses are significant at −12,702 ha (40.8%). The net change is a decrease of −9,554 ha (a 30.7% reduction). The built-up area has a persistence of 30.8%. Gains are substantial at 21,718 ha (69.7%), and losses are −1,543 ha (5.0%). The net change is an increase of 20,175 ha (a 64.8% growth).
The analysis indicates dynamic changes in land use and land cover types over the studied period. Urban green areas, bare land, and cropland have experienced significant reductions, while built-up areas have seen substantial growth. Forestland has a net decrease, reflecting a reduction in forested areas (Figure 7). The results suggest a notable shift from natural and agricultural land uses to urban and built-up areas. The decrease in green areas raises concerns about biodiversity, ecosystem services, and the overall environmental quality of the city.
3.3 Transformation in individual and grouped ecosystem services due to urban expansion from 1993 to 2023
The expansion of urban areas from 1993 to 2023 has triggered notable shifts in land use, influencing a spectrum of ecosystem services, both individually and collectively (Table 11).
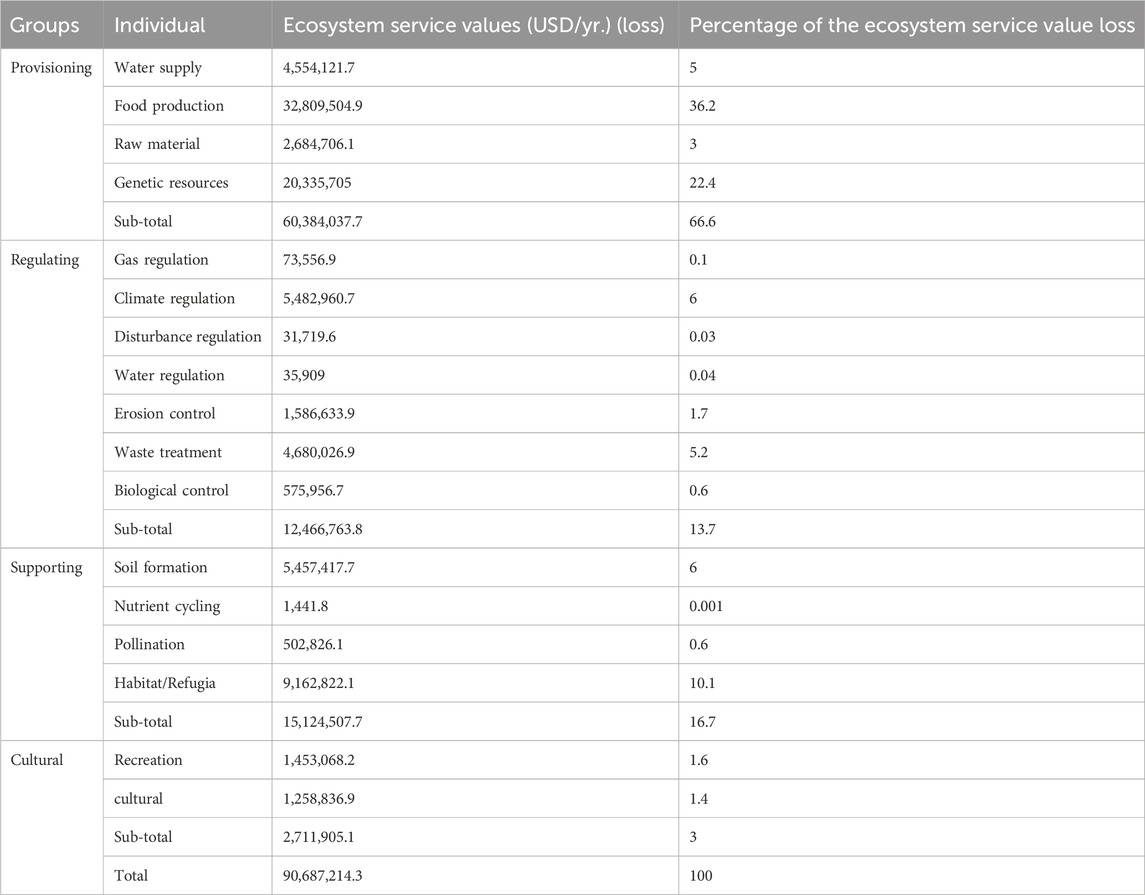
Table 11. Individual and grouped ecosystem service value loss due to urban expansion from 1993 to 2023.
The analysis of ecosystem service value loss resulting from urban expansion between 1993 and 2023 reveals significant impacts across various categories. The dollar values are from 2011, which Costanza et al. (2014) used to calculate the global value coefficients.
Table 11 revealed that Provisioning services, encompassing water supply, food production, and raw materials, experienced a combined loss of approximately $60.4 million annually, accounting for 66.6% of the total ecosystem service value loss. Notably, food production incurred the highest percentage loss at 36.2%, indicating a substantial impact on agricultural resources due to urban expansion. Regulating services, crucial for environmental balance, exhibited a combined loss of approximately $12.5 million annually, representing 13.7% of the total loss. Climate regulation and waste treatment were particularly affected, with losses of 6% and 5.2%, respectively. Supporting services, vital for ecosystem functioning, suffered a combined loss of approximately $15.1 million annually, constituting 16.7% of the total loss. Soil formation and habitat provision were notably affected, suggesting potential risks to biodiversity and ecosystem stability. Cultural services, contributing to human wellbeing, experienced a moderate loss of approximately $2.7 million annually, accounting for 3% of the total loss. Recreation and cultural heritage were the primary cultural services affected, underscoring the importance of preserving natural areas for recreational activities and cultural identity. Overall, the total ecosystem service value loss due to urban expansion amounted to approximately $90.7 million annually. This comprehensive analysis underscores the multifaceted impacts of urban expansion on ecosystem services, emphasizing the need for sustainable urban development strategies to mitigate adverse ecological consequences while promoting human wellbeing.
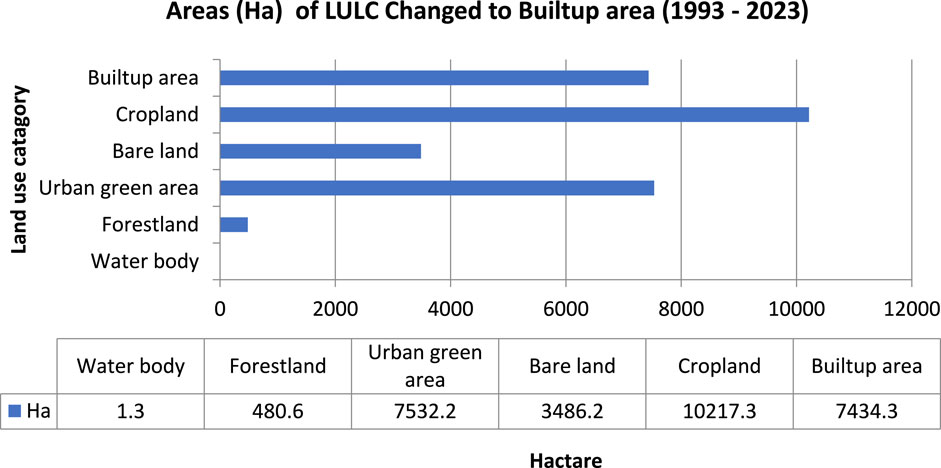
Based on the change detection analysis, the urban expansion in Addis Ababa has significantly impacted forestlands, urban green areas, and croplands (Figure 8). Water bodies have seen minimal conversion, with 1.3 ha of the total changed area being water bodies. Forestlands have seen a significant impact, with 480.6 ha or 1.6% of the total changed area converted to built-up areas. Urban green areas have seen a 25.8% conversion, highlighting the trade-off between urban development and green infrastructure preservation. Cropland, used for agricultural activities, has been heavily affected, with 10,217.3 ha or 35.0% converted to built-up areas. Overall, 62.5% of urban expansion was established on prior natural land covers, particularly agricultural land, green areas, and forest lands.
The expansion of built-up areas has resulted in the encroachment on various vital ecosystems, leading to significant losses in ecosystem service values. Specifically, 1.26 ha of water bodies have been transformed into built-up areas, causing an annual loss of ecosystem services valued at USD 15,765.12 (Table 12). This highlights the adverse impact of urbanization on the ecological functions provided by water bodies. Furthermore, the encroachment of built-up areas on 480.6 ha of forestland has led to a substantial loss of ecosystem services valued at USD 2,586,589 per year, underscoring the detrimental effects of urban development on forest ecosystems. Additionally, the conversion of urban green areas into built-up areas, affecting 7,532.19 ha, has resulted in a considerable loss of ecosystem services valued at USD 31,379,104 annually. This emphasizes the critical role of urban green spaces in providing diverse ecological services. Moreover, the encroachment of built-up areas on 10,217.34 ha of cropland has caused a significant loss of ecosystem services valued at USD 56,879,932 per year, highlighting the impact on agricultural productivity and associated services. In total, the encroachment of built-up areas on different land use categories has affected 18,231.39 ha, resulting in a cumulative loss in ecosystem service values estimated at USD 90,861,390.3 per year. These findings underscore the pressing need for sustainable urban planning strategies that prioritize the conservation and restoration of essential ecosystems to maintain ecological integrity and human wellbeing in rapidly urbanizing areas.
4 Discussion
4.1 The dynamics and drivers of urban expansion
A complex pattern of urban growth may be seen in the data on Addis Ababa’s annual expansion rate and urban expansion intensity index during the previous three decades. The adoption of the integrated housing development program through National Urban Development Policy 2005, which promotes the development of condominium housing projects in Addis Ababa, is primarily responsible for the phase of rapid urbanization indicated by the highest annual expansion rate and intensity index between 2003 and 2013 (UN-HABITAT, 2017) and proliferation of informal settlements (Terfa et al., 2019) due to the upheaval of 2005 and the absence of lease regulation which afterward issued in 2012. Overall, the findings demonstrated how the urban area drastically grew within the metropolis, a finding also supported by other studies (Tesfaye and Megento, 2016; Moisa and Gemeda, 2021; Terfa et al., 2019; Woldesemayat and Genovese, 2021; Zewdie et al., 2018). In agreement with this study, other studies carried out in similar cities reported there has been rapid urban expansion (Forget et al., 2021; Katyambo and Ngigi, 2017; Puplampu and Boafo, 2021).
The survey’s findings highlight the complex relationship between changing urban land use and socioeconomic issues, especially migration and population increase. It is acknowledged that access to public services and economic possibilities have a role in urbanization, as do the availability of jobs and other necessities. Even though they are acknowledged, physical variables have comparatively smaller percentages, indicating that they are less important than socioeconomic, political, and planning concerns. Drivers related to planning and policy emphasize the importance of deliberate urban development initiatives and the need for clear plans and policies. Political factors such as conflict and transformation are acknowledged, highlighting how political stability affects the usage of urban space.
Overall, the comprehensive analysis of these survey results provides valuable insights for urban planners, policymakers, and researchers. Creating solutions for resilient and sustainable urban development requires integrating a variety of viewpoints, including political, planning, environmental, and socioeconomic. To create successful urban planning strategies that balance development with environmental sustainability and societal wellbeing, it is imperative to comprehend these factors. It also emphasizes the necessity of comprehensive strategies that take into account how different elements interact to shape urban environments. The study revealed the major driver of urban expansion in Addis Ababa is the socioeconomic factors mainly population growth and migration on which the population dynamics in the city are increasing (UN-HABITAT, 2021) and demand for housing and infrastructure is escalating. Numerous studies emphasize the strong correlation between population growth and urbanization (Forget et al., 2021; Rijal et al., 2020; Zewdie et al., 2018). Contemporary research emphasizes the role of migration in shaping urban landscapes, particularly in the context of migration patterns and urbanization trends (Rijal et al., 2020; Zewdie et al., 2018). Rapid urbanization is often driven by demographic shifts and increased urban migration. The second most important driver is planning and policies which incorporate the development activities and sectorial policies. This implies that sectorial policies like housing and infrastructure urged urban expansion. Studies emphasize the role of planning and policies in guiding urban development (Terfa et al., 2019). Effective urban planning frameworks contribute to sustainable land use.
While the survey indicates a modest role for physical factors, some studies emphasize the importance of environmental considerations in urban expansion (Katyambo and Ngigi, 2017; Zewdie et al., 2018). Sustainable urban development often integrates environmental factors more comprehensively. Political stability or unrest influencing land use is well-documented (Katyambo and Ngigi, 2017; Rijal et al., 2020). The state of politics has the power to influence investment choices and change the course of urban development. Infrastructure and service accessibility are essential for urban development. Strong public services and facilities are associated with higher rates of urban expansion. Urbanization is known to be driven by economic activity and job possibilities (Rijal et al., 2020). Cities often attract individuals seeking better economic prospects; leading to changes in land use.
Consequently, applying integrated urban planning techniques that consider socioeconomic, political, and planning aspects. Give importance to sustainable land use methods in your plans and guidelines, which should strike a balance between development, environmental preservation, and societal wellbeing. In addition, protocols for tracking changes in land use over time and assessing the effectiveness of urban planning techniques must be established. Pay special attention to key indicators such as the pace of urbanization, population growth, and environmental conditions to inform policy changes and adaptive management approaches. To handle the fast population growth and urban migration, implement population control measures. This could entail creating and putting into place housing policies that offer sustainable and reasonably priced housing options to serve the expanding population without invading natural land covers. Furthermore, it should be encouraged for other secondary urban centers to grow by offering infrastructure and other amenities that are comparable to Addis Ababa’s overall stability, amenities, and services to entice people to live and work there and share the burden of Addis Ababa.
4.2 Land use land cover dynamics
The land cover percentage changes that have been seen in Addis Ababa throughout the study period show notable changes in the city’s landscape, which are consistent with larger urbanization issues that have been noted in many quickly developing cities.
The consistently low percentage of water bodies, ranging from 0.0% to 0.1%, reflects a limited presence of natural water features in Addis Ababa. Research highlights how urbanization affects water bodies, pointing to decreased water retention and availability as a result of increased impermeable surfaces and infrastructure development. The fluctuations in the extent of the water body can be attributed to both natural and manmade factors (Kumar et al., 2019; Lin et al., 2021). This observed increase in water body area from 2013 to 2023 might be indicative of environmental conservation efforts or natural variations in precipitation.
The decline in forestland from 6.8% in 1993 to 5.4% in 2023 aligns with research highlighting the challenges of preserving urban forests in rapidly growing cities. Tesfaye and Megento (2016) highlight the factors that have led to the observed decline in the percentage of forest land, including the pressures of urban growth and the conversion of forest areas for infrastructural development. The intricate pattern of forestland change is consistent with international debates about land-use policies, reforestation, and deforestation. The complexity of changes in forest cover, resulting from urbanization, conservation efforts, and agricultural growth, is highlighted by Osuri et al. (2020). The decline in forestland from 2013 to 2023 may necessitate a closer examination of land-use planning strategies and conservation policies.
The substantial decrease followed by an increase and subsequent decrease in urban green areas mirrors challenges in preserving green spaces in the city. Elmqvist et al. (2019) emphasize the significance of urban green spaces for human wellbeing, ecological services, and biodiversity. The observed variations necessitate comprehensive urban planning that strikes a balance between development and green space conservation. The substantial decrease in urban green area percentage from 25.1% in 1993 to 13.3% in 2023 indicates the impact of intensified urbanization on green spaces. Analogous research demonstrated that Addis Ababa underwent swift urban growth and a decrease in urban green areas as a result of unplanned and disorganized urban growth (Ayele et al., 2022; Moisa and Gemeda, 2021; Woldesemayat and Genovese, 2021; Zewdie et al., 2018). However, there are study results that describe the increment of urban green areas due to vegetation restoration and management in the course of urbanization (Huang et al., 2021; Koko et al., 2021).
The fluctuation and eventual reduction in cropland percentage from 39.4% in 1993 to 21.7% in 2023 may be linked to urbanization trends and changes in agricultural practices. Population growth and urbanization can lead to the conversion of cropland to built-up areas, impacting food security and land use patterns (Narducci et al., 2019). The decrease in cropland due to urban expansion was similarly concluded by other studies (Ashiagbor et al., 2019; Moisa and Gemeda, 2021; Zewdie et al., 2018). The observed increase in cropland from 2013 to 2023 may be influenced by efforts to enhance food security or changes in agricultural practices.
The notable rise in the built-up area percentage from 16.7% in 1993 to 54.1% in 2023 signifies rapid urban expansion and development. Similarly many studies revealed the built-up areas of urban centers increased significantly (Forget et al., 2021; Katyambo and Ngigi, 2017; Terfa et al., 2019; Woldesemayat and Genovese, 2021). This substantial increase in built-up areas resonates with global urbanization trends and their associated impacts. The remarkable increase in built-up areas in Addis Ababa underscores the need for sustainable urban planning to lessen the negative environmental consequences.
Figure 9 shows that the built-up area in Addis Ababa increased significantly between 1993 and 2023, while the natural land covers of cropland, forests, water bodies, and urban green areas generally show a decreasing trend. This suggests a trade-off between natural land covers and physical structures, which poses a challenge to the city’s sustainable development. Therefore, from land use planning to implementation, a great deal of effort should be made to strike a balance between ecological restoration and conservation and urban built-up development. Consequently, funding should be set aside for the creation and maintenance of green areas like parks, urban forests, and green corridors to improve biodiversity and supply vital ecosystem services. They are putting in place compact and mixed-use development patterns to reduce land use and safeguard environmentally sensitive places. Putting laws into place to prevent the conversion of waterways, croplands, and wooded regions into urban areas; establishing buffer zones and protected areas to preserve important habitats. Implementing restoration projects to repair damaged land covers and lessen the effects of urbanization on ecological services and biodiversity, such as reforestation and wetland restoration, and creating and enforcing laws that prohibit environmentally damaging activity and reward sustainable land use, such as tax breaks for investments in green infrastructure. Allowing local people to participate in conservation initiatives and involving them in land use planning processes to guarantee that decisions reflect local goals and values.
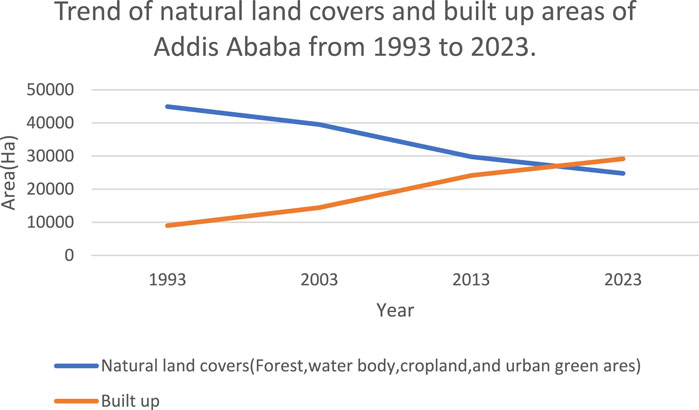
Figure 9. The trend of natural land cover (forest land, water body, cropland, and green space)and built-up areas of Addis Ababa from 1993 to 2023.
4.3 Urban expansion induced land use change and ecosystem services
The change in land use hurt ecosystems and the services they offer. Due to the conversion of a large amount of its natural land cover into physical structures, which prevented it from benefiting from ecosystem services, the city lost 83.5 million USD annually between 1993 and 2023. Analogous research demonstrated the detrimental impact of changing land use on ecosystems (Arowolo et al., 2018; Kusi et al., 2023; Tesfaw et al., 2018).
The study revealed a decrease in the contributions of individual ecosystem service functions to the total ecosystem service value (ESV) in the study area, with the most significant losses occurring in food production, habitat, and climate regulation. These declines not only impact the natural environment but also adversely affect human livelihoods and wellbeing. This finding is consistent with studies by researchers such as Oyinloye et al. (2018) and Tufa and Lika Megento (2022), who documented the loss of food production due to the conversion of agricultural lands into settlements. Furthermore, studies by Markos et al. (2018) and Msofe et al. (2020) highlighted the loss of climate regulation and habitat functions resulting from land use changes. It is essential to consider the consequences of land use change and promote sustainable practices to mitigate negative impacts on ecosystem services.
The study also identified a significant reduction in provisioning services, suggesting that a large portion of agricultural lands has been converted into settlements and infrastructures. Additionally, there was a notable decline in supporting and regulating services, indicating issues with habitat creation, gas regulation, climate regulation, and soil formation. Various studies have documented the negative impacts of land use change on ecosystem services, corroborating the findings of this analysis. For example, a study by Das and Das (2019) in a similar urban setting found that land use change associated with settlements led to a significant loss in supporting services, which aligns with the identified losses in this analysis. Similarly, research by González-García et al. (2020) and Wang et al. (2019) also highlights the detrimental effects of land use change on regulating and supporting services, respectively. These findings underscore the need for sustainable land use planning to protect and maintain ecosystem services. Urban expansion and the conversion of water bodies to built-up areas result in the loss of crucial ecosystem services. Water bodies provide services such as water purification, flood control, and habitat for biodiversity (Chen et al., 2020). The negative economic value reflects the cost of losing these services, including the potential expenses associated with water treatment and flood mitigation. Forests provide essential ecosystem services such as carbon sequestration, biodiversity conservation, and regulation of water flow (Costanza et al., 2017). The loss of forestland results in the reduction of these services, impacting climate regulation, wildlife habitat, and overall ecosystem health. The negative effect of urban expansion on forests was also demonstrated due to land use changes (Tesfaye and Megento (2016); Nguyen et al., 2020; Sejati et al., 2018). Urban green spaces support a variety of ecosystem services, such as temperature regulation, recreation places, and air purification. The resilience of urban ecosystems as a whole, human wellbeing, and the quality of the air and water are all adversely impacted by the loss of urban green spaces. The results are inconsistent with Gashu and Gebre-Egziabher (2018) and Mohamed and Worku (2019). Croplands provide vital ecosystem services related to food production, soil fertility, and cultural values (Rimal et al., 2020). Cropland conversion to built-up areas impacts agricultural biodiversity and regional food security in addition to lowering food production capability. The cumulative loss of ecosystem services as a result of changing land uses emphasizes the necessity of sustainable land management and urban planning techniques. To achieve long-term urban resilience, urbanization policy should take into account the trade-offs between sustaining vital ecological services and advancing economic development.
It is crucial to have integrated land-use planning that takes the value of ecosystem services into account since the loss of ecosystem services as a result of changing land use has serious negative effects on the environment and the economy. The analysis emphasizes the trade-off between the loss of important ecosystem services and urban growth (built-up areas). Even while developed areas support certain ecosystem services, there is a considerable net loss of ecosystem services as a result of the total effects on crops, water bodies, forests, and urban green spaces. To reduce the detrimental effects on ecosystem services, urban planning, and development initiatives must take the ecological value of the current land cover types into account (Hailu et al., 2023). Policymakers must prioritize land use planning approaches that incorporate green infrastructure, promote sustainable agricultural practices, and enhance urban resilience to climate change. By valuing and preserving ecosystem services, we can ensure the long-term sustainability of our urban landscapes and the wellbeing of future generations. Green infrastructure, conservation efforts, and sustainable urban development techniques can all help lessen the negative effects on ecosystem services. Making educated judgments regarding land use planning and maintaining the long-term viability of urban areas requires an understanding of these trade-offs.
5 Conclusion
The study underscores the critical need for sustainable urban development to mitigate the adverse effects of land use change on ecosystem services. The significant loss of services, including food production, habitat, and climate regulation, highlights the multifaceted impacts of rapid urban expansion. This decline threatens environmental stability, human wellbeing, and livelihoods. Integrating ecosystem service values into urban planning and development strategies is essential for balancing growth with ecological preservation. Policymakers must adopt comprehensive land use planning approaches that prioritize green infrastructure, conservation efforts, and sustainable agricultural practices. Valuing and protecting ecosystem services will ensure the long-term sustainability of urban landscapes, enhance resilience, and secure the wellbeing of future generations. A comprehensive analysis of Addis Ababa’s urban land use change dynamics over the past three decades reveals that a complex interplay of socioeconomic, environmental, and policy factors has shaped the city’s landscape. The findings indicate a trend of rapid urban expansion, primarily driven by migration, population growth, and government initiatives promoting integrated housing development. This growth has led to significant changes in land cover, including substantial increases in built-up areas and decreases in farmland, urban green spaces, and forests. These changes reflect a trade-off between urban growth and the loss of crucial ecosystem services. The conversion of natural land covers into built-up areas has negatively impacted ecosystem services provided by water bodies, forests, urban green spaces, and croplands. The loss of ecosystem services has significant environmental and economic consequences, affecting food security, biodiversity, water quality, and human wellbeing. Addressing these challenges requires urban planning strategies that balance development with environmental preservation and societal needs. Policies that support sustainable land use practices, green infrastructure development, and the protection and restoration of ecosystem services should be prioritized. Effective governance mechanisms are also essential to address the root causes of urban expansion, such as population growth and economic development, and to ensure equitable distribution of opportunities and resources. Overall, the results highlight the importance of holistic approaches to urban development that consider the interdependence of social, economic, and environmental factors. Policymakers, urban planners, and researchers must work together to build resilient and sustainable cities that enhance the wellbeing of both current and future generations. Further research on urban governance and stakeholder interactions in managing and conserving urban ecosystems is imperative to support these efforts. By incorporating diverse perspectives and engaging multiple stakeholders, it is possible to develop strategies that promote sustainable urban growth and safeguard essential ecosystem services.
Data availability statement
The raw data supporting the conclusions of this article will be made available by the authors, without undue reservation.
Ethics statement
Ethical review and approval was not required for the study on human participants in accordance with the local legislation and institutional requirements. Written informed consent from the [patients/participants OR patients/participants legal guardian/next of kin] was not required to participate in this study in accordance with the national legislation and the institutional requirements.
Author contributions
TH: Conceptualization, Data curation, Formal Analysis, Investigation, Methodology, Software, Validation, Visualization, Writing–original draft, Writing–review and editing. EA: Supervision, Validation, Writing–review and editing. TZ: Supervision, Validation, Writing–review and editing.
Funding
The author(s) declare that no financial support was received for the research, authorship, and/or publication of this article.
Acknowledgments
First and foremost, we extend our appreciation to the experts who participated in surveys and interviews and provided valuable insights into the urbanization process and its effects on the environment we are indebted to the authorities and government agencies in Addis Ababa for their cooperation and support in providing access to relevant data and information necessary for this research. Finally, we are grateful to thank Addis Ababa University for its overall support.
Conflict of interest
The authors declare that the research was conducted in the absence of any commercial or financial relationships that could be construed as a potential conflict of interest.
Publisher’s note
All claims expressed in this article are solely those of the authors and do not necessarily represent those of their affiliated organizations, or those of the publisher, the editors and the reviewers. Any product that may be evaluated in this article, or claim that may be made by its manufacturer, is not guaranteed or endorsed by the publisher.
References
Alawamy, J. S., Balasundram, S. K., Hanif, A. H. M., and Sung, C. T. B. (2020). Detecting and analyzing land use and land cover changes in the Region of Al-Jabal Al-Akhdar, Libya using time-series landsat data from 1985 to 2017. Sustain. Switz. 12 (11), 4490. doi:10.3390/su12114490
Al-Sharif, A. A. A., Pradhan, B., Shafri, H. Z. M., and Mansor, S. (2014). Quantitative analysis of urban sprawl in Tripoli using Pearson’s Chi-Square statistics and urban expansion intensity index. IOP Conf. Ser. Earth Environ. Sci. 20 (1), 012006. doi:10.1088/1755-1315/20/1/012006
Arowolo, A. O., Deng, X., Olatunji, O. A., and Obayelu, A. E. (2018). Assessing changes in the value of ecosystem services in response to land-use/land-cover dynamics in Nigeria. Sci. Total Environ. 636, 597–609. doi:10.1016/j.scitotenv.2018.04.277
Aryal, K., Ojha, B. R., and Maraseni, T. (2021). Perceived importance and economic valuation of ecosystem services in Ghodaghodi wetland of Nepal. Land Use Policy 106, 105450. doi:10.1016/j.landusepol.2021.105450
Ashiagbor, G., Amoako, C., Asabere, S. B., and Quaye-Ballard, J. A. (2019). Landscape transformations in rapidly developing peri-urban areas of accra, Ghana: results of 30 years. Open Geosci. 11 (1), 172–182. doi:10.1515/geo-2019-0014
Ayele, B. Y., Megento, T. L., and Habetemariam, K. Y. (2022). Assessing green infrastructure spatial plans in Addis Ababa, Ethiopia. Socio-Ecological Pract. Res. 4 (2), 85–101. doi:10.1007/s42532-022-00115-9
Bai, X., McPhearson, T., Cleugh, H., Nagendra, H., Tong, X., Zhu, T., et al. (2017). Linking urbanization and the environment: conceptual and empirical advances. Annu. Rev. Environ. Resour. 42, 215–240. doi:10.1146/annurev-environ-102016-061128
Berihun, M. L., Tsunekawa, A., Haregeweyn, N., Tsubo, M., and Fenta, A. A. (2021). Changes in ecosystem service values strongly influenced by human activities in contrasting agro-ecological environments. Ecol. Process. 10 (1), 52–18. doi:10.1186/s13717-021-00325-1
Chen, D., Elhadj, A., Xu, H., Xu, X., and Qiao, Z. (2020). A study on the relationship between land use change and water quality of the Mitidja watershed in Algeria based on GIS and RS. Sustain. Switz. 12 (9), 3510. doi:10.3390/SU12093510
Chen, L., Li, L., Yang, X., Zhang, Y., Chen, L., and Ma, X. (2019). Assessing the impact of land-use planning on the atmospheric environment through predicting the spatial variability of airborne pollutants. Int. J. Environ. Res. Public Health 16 (2), 172–218. doi:10.3390/ijerph16020172
Chen, W., Chi, G., and Li, J. (2019). The spatial association of ecosystem services with land use and land cover change at the county level in China, 1995–2015. Sci. Total Environ. 669, 459–470. doi:10.1016/j.scitotenv.2019.03.139
Congalton, R. G. (1991). A review of assessing the accuracy of classifications of remotely sensed data. Remote Sens. Environ. 37 (1), 35–46. doi:10.1016/0034-4257(91)90048-B
Costanza, R., d’Arge, R., de Groot, R., Farber, S., Grasso, M., Hannon, B., et al. (1998). The value of the world’s ecosystem services and natural capital. Ecol. Econ. 25 (1), 3–15. doi:10.1016/s0921-8009(98)00020-2
Costanza, R., de Groot, R., Braat, L., Kubiszewski, I., Fioramonti, L., Sutton, P., et al. (2017). Twenty years of ecosystem services: how far have we come and how far do we still need to go? Ecosyst. Serv. 28, 1–16. doi:10.1016/j.ecoser.2017.09.008
Costanza, R., de Groot, R., Sutton, P., van der Ploeg, S., Anderson, S. J., Kubiszewski, I., et al. (2014). Changes in the global value of ecosystem services. Glob. Environ. Change 26 (1), 152–158. doi:10.1016/j.gloenvcha.2014.04.002
CSA (2013). Population projections for Ethiopia 2007-2037. Ethiopia: Central Statistical Agency Population, 188.
Dai, X., Johnson, B. A., Luo, P., Yang, K., Dong, L., Wang, Q., et al. (2021). Estimation of urban ecosystem services value: a case study of Chengdu, Southwestern China. Remote Sens. 13 (2), 207–224. doi:10.3390/rs13020207
Das, M., and Das, A. (2019). Dynamics of urbanization and its impact on urban ecosystem services (UESs): a study of a medium size town of West Bengal, eastern India. J. Urban Manag. 8 (3), 420–434. doi:10.1016/j.jum.2019.03.002
Degefu, M. A., Argaw, M., Feyisa, G. L., and Degefa, S. (2021). Dynamics of urban landscape nexus spatial dependence of ecosystem services in rapid agglomerate cities of Ethiopia. Sci. Total Environ. 798, 149192. doi:10.1016/J.SCITOTENV.2021.149192
Deribew, K. T., and Dalacho, D. W. (2019). Land use and forest cover dynamics in the North-eastern Addis Ababa, central highlands of Ethiopia. Environ. Syst. Res. doi:10.1186/s40068-019-0137-1
Elmqvist, T., Andersson, E., Frantzeskaki, N., McPhearson, T., Olsson, P., Gaffney, O., et al. (2019). Sustainability and resilience for transformation in the urban century. Nat. Sustain. 2 (4), 267–273. doi:10.1038/s41893-019-0250-1
Fan, Y., Jin, X., Gan, L., Jessup, L. H., Pijanowski, B. C., Yang, X., et al. (2018). Spatial identification and dynamic analysis of land use functions reveals distinct zones of multiple functions in eastern China. Sci. Total Environ. 642, 33–44. doi:10.1016/j.scitotenv.2018.05.383
Fitawok, M. B., Derudder, B., Minale, A. S., Passel, S. V., Adgo, E., and Nyssen, J. (2020). Modeling the impact of urbanization on land-use change in Bahir Dar City, Ethiopia: an integrated cellular automata-Markov chain approach. Land 9 (4), 115–117. doi:10.3390/land9040115
Forget, Y., Shimoni, M., Gilbert, M., and Linard, C. (2021). Mapping 20 years of urban expansion in 45 urban areas of sub-Saharan Africa. Remote Sens. 13 (3), 525–619. doi:10.3390/rs13030525
Gashaw, T., Tulu, T., Argaw, M., Worqlul, A. W., Tolessa, T., and Kindu, M. (2018). Estimating the impacts of land use/land cover changes on Ecosystem Service Values: the case of the Andassa watershed in the Upper Blue Nile basin of Ethiopia. Ecosyst. Serv. 31, 219–228. doi:10.1016/j.ecoser.2018.05.001
Gashu, K., and Gebre-Egziabher, T. (2018). Spatiotemporal trends of urban land use/land cover and green infrastructure change in two Ethiopian cities: bahir Dar and Hawassa. Environ. Syst. Res. 7 (1), 8. doi:10.1186/s40068-018-0111-3
Gómez-Baggethun, E., and Ruiz-Pérez, M. (2011). Economic valuation and the commodification of ecosystem services. Prog. Phys. Geogr. 35 (5), 613–628. doi:10.1177/0309133311421708
González-García, A., Palomo, I., González, J. A., López, C. A., and Montes, C. (2020). Quantifying spatial supply-demand mismatches in ecosystem services provides insights for land-use planning. Land Use Policy 94, 104493. doi:10.1016/j.landusepol.2020.104493
Hailu, T., Assefa, E., and Zeleke, T. (2023). Land use planning implementation and its effect on the ecosystem in Addis Ababa, Ethiopia. Environ. Challenges 13, 100798. doi:10.1016/j.envc.2023.100798
Huang, B., Li, Z., Dong, C., Zhu, Z., and Zeng, H. (2021). The effects of urbanization on vegetation conditions in coastal zone of China. Prog. Phys. Geogr. 45 (4), 564–579. doi:10.1177/0309133320979501
Indrawati, L., Sigit Heru Murti, B. S., Rachmawati, R., and Aji, D. S. (2020). Effect of urban expansion intensity on urban ecological status utilizing remote sensing and GIS: a study of semarang-Indonesia. IOP Conf. Ser. Earth Environ. Sci. 451 (1), 012018. doi:10.1088/1755-1315/451/1/012018
Kasim, O. F., Abshare, M. W., Mukuna, T. E., and Wahab, B. (2018). Land use and ambient air quality in bahir dar and hawassa, Ethiopia. Air, Soil and Water Res., 11. doi:10.1177/1178622117752138
Katyambo, M. M., and Ngigi, M. M. (2017). Spatial monitoring of urban growth using GIS and remote sensing: a case study of nairobi metropolitan area, Kenya. Am. J. Geogr. Inf. Syst. 2017 (2), 64–82. doi:10.5923/j.ajgis.20170602.03
Kindu, M., Schneider, T., Teketay, D., and Knoke, T. (2016). Changes of ecosystem service values in response to land use/land cover dynamics in Munessa-Shashemene landscape of the Ethiopian highlands. Sci. Total Environ. 547, 137–147. doi:10.1016/j.scitotenv.2015.12.127
Kiros Weldegebriel, S., and Yeshitela, K. (2021). The dynamics of land use land cover and its driving forces in mekelle city region, Ethiopia. Asian Rev. Environ. Earth Sci. 8 (1), 18–29. doi:10.20448/journal.506.2021.81.18.29
Koko, A. F., Wu, Y., Abubakar, G. A., Alabsi, A. A. N., Hamed, R., and Bello, M. (2021). Thirty years of land use/land cover changes and their impact on urban climate: a study of kano metropolis, Nigeria. Land 10 (11), 1106–1127. doi:10.3390/land10111106
Kumar, P., Dasgupta, R., Johnson, B. A., Saraswat, C., Basu, M., Kefi, M., et al. (2019). Effect of land use changes on water quality in an ephemeral coastal plain: khambhat City, Gujarat, India. WaterSwitzerl. 11 (4), 724. doi:10.3390/w11040724
Kusi, K. K., Khattabi, A., and Mhammdi, N. (2023). Analyzing the impact of land use change on ecosystem service value in the main watersheds of Morocco. Environ. Dev. Sustain. 25 (3), 2688–2715. doi:10.1007/s10668-022-02162-4
Li, J., Fang, W., Wang, T., Qureshi, S., Alatalo, J. M., and Bai, Y. (2017). Correlations between socioeconomic drivers and indicators of urban expansion: evidence from the heavily urbanised Shanghai metropolitan area, China. Sustain. Switz. 9 (7), 1199. doi:10.3390/su9071199
Lin, J., Huang, J., Prell, C., and Bryan, B. A. (2021). Changes in supply and demand mediate the effects of land-use change on freshwater ecosystem services flows. Sci. Total Environ. 763, 143012. doi:10.1016/j.scitotenv.2020.143012
Liu, F., Zhang, Z., Shi, L., Zhao, X., Xu, J., Yi, L., et al. (2016). Urban expansion in China and its spatial-temporal differences over the past four decades. J. Geogr. Sci. 26 (10), 1477–1496. doi:10.1007/s11442-016-1339-3
Liu, W., Zhan, J., Zhao, F., Yan, H., Zhang, F., and Wei, X. (2019). Impacts of urbanization-induced land-use changes on ecosystem services: a case study of the Pearl River Delta Metropolitan Region, China. Ecol. Indic. 98, 228–238. doi:10.1016/j.ecolind.2018.10.054
Liu, Y., Zhou, G., Liu, D., Yu, H., Zhu, L., and Zhang, J. (2018). The interaction of population, industry and land in process of urbanization in China: a case study in jilin province. Chin. Geogr. Sci. 28 (3), 529–542. doi:10.1007/s11769-018-0964-4
Mao, D., He, X., Wang, Z., Tian, Y., Xiang, H., Yu, H., et al. (2019). Diverse policies leading to contrasting impacts on land cover and ecosystem services in Northeast China. J. Clean. Prod. 240, 117961. doi:10.1016/j.jclepro.2019.117961
Markos, M. G., Mihret, D. U., Teklu, E. J., and Getachew, M. G. (2018). Influence of land use and land cover changes on ecosystem services in the Bilate Alaba Sub-watershed, Southern Ethiopia. J. Ecol. Nat. Environ. 10 (9), 228–238. doi:10.5897/jene2018.0709
Millennium Ecosystem Assessment (2005). Ecosystems and human well-being: opportunities for business and industry. Millenium Ecosystem Management, 36. Available at: https://www.millenniumassessment.org/documents/document.754.aspx.pdf.
Mohamed, A., and Worku, H. (2019). Quantification of the land use/land cover dynamics and the degree of urban growth goodness for sustainable urban land use planning in Addis Ababa and the surrounding Oromia special zone. J. Urban Manag. 8, 145–158. doi:10.1016/j.jum.2018.11.002
Moisa, M. B., and Gemeda, D. O. (2021). Analysis of urban expansion and land use/land cover changes using geospatial techniques: a case of Addis Ababa City, Ethiopia. Appl. Geomatics 13 (4), 853–861. doi:10.1007/s12518-021-00397-w
Msofe, N. K., Sheng, L., Li, Z., and Lyimo, J. (2020). Impact of land use/cover change on ecosystem service values in the Kilombero valley floodplain, southeastern Tanzania. Forests 11 (1), 109–117. doi:10.3390/f11010109
Muleta, T. T., and Biru, M. K. (2019). Human modified landscape structure and its implication on ecosystem services at Guder watershed in Ethiopia. Environ. Monit. Assess. 191 (5), 295. doi:10.1007/s10661-019-7403-6
Narducci, J., Quintas-Soriano, C., Castro, A., Som-Castellano, R., and Brandt, J. S. (2019). Implications of urban growth and farmland loss for ecosystem services in the western United States. Land Use Policy 86, 1–11. doi:10.1016/j.landusepol.2019.04.029
Nguyen, T. T., Barber, P., Harper, R., Linh, T. V. K., and Dell, B. (2020). Vegetation trends associated with urban development: the role of golf courses. PLoS ONE 15 (2), 02280900–e228120. doi:10.1371/journal.pone.0228090
Osuri, A. M., Gopal, A., Raman, T. R. S., Defries, R., Cook-Patton, S. C., and Naeem, S. (2020). Greater stability of carbon capture in species-rich natural forests compared to species-poor plantations. Environ. Res. Lett. 15 (3), 034011. doi:10.1088/1748-9326/ab5f75
Oyinloye, M. A., Ogunlade, S. O., and Owoeye, J. O. (2018). Geo-spatial analysis of informal settlements on landuse/cover change areas of osogbo, Nigeria. Am. J. Environ. Sustain. Dev. 3 (3), 55–70. doi:10.13140/RG.2.2.23637.27367
Peng, L., Chen, T., Wang, Q., and Deng, W. (2020). Linking ecosystem services to land use decisions: policy analyses, multi-scenarios, and integrated modelling. ISPRS Int. J. Geo-Information 9 (3), 154. doi:10.3390/ijgi9030154
Pickett, S. T. A., Cadenasso, M. L., Childers, D. L., Mcdonnell, M. J., and Zhou, W. (2016). Evolution and future of urban ecological science: ecology in, of, and for the city. Ecosyst. Health Sustain. 2 (7). doi:10.1002/ehs2.1229
Puplampu, D. A., and Boafo, Y. A. (2021). Exploring the impacts of urban expansion on green spaces availability and delivery of ecosystem services in the Accra metropolis. Environ. Challenges 5, 100283. doi:10.1016/j.envc.2021.100283
Puyravaud, J. P. (2003). Standardizing the calculation of the annual rate of deforestation. For. Ecol. Manag. 177 (1–3), 593–596. doi:10.1016/S0378-1127(02)00335-3
Rijal, S., Rimal, B., Stork, N., and Sharma, H. P. (2020). Quantifying the drivers of urban expansion in Nepal. Environ. Monit. Assess. 192 (10), 633. doi:10.1007/s10661-020-08544-3
Rimal, B., Sloan, S., Keshtkar, H., Sharma, R., Rijal, S., and Shrestha, U. B. (2020). Patterns of historical and future urban expansion in Nepal, 1–22.
Saaty, T. L. (2008). Decision making with the analytic hierarchy process. Int. J. Serv. Sci. 1 (1), 83. doi:10.1504/ijssci.2008.017590
Sannigrahi, S., Bhatt, S., Rahmat, S., Paul, S. K., and Sen, S. (2018). Estimating global ecosystem service values and its response to land surface dynamics during 1995–2015. J. Environ. Manag. 223, 115–131. doi:10.1016/j.jenvman.2018.05.091
Schröter, M., van der Zanden, E. H., van Oudenhoven, A. P. E., Remme, R. P., Serna-Chavez, H. M., de Groot, R. S., et al. (2014). Ecosystem services as a contested concept: a synthesis of critique and counter-arguments. Conserv. Lett. 7 (6), 514–523. doi:10.1111/conl.12091
Sejati, A. W., Buchori, I., and Rudiarto, I. (2018). The impact of urbanization to forest degradation in metropolitan semarang: a preliminary study. IOP Conf. Ser. Earth Environ. Sci. 123 (1), 012011. doi:10.1088/1755-1315/123/1/012011
Seto, K. C., Güneralp, B., and Hutyra, L. R. (2012). Global forecasts of urban expansion to 2030 and direct impacts on biodiversity and carbon pools. Proc. Natl. Acad. Sci. U. S. A. 109 (40), 16083–16088. doi:10.1073/pnas.1211658109
Shrestha, M., and Acharya, S. C. (2021). Assessment of historical and future land-use–land-cover changes and their impact on valuation of ecosystem services in Kathmandu Valley, Nepal. Land Degrad. Dev. 32 (13), 3731–3742. doi:10.1002/ldr.3837
Song, W., and Deng, X. (2017). Land-use/land-cover change and ecosystem service provision in China. Sci. Total Environ. 576, 705–719. doi:10.1016/j.scitotenv.2016.07.078
St, C. (2022). Strategic decision making: applying the analytic hierarchy process (decision engineering). London: Springer.
Sun, W., Shan, J., Wang, Z., Wang, L., Lu, D., Jin, Z., et al. (2020). Geospatial analysis of urban expansion using remote sensing methods and data: a case study of yangtze river delta, China. Complexity 2020, 1–12. doi:10.1155/2020/3239471
Tang, Z., Engel, B. A., Pijanowski, B. C., and Lim, K. J. (2005). Forecasting land use change and its environmental impact at a watershed scale. J. Environ. Manag. 76, 35–45. doi:10.1016/j.jenvman.2005.01.006
Terfa, B. K., Chen, N., Liu, D., Zhang, X., and Niyogi, D. (2019). Urban expansion in Ethiopia from 1987 to 2017: characteristics, spatial patterns, and driving forces. Sustain. Switz. 11 (10), 2973–3021. doi:10.3390/su11102973
Tesfaw, A. T., Pfaff, A., Golden Kroner, R. E., Qin, S., Medeiros, R., and Mascia, M. B. (2018). Land-use and land-cover change shape the sustainability and impacts of protected areas. Proc. Natl. Acad. Sci. U. S. A. 115, 2084–2089. doi:10.1073/pnas.1716462115
Tesfaye, M., and Megento, L. T. (2016). The city of addis ababa from ‘forest city’ to ‘urban heat island’: assessment of urban green space dynamics. J. Urban Environ. Eng 10 (2), 254–262. doi:10.4090/juee.2016.v10n2.254262
Tolessa, T., Kidane, M., and Bezie, A. (2021). Assessment of the linkages between ecosystem service provision and land use/land cover change in Fincha watershed, North-Western Ethiopia. Heliyon 7 (7), e07673. doi:10.1016/j.heliyon.2021.e07673
Tolessa, T., Senbeta, F., and Abebe, T. (2017). Land use/land cover analysis and ecosystem services valuation in the central highlands of Ethiopia. For. Trees Livelihoods 26 (2), 111–123. doi:10.1080/14728028.2016.1221780
Trinder, J., and Liu, Q. (2020). Assessing environmental impacts of urban growth using remote sensing. Geo-Spatial Inf. Sci. 23 (1), 20–39. doi:10.1080/10095020.2019.1710438
Tufa, D. E., and Lika Megento, T. (2022). Conversion of farmland to non-agricultural land uses in peri-urban areas of Addis Ababa Metropolitan city, Central Ethiopia. GeoJournal 87 (6), 5101–5115. doi:10.1007/s10708-021-10553-9
UN-HABITAT (2017). The state of Addis Ababa 2017. Nairobi, Kenya: United Nations Human Settlements Programme (UN-Habitat).
United Nations Human Settlements Programme (2008) “Regional and technical cooperation division,” in Senegal: profil urbain de Dakar.
United Nations Human Settlements Programme. (2021). The state of addis ababa 2021 towards A healthier city.
United Nations Human Settlements Programme., and United Nations. Economic Commission for Africa. (2008). A framework for addressing urban challenges in Africa.
Wang, J., Zhou, W., Pickett, S. T. A., Yu, W., and Li, W. (2019). A multiscale analysis of urbanization effects on ecosystem services supply in an urban megaregion. Sci. Total Environ. 662, 824–833. doi:10.1016/j.scitotenv.2019.01.260
Wang, W., Wu, T., Li, Y., Xie, S., Han, B., Zheng, H., et al. (2020). Urbanization impacts on natural habitat and ecosystem services in the Guangdong-Hong Kong-Macao “Megacity.”. Sustain. Switz. 12 (16), 6675. doi:10.3390/su12166675
Wang, Z., Zhang, B., Zhang, S., Li, X., Liu, D., Song, K., et al. (2006). Changes of land use and of ecosystem service values in Sanjiang Plain, Northeast China. Environ. Monit. Assess. 112 (1–3), 69–91. doi:10.1007/s10661-006-0312-5
Woldesemayat, E. M., and Genovese, P. V. (2021). Monitoring urban expansion and urban green spaces change in addis ababa: directional and zonal analysis integrated with landscape expansion index. Forests 12 (4), 389–419. doi:10.3390/f12040389
Wu, Y., Tao, Y., Yang, G., Ou, W., Pueppke, S., Sun, X., et al. (2019). Impact of land use change on multiple ecosystem services in the rapidly urbanizing Kunshan City of China: past trajectories and future projections. Land Use Policy 85, 419–427. doi:10.1016/j.landusepol.2019.04.022
Zewdie, M., Worku, H., and Bantider, A. (2018). Temporal dynamics of the driving factors of urban landscape change of addis ababa during the past three decades. Environ. Manag. 61, 132–146. doi:10.1007/s00267-017-0953-x
Keywords: urban expansion, land use change, ecosystem services, drivers, Addis Ababa
Citation: Hailu T, Assefa E and Zeleke T (2024) Urban expansion induced land use changes and its effect on ecosystem services in Addis Ababa, Ethiopia. Front. Environ. Sci. 12:1454556. doi: 10.3389/fenvs.2024.1454556
Received: 25 June 2024; Accepted: 05 November 2024;
Published: 18 November 2024.
Edited by:
Christopher Lant, Utah State University, United StatesReviewed by:
Shanzhong Qi, Shandong Normal University, ChinaSalahuddin M. Jaber, Hashemite University, Jordan
Copyright © 2024 Hailu, Assefa and Zeleke. This is an open-access article distributed under the terms of the Creative Commons Attribution License (CC BY). The use, distribution or reproduction in other forums is permitted, provided the original author(s) and the copyright owner(s) are credited and that the original publication in this journal is cited, in accordance with accepted academic practice. No use, distribution or reproduction is permitted which does not comply with these terms.
*Correspondence: Tadesse Hailu, dGFkZXNzZS5oYWlsdUBhYXUuZWR1LmV0
 Tadesse Hailu
 Engdawork Assefa