 Yongshuai Sun1
 Shuigen Ye
- 1College of Water Resources and Civil Engineering, China Agricultural University, Beijing, China
- 2College of Earth Science and Surveying Engineering, China University of Mining and Technology (Beijing), Beijing, China
Water resource carrying capacity is a critical measure of the ability of water resources within a region to support social, ecological, and economic scales. This study establishes an evaluation index system for the water resource carrying capacity of Golmud City and calculates the weights of the indices using the Analytic Hierarchy Process (AHP). Based on an analysis of the current status of Golmud’s socio-economic development, agriculture, and water resource utilization, a simulation model based on system dynamics is constructed. By setting 162 different scenario plans and normalizing the simulation results, the development trend of Golmud City’s water resource carrying capacity is studied, and an evaluation is made for the sustainable development of water resources in Golmud City. Using data from 2001 to 2018 as the basic data, a carrying capacity analysis of water resources for the future from 2019 to 2030 is conducted. The study reveals that continuing the current development pattern will lead to unsustainable water resource carrying capacity. Among the scenarios aimed at coordinated development in all aspects, the best water resource carrying index is achieved, reaching 0.698 by 2030. By analyzing the development trend of the water resource carrying capacity index, existing problems in the utilization of water resources in Golmud City are identified, and feasible strategies for the sustainable use of water resources in Golmud City are proposed.
1 Introduction
In recent years, the huge demand for water resources caused by human activities has led to severe water shortage, water environment pollution, and water ecology deterioration in some areas, which has seriously endangered the living environment of human beings (Zhang W. et al., 2023b). The ecosystems of northwestern China are extremely fragile due to the severe lack of water resources. Water resources are not only basic natural resources but also strategic economic resources and ecological control factors. These factors have become important control factors limiting global economic and social development in the 21st century (Wang et al., 2022b; Wang Y. M. et al., 2023). At present, most scholars believe that the carrying capacity of water resources represents the maximum capacity of water resources to support and guarantee the sustainable development of the regional economy and society (Liu Q. F. et al., 2023). Water resource carrying capacity can be determined by the social, economic, resource, and environmental factors (Zhang X. Y. et al., 2023). The research methods of water resources carrying capacity can be roughly divided into three categories. The first is the empirical formula method, which is mainly used to estimate the carrying capacity of regional water resources through analogical analysis (Liu et al., 2007), trend analysis (An and Wu, 2019; Ouassanouan et al., 2022), quota analysis (Shi et al., 2021), etc., combined with the long-term accumulated professional knowledge and experience of researchers (Gao and Li, 2009; Jing et al., 2016; Zhang et al., 2021). The second is the indicator system analysis method, which mainly concludes the principal component analysis (Liu L. et al., 2022; Zhang L. X. et al., 2023a), fuzzy comprehensive evaluation method (Ge et al., 2021; Jia et al., 2023), projection tracing method (Wang, 2016), etc. This kind of analysis method combines the application of mathematical theories and takes into full consideration the influencing factors of water resources carrying capacity. The third type is the system analysis method, through the multi-objective decision-making analysis (Sucu et al., 2021; Yue et al., 2023), system dynamics (Lin and Wang, 2021; Ji et al., 2022; Chen X. et al., 2023; Chen W. J. et al., 2023) and “pressure-state-response” model (Ding et al., 2022; Li F. G. et al., 2023) etc., a complex system is established, and then use different methods to analyze the water resources carrying capacity, to analyze the carrying capacity of water resources dynamically, holistically and quantitatively (Xia et al., 2023). Numerous scholars have employed the method of system dynamics in their research. Liu et al. (2020) taking Guangzhou city as an example, used the principles of system dynamics to establish an environmental assessment model for construction waste, and used Vensim software to simulate and analyze the environmental, economic, and social impacts of various disposal methods of construction waste. Xiao et al. (2020) used a system dynamics model to simulate the entire process of urban domestic waste generation, classification, collection, and final treatment, setting up seven scenarios to simulate the impact of these policies. The results showed that economic policies have a significant influence on future urban domestic waste management. Liu et al. (2021) selected the Tarim River Basin in China, and by integrating its geographical environment and the characteristics of water supply and demand, constructed a system dynamics model to quantitatively assess and predict the historical conditions and future trends of water resource carrying capacity in the Tarim River Basin. After simulating the water-food-energy system dynamics model, Keyhanpour et al. (2021) formulated water resource sustainability policy plans, taking into account the results of sensitivity analysis. The forms included four strategies: water demand management, water supply management, food resource management, and energy demand management, as well as a combination of policies. The simulation results of the proposed solutions were selected, with the combination of water demand and food resource management strategies being identified as the best policy. In addition to considering the research methodology, there is also a certain distinction between the contents of water resources research. Some scholars focus on the evaluation of water resources carrying capacity (Jiang and Zhang, 2023a; Yuan et al., 2023; Zhang X. Y. et al., 2023), study the spatio-temporal changes of water resources carrying capacity (Liu J. X. et al., 2023; Wang Y. F. et al., 2023), study the future change trend of water resources through scenario simulation (Liu L. et al., 2022; Liu et al., 2022b; Li W. et al., 2023; Xie et al., 2022), analyze the influencing factors of water resources carrying capacity (Anfuding et al., 2023; Yang et al., 2020), and combine the research of water resources carrying capacity with that of other industries (Qin et al., 2023; Yu et al., 2021; Zeng X. T. et al., 2016). It can be reflected that the research on the carrying capacity of water resources is also multifaceted.
Sustainable development is defined in “Our Common Future” as “development that meets the needs of the present without compromising the ability of future generations to meet their own needs” (Li Y. H. et al., 2023). While highlighting the importance of water resources, new computational models are designed for water resource management and sustainable use (Zeng et al., 2015). Sustainable development is of great significance for continuous economic growth and development, as well as for the proper management of the environment (Wang X. et al., 2023). The basic idea of sustainable water resource use is to balance the adverse environmental side effects caused by development with the anticipated social benefits, and to formulate a sustainable plan that integrates socio-economic development and ecological and environmental protection (Jiang et al., 2023b; Zeng X. T. et al., 2016). Scholars use the theory of water supply and demand balance to analyze the sustainable use of water resources in the region (Liu N. et al., 2022; Ahati et al., 2023; Qi et al., 2023). Wei, et al. (2022) used the empirical formula method and the indicator analysis method to evaluate the carrying capacity of water resources in Ningbo. Zhou and Qiu, (2022) evaluated the sustainability of water resources utilization in Shanghai based on the ecological footprint theory. Li, et al. (2022) combined the energy-value theory with the water ecological footprint, constructed the energy-value water ecological footprint model and the energy-value water ecological carrying capacity model for evaluating the sustainable use of resources and comprehensively analyzed the water ecological footprint and water ecological carrying capacity of Henan Province. In addition, many scholars have placed their research focus on the sustainable utilization of water resources in the relatively arid areas of Northwest China (Yin et al., 2021; Ruan and Wu, 2022). Quantifying and accurately evaluating water use for agricultural production is important for realizing the balance between the supply and demand of water resources and sustainable utilization, especially in arid areas (De Melo Branco et al., 2005; Wang et al., 2022a). Zhuang et al. (2015) focused their research on the perspective of water resources planning and decision-making, introducing random and interval parameters in the constraints and objective functions of the model within the method of inexact joint probability programming. This enhanced the assessment and control of system risk and was applied in a case study of multi-reservoir water resources allocation, demonstrating its potential in optimizing water resource management.
This article focuses on the water resources of Golmud City, and by constructing an evaluation index system for the water resource carrying capacity of the Golmud Oasis area and building a system dynamics-based model, it simulates the dynamic changes between water resources and agriculture, population, ecosystem, and economy in the Golmud Oasis area. Different scenarios are derived by assigning values to decision variables according to various practical purposes. The water resource carrying capacity model is run to predict the simulation results of different scenarios, and an evaluation is made on the sustainable development of water resources in Golmud City.
2 Overview of the study area
Golmud City, established in November 1960, is located in the western part of Qinghai Province on the south-central edge of the Qaidam Basin (Figure 1). It falls under the jurisdiction of the Haixi Mongol and Tibetan Autonomous Prefecture in Qinghai Province. The city’s jurisdiction comprises two non-contiguous regions: the Qaidam Basin area, which is the main part, and the Tanggula Mountain area to the south. The Tanggula Mountain area borders the Tibet Autonomous Region to the south and southwest and is adjacent to Yushu Tibetan Autonomous Prefecture to the east and north. Golmud City covers a total area of 118,954.18 km2. In 2018, the city’s total population was 247,800, and its GDP was 41.297 billion yuan.
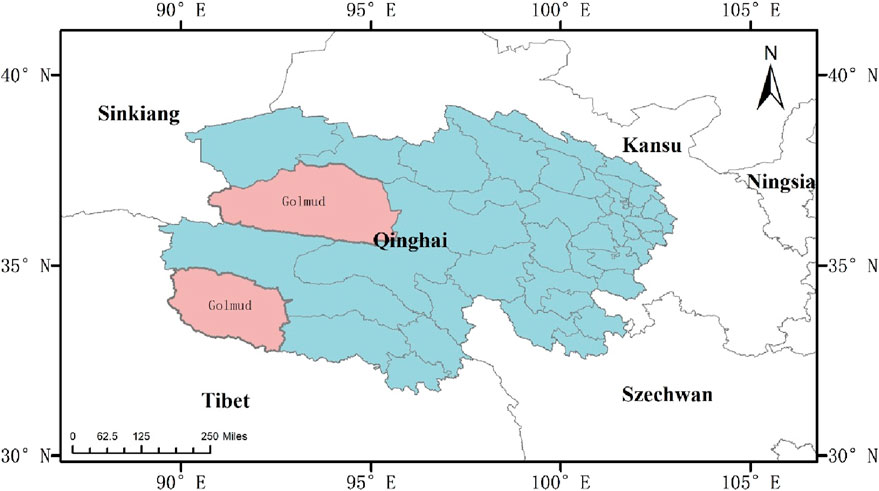
Figure 1. Schematic diagram of the location of the research area.
Golmud City’s total water resources amount to 984.04 million m³. In 2018, the available water resources included groundwater, surface water, and reclaimed water. The city’s water demand encompasses domestic water consumption for urban and rural residents, industrial water consumption, agricultural irrigation, urban greening, and environmental needs. In 2018, Golmud City’s total water consumption was 425.9 million m³, with agricultural irrigation and urban greening using 158.2 million m³ (37.15% of the total), industrial use at 160.4 million m³ (37.66%), and domestic use for urban and rural residents at 107.3 million m³ (25.19%). Analyzing the relevant data, the relationship between water resources and population in the study area is mediated through complex economic relationships. Social development aims to meet the evolving material and spiritual needs of humans, meaning the relationship between population and water resources ultimately changes with increases in population and per capita consumption levels, reflecting the interconnections among population, economy, and water resources.
3 Data sources and research methods
3.1 Data sources
The data used in this study were mainly obtained from, “Golmud Yearbook” (2001-2016), “Haixi State Statistical Yearbook” (2004–2014), “Golmud National Economic and Social Development” (2017), “Golmud River Basin Comprehensive Water Resources Planning” (2002), “Hydrological Yearbook of the People’s Republic of China, Volume 10, Volume 4. Inland Rivers and Lakes of Qinghai Province (2001–2019), and Evaluation of Groundwater System and Groundwater Resources in the Pre-Mountain Plain Area of the Golmud River Basin, Qinghai Province (2013).
3.2 Analysis hierarchical process (AHP)
Based on the analysis of Golmud City’s water resource utilization and socio-economic conditions, the indicators selected to assess the city’s current state of sustainable water resource development should reflect conditions related to water resources, sewage, population, economy, and society. These indicators should be quantifiable. The goal of water resource carrying capacity is used to divide the subsystems. These subsystems include the water resource subsystem, agricultural subsystem, population subsystem, ecological subsystem, and economic subsystem. Each subsystem corresponds to specific indicators, forming a three-tier hierarchical structure comprising the overall goal level, system level, and indicator level. The Analytic Hierarchy Process (AHP) is employed to assign weights to each indicator within the water resource carrying capacity evaluation index system, which is shown in Table 1.
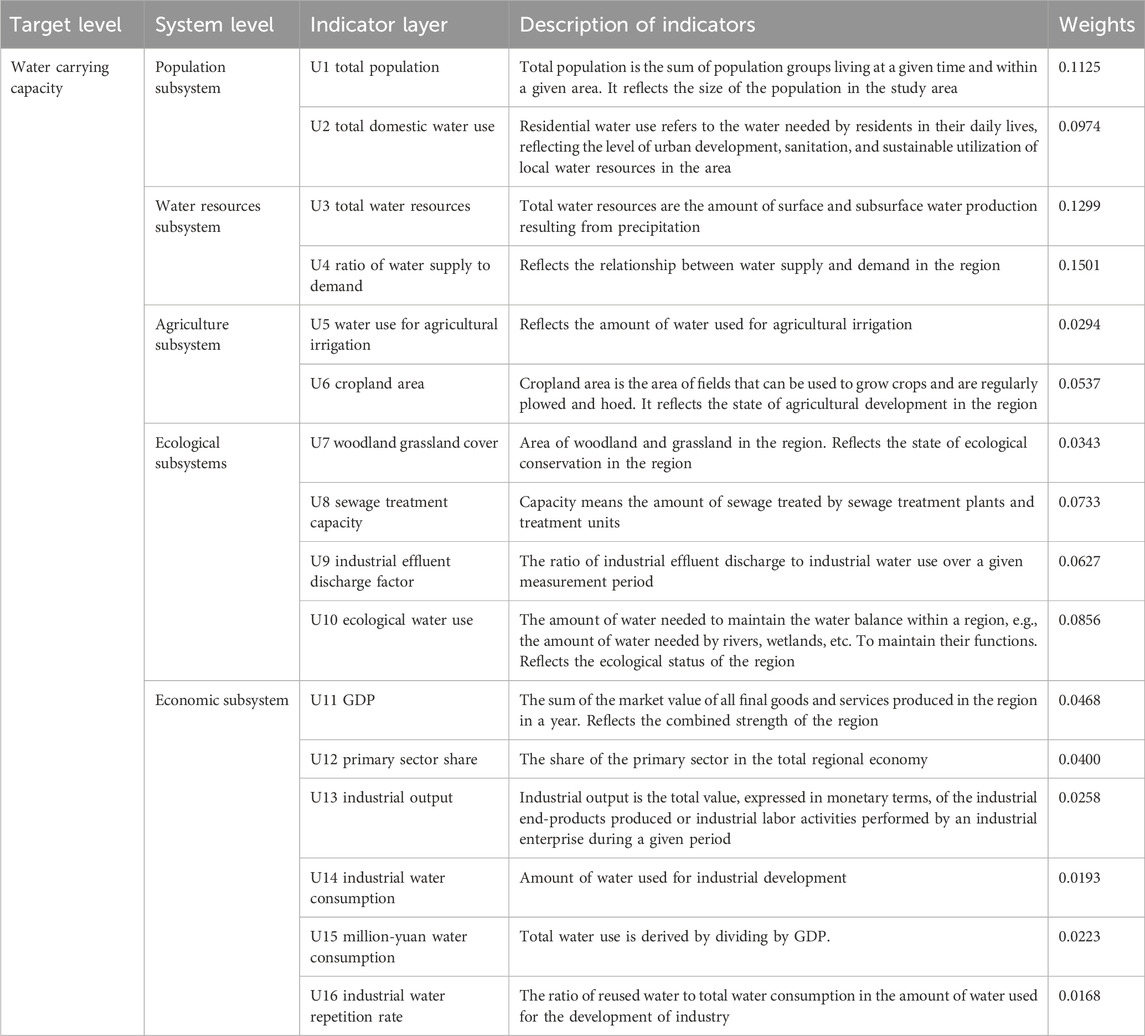
Table 1. Selection of evaluation indicators and their important parameters of Golmud water resource carrying capacity.
Determine the subordination between the elements of the model. The assignment of the importance of the indicators at the system level (second level) of the model should be decided and endorsed through discussion according to the requirements of the decision-making objectives. According to the scale of 1–9 pairwise comparison, the pairwise comparison judgment matrix is constructed and assigned. N sub-elements
where the value
Next, the square root method is performed to calculate the maximum eigenvalue of the judgment matrix
where
Finally, the consistency test is performed and consistency Index (C.I.) Equation 4 of the judgment matrix A is.
Consistency Ratio (C.R.), Equation 5 a consistency evaluation metric that
In finalizing the evaluation index system for water resource carrying capacity, the water resource subsystem holds a significant position in Golmud City’s evaluation index system, with a weight of 0.2800. Golmud City places great emphasis on water management and the development of key water conservancy projects, achieving significant results. However, there remains a considerable gap in terms of long-term planning. Within the water resource subsystem, the most critical indicator is the water supply-demand ratio (weight of 0.1501), the highest-weighted indicator in the entire system. It directly reflects whether there is a shortage between the supply and demand of water resources in the region. In the population subsystem (weight of 0.2100), we selected indicators closely related to people’s lives, ensuring that while other subsystems achieve sustainable development, the wellbeing of the population is prioritized. In the economic subsystem (weight of 0.1710), the most important indicator is GDP. Improving water use efficiency, protecting the environment, and ensuring coordinated social and economic development must happen simultaneously. In the agricultural subsystem, we focused on agricultural irrigation water consumption, promoting water-saving agriculture and improving water resource utilization efficiency. In the ecological subsystem, we considered indicators such as forest and grassland coverage and sewage treatment volume. It is essential to not only focus on social and economic development but also on preserving the ecological environment on which we depend.
3.3 Modeling the dynamics of water carrying capacity systems
In this study, the administrative boundary of Golmud City was used as the system boundary of the model, and in the process of building the system dynamics model of water resources carrying capacity in Golmud City, some processes were simplified and generalized due to the limitation of the data shortage and the complexity of the system relationship. The data were selected from 2001 to 2018, and the relevant indicators and constructed systems were selected from economic, demographic, agricultural, ecological, and water resource aspects. The modeling time is divided into two phases, the first phase is from 2001 to 2018 (modeling and validation phase), and the second phase is from 2019 to 2030 (forecasting phase), with 2018 and 2030 being the two-time nodes focusing on the analysis, and the simulation interval (Time step) is set at 1 year. According to system dynamics, the dynamic structure and feedback mechanism within the system determine the behavioral patterns and characteristics of the system. After determining the hierarchical structure of each subsystem, the dynamic flow diagram of the water resources carrying capacity system is established by combining the structural characteristics of the water resources carrying capacity itself. Figure 2 shows the system.
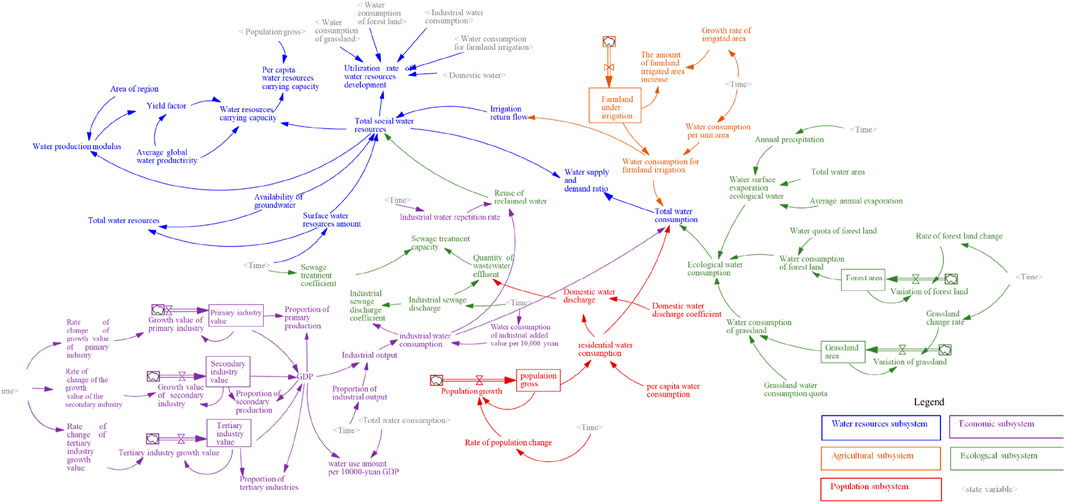
Figure 2. System flow chart.
3.3.1 Model variables and model validity test
The entire system variables contain 7 state variables, 7 rate variables, 41 auxiliary variables, and 11 constants. The description of each variable is shown in Table 2. The main interrelationships between the variables were obtained using the function list function in the equation editor provided by Vensim-ple. Finally, the model parameters are estimated, and this study took the values of each parameter of the model based on the Golmud City Statistical Yearbook and Haixi State Statistical Yearbook from 2001 to 2018. The initial values which are shown in Table 3 of the state variables were directly assigned using the direct determination method, Table 4 shows the values of constant parameter values, and he table function method was used to express the functional relationship between the two groups of variables by inputting them in the form of tables in the Vensim-Ple software. The results are shown in Table 5. The elements for building a system dynamics model are mainly divided into two categories: variable elements and associated elements. Variable elements generally include product (state variables), rate variables (decision variables), constants and auxiliary variables, etc. Product and rate variables they are the two main quantities that make up the feedback loop in the system structure; and the related elements mainly include material chains and information chains.
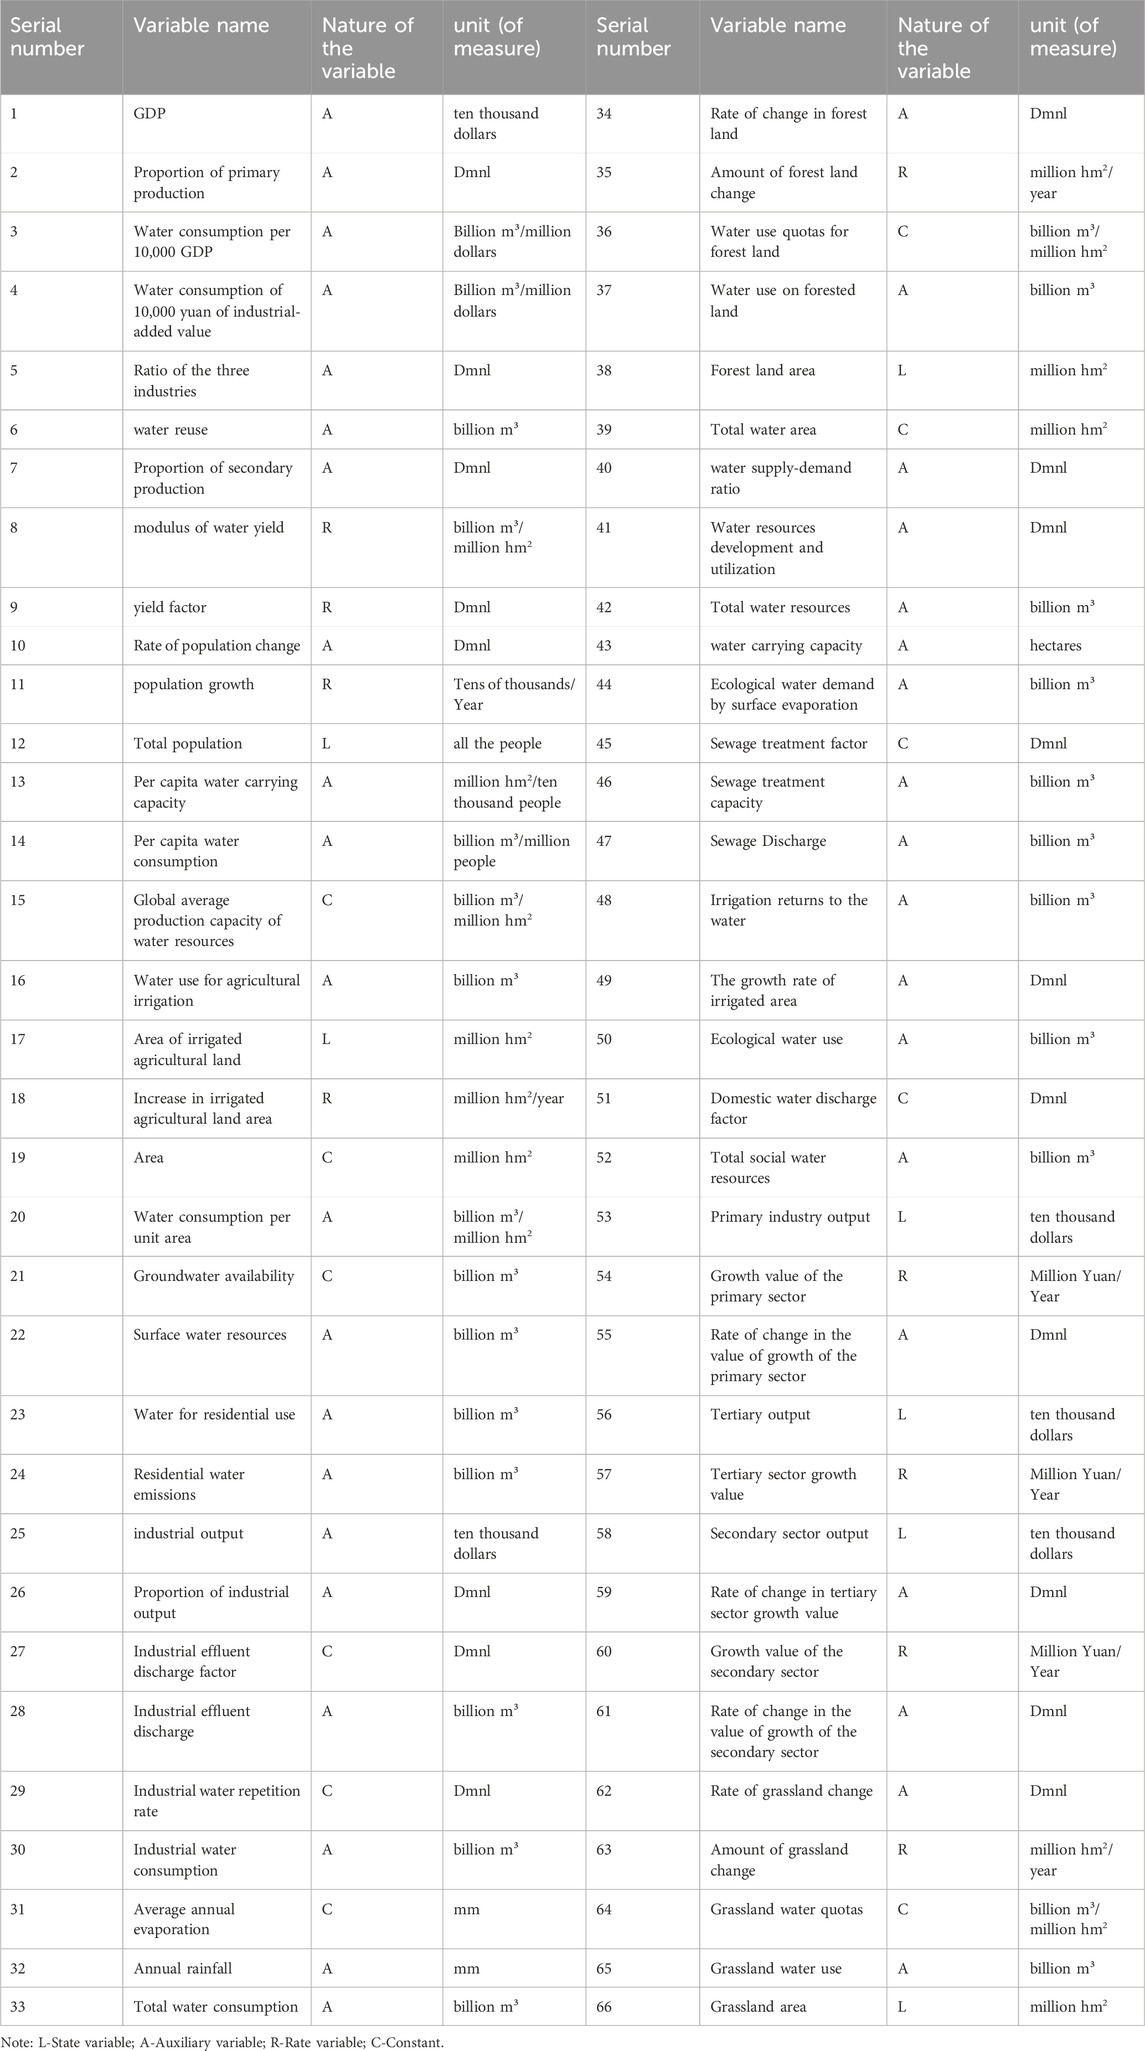
Table 2. Variable description table.
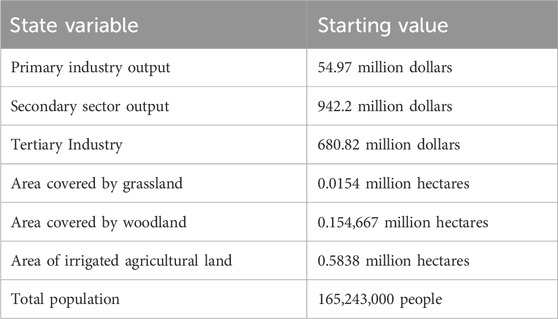
Table 3. Initial value of the state variable.
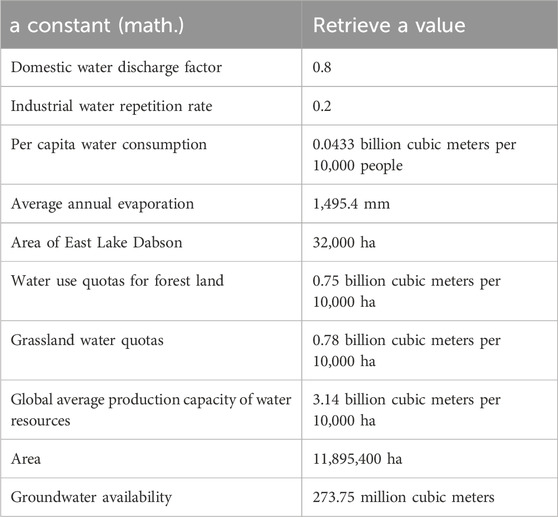
Table 4. Constant parameter.
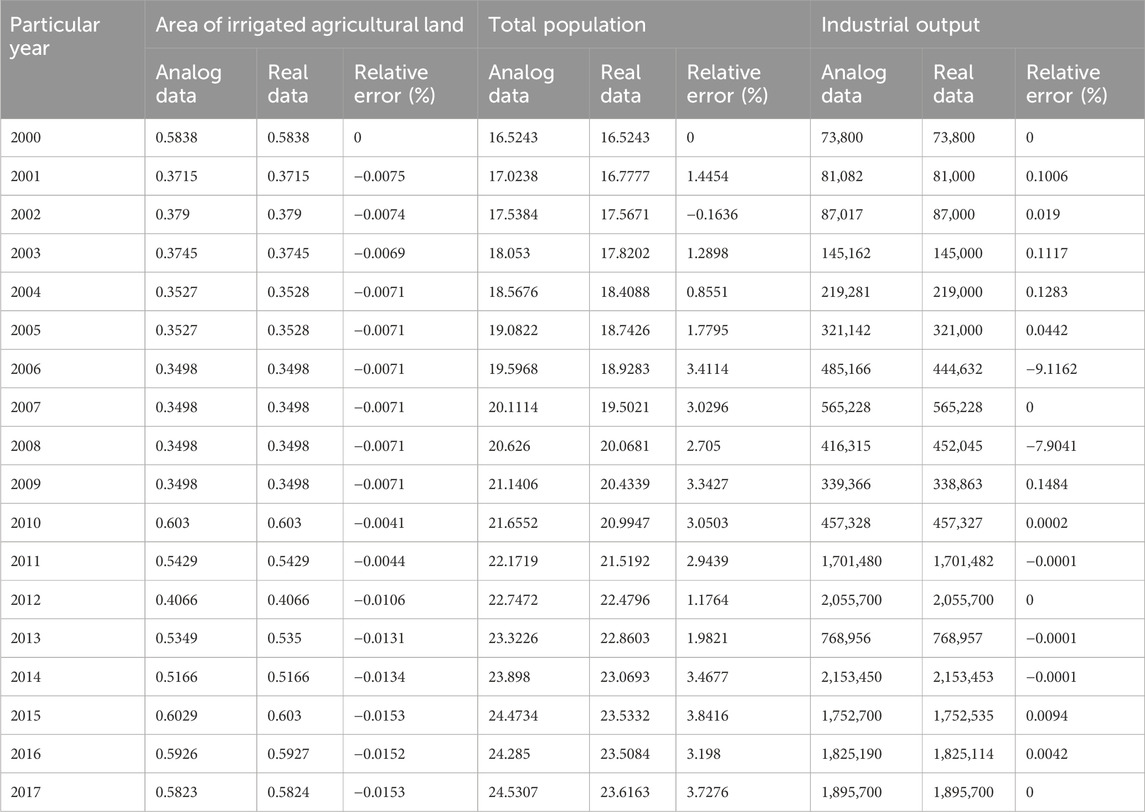
Table 5. Test results of main indicators of the system.
3.3.2 Model validity test
3.3.2.1 Historical test
Given the numerous variables in the model, this study selected four representative variables: farmland irrigation area, industrial output value, secondary industry output value, and total population, to compare their simulated results with the actual values. After testing, the relative error between the simulated value and the actual value from 2000 to 2017 is less than 10%, indicating that the model conforms to the actual situation (Liu et al., 2018; Li et al., 2021; Wang et al., 2021). The irrigated area of farmland and industrial output value are taken as examples to show the results of simulated values and actual values.
3.3.2.2 Sensitivity test
A robust system dynamics model requires that changes in parameters or structure result in minimal changes to the simulation values, indicating low sensitivity. The testing method involves incrementally increasing each parameter by 10% annually from 2019 to 2030 and calculating the sensitivity values based on the formula. This study selected the total social water resources, total population, and total water consumption within the model to test the sensitivity of 11 parameters, thereby reflecting the robustness of the system model.
State variable sensitivity value equation is shown in Equation 6:
Parameter average sensitivity formula is shown in Equation 7:
where;
From the Figure 3, we can visualize that among the above 11 parameters, there are 7 with sensitivity between 0 and 0.05, 3 between 0.05 and 0.10, and 1 over 0.10. Most of the sensitivity values are <0.1, and only the sensitivity value of per capita water consumption is >0.1, and the model passes the sensitivity test. Most of the sensitivity values were <0.1, only the sensitivity value of per capita water consumption was >0.1, and the model passed the sensitivity test. That is, the system dynamics model can be applied to the simulation of water resources carrying capacity in Golmud City.
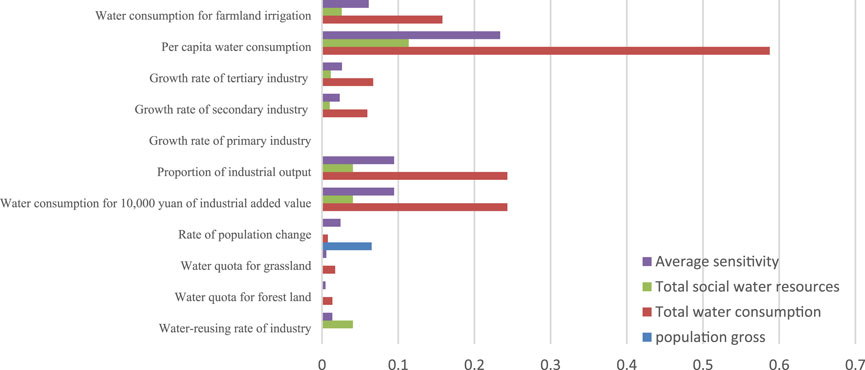
Figure 3. Direct view of sensitivity analysis results.
3.4 Scenario modeling of water resources carrying capacity
3.4.1 Scenario setting
Based on the model’s operation results under the current development mode, schemes were formulated from the perspectives of prioritizing socio-economic and agricultural development, ecological environmental protection, and comprehensive coordinated development. In setting scenarios, decision variables such as population growth rate, irrigation area growth rate, secondary industry annual growth rate, water use per unit irrigation area, and industrial water reuse rate were selected. The population growth rate was set at 1%, 2.5%, and 5%, with the current rate being 1%. The irrigation area growth rate was set at 1%, 2.5%, and 5%, with the current rate at 2.5%. The industrial water reuse rate was set to increase annually by 0% and 6%. The secondary industry annual growth rate was set at 4.25%, 6.25%, and 8.25%, with the current rate at 6.25%. The water uses per unit irrigation area in 2030 was set to decrease to 1, 1.25, and 1.5 billion cubic meters per ten thousand hectares (hm2), with the current rate expected to decrease to 1.5 billion cubic meters per ten thousand hectares by 2030. These settings were combined to generate 162 scenarios, which were then sequentially simulated using Vensim-Ple software. In this study, all data in the evaluation index system were normalized to a range of 0–1. Ultimately, 162 future predictions of water resource carrying capacity were obtained.
The indicators in the evaluation index system can be categorized into three main types: development indicators, restriction indicators, and coordination indicators. The development indicators are those that are beneficial to the development of water resources carrying capacity or socio-economic development, and the larger the value of the development indicators, the higher the water resources carrying capacity, such as the amount of available water resources and GDP, etc. The restriction indicators are those that are not conducive to the development of water resources carrying capacity, and after normalizing the data of all the indicators, the scores of all the indicators will be weighted and summed up, and according to the status of the water resources carrying capacity, the water resources carrying capacity index is classified into five categories, as shown in Table 6.

Table 6. Classification of water resources bearing status.
3.4.2 Comprehensive evaluation of different scenarios
Among the 162 different scenarios, five development scenarios were selected for comparison: status quo trend, green water-saving, socio-economic, agricultural development, and coordinated development. The overall development trends of the water resource carrying capacity index for Golmud City under these five scenarios are shown in Figure 4.
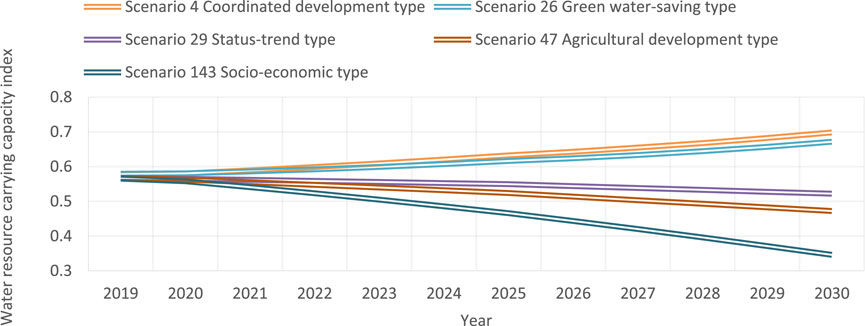
Figure 4. Changes in water resource carrying capacity index under different scenarios.
3.4.2.1 Status-trend type
Using 2018 as the base year, the status quo trend scenario (Scenario 29: population growth rate of 1%, irrigation area growth rate of 2.50%, secondary industry annual growth rate of 6.25%, water use per unit area of 1.5, and industrial water reuse rate of 0%) sets the parameters for 2019 to 2030 as follows: population growth rate at 1%, irrigation area growth rate at 2.5%, secondary industry annual growth rate at 6.25%, industrial water reuse rate at 20%, and water use per unit irrigation area decreasing to 1.5 billion cubic meters per ten thousand hectares (hm2) by 2030. Under the status quo trend scenario, the water resource carrying capacity index gradually decreases, reaching 0.52 by 2030. This indicates that the current socio-economic-agricultural-ecological development model of Golmud City is not aligned with sustainable development.
3.4.2.2 Green water-saving type
The green water-saving scenario (Scenario 26: population growth rate of 1%, irrigation area growth rate of 2.50%, secondary industry annual growth rate of 6.25%, water use per unit area of 1, and industrial water reuse rate of 6%) aims to improve the ecological environment and conserve water. This scenario appropriately reduces the water quota per unit of irrigation area, with the quota gradually decreasing to 10,000 m³/hm2 by 2030 and increases the industrial water reuse rate by 6% annually. Other parameters remain the same as in the status quo trend scenario. Under the green water-saving scenario, the water resource carrying capacity index gradually increases, reaching 0.67 by 2030.
3.4.2.3 Socio-economic type
The socio-economic scenario (Scenario 143: population growth rate of 5%, irrigation area growth rate of 2.50%, secondary industry annual growth rate of 8.25%, water use per unit area of 1.5, and industrial water reuse rate of 0%) aims to develop the secondary industry without considering constraints from resources and the environment, thereby achieving high levels of economic development in terms of GDP and population growth.
3.4.2.4 Agricultural development type
The agricultural development scenario (Scenario 47: population growth rate of 1%, irrigation area growth rate of 5%, secondary industry annual growth rate of 6.25%, water use per unit area of 1.5, and industrial water reuse rate of 0%) aims to develop agriculture without considering environmental constraints, thereby achieving high levels of agricultural development. The farmland irrigation area growth rate is set at 5%, while other indicators remain the same as in the status quo trend scenario. Under the agricultural development scenario, the water resource carrying capacity index decreases gradually, reaching 0.47 by 2030.
3.4.2.5 Coordinated development type
The coordinated development approach (Scenario 4: population growth rate 1%, irrigation area growth rate 1%, annual growth rate of secondary industry 4.25%, water use per unit area 1.25, industrial water reuse rate 6%) integrates the current trend type with the green water-saving type, socio-economic type, and agricultural development type. It comprehensively adjusts the parameters of the first four scenarios while balancing environmental protection and sustainable economic development. The growth rate of agricultural irrigation area is reduced to 1%, and the annual growth rate of secondary industry is reduced to 4.25%. By 2030, the water use per unit irrigation area is reduced to 1.25 million m³/hm2. The water resources carrying capacity index gradually increases, reaching 0.698 by 2030.
According to the development trend diagram, by 2030, the water resources carrying capacity index shows distinct patterns across different types of development strategies. The coordinated development type exhibits the highest index, indicating robust sustainability. Conversely, the socio-economic type, agricultural development type, and current trend type all display declining indices annually, contradicting sustainable development requirements. Both the coordinated development and green water-saving types show increasing indices annually, aligning with sustainable development goals. Given that the coordinated development type involves adjustments in social and economic paradigms, and boasts a slightly higher water resources carrying capacity index compared to the green water-saving type, along with the largest ratio of water resources supply and demand, it suggests that the coordinated development approach is more suitable for the sustainable socio-economic development and water resource utilization in Golmud city.
4 Conclusion
Based on the principle of water resources supply-demand balance, a comprehensive study analyzed the water carrying capacity of Golmud city. Using Vensim-Ple software, widely utilized in water resources carrying capacity analysis, a system dynamics model was constructed to dynamically simulate 162 scenarios encompassing water supply-demand dynamics, pollution levels, and economic development in Golmud city. The simulation results underwent normalization to derive a Water Resources Carrying Capacity Index, which serves as a measure of the city’s water resources sustainability. Analysis of the index trends revealed the following conclusions:
(1) According to different development objectives, five scenarios were selected from 162 scenarios for detailed analysis. The findings indicate that continuing the current development pattern will lead to unsustainable water resources carrying capacity. In the scenario focusing on economic development, although economic growth reaches its peak, water demand, sewage discharge, and industrial water usage all increase significantly and abruptly. Consequently, the Water Resources Carrying Capacity Index declines rapidly to 0.35 by 2030. In the agricultural development scenario, despite advancements in agriculture, the Water Resources Carrying Capacity Index decreases annually to 0.47 by 2030. The scenario emphasizing water conservation and environmental protection shows considerable improvements in water carrying capacity, although economic parameters remain unchanged. The scenario advocating for coordinated development across all sectors exhibits the highest Water Resources Carrying Capacity Index, achieving 0.698 by 2030. This comprehensive scenario analysis underscores the critical importance of balanced development strategies for achieving sustainable water resource management.
(2) The study calculates Golmud City’s water resources carrying capacity and suggests that adhering to the current development model will lead to a decrease in this capacity, indicating the city’s water resources would become unsustainable. The evolution of Golmud City’s water resources carrying capacity model and scenario predictions reveal the following: In the scenario emphasizing economic development, optimal economic growth is achieved, but the water resources carrying capacity index declines rapidly. In the agricultural development scenario, agriculture sees significant growth; however, the water resources carrying capacity index diminishes annually. In the scenario focusing on water conservation and environmental protection, there is notable improvement in water resources carrying capacity, albeit with a slow increase in the water resources carrying capacity index. However, this scenario lacks adjustments to economic-related parameters, making the water resources carrying capacity unsustainable. In the scenario of coordinated development across all sectors, the water resources carrying capacity index shows the most robust development.
5 Discussion
Based on the theories of water resources carrying capacity and system dynamics, this study analyzes and predicts the water resources carrying capacity of Golmud city. The research involves extensive and complex data, presenting challenges in organizing and processing variable parameters due to inherent uncertainties. Further issues to explore are as follows:
(1) Simplification of the Model: The system dynamics model of water resources carrying capacity encompasses numerous factors. Simplification involves retaining essential influencing factors while unavoidably oversimplifying relationships between variables. For instance, issues arise in simplifying the impact of water price changes on water resources carrying capacity or the influence of socio-economic changes on climate variability.
(2) Model Parameter Issues: Influenced by regional factors where Golmud is situated, some data are difficult to gather over long periods, leading to incomplete data sequences. Moreover, discrepancies exist in the same parameter across different statistical sources, complicating precise and objective estimation of missing data parameters. This increases uncertainty in the system dynamics model.
(3) Interdisciplinary Boundaries: Analysis of water resources carrying capacity spans multiple disciplines. There is a need to explore breaking disciplinary boundaries from a macro-comprehensive perspective, leveraging advanced methods and technologies to achieve scientifically robust research outcomes.
Data availability statement
The original contributions presented in the study are included in the article/supplementary material, further inquiries can be directed to the corresponding author.
Author contributions
YS: Data curation, Formal Analysis, Funding acquisition, Project administration, Resources, Validation, Visualization, Writing–original draft. YW: Data curation, Investigation, Methodology, Project administration, Software, Validation, Writing–original draft, Writing–review and editing. WZ: Data curation, Formal Analysis, Investigation, Methodology, Project administration, Software, Writing–original draft, Writing–review and editing. SY: Conceptualization, Formal Analysis, Investigation, Project administration, Resources, Validation, Visualization, Writing–review and editing.
Funding
The author(s) declare that financial support was received for the research, authorship, and/or publication of this article. The research leading to these results received funding from National Natural Science Foundation of China under Grant Agreement No. 42107164.
Conflict of interest
The authors declare that the research was conducted in the absence of any commercial or financial relationships that could be construed as a potential conflict of interest.
Publisher’s note
All claims expressed in this article are solely those of the authors and do not necessarily represent those of their affiliated organizations, or those of the publisher, the editors and the reviewers. Any product that may be evaluated in this article, or claim that may be made by its manufacturer, is not guaranteed or endorsed by the publisher.
References
Ahati, K., Zeng, Y. J., and Liu, D. D. (2023). Analysis method of water supply and demand balance in arid region: a case study of Yizhou District, Hami City, Xinjiang. China Rural Water Resour. Hydropower (06), 21–26.
An, D., and Wu, B. G. (2019). Application of trend analysis in water resources supervision system of Tarim River. People’s Yellow River 12, 50–54. doi:10.3969/j.issn.1000-1379.2019.12.012
Anfuding, G., Yang, G., Tian, L., Pan, Y., Zhou, H., Xu, X., et al. (2023). Analysis of water resource carrying capacity and obstacle factors based on GRA-TOPSIS evaluation method in Manas River Basin. Water 15 (2), 236. doi:10.3390/w15020236
Chen, W. J., Yao, R. Y., Shi, W. H., Li, Q., Zhao, J. Y., and Zhang, Y. G. (2023b). Simulation and analysis of water resources carrying capacity in Tianjin based on system dynamics model. J. Water Resour. Water Eng. (02), 42–51.
Chen, X., Qin, X., and Cai, J. (2023a). Research on the urban water resources carrying capacity by using system dynamics simulation. Hydrology Res. 54 (3), 418–434. doi:10.2166/nh.2023.101
De Melo Branco, A., Suassuna, J., and Vainsencher, S. A. (2005). Improving access to water resources through rainwater harvesting as A mitigation measure: the case of the Brazilian semi-arid region. Mitig. Adapt. Strategies Glob. Change 10 (3), 393–409. doi:10.1007/s11027-005-0053-8
Ding, W. L., Xia, J., Yao, C. H., Li, M., Zhang, Y. F., Diao, Y. X., et al. (2022). Evaluation of water ecological carrying capacity in Dean County based on pressure-state-response and TOPSIS model. J. Wuhan Univ. Eng. 55 (11), 1081–1089. doi:10.14188/j.1671-8844.2022-11-001
Gao, X. T., and Li, S. J. (2009). Research on hydrological time series prediction based on empirical mode decomposition. Hydrology 29 (03), 66–68. doi:10.3969/j.issn.1000-0852.2009.03.016
Ge, Y., Wu, J., Zhang, D., Jia, R., and Yang, H. (2021). Uncertain analysis of fuzzy evaluation model for water resources carrying capacity: a case study in Zanhuang County, North China Plain. Water 13 (20), 2804. doi:10.3390/w13202804
Ji, J., Qu, X., Zhang, Q., and Tao, J. (2022). Predictive analysis of water resource carrying capacity based on system dynamics and improved fuzzy comprehensive evaluation method in Henan Province. Environ. Monit. Assess. 194 (7), 500. doi:10.1007/s10661-022-10131-7
Jia, Q., Song, X. Y., Song, S. H., Qin, L., and Liu, H. (2023). Spatio-temporal evolution and coupling coordination of water resources carrying capacity in Guanzhong region. J. Water Resour. Water Eng. 34 (01), 66–74.
Jiang, F., and Zhang, B. Z. (2023a). Analysis and evaluation of water resources carrying capacity of Jiuquan City based on analytic hierarchy Process and coefficient of variation method. Water Sav. Irrig. (09), 94–99.
Jiang, X. M., Zhu, Z. Z., and Cao, Y. Q. (2023b). Current situation and hotspot research of water resources ecological footprint based on bibliographic measurement. J. Cap. Normal Univ. Nat. Sci. Ed. 44 (03), 56–68. doi:10.19789/j.1004-9398.2023.03.009
Jing, S. W., Xia, Y., Ma, X. L., and Zhao, X. X. (2016). Impact of matching between water resources and economic factors on agricultural water use efficiency: an empirical analysis based on Xinjiang. Water Sav. Irrig. (06), 90–93.
Keyhanpour, M. J., Jahromi, S. H. M., and Ebrahimi, H. (2021). System dynamics model of sustainable water resources management using the Nexus Water-Food-Energy approach. Ain Shams Eng. J. 12 (2), 1267–1281. doi:10.1016/j.asej.2020.07.029
Li, F. G., Liu, W., Dong, Z. F., Jia, Z. J., and Li, Q. R. (2023c). Comprehensive evaluation of ecological footprint and sustainable utilization of water resources in Sichuan Province. Environ. Pollut. Prev. control 45 (02), 245–249. doi:10.15985/j.cnki.1001-3865.2023.02.019
Li, Q., Tan, Y., and Liu, P. (2021). Study on comprehensive benefit of energy efficiency renovation of existing public buildings based on SD. Eng. Manag. J. 35 (05), 7–12. doi:10.13991/j.cnki.jem.2021.05.002
Li, W., Jiang, S., Zhao, Y., Li, H., Zhu, Y., Ling, M., et al. (2023b). Comprehensive evaluation and scenario simulation of water resources carrying capacity: a case study in Xiong’an New Area, China. Ecol. Indic. 150, 110253. doi:10.1016/j.ecolind.2023.110253
Li, Y. G., Yuan, Y. L., Li, Z. C., and Guo, X. (2022). Evaluation of sustainable use of water resources in Henan Province based on emergy ecological footprint. People’s Yellow River 44 (06), 100–104.
Li, Y. H., Jiang, X. H., and Zhang, L. (2023a). “Evaluation of water resources conservation and intensive use capacity in the Yellow River Basin,” in The south-north water diversion and water conservancy science and technology (in Chinese and English), 731–741. doi:10.13476/j.cnki.nsbdqk.2023.0071
Lin, Y., and Wang, L. (2021). Comprehensive assessment of urban water resources carrying capacity based on basin unit: a case study of Qingdao, China. Water Supply 22 (2), 1347–1359. doi:10.2166/ws.2021.351
Liu, H., Guan, D., and Zhang, M. (2018). Tress factor sand stress mechanism on subsequent development of ecological security in the three gorges reservoir area. J. Guangxi Normal Univ. Nat. Sci. Ed. 34 (3), 150–158. doi:10.16088/j.issn.1001-6600.2016.03.022
Liu, J., Liu, Y., and Wang, X. (2020). An environmental assessment model of construction and demolition waste based on system dynamics: a case study in Guangzhou. Environ. Sci. Pollut. Res. 27, 37237–37259. doi:10.1007/s11356-019-07107-5
Liu, J. X., Wang, L. Q., Liu, Y., Wang, S. Y., and Chen, K. (2023a). Spatial and temporal characteristics and state of water resources carrying capacity in Gansu Province. Harbin, China: Water Science, Technology and Economics, 1–6.
Liu, L., Lei, Y., Wu, T., and Chen, K. (2022a). Evaluating water resources carrying capacity: the empirical analysis of Hubei Province, China 2008–2020. Ecol. Indic. 144, 109454. doi:10.1016/j.ecolind.2022.109454
Liu, N., Jiang, W., Huang, L., Li, Y., Zhang, C., Xiao, X., et al. (2022c). Evolution of sustainable water resource utilization in Hunan Province, China. Water 14 (16), 2477. doi:10.3390/w14162477
Liu, Q. F., Wang, X. K., Zhu, Q., Song, J. P., Yan, Q. Y., and Zhao, Y. (2023b). Coupling relationship of water resources carrying capacity system in Tibet Autonomous Region based on production-living-ecological function. J. Nat. Resour. 38 (06), 1618–1631. doi:10.31497/zrzyxb.20230615
Liu, W. Y., Shao, D. G., and Tang, M. (2007). Ecological carrying capacity theory and evaluation based on urban water ecosystem health. J. Saf. Environ. (02), 105–108. doi:10.3969/j.issn.1009-6094.2007.02.028
Liu, X., Xu, M., Guo, Y., Duan, W., and Shen, Y. (2021). Research on water resources carrying capacity of Tarim River Basin based on system dynamics model. Arid. Land Geogr. 44 (5), 1407–1416. doi:10.12118/j.issn.1000–6060.2021.05.21
Liu, Y., Gao, C., Ji, X., Zhang, Z., Zhang, Y., Liu, C., et al. (2022b). Simulation of water resources carrying capacity of the Hangbu River Basin based on system dynamics model and TOPSIS method. Front. Environ. Sci. 10. doi:10.3389/fenvs.2022.1045907
Ouassanouan, Y., Fakir, Y., Simonneaux, V., Kharrou, M. H., Bouimouass, H., Najar, I., et al. (2022). Multi-decadal analysis of water resources and agricultural change in a Mediterranean semiarid irrigated piedmont under water scarcity and human interaction. Sci. Total Environ. 834, 155328. doi:10.1016/j.scitotenv.2022.155328
Qi, W. H., Jin, Y. H., Yin, Z. H., and Zhu, W. H. (2023). Analysis of blue-green water resource supply and demand balance in Tumen River Basin based on SWAT model. Acta Ecol. Sin. 43 (08), 3116–3127.
Qin, M. X., Wu, G. Y., and Liu, J. D. (2023). Coupling and coordination analysis of agricultural water resources carrying capacity and cultivated land use benefit in China. J. Nat. Sci. 46 (04), 97–105.
Ruan, Y. J., and Wu, X. Q. (2022). Sustainability assessment of groundwater resources in arid Northwest China based on GRACE and GLDAS. Arid zone Res. 39 (03), 787–800. doi:10.13866/j.azr.2022.03.12
Shi, J., Yun, X., Wei, Q. S., and Zhen, Z. L. (2021). Long-term water resources planning in Taigu Area of Shanxi Province based on quota method. China Water Transp. 21 (02), 102–104.
Sucu, S., Van Schaik, M. O., Esmeli, R., Ouelhadj, D., Holloway, T. G., Williams, J., et al. (2021). A conceptual framework for a multi-criteria decision support tool to select technologies for resource recovery from urban wastewater. J. Environ. Manag. 300, 113608. doi:10.1016/j.jenvman.2021.113608
Wang, C. H. (2016). Analysis of irrigation water impact factors based on projection tracking model. Northeast water Resour. hydropower 34 (08), 59–60. doi:10.14124/j.cnki.dbslsd22-1097.2016.08.025
Wang, G., Xiao, C., Qi, Z., Meng, F., and Liang, X. (2021). Development tendency analysis for the water resource carrying capacity based on system dynamics model and the improved fuzzy comprehensive evaluation method in the Changchun city, China. Ecol. Indic. 122, 107232. doi:10.1016/j.ecolind.2020.107232
Wang, X., Zhang, S., Tang, X., and Gao, C. (2023c). Spatiotemporal heterogeneity and driving mechanisms of water resources carrying capacity for sustainable development of Guangdong Province in China. J. Clean. Prod. 412, 137398. doi:10.1016/j.jclepro.2023.137398
Wang, Y., Chen, Y., Duan, W., and Li, J. (2022a). Evaluation of sustainable water resource use in the Tarim River Basin based on water footprint. Sustainability 14 (17), 10611. doi:10.3390/su141710611
Wang, Y., Cui, X., Zhang, X., and Qi, W. (2022b). Exploring the sustainable use strategy of scarce water resources for rural revitalization in yanchi county from arid region of Northwest China. Int. J. Environ. Res. Public Health 19 (23), 16347. doi:10.3390/ijerph192316347
Wang, Y. F., Wang, J. X., and Li, Y. (2023b). Spatial and temporal evolution pattern of land resource carrying capacity in Shaanxi Province. J. northwest Univ. Nat. Sci. Ed. 53 (4), 541–553. doi:10.16152/j.cnki.xdxbzr.2023-04-005
Wang, Y. M., Ding, J. X., and Sun, Y. Y. (2023a). Research on sustainable water resources utilization in China based on mechanical equilibrium model. people Yangtze River 54 (6), 80–87. doi:10.16232/j.cnki.1001-4179.2023.06.012
Wei, F. F., Zhou, F., and Wang, Y. N. (2022). Evaluation and countermeasures of water resources carrying capacity of Ningbo City. People’s Yellow River 44 (S2), 97–99.
Xia, Z. Q., Wang, K., Peng, D. M., and Zhu, Y. G. (2023). Prediction of sea bearing capacity of Jiaozhou Bay based on system dynamics model. Chin. J. ocean Univ. Nat. Sci. Ed. 53 (6), 123–133. doi:10.16441/j.cnki.hdxb.20220039
Xiao, S., Dong, H., Geng, Y., Tian, X., Liu, C., and Li, H. (2020). Policy impacts on Municipal Solid Waste management in Shanghai: A system dynamics model analysis. J. Clean. Prod. 262, 121366. doi:10.1016/j.jclepro.2020.121366
Xie, M., Zhang, C., Zhang, J., Wang, G., Jin, J., Liu, C., et al. (2022). Projection of future water resources carrying capacity in the huang-huai-hai River Basin under the impacts of climate change and human activities. Water 14 (13), 2006. doi:10.3390/w14132006
Yang, L., Yang, X., Wei, W., and Pan, J. (2020). Spatio-temporal evolution and influencing factors of water resource carrying capacity in Shiyang River Basin: based on the geographical detector method. Water Sci. Technol. Water Supply 20 (4), 1409–1424. doi:10.2166/ws.2020.057
Yin, Q., Lu, Q., Wu, Y. L., Zhang, H. J., Ji, Y. F., Ren, X. Y., et al. (2021). Research progress on evaluation methods of sustainable water resources use in arid regions. Agric. Eng. 11 (04), 82–85. doi:10.3969/j.issn.2095-1795.2021.04.019
Yu, L., Xiong, X., Samim, S. A., and Hu, Z. (2021). Analysis of water resources and water environmental carrying capacity of animal husbandry in China—based on water footprint theory. Water 13 (23), 3386. doi:10.3390/w13233386
Yuan, K., Zhou, R. X., Cui, Y., Zhou, T., and Zhou, L. G. (2023). Evaluation of carrying capacity of water resources by double semi-partial subtraction set pair potential method. J. Water Conservancy Transp. Eng. (06), 1–10. doi:10.12170/20220905003
Yue, H., Zheng, Y. L., Xu, B., Zheng, G. G., Zhong, P. A., Zhou, J. M., et al. (2023) “Multi-objective water scheduling decision-making model and its application in Hongze Lake,” in The south-north water diversion and water conservancy science and technology in Chinese and English, 258–266. doi:10.13476/j.cnki.nsbdqk.2023.0026
Zeng, X., Yang, X., Yu, L., and Chen, H. (2015). A mix inexact-quadratic fuzzy water resources management model of floodplain (IQT-WMMF) for regional sustainable development of dahuangbaowa, China. China. Water 7 (6), 2771–2795. doi:10.3390/w7062771
Zeng, X. T., Huang, G. H., Li, Y. P., Zhang, J. L., Cai, Y. P. L. Z. P., Liu, L. R., et al. (2016a). Development of a fuzzy-stochastic programming with Green Z-score criterion method for planning water resources systems with a trading mechanism. Environ. Sci. Pollut. Res. 23, 25245–25266. doi:10.1007/s11356-016-7595-z
Zeng, X. T., Huang, G. H., Yang, X. L., Wang, X., Fu, H., Li, Y. P., et al. (2016b). A developed fuzzy-stochastic optimization for coordinating human activity and eco-environmental protection in a regional wetland ecosystem under uncertainties. Ecol. Eng. 97, 207–230. doi:10.1016/j.ecoleng.2016.09.002
Zhang, L. M., Wang, H. R., Pan, C. Z., and He, J. H. (2021). Empirical analysis of the impact of industrial structure adjustment on water resource use efficiency in resource-dependent regions: empirical evidence from 10 resource-dependent provinces in China. J. Beijing Normal Univ. Nat. Sci. Ed. 57 (03), 353–362. doi:10.12202/j.0476-0301.2020285
Zhang, L. X., Liu, S. Y., Wang, P., Zhang, R. H., and Wang, J. Y. (2023a). Evaluation of agricultural water resources carrying capacity in the middle reaches of Heihe River based on principal component analysis. Land Nat. Resour. Res. (02), 71–74. doi:10.16202/j.cnki.tnrs.2023.02.016
Zhang, W., Liu, Q. Q., Wang, H., and Chen, B. (2023b). Matching characteristics and shortage pressure analysis of agricultural water and soil resources in Shandong Province based on water footprint. Chin. J. Ecol. 43 (12), 4943–4953.
Zhang, X. Y., Cao, Y. K., Bao, T. H., Wang, Y. S., and Shi, F. (2023c). Research on water resources carrying capacity of Yellow River diversion area in Henan Province based on combined weight TOPSIS model. People’s Yellow River 45 (07), 73–78.
Zhou, F., and Qiu, W. G. (2022). Evaluation of sustainable utilization of water resources in Shanghai from 2013 to 2019. People’s Yellow River 44 (S1), 51–53.
Keywords: regional water resources carrying capacity, sustainable development evaluation, system dynamics, analytic hierarchy process, Golmud
Citation: Sun Y, Wang Y, Zhang W and Ye S (2024) Regional water resources carrying capacity in China based on analytic hierarchy process and system dynamics model: a case study of Golmud City. Front. Environ. Sci. 12:1450747. doi: 10.3389/fenvs.2024.1450747
Received: 19 June 2024; Accepted: 16 September 2024;
Published: 25 September 2024.
Edited by:
Daniel Dias, Imperial College London, United KingdomReviewed by:
Xueting Zeng, Capital University of Economics and Business, ChinaTianwei Lu, Sun Yat-sen University, China
Copyright © 2024 Sun, Wang, Zhang and Ye. This is an open-access article distributed under the terms of the Creative Commons Attribution License (CC BY). The use, distribution or reproduction in other forums is permitted, provided the original author(s) and the copyright owner(s) are credited and that the original publication in this journal is cited, in accordance with accepted academic practice. No use, distribution or reproduction is permitted which does not comply with these terms.
*Correspondence: Shuigen Ye, eWVzaHVpZ2VuNjY2QDE2My5jb20=