 Jianming Jiang1
 Ming Zhang
- 1School of Public Health and Management Youjiang Medical University for Nationalities, Baise, China
- 2Affiliated Hospital of Youjiang Medical University for Nationalities, Baise, China
- 3College of science, Guangxi University of Science and Technology, Liuzhou, China
Predicting carbon dioxide emissions is crucial for addressing climate change and achieving environmental sustainability. Accurate emission forecasts provide policymakers with a basis for evaluating the effectiveness of policies, facilitating the design and implementation of emission reduction strategies, and helping businesses adjust their operations to adapt to market changes. Various methods, such as statistical models, machine learning, and grey prediction models, have been widely used in carbon dioxide emission prediction. However, existing research often lacks comparative analysis with other forecasting techniques. This paper constructs a new Discrete Fractional Accumulation Grey Gompertz Model (DFAGGM(1,1) based on grey system theory and provides a detailed solution process. The Whale Optimization Algorithm (WOA) is used to find the hyperparameters in the model. By comparing it with five benchmark models, the effectiveness of DFAGGM(1,1) in predicting carbon dioxide emissions data for China and the United States is validated.
1 Introduction
1.1 Background and motivation
Predicting Carbon dioxide emissions levels is of utmost importance due to its profound implications for climate and environmental sustainability. Carbon dioxide is a primary greenhouse gas responsible for trapping heat in the Earth atmosphere, leading to global warming and climate disruption. Understanding and forecasting carbon dioxide concentrations are critical for several reasons. Firstly, accurate carbon dioxide predictions inform climate policymakers and governments about the effectiveness of current mitigation strategies and the urgency of implementing furthe measures to curb emissions. By forecasting future carbon dioxide levels, policymakers can design more effective policies aimed at reducing green house gas emissions, transitioning to renewable energy sources,and Promoting sustainable practices. Carbon dioxide forecasts are crucial for industries and businesses, particularly those reliant on fossil fuels and heavy carbon emissions. Anticipating future regulatory changes and market shifts related to carbon pricing and emissions trading enables companies to adapt their operations, invest in cleaner technologies, and remain competitive in a rapidly evolving global economy. Thirdly, predicting carbon dioxide levels helps scientists and researchers better understand the complex dynamics of the Earth’s climate system and assess the potential impacts of climate change on ecosystems, biodiversity, and human societies. This knowledge is essential for developing adaptation strategies to mitigate the adverse effects of climate change and safeguard vulnerable populations and ecosystems. Moreover, carbon dioxide forecasts play a vital role in international climate negotiations and agreements, providing countries with the necessary data to set emission reduction targets, monitor progress, and hold each other accountable for their commitments under global accords such as the Paris Agreement. In summary, forecasting carbon dioxide levels is indispensable for addressing climate change challenges effectively, guiding policy interventions, fostering sustainable development, and safeguarding the planet for future generations.
1.2 Literature review
To accurately predict carbon dioxide emissions, scholars have conducted related research using various prediction methods, mainly including statistical model predictions, machine learning predictions, and grey model predictions. Traditional statistical models primarily focus on time series models (Karakurt and Aydin, 2023; Javanmard et al., 2023; Ding and Zhang, 2023; Rao et al., 2023). For example, Cui et al. presents a SARIMA-based federated learning method to enhance privacy, accuracy, and efficiency in predicting industrial carbon emissions. By clustering clients and applying federated averaging, the method significantly improves prediction accuracy and convergence speed while protecting data privacy, offering a robust approach for utilizing multisource industrial data in environmental management (Cui et al., 2023). Kour M et al. examines the rise of carbon dioxide emissions in South Africa, a significant contributor to global greenhouse gases and ecological imbalance. Using annual data from 1980 to 2016, the researchers apply an ARIMA model to forecast carbon dioxide emissions from 2015 to 2027. The model predicts a steady increase in emissions over the next decade (Kour, 2023).
Due to the flexibility and adaptability of machine learning methods, as well as their ability to handle complex non-linear relationships, they have been widely applied in the field of carbon dioxide emission prediction (Bhatt et al., 2023; AlOmar et al., 2023; Khajavi and Rastgoo, 2023; Lin et al., 2021). For example, Qin et al. explores methods to calculate and reduce urban carbon dioxide emissions in China. Using data from 2000 to 2019, an inversion model for prefecture-level cities is created. Machine learning identifies GDP, financial revenue, and foreign investment as key emission factors. The study highlights the highest emissions in economically developed and resource-dependent regions and stresses the importance of continued low-carbon initiatives and focusing on high-emission areas for sustainable development (Qin and Gong, 2022). Zhang et al. examines carbon emissions in China’s building and construction sector from 2005 to 2021, focusing on 30 provincial regions. It develops nine machine learning regression models to predict emission trends, using various economic, technological, and classification factors. The stacking ensemble regression model proved to be the most effective (Zhang et al., 2024). Faruque et al. believed that univariate predictions are difficult to capture sudden changes in time series, so they explored multivariate experiments based on four deep learning algorithms (Convolutional Neural Network (CNN), CNN Long Short-Term Memory (CNN-LSTM), Long Short-Term Memory (LSTM), and Dense Neural Network (DNN)) and multiple linear regression. The experimental results showed that DNN and multiple linear regression achieved first and second performance rankings with MAPE values of 3.678 and 5.541, respectively (Faruque et al., 2022).
Deng proposed the grey system theory in 1982, primarily to solve the problem of analysis, prediction, decision, and control of small data, poor information uncertain systems (JuLong, 1982). Guo et al. designed a grey prediction model based on exponential accumulation and applied it to the carbon dioxide emissions of the BRICS countries (Guo et al., 2021). Although the experiments showed that the model achieved good prediction performance, they did not consider a comparison with existing carbon dioxide emission models in their analysis. Therefore, the experiments lack persuasiveness. Qiao et al. designed a fractional-order grey GM(1,1) model and achieved the best performance in predicting carbon dioxide emissions in APEC member countries (Qiao et al., 2021). However, similar to the studies by Qiao et al. and Guo et al., the effectiveness of this method was not validated through comparative analysis with other carbon dioxide emission prediction techniques. Zeng et al. designed a fractional-order grey Verhulst model for predicting China’s annual carbon dioxide emissions and achieved the best test performance on the dataset of China’s annual carbon dioxide emissions (Gao et al., 2022). The aforementioned studies on carbon dioxide emission prediction hold significant promise for global carbon reduction efforts. Nevertheless, most of these studies require a substantial amount of data. Since policy interventions influence carbon dioxide emissions, the value of historical data for future forecasting is considerably diminished. Following the principle that new information should take precedence over old, it is more reasonable to use data from recent years. This results in a smaller sample size. Compared to mathematical statistics methods and big data technologies, grey prediction has greater advantages in handling systems characterized by “small data, poor information” uncertainty. Moreover, the carbon dioxide emissions system exhibits both regularity and randomness, typifying grey-cause, white-effect” uncertainty characteristics.
Reading through these studies, it becomes clear that constructing a reliable model for predicting annual carbon dioxide emissions is of paramount importance. While various methodologies, such as statistical model predictions, grey prediction models, deep learning techniques,have shown promise, a common shortcoming is the lack of comparative analysis with other prediction techniques. Accurate prediction models are crucial for effective policy-making, environmental planning, and achieving global climate goals. By addressing the current research gaps, particularly through robust comparative analyses and the integration of hyperparameters, future models can significantly enhance the accuracy and reliability of carbon dioxide emission predictions.
Based on the GM model, this paper constructs a New discrete Fractional Accumulation Grey Gompertz model (DFAGGM(1,1)), provides the specific solution process for the model, and applies it to the prediction of carbon dioxide emissions in China and the United States. The subsequent sections of this paper are structured as follows: The section 2 mainly introduces the construction and solution process of the DFAGGM(1,1) model, the section3 uses the DFAGGM(1,1) model to predict and analyze carbon dioxide emissions data for China and the United States. The conclusion and summary are provided at the end.
2 Methods
2.1 Grey gompertz model
The Fractional Accumulation Grey Gompertz model (FAGGM(1,1)) is a grey forecasting technique proposed by Gao et al. (Zeng et al., 2023). For predicting carbon dioxide emissions. Its expression
where a is the development coefficient, and
The parameter estimation values of FAGGM(1,1) are provided by
The definitions of B and Y in Equation 2 are as follows:
Respectively.
The predicted values of FAGGM(1,1) are given by
where solving equation 1 yields the following Equation 4
Based on the modeling process of FAGGM(1,1), the following points can be understood.
(1) The parameter estimation formula of FAGGM(1,1) contains errors, which may affect the results of the model. Typically, in grey modeling processes, the integral form of the model is used as the parameter estimation formula. However, FAGGM(1,1) employs
(2) The parameter estimation formula of FAGGM(1,1) is discrete, while the model’s prediction formula is continuous, causing inconsistency that affects the model’s rationality.
(3) There are no hyperparameters in the model that can adjust the model structure, which may limit the performance of the model.
2.2 New discrete fractional accumulation grey gompertz model (DFAGGM(1,1))
By utilizing first-order forward differencing to amend Equation 1,
can be obtained, where
By introducing a bias c and a hyperparameter
Based on Equation 6, the estimated value of
The matrix in Equation 7 is defined as follows:
The prediction results of DFAGGM(1,1) are also obtained through Equation 3. It should be noted that
2.3 The method for solving the model
Due to the presence of unknown hyperparameters in the DFAGGM(1,1) model, it is challenging to apply the model directly. To address such issues, constructing an optimization model is a common approach. In this paper, we formulate an optimization problem using the mean absolute percentage error as the loss function, namely,
For nonlinear normalization models, ordinary mathematical solving methods require a substantial amount of time. In prediction problem solving, quick execution of predictions is essential. Therefore, utilizing swarm intelligence algorithms is an effective method for addressing such issues. This paper employs the classical Whale optimization Algorithm (WOA) to solve for the optimal hyperparameters. The specific solving process of the WOA algorithm is as follow.
2.3.1 Initialize parameters
2.3.2 Evaluate fitness
2.3.3 Update positions
In each generation, update the whale positions using the following formulas:
When
Where.
When
Spiral Update Position.
When
Where
b is a constant defining the shape of the logarithmic spiral
l is a random number in the range [-1,1]
2.3.4 Check constraints
After updating positions, check each solution to ensure it remains within the search space. If not, adjust the solution to bring it back within bounds.
2.3.5 Iterate
Repeat steps 2-4 until the maximum number of iterations TT is reached or a stopping criterion is met.
2.3.6 Output
Output the best solution
The solving process based on this algorithm is illustrated in Figure 1.
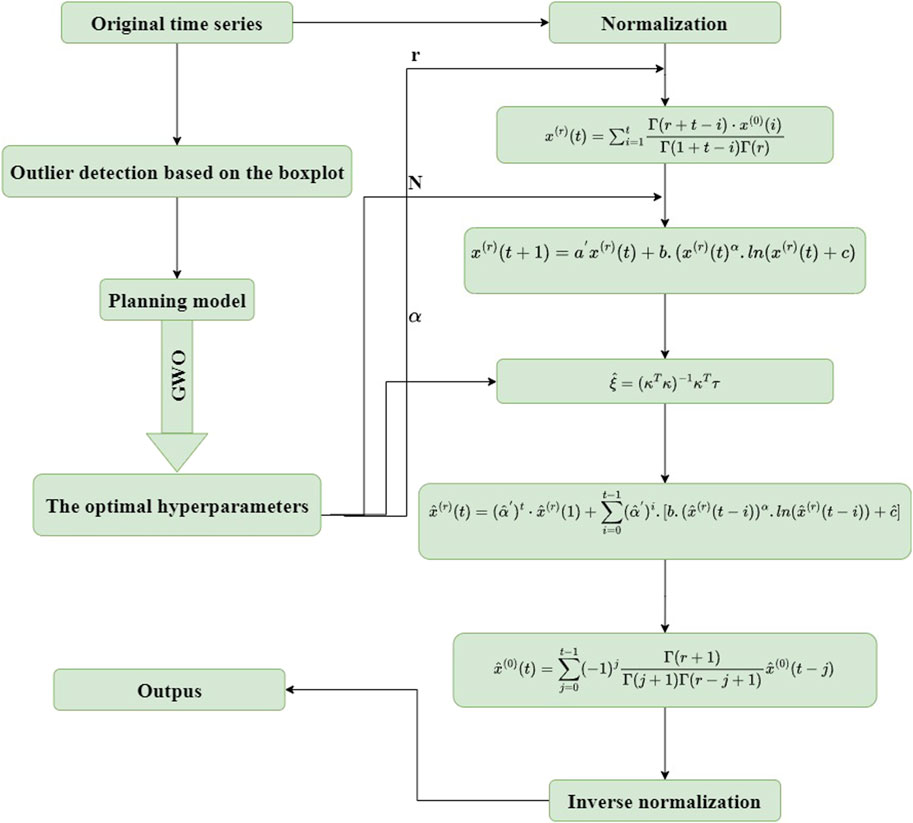
Figure 1. The application process of the proposed model.
3 Application
3.1 Raw data collection and comparison model
The Carbon Dioxide Emissions from Energy in China from 1993 to 2022 and the energy-related carbon dioxide emissions from the total of states in the United States from 1970 to 2021 are taken as the subjects of the study in this article. These two datasets are sourced from https://www.energyinst.org/statistical-review and https://www.eia.gov/environment/emissions/state/, as shown in Table 1, 2. For each dataset, the last nine data points are used as the test set.
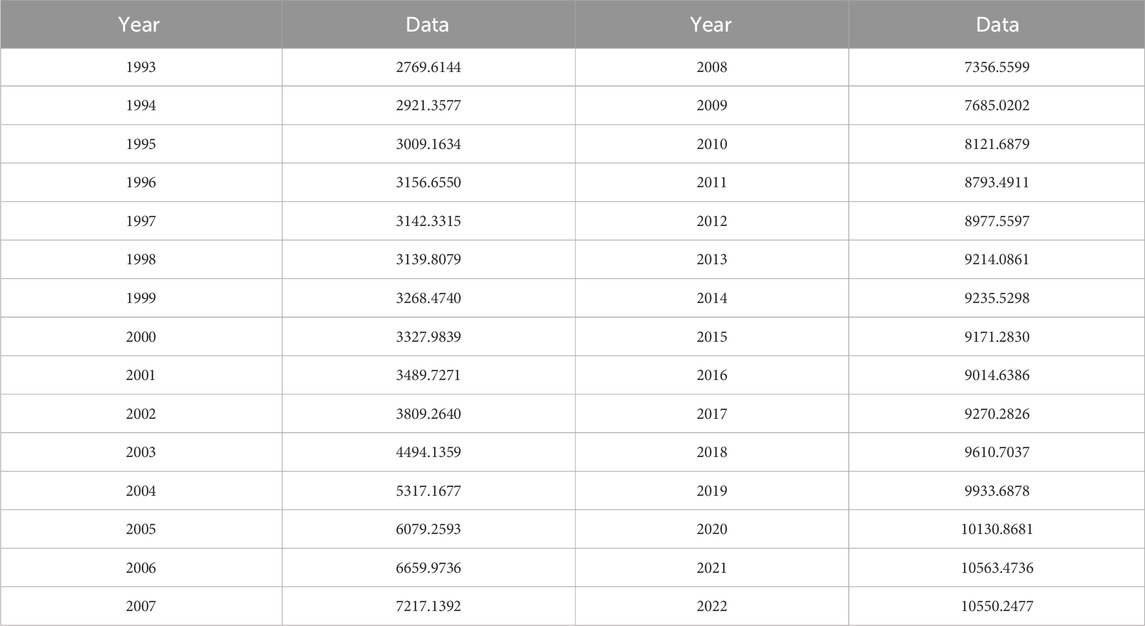
Table 1. Carbon dioxide emissions from energy in China from 1993 to 2022.

Table 2. Energy-related carbon dioxide emissions from the total of states in the United States from 1970 to 2021.
To validate the effectiveness of the models presented in this article, five recent carbon dioxide emission forecasting techniques were selected, including FAGGM (Gao et al., 2022),
3.2 Evaluation indices of the modelling accuracy
To evaluate the training and prediction performance of the model, this paper adopts five commonly used evaluation metrics, namely.
The mean absolute percentage error (MAPE), which is defined as follows
Mean Squared Error, MSE
Root Mean Squared Error, RMSE
Mean Absolute Error, MAE
Index of agreement (IA)
3.3 Numerical results
Based on the data provided, we can compare the performance of various forecasting methods (DFAGGM, FAGGM,
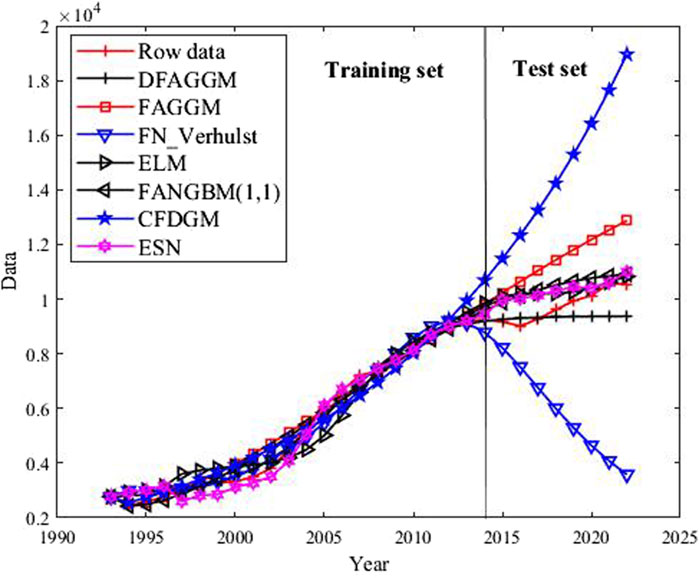
Figure 2. Fitting curves of the models for the case of China.
In Table 3, DFAGGM shows the best performance in terms of MAPE (4.863%) and has relatively low MSE (431560.106), RMSE (656.932), and MAE (494.342). However, its IA is moderate (0.512). ESN performs well with a MAPE of 5.674%, MSE of 383743.009, RMSE of 619.470, MAE of 537.370. and IA of 0.733. ELM also performs well with a MAPE of 6.152%, MSE of 458231.666, RMSE of 676.928, and MAE of 577.109. Its IA is the highest among all models at 0.668, indicating a good agreement with the raw data. FANGBM has a reasonable MAPE of 7.149%, moderate MSE (548771.933), RMSE (740.791), and MAE (681.960). Its IA is also relatively high at 0.681. CFDGM has the highest MAPE (47.944%), MSE (27197966.706), RMSE (5215.167), and MAE (4757.708), making it the least accurate model.
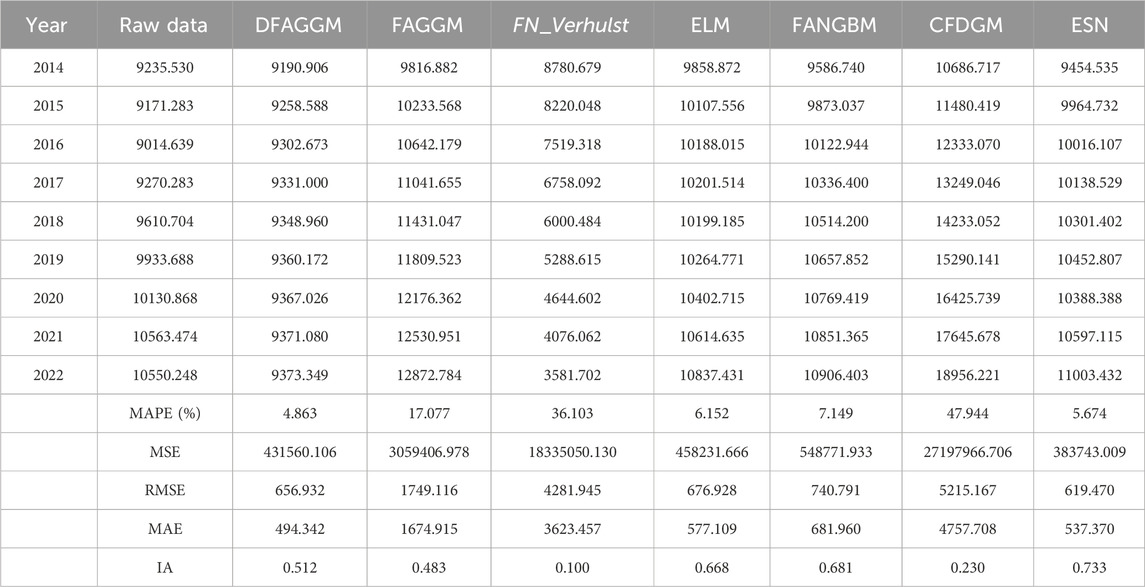
Table 3. Simulation results and evaluation metrics of the models in the case of China.
In Table 4, DFAGGM demonstrates the strongest performance with a MAPE of 2.674%, the lowest MSE (27790.780), RMSE (166.706), and MAE (135.296), along with a high Index of Agreement (IA) of 0.885. This indicates that DFAGGM closely matches the actual CO2 emissions data, making it the most accurate model among those evaluated. ESN also performs well, with a MAPE of 3.544%, MSE of 54806.406, RMSE of 234.108, and MAE of 176.529. Its IA of 0.652 suggests a strong agreement with the raw data, though slightly less accurate than DFAGGM. Despite the good performance, ESN complexity as a machine learning model contrasts with the simpler yet effective DFAGGM. ELM and ESN performed slightly worse, with a MAPE of 3.681, MSE of 59236.875, RMSE of 243.386, MAE of 181.468, and IA of 0.655. In contrast, FAGGM, FANGBM, and CFDGM exhibit higher errors and lower IA values. FAGGM has a MAPE of 7.842% and an IA of 0.372, indicating moderate performance. FANGBM and CFDGM show significant deviations with MAPEs of 21.426% and 20.143%, respectively, and low IAs, reflecting poor predictive accuracy. According to Figure 3, the training phase differences in model fitting are minimal, but during the testing phase, the red and black curves, representing DFAGGM and ELM, closely follow the actual data trends. This suggests that these models have robust generalization abilities. Overall, DFAGGM and ELM are the most effective models, with DFAGGM being slightly superior in terms of error metrics and practical simplicity. In fact,The main source of error in the carbon emission prediction process is the model’s expressive capability. The reason DFAGGM outperforms FAGGM lies in its structural expression, which includes an additional adaptive hyperparameter
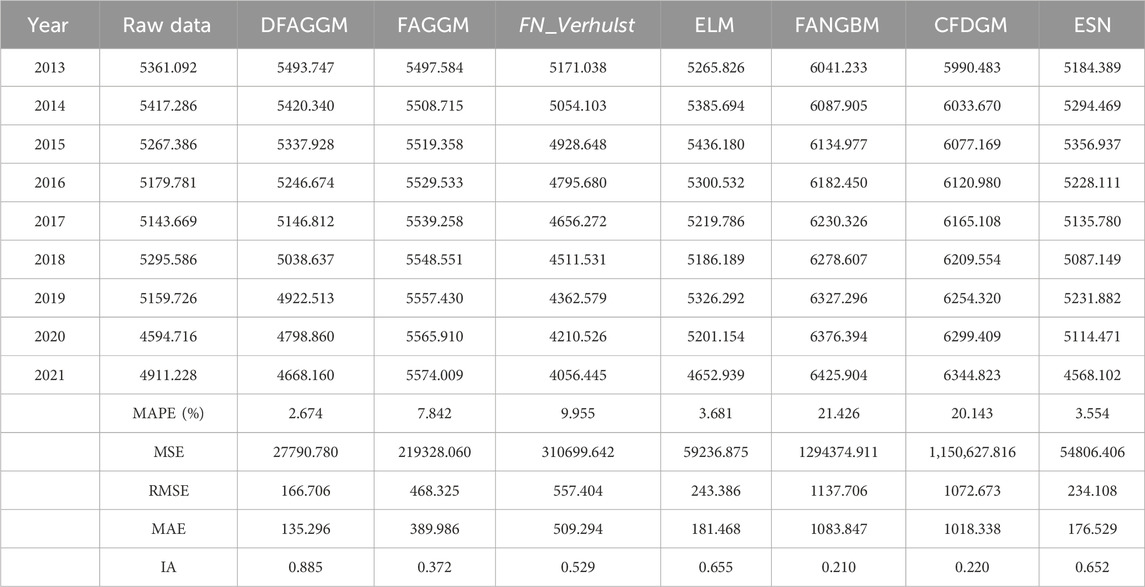
Table 4. Simulation results and evaluation metrics of the models in the case of the United States.

Figure 3. Fitting curves of the models for the case of the United States.
4 Conclusion and future work
To achieve sustainable development, countries around the world are striving to reach carbon peak and carbon neutrality goals while developing their economies. Accurate prediction of carbon emissions provides valuable references for decision-makers to manage effectively. However, due to the complexity of carbon emission data series, achieving high-precision carbon emission forecasts remains challenging. Through experiments and comparative analysis, the DFAGGM model proposed in this paper demonstrates high accuracy in annual carbon emission predictions and strong interpretability, making it a reliable model for decision-makers.
At the same time, it is worth noting that DFAGGM still has some shortcomings and room for improvement. Firstly, the model has a univariate limitation as it is a univariate grey prediction model and does not consider the impact of other factors on the main variable. Secondly, while the model performs well in handling short-term or medium-term time series data, it may lack the ability to capture cyclical changes and respond to sudden changes in the time series. Lastly, this study mainly uses carbon emission data from China and the United States to validate the model. Whether the model is applicable to data from other countries and regions still needs further verification. In the future, this research proposes several directions for further study. Firstly, the model proposed in this paper can be combined with other grey prediction model optimization methods to enhance the model’s adaptability. Additionally, due to the complexity of carbon emission predictions, it is necessary to consider more influencing factors, such as economic scale, industrial structure, and carbon emission intensity. A multivariate grey prediction model can be constructed based on the analysis of these influencing factors and the model proposed in this paper. Finally, it is necessary to apply the DFAGGM model and its optimized model to carbon emission predictions in more countries and regions to test its generalization capability.
Data availability statement
The original contributions presented in the study are included in the article/supplementary material, further inquiries can be directed to the corresponding author.
Author contributions
JJ: Conceptualization, Writing–original draft. YB: Writing–original draft, Data curation, Resources. MZ: Project administration, Writing–review and editing. ZH: Software, Validation, Writing–review and editing.
Funding
The author(s) declare that no financial support was received for the research, authorship, and/or publication of this article.
Conflict of interest
The authors declare that the research was conducted in the absence of any commercial or financial relationships that could be construed as a potential conflict of interest.
Publisher’s note
All claims expressed in this article are solely those of the authors and do not necessarily represent those of their affiliated organizations, or those of the publisher, the editors and the reviewers. Any product that may be evaluated in this article, or claim that may be made by its manufacturer, is not guaranteed or endorsed by the publisher.
References
AlOmar, M. K., Hameed, M. M., Al-Ansari, N., Mohd Razali, S. F., and AlSaadi, M. A. (2023). Short-medium-and long-term prediction of carbon dioxide emissions using wavelet-enhanced extreme learning machine. Civ. Eng. J. 9 (4), 815–834. doi:10.28991/cej-2023-09-04-04
Bhatt, H., Davawala, M., Joshi, T., Shah, M., and Unnarkat, A. (2023). Forecasting and mitigation of global environmental carbon dioxide emission using machine learning techniques. Clean. Chem. Eng. 5, 100095. doi:10.1016/j.clce.2023.100095
Cui, T., Shi, Y., Lv, B., Ding, R., and Li, X. (2023). Federated learning with SARIMA-based clustering for carbon emission prediction. J. Clean. Prod. 426, 139069. doi:10.1016/j.jclepro.2023.139069
Ding, S., and Zhang, H. (2023). Forecasting Chinese provincial CO2 emissions: a universal and robust new-information-based grey model. Energy Econ. 121 (2023), 106685. doi:10.1016/j.eneco.2023.106685
Faruque, Md O., Rabby, Md A. J., Hossain, Md A., Islam, Md R., Rashid, Md M.Ur, and Muyeen, S. M. (2022). A comparative analysis to forecast carbon dioxide emissions. Energy Rep. 8, 8046–8060. doi:10.1016/j.egyr.2022.06.025
Gao, M., Yang, H., Xiao, Q., and Goh, M. (2022). A novel method for carbon emission forecasting based on Gompertz’s law and fractional grey model: evidence from American industrial sector. Renew. Energy 181, 803–819. doi:10.1016/j.renene.2021.09.072
Guo, J., Liu, W., Tu, L., and Chen, Y. (2021). Forecasting carbon dioxide emissions in BRICS countries by exponential cumulative grey model. Energy Rep. 7, 7238–7250. doi:10.1016/j.egyr.2021.10.075
Javanmard, M. E., Tang, Y., Wang, Z., and Tontiwachwuthikul, P. (2023). Forecast energy demand, CO2 emissions and energy resource impacts for the transportation sector. Appl. Energy 338, 120830. doi:10.1016/j.apenergy.2023.120830
JuLong, D. (1982). Control problems of grey systems. Syst. Control Lett. 1 (5), 288–294. doi:10.1016/s0167-6911(82)80025-x
Karakurt, I., and Aydin, G. (2023). Development of regression models to forecast the CO2 emissions from fossil fuels in the BRICS and MINT countries. Energy 263, 125650. doi:10.1016/j.energy.2022.125650
Khajavi, H., and Rastgoo, A. (2023). Predicting the carbon dioxide emission caused by road transport using a Random Forest (RF) model combined by Meta-Heuristic Algorithms. Sustain. Cities Soc. 93, 104503. doi:10.1016/j.scs.2023.104503
Kour, M. (2023). Modelling and forecasting of carbon-dioxide emissions in South Africa by using ARIMA model. Int. J. Environ. Sci. Technol. 20 (10), 11267–11274. doi:10.1007/s13762-022-04609-7
Lin, X., Zhu, X., Feng, M., Han, Y., and Geng, Z. (2021). Economy and carbon emissions optimization of different countries or areas in the world using an improved Attention mechanism based long short term memory neural network. Sci. Total Environ. 792, 148444. doi:10.1016/j.scitotenv.2021.148444
Qiao, Z., Meng, X., and Wu, L. (2021). Forecasting carbon dioxide emissions in APEC member countries by a new cumulative grey model. Ecol. Indic. 125, 107593. doi:10.1016/j.ecolind.2021.107593
Qin, J., and Gong, N. (2022). The estimation of the carbon dioxide emission and driving factors in China based on machine learning methods. Sustain. Prod. Consum. 33, 218–229. doi:10.1016/j.spc.2022.06.027
Rahman, M., Rashid, F., Roy, S., and Habib, M. A. (2024). Application of extreme learning machine (ELM) forecasting model on CO2 emission dataset of a natural gas-fired power plant in Dhaka, Bangladesh. Data Brief 54, 110491. doi:10.1016/j.dib.2024.110491
Rao, C., Huang, Q., Chen, L., Goh, M., and Hu, Z. (2023). Forecasting the carbon emissions in Hubei Province under the background of carbon neutrality: a novel STIRPAT extended model with ridge regression and scenario analysis. Environ. Sci. Pollut. Res. 30 (20), 57460–57480. doi:10.1007/s11356-023-26599-w
Wang, L., Hu, H., Ai, X. Y., and Liu, H. (2018). Effective electricity energy consumption forecasting using echo state network improved by differential evolution algorithm. Energy 153, 801–815. doi:10.1016/j.energy.2018.04.078
Yang, J., and Wu, Z. (2023). Modelling and forecasting nonrenewable energy consumption and carbon dioxide emissions in China using a PSO algorithm based fractional nonlinear grey Bernoulli model. Environ. Sci. Pollut. Res. 30, 69651–69665. doi:10.1007/s11356-023-27189-6
Zeng, B., Zheng, T., Yang, Y., and Wang, J. (2023). A novel grey Verhulst model with four parameters and its application to forecast the carbon dioxide emissions in China. Sci. Total Environ. 899, 165648. doi:10.1016/j.scitotenv.2023.165648
Zhang, X., Sun, J., and Wang, F. (2024). Assessment and regression of carbon emissions from the building and construction sector in China: a provincial study using machine learning. J. Clean. Prod. 450, 141903. doi:10.1016/j.jclepro.2024.141903
Keywords: carbon dioxide emissions forecasting, grey prediction model, DFAGGM(1,1) model, whale optimization algorithm, environmental sustainability
Citation: Jiang J, Ban Y, Zhang M and Huang Z (2024) New discrete fractional accumulation Grey Gompertz model for predicting carbon dioxide emissions. Front. Environ. Sci. 12:1450354. doi: 10.3389/fenvs.2024.1450354
Received: 18 June 2024; Accepted: 13 August 2024;
Published: 28 August 2024.
Edited by:
Tongwen Li, Sun Yat-sen University, ChinaCopyright © 2024 Jiang, Ban, Zhang and Huang. This is an open-access article distributed under the terms of the Creative Commons Attribution License (CC BY). The use, distribution or reproduction in other forums is permitted, provided the original author(s) and the copyright owner(s) are credited and that the original publication in this journal is cited, in accordance with accepted academic practice. No use, distribution or reproduction is permitted which does not comply with these terms.
*Correspondence: Ming Zhang, eXltaW5nemhhbmcyMDI0QDE2My5jb20=