- College of Urban and Rural Construction, Shanxi Agricultural University, Taigu, China
Investigating the evolution of land use and its impact on carbon storage is of significant importance for mitigating regional climate change and promoting green low-carbon development. Ningwu County is located in the source region of the Fenhe and Sanggan River, and its ecological status significantly influences the carbon storage (CS) of the watershed ecosystem. In this study, the PLUS-InVEST model was employed to analyze the land use evolution from 1990 to 2020 in Ningwu County, Shanxi Province, as well as their impacts on CS. Additionally, the study simulated and predicted land use changes in Ningwu County by 2040 under four scenarios: natural development (NDS), ecological protection (EPS), cultivated land protection (CLPS), and urban development (UDS), while estimating the corresponding changes in ecosystem CS. Furthermore, the study utilized optimal parameters-based geographical detector to explore the mechanisms underlying the spatial differentiation of CS. The results indicated that the areas of forest land and construction land in the study area consistently increased from 1990 to 2020, whereas the area of cultivated land continuously declined, with grassland, water bodies, and unused land exhibiting a fluctuating increasing trend. The spatial distribution of CS was highest in the northwest, second highest in the southeast, and lowest in the middle region. Over these 3 decades, CS had shown a continuous increase. It is projected that by 2040, the areas of forest and grassland will experience the most significant increase under the EPS; cultivated land only increase under the CLPS; while construction land display the greatest increase under the UDS. Compared to 2020, these four scenarios for 2040 indicate an increase in regional CS, with the EPS showing the largest increment. The primary factors influencing the spatial differentiation of CS in Ningwu County are human activities, followed by topography and climate change; the interactions among these factors exhibit a reinforcing relationship, with the interaction between the distance from construction land and slope having the most substantial impact on the spatial differentiation of CS.
1 Introduction
With the acceleration of China’s industrialization and population growth, greenhouse gas emissions are increasing, exacerbating global climate issues (Voumik et al., 2023; Xiao et al., 2023; Adnan et al., 2024). Deforestation, biomass burning, significant changes in land use patterns, and rapid industrialization have led to higher atmospheric CO2 concentrations (Nunes, 2023; Dass et al., 2024). The carbon storage (CS) function of terrestrial ecosystems is an effective method to reduce atmospheric CO2 and is a crucial CS approach in China (Qiu et al., 2023; Zhang et al., 2023). Therefore, an in-depth analysis of the factors contributing to changes in CS in terrestrial ecosystems is vital for enhancing the CS potential of these lands and promoting regional low-carbon development.
Changes in land-use pattern are the main drivers of variations in CS in terrestrial ecosystems (Mendoza-Ponce et al., 2018). These changes affect the structure, material circulation and energy flow of the ecosystem, thus affecting the carbon cycle process within the ecosystem (Hasan et al., 2020; Bhatt et al., 2022). The Yellow River Basin (YRB), a critical ecological and economic zone in China, serves as an essential carbon sink and plays a key role in economic and social development and ecological security (Wang et al., 2024). In 2020, the CS in the YRB will be about 3.15 × 10⁹ t, accounting for 35% of China’s CS (Zhang et al., 2024; Yu et al., 2022). Due to long-term rapid urbanization expansion and insufficient carrying capacity of resources and environment, the YRB is facing serious ecological problems, including soil erosion and desertification. There are some differences in the judgment of the overall trend of land use change in the YRB due to the different research periods. For example, Wang et al. (2010) investigated land use changes in the YRB from 1990 to 2000, and found that the proportion of cultivated land increased from 26.25% to 26.60%, construction land increased from 1.98% to 2.15%, and unused land increased from 8.53% to 8.67%. On the contrary, the proportion of grassland decreased from 48.49% to 47.90%. The proportion of forest land remained unchanged. Liu et al. (2021) indicated that land use change in the YRB rose before 2000 but declined thereafter. Xu et al. (2023) analyzed the land use change in the Shanxi section of the Yellow River Basin from 2000 to 2020, and found that cultivated land was mainly transformed into forest land, grassland and construction land, forest land was transformed into grassland, and unused land was transformed into grassland. In the past 20 years, forest land increased by 3.23%, grassland increased by 1.11%, water body increased by 10.03%, and construction land increased by 62.82%. However, cultivated land and unused land continued to decrease, decreasing by − 5.85% and 11.21%, respectively. They also predicted an upward trend in CS from 2000 to 2040, with an average annual increase of 1.93 × 10⁶ Mg C, attributed to increased forest land. The source of the Fen River and Sanggan River are located within Ningwu County of Shanxi Province, where serve as an ecological barrier for the YRB and constitute the most significant water conservation area in Shanxi (He et al., 2020). These areas are characterized by its rich biodiversity and hold a crucial position in the national ecological security framework. In recent years, coal mining disrupts soil structure, alters land use methods, and leads to a continuous decline in regional CS. Shanxi Province has made efforts to build an ecological barrier through the implementation of large-scale ecological restoration projects (e.g., construction of the Three-North Shelterbelt Project Region, river management, and wetland restoration). However, the ecological environment has not undergone fundamental improvement. The ecosystem is sensitive and fragile, leading to a series of ecological issues such as the decline of ecosystem services and severe landscape fragmentation. Several studies on CS, such as forest biomass CS (Yu et al., 2008), grassland storage (Kuang-hu et al., 2017), and ecosystem services variation (Hu et al., 2021), have been conducted in Shanxi Province. However, few studies have focused on the small and key ecological functional areas in the Shanxi section of the YRB.
With the advancement of remote sensing technology and the accumulation of carbon density research, the InVEST model has become a widely used tool for estimating CS. This model offers advantages such as low data requirements, high operational speed, and strong applicability (Piyathilake et al., 2022; Ismaili Alaoui et al., 2023). At present, the commonly used spatial prediction models include Cellular Automaton-Markov (CA-Markov), Future Land Use Simulation (FLUS), and Patch-Generating Land Use Simulation (PLUS). Among them, the CA-Markov model combines the advantages of cellular automata (CA) in simulating spatial complexity and Markov chain in time series prediction, and can effectively simulate and predict spatial dynamic processes such as land use change. The FLUS model improves the accuracy and efficiency of simulation by introducing adaptive inertia competition mechanism and wheel selection strategy, which is especially suitable for simulating and predicting multi-type land use change. The PLUS model further integrates multi-source data and machine learning algorithms to achieve more detailed and accurate simulation and prediction of land use change. By integrating the CA-Markov, FLUS, PLUS, and InVEST models, CS under different land use scenarios can be assessed, and the relationship between land use and CS can be elucidated. For instance, Zhu et al. (2021) used the CA-Markov model to predict land-use patterns in arid regions of China from 2020 to 2050 and employed the InVEST model to estimate and forecast ecosystem CS over the past 35 years and the next 30 years, considering the impact of land use changes on terrestrial ecosystem CS. Similarly, Xiang et al. (2022) utilized the Markov-FLUS model to project land use in the main urban area of Chongqing for 2035 and used the InVEST model to evaluate CS under different scenarios. Hernández-Guzmán et al. (2019) applied the Markov model to predict land use in four reservoirs in the western coast of central Mexico from 2017 to 2050 and the InVEST model to estimate CS from 1986 to 2050. Research indicated that the PLUS model, as an improved version of the FLUS model, demonstrated higher accuracy compared to other models due to its more detailed patch generation mechanism and a more comprehensive consideration of driving factors (Liang et al., 2021). Li et al. (2023) effectively predicted land use changes in Liaoning Province, China, for 2050 using the InVEST-PLUS Model. Despite significant progress in existing research regarding the relationship between land use change and CS, previous studies have primarily focused on exploring the contributions of driving factors to land use, lacking in-depth investigations into the relationship between land use and the distribution of CS. Furthermore, in establishing development scenarios, most of these studies have not taken into account the impact of land use spatial planning policies on land use change and CS, which affects the formulation of effective future carbon management strategies.
Therefore, the analysis and prediction of land use and CS changes in Ningwu County not only contribute to the understanding of the current land use conditions and ecological quality, but also provide crucial support for local governments in formulating scientifically sound land use planning. This study aims to: 1) analyze land-use change patterns in Ningwu County from 1990 to 2020; 2) predict land use and CS in 2040 under four scenarios: natural development (NDS), ecological protection (EPS), cultivated land protection (CLPS), and urban development (UDS), using the PLUS and InVEST models; and 3) identify factors affecting CS in the study area.
2 Materials and methods
2.1 Study area
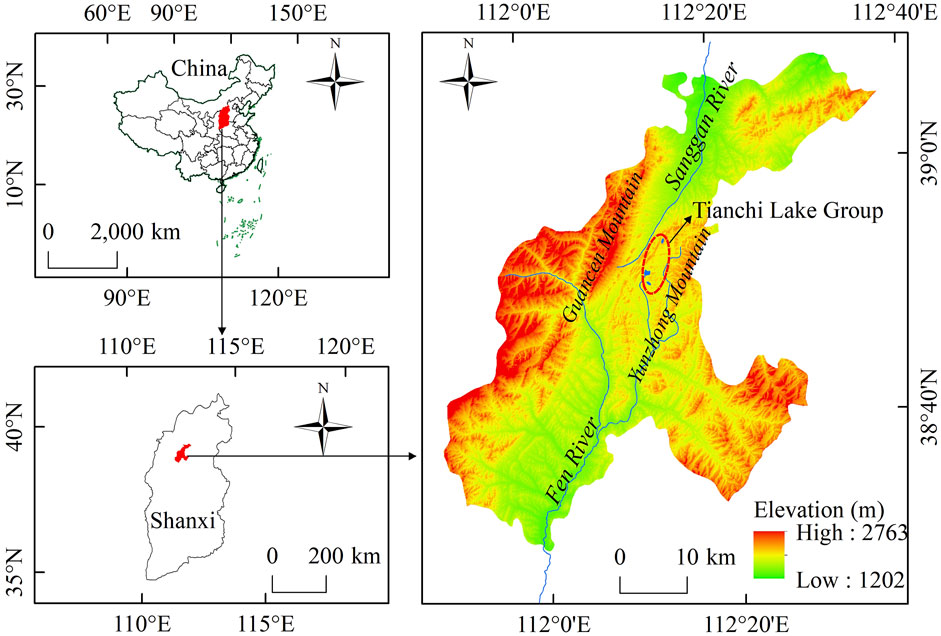
Ningwu County (Shanxi Province), situated in the eastern foothills of the Loess Plateau, serves as the source area for the Fen River and Sanggan River (Figure 1). Ningwu County has a total area of 1,987.7 km2, with an average elevation of 1,600 m. The annual average temperature is 6.2°C and annual average precipitation is 430 mm. According to the Statistical Yearbook of Shanxi Province 2023 (http://tjj.shanxi.gov.cn/), the resident population of Ningwu County is 133,694. The area has a high vegetation cover, in which the forests consist mainly of broadleaf forests, coniferous forests, and mixed coniferous and broadleaf forests. The study area is predominantly mountainous (95%), with the terrain running from northeast to southwest and sloping from west to east. Numerous small, closed freshwater lakes are scattered on the quasi-planation surface between Guancen Mountain and Yunzhong Mountain at altitudes above 1,700 m, which are collectively known as the “Tianchi Lake Group.”
2.2 Data sources
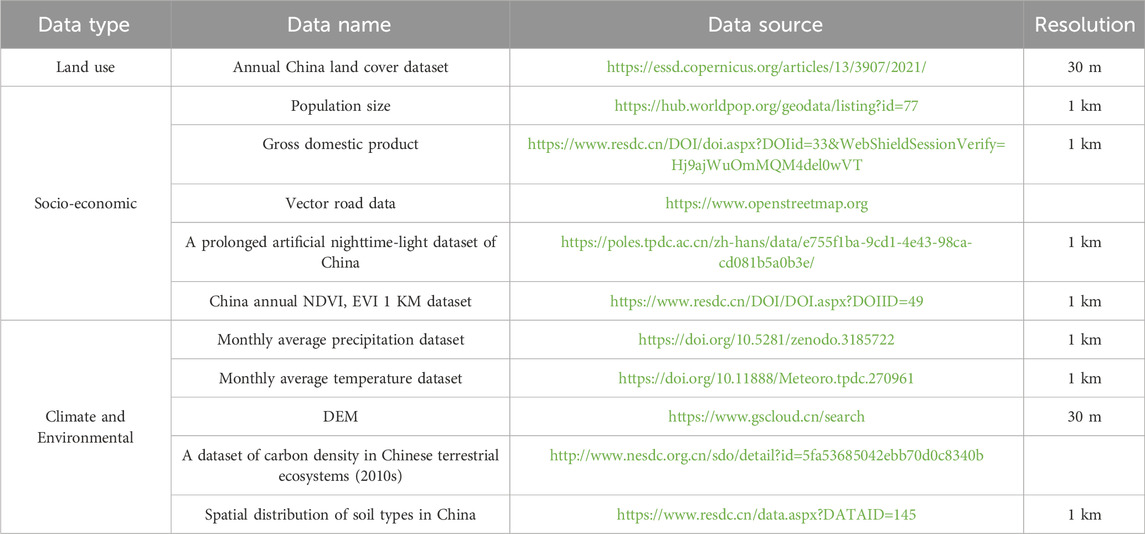
The land use data required are from the 30 m land cover dataset (CLCD) from 1990 to 2021. In order to facilitate the calculation of regional CS using the InVEST model, the original land use data are reclassified into six land use categories including cultivated land, forest land, grassland, water area, construction land, and unused land. Other data processing mainly includes: 1) using digital elevation (DEM) data to generate slope data; 2) using Euclidean distance tools to obtain distances from major roads and railways; 3) converting monthly precipitation and temperature data into TIFF format and the data are calculated using the band combination tool to obtain the annual average precipitation and annual average temperature data (Table 1).
2.3 Methods
2.3.1 Research strategy
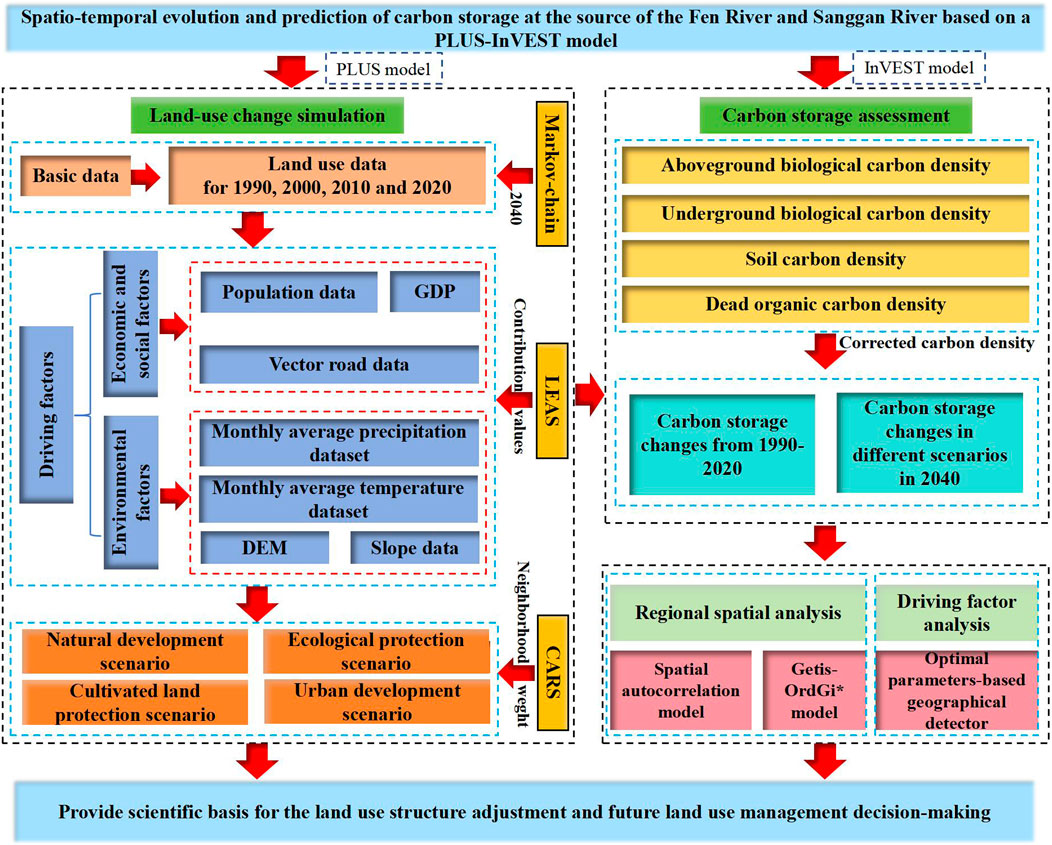
Land use in 2040 was predicted using land use data from 2000, 2010, and 2020 with the PLUS model (Figure 2). Eight driving factors—temperature, precipitation, elevation, slope, distance from the railway, distance from the road, population size, and GDP—were selected, with their contribution values set for inclusion in the land use prediction through the Land Expansion Analysis Strategy (LEAS) in PLUS. Four scenarios were proposed to predict land use changes in 2040 using the Future Land Use Change Simulation Model (CARS) within PLUS. The InVEST model assesses and predicts CS from 2000 to 2040 based on projected land use. Additionally, the effects of these eight driving factors on CS were analyzed.
2.3.2 Prediction by PLUS model
The PLUS model integrates the LEAS and the CARS using a multi-classification random patch-sowing cellular automata model (Wang et al., 2023). Combining the current development situation of Ningwu County with related research, a total of eight categories of land use change drivers were screened from both the natural environment and socio-economic aspects such as temperature, precipitation, elevation, slope, distance from railway, distance from road, population, and GDP.
The neighbourhood weight is utilized to reflect the expansion ability of each type of land use, with a parameter range of 0–1, where values closer to 1 indicate a stronger capacity for expansion of the land use type. Using patch area and patch number as the measurement basis, the neighborhood weight is determined by the Equation 1 (Li et al., 2021):
where Wi is the domain weight of land type i. TAi is the area of land use expansion in category i. TAmin is the minimum area of expansion for each type of land use. TAmax is the maximum area of expansion for each type of land use.
In this study, we compared the land use data for 2020 with the data predicted for 2020 by the PLUS model. The simulation results indicated a Kappa index of 0.73 and an overall accuracy of 0.84. This demonstrates that the constraint conditions and influencing factors have substantial explanatory power and can be utilized for further multi-scenario land-use prediction (Beroho et al., 2023).
2.3.3 Multi-scenario land use prediction
Based on different development needs and related literature (Bijalwan et al., 2010; Liu et al., 2023), we consider the following scenarios. (1) Natural development scenario (NDS). This scenario does not take into account the influence of various factors. According to the current development trends and transition probabilities, simulate and predict land use types for 2040. (2) Ecological protection scenario (EPS). This scenario is aimed at protecting the ecological environment. Based on the NDS, the probability of converting forest land, grassland, and water area into construction land decreases by 20%. Conversely, the probability of converting cultivated land into forest land increases by 40%, while the likelihood of converting cultivated land into grassland rises by 50%. Additionally, the probability of transforming construction land into forest land increases by 30%. These changes align with local ecological protection requirements and green development strategies. (3) Cultivated land protection scenario (CLPS). This scenario protects cultivated land by slowing the rate of conversion of agricultural land to other land use and restraining the expansion rate of construction land. Based on China’s stringent cultivated land protection policies and the requirements for promoting high-standard farmland construction in Ningwu County, the upgrading of existing cultivated land and the development of suitable cultivated land will reduce the probability of converting cultivated land into grassland and construction land by 50%, respectively. (4) Urban development scenario (UDS). This scenario focuses on urban development. Considering the comprehensive development planning for urban and rural construction in Ningwu County, the likelihood of converting cultivated land, grassland, and unused land into construction land will increase by 10%, whereas the probability of converting construction land into cultivated land, forest land, grassland, and water bodies will decrease by 60%. “1” indicates that the two land use types can be mutually converted, while “0” signifies that the two land use types cannot be mutually converted (Table 2).
2.3.4 Carbon density calculation and correction
Carbon density (CS per unit area) is a crucial input parameter in the InVEST model and varies with climate, soil properties, and land-use type (Nel et al., 2022; Ersoy Mirici and Berberoglu, 2024). Initial carbon density data were set concerning relevant literature (Ren et al., 2021; Yang et al., 2021). Carbon density corrections were made using equations from published studies (Alam et al., 2013; Giardina and Ryan, 2000; Chen et al., 2007). The equations were presented as (Equations 2–4):
where CBP and CBT are the biomass carbon density obtained according to the average annual precipitation and average annual temperature, respectively; CSP is the soil carbon density obtained according to the average annual precipitation; P is the average annual precipitation (mm); and T is the average annual temperature (°C).
Substituting the average annual temperature and average annual precipitation in Ningwu County and China into the above equations, respectively, the ratio between the two is the carbon density correction coefficient, calculated by Formulas 5, 6:
where KBP and KBT are the precipitation and temperature correction coefficients of the vegetation carbon density, respectively. KB and KS are the vegetation aboveground and underground carbon density correction coefficients and soil carbon density correction coefficients, respectively. CNBP and CCBP were obtained based on the average annual precipitation. CNBT and CCBT are biocarbon density data obtained from the average annual temperature. Lastly, the results were further corrected by referring to the “2010s China Terrestrial Ecosystem Soil 0–100 cm Carbon Density Dataset” (http://csdata.org/en/p/194/) (Table 3).
2.3.5 Carbon storage estimation
The InVEST CS module uses a simplified carbon cycle model to estimate static CS and dynamic sequestration of each cell within a specific area. The total CS was calculated as Equation 7 (Sharp et al., 2018; Adelisardou et al., 2022):
where Ci is the total CS (t) of region i; Aij is the area (hm2) of land use type j in region i; and Caj, Cbj, Csj, and Cdj are the aboveground biocarbon density, underground biocarbon density, soil carbon density, and dead organic matter carbon density (t/hm2) of land use type j, respectively; n is the number of land-use types.
2.3.6 Spatial autocorrelation analysis
Spatial autocorrelation is typically used to determine whether there is potential interdependence between variables in the same distribution area (Qiao et al., 2023). Spatial autocorrelation includes global spatial autocorrelation (Global Moran’s I) and local spatial autocorrelation (LISA) (Juliani and Nasution, 2024). The global Moran’s I can reveal the overall spatial structure, distribution patterns, and potential causes of regional variables within the entire study area. In contrast, the LISA focuses on the correlation between attributes within a localized area and its neighboring regions, thereby providing insights into spatial heterogeneity at a finer scale. The specific formulas are as Equations 8, 9:
where GI is the global spatial autocorrelation. xi and xj are the CS in cells i and j of the grid, respectively. n is the total number of cells in the global grid. Wij is the matrix of spatial weights.
2.3.7 Cold and hot spot analysis
Based on the Getis-OrdGi* tool in ArcGIS10.8 software, the high- and low-value spatial aggregation positions of CS changes in the study area were identified. Hot spots represent high-value aggregations of CS changes and cold spots represent low-value aggregations (Isazade et al., 2024). The Getis-OrdGi* formula is as Equations 10, 11:
where E (Gi*) and var (Gi*) are the Gi* mathematical expectation and variance, respectively; Wij is the weight; and d is the critical distance between the ith and jth elements. In addition, to measure the spatial distribution intensity of the change in CS, the cold hot spots were further divided into 99% and 95% confidence intervals; the rest of the grid areas were not statistically significant.
2.3.8 Optimal parameters-based geographical detector model
The optimal parameters-based geographical detector can help to identify the best combination of continuous data discretization classification methods (Song et al., 2020), and provide a scientific basis for accurately revealing the correlation between dependent variables and independent variables. In this study, 12 driving factors were selected: elevation (X1), slope (X2), annual average precipitation (X3), annual average temperature (X4), soil type (X5), annual average NDVI (X6), night light (X7), GDP (X8), population density (X9), distance from construction land (X1), distance from railway (X11), and distance from highway (X12). ArcGIS10.8 was used to create ‘fishing nets' and marker points, and the grid pixel values of the corresponding points were extracted. After eliminating outliers, 1864 valid values were extracted for calculation. The calculation formula is as Equation 12:
where h is the stratification of variable Y or factor X. Nh and N are the number of cells in layer h and the whole district. σh2 and σ2 are the variance of Y values in layer h and the whole district. SSW and SST are the sum of the intra-layer variance and the total variance in the whole district, respectively. q is the influence of the influencing factors on the ecological resilience of the city, which takes the value in the range of 0–1, and the bigger the value of q indicates the more obvious influence.
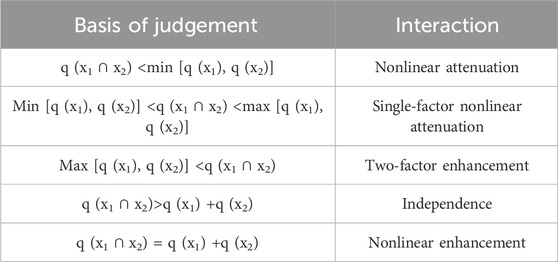
The q-values of the two factors were calculated separately, denoted as q (x1) and q (x2), and then the q-values of the two factors superimposed on each other were calculated, denoted as q (x1∩x2), and then the relationships between q (x1), q (x2), and q (x1∩x2) were compared to obtain the five types of interactions (Table 4).
3 Results
3.1 Analysis of land use change in Ningwu County
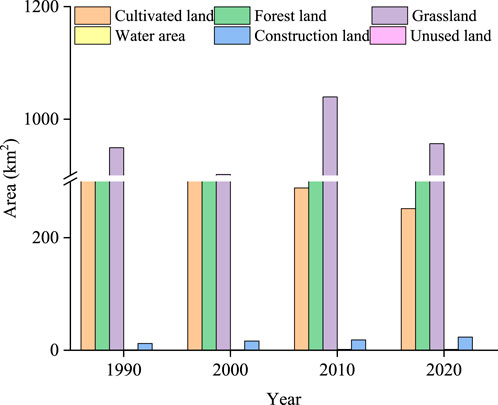
From 1990 to 2020, grassland was the main land use type, accounting for more than 46% of the land in Ningwu County (Figures 3, 4). Cultivated land and forest land occupy approximately 50% of the land area of the study area, and construction land, water area, and unused land was less than 2% of the study area. The distribution of construction land is concentrated in the northern part of the study area, while forest land is continuously situated in the high-altitude regions of the western to southwestern sections of the study area. Forests and grasslands are primarily located in the eastern part of the study area, whereas cultivated land is found in the relatively flat central region of the study area. From 1990 to 2000, the area of cultivated land decreased from 25.55% to 23.28%, while the area of forest increased from 25.06% to 29.56%. In contrast, after 2010, the proportion of cultivated land decreased significantly, whereas that of forest land increased significantly. Compared to 1990, the area of forest land experienced the most significant increase in 2020, expanding by 227.48 km2. This was followed by an increase in constructed land, which rose by 11.11 km2. In contrast, the area of cultivated land continued to decline, decreasing by 246.33 km2. The remaining land use types exhibited a fluctuating upward trend.
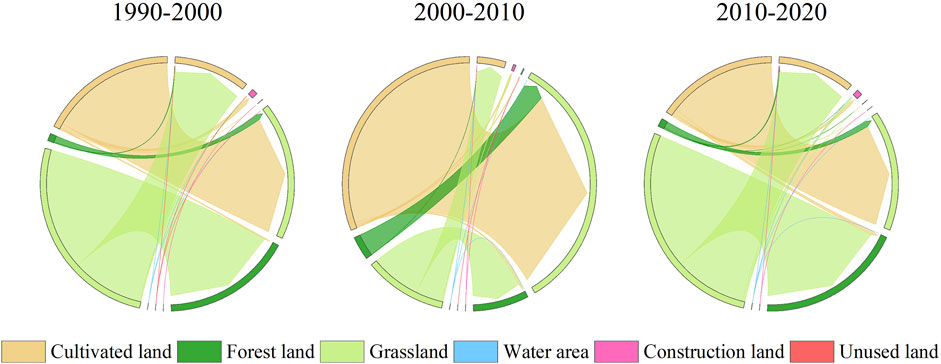
Over the past 30 years, 28.55% of the land in the study area, including 14.70% of cultivated land, 0.78% of forest land and 13.06% of grassland, has been converted to other land use types (Figure 5). Grassland has mainly been converted to forest land, accounting for 38.28% of the total converted area. This increase in forest and grassland areas is most notable in Guancen Mountain in the west and Yunzhong Mountain in the east of the study area. Since 2000, initiatives such as natural forest protection, the conversion of cultivated land to forest, and the Three-North Shelterbelt construction project in Ningwu County have led to rapid recovery of forestry ecology, along with effective protection of wetlands and biodiversity. Cultivated land continues to be converted, primarily to grassland, which constitutes 44.44% of the total converted area. A significant portion of cultivated land is situated on the alluvial plains at the sources of the Fen River and Sanggan River. To promote ecological restoration, the government has encouraged the conversion of cultivated land—characterized by severe soil erosion, low yield, and desertification—to natural grassland. The Tianchi Lake Group, located in the eastern part of the study area, is unique in northern China. Through a series of effective ecological protection policies, the water area of the Tianchi Lake Group has increased from 0.71 to 1.36 km2.
3.2 Contribution of driving factors
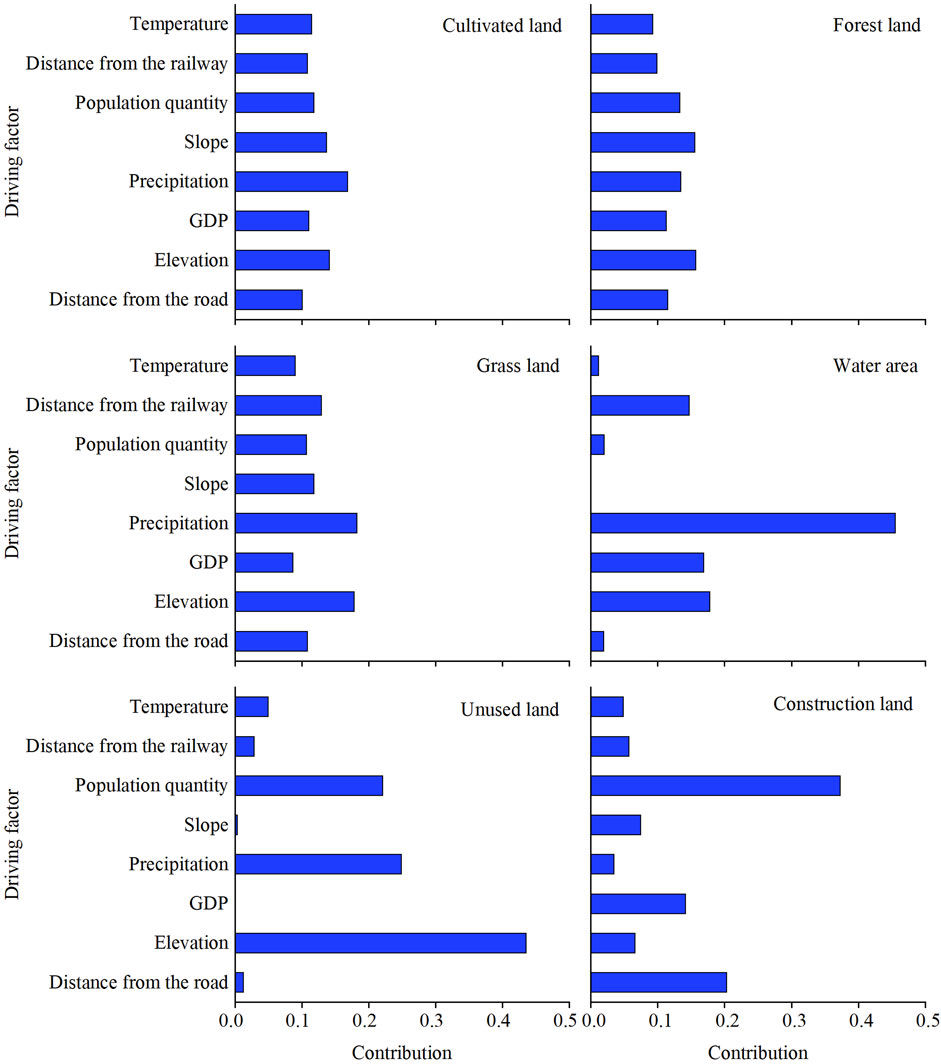
Human activity constitutes the primary catalyst for land use change, influenced within the bounds of natural factors (Xie et al., 2023). The impacts of these driving factors on the expansion of cultivated land, forestland, and grassland exhibit similarities. Precipitation exerts a marginally greater influence on cultivated land (0.17) and grassland (0.18) expansion compared to that of other factors (Figure 6). Conversely, elevation and slope (both 0.16) exert a slightly higher influence on forestland expansion than other factors. Changes in water area display a significant correlation with the precipitation factor (0.46), while elevation predominantly influences unused land (0.44). Urbanization, inherently tied to human activities, is chiefly influenced by population (0.37) and GDP (0.14), emerging as the most influential drivers of construction land expansion.
3.3 Prediction of land use changes
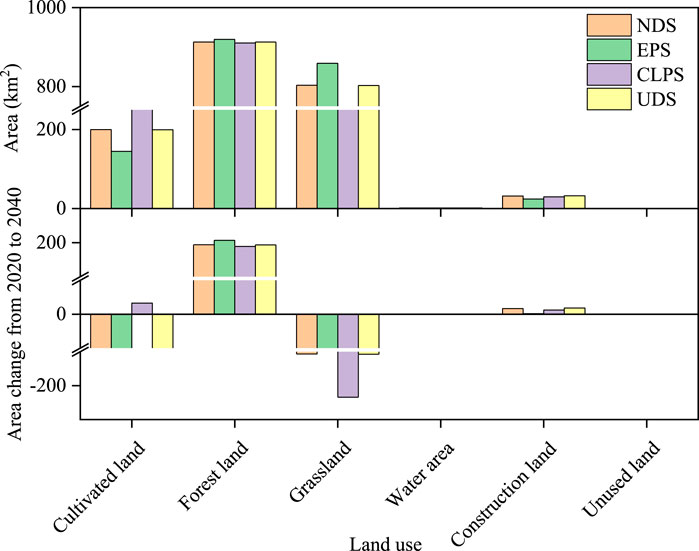
According to the NDS, it is projected that by 2040, forest land, water area, and construction land will increase by 197.02, 0.05, and 8.25 km2, respectively (Figure 7). Conversely, cultivated land, grassland, and unused land are anticipated to decrease by 51.95, 153.23, and 0.13 km2, respectively. These projections align closely with the actual trends observed from 1990 to 2020. In the EPS scenario, the conversion of cultivated land and construction land is anticipated to be limited by 2040, with cultivated land experiencing the greatest reduction, a decrease of 106.91 km2. In contrast, forest land is expected to see the highest increase, reaching 203.58 km2. Notably, the projected increase in construction land is minimal (0.81 km2) in the EPS, indicating effective control over the expansion of construction land under ecological protection priority. In contrast, under the CLPS scenario, the area of cultivated land is predicted to increase by 16.39 km2 by 2040, while grassland is expected to undergo a significant decrease to 217.05 km2. This decline is attributed to the conversion of a substantial area of grassland to cultivated land and forest land. Compared to other scenarios, under the UDS, the area of construction land increases by 9.08 km2, but there is no rapid expansion of urbanization. This phenomenon may be attributed to the region’s topographical constraints and the local government’s efforts to implement policies focused on ecological restoration and green development.
3.4 Carbon storage in Ningwu County from 1990 to 2020
From 1990 to 2020, CS spatial distribution in Ningwu County was highest in the northwest, second highest in the southeast, and lowest in the middle region (Figure 8). In 1990, the mountainous area west of the study area consisted mainly of cultivated land, grassland, and forest land, and their CS was higher than that of the plains in the middle of the study area. Under the effective supervision policies and protection measures of the relevant local governments, the area of cultivated land in the west of the study area continued to transfer to other land use types, until 2020, and forest land and grassland further increased, leading to an increase in carbon reserves in the west of the study area.
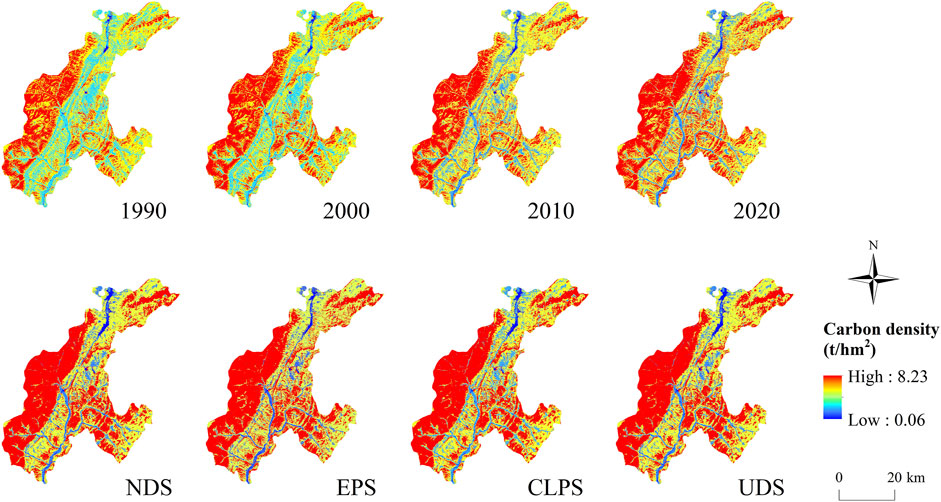
Figure 8. Spatial distribution of carbon storage from 1990 to 2020 and four development scenarios in 2040.
The carbon density of the study area increased by 0.49 t/hm2 from 1990 to 2020. CS in 1990, 2000, 2010, and 2020 was 1.20 × 10⁶, 1.22 × 10⁶, 1.26 × 10⁶, and 1.29 × 10⁶ t, respectively. There is an increase of 9.47 × 10⁴ t from 1990 to 2020 (Figure 9). CS in forest and construction land continued to rise from 1990 to 2020, while that of cultivated land continued to decline, and CS in grassland fluctuated during this period (Figure 9B). In 2020, land-use types contributed to total CS in the following order: grassland > forest land > cultivated land > construction land. Among these, forest land and grassland accounted for 85.82% of the area of the county, with their CS representing 91.83% of the total CS. Therefore, forest and grassland are the primary carbon reservoirs in the study area. CS in water areas and unused land can be disregarded due to their small areas.
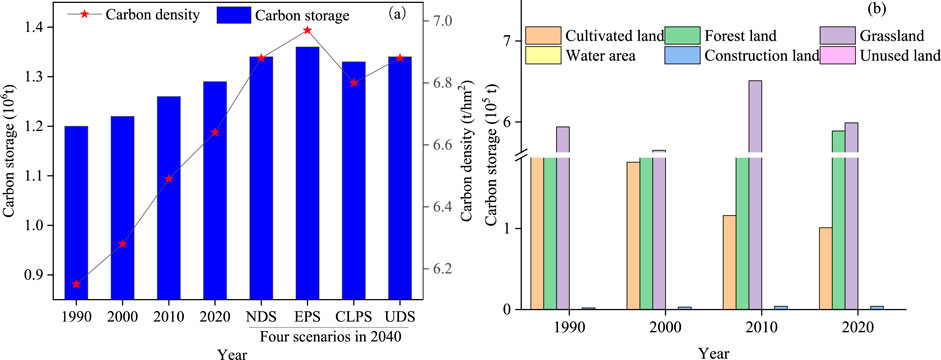
Figure 9. (A) Change of carbon storage from 1990 to 2040. (B) Carbon storage in different land use types from 1990 to 2020.
3.5 Carbon storage under different prediction scenarios in Ningwu County
The CS in the study area showed a similar trend with an obvious increase under the four prediction scenarios (Figure 8). In the western of the study area, carbon reserves increased obviously, while there were obvious differences in vegetation distribution and CS capacity between hillsides and valleys in the eastern, because under long-term ecological protection and supervision, vegetation on mountain slopes had good soil and water conservation functions and CS capacity became stronger. Compared to 2020, the CS in the study area showed an upward trend in each of the four land-use scenarios in 2040 (Figure 9A). The total CS in the EPS was 1.36 × 10⁶ t, an increase of 6.39 × 10³ t, which was the largest increase compared to the other scenarios. In the EPS, the predicted carbon density was 6.97 t/hm2, which is an increase of 0.33 t/hm2. The last increase in CS was under the CLPS, with 1.33 × 10⁶ t of carbon and carbon density 6.80 t/hm2, representing an increase of 3.22 × 10⁴ t and 0.17 t/hm2 respectively (Figure 9A). Therefore, EPS can be considered the best development model for enhancing the CS of ecosystems in Ningwu County.
In the four land use scenarios, the CS of construction land, unused land, and water area was less than 10% of the total CS; whereas forest land accounted for more than 55% of the CS and grassland more than 30% (Figure 10). Compared with the values in 2020, the CS of cultivated land increased by 6.59 × 10³ t under the CLPS; in contrast, the CS decreased under the other three scenarios. Due to the massive transfer of grassland to cultivated land under the CLPS, grassland CS decreased the most among the four scenarios. In contrast, the CS of forest land increased the most under the EPS, with an increment of 1.68 × 10⁵ t.
3.6 Spatial autocorrelation analysis of carbon storage
Moran’s I values of the CS distribution from 2020 to 2040 in the study area were all greater than zero (Table 5), indicating a certain global spatial autocorrelation. Compared to 2020, the spatial agglomeration effect of CS in the NDS, EPS, CLPS, and UDS in 2040 was enhanced, and areas with high and low values tended to gradually clump together in the spatial distribution.
Local spatial autocorrelation analysis showed that the spatial distribution of CS under the NDS, EPS, CLPS, and UDS in 2040 was similar to that in the study area in 2020 (Figure 11). The spatial distribution of CS is closely related to land use. The high-value accumulation area of CS was mostly located in the western part of the study area with rich forest resources and high vegetation coverage. The low-value accumulation area of CS was concentrated with the distribution of construction land in the north of the study area, where human activities were relatively intensive.
3.7 Spatial distribution of cold and hot spots in carbon storage
Getis-Ord Gi* analysis showed that the proportion of cold spots under NDS, CLPS, and UDS in 2040 was 4.11, 3.99, and 4.32%, respectively. Note the decrease in low CS accumulation areas in EPS (Figure 12). These low-value CS accumulation areas showed more than 95% confidence and they were mainly distributed in the construction land-intensive areas in the north of the study area. Under the four development scenarios, there were no significant differences in the agglomeration distribution of high-CS. The total area proportions of the hot spots were 6.05, 5.12, 5.07, and 6.60%, respectively. Some hot spots were significantly concentrated at the forest edge of the study area, and the rest were more evenly distributed in the plains of the study area.
4 Discussion
4.1 Driving factors on the carbon storage
The implementation of ecological protection measures can better realize the CS in the YRB. Previous research (Yang et al., 2021) suggested that the CS increased obviously under the EPS in the southern, eastern and Qinling regions of the Loess Plateau, Lvliang Mountain and Taihang Mountain, and changed from “spot” high value region to “area” high value region. The mountainous areas on the east and west of the study area were mainly forest land and grassland, which provided unique natural conditions for the growth of natural forests because of its steep mountain topography and high elevation (Ma et al., 2021). Shanxi Province attaches great importance to resource protection and the management of natural forests, with high forest land coverage, low degradation, and strong CS capacity (Chu et al., 2019). The central part of the study area is flat and is the most affected by human activities. The main land uses are construction and cultivation, and the overall CS capacity is poor (Chuai et al., 2015). Tianchi Lake Group, as a key ecological management project and key tourism project in Ningwu County, had undergone a certain degree of tourism development after ecological protection, and the regional CS showed a trend of initial increase followed by a decrease. However, the distribution of carbon sources in the Fen River and Sanggan River Basin is concentrated and plays a key role in the carbon cycle. By 2040, the source of Fen River and Sanggan River Basin will have the largest CS capacity in the YRB because of its large area of forestland (Crockett et al., 2021; Xu et al., 2023). Xi et al. (2023) also suggested that forest land, grassland, and cultivated land were important land use types that determine regional carbon balance.
Under the combined action of GDP, population size, annual average precipitation and annual average temperature, the type of land use in the YRB changed obviously (Xu et al., 2023). In this study, there were some differences in the explanatory power of the different factors driving the changes in CS, and the difference in the spatial distribution of CS was affected by both natural and socioeconomic factors (Duarte-Guardia et al., 2020). The explanatory power of different driving factors on CS of the study area in 2020 was in the following order (Table 6): X10>X1>X4>X2>X3>X6>X8>X9>X12>X5>X7. The distance from construction land, elevation, annual average temperature, slope, and annual average precipitation were the main factors affecting CS and also inferred that human activities were the main factors affecting CS, followed by topography and climate change. The study of CS in the YRB showed that elevation, temperature, and precipitation are the main factors that affect the spatial pattern of CS (Sun et al., 2023). In addition to human activity factors, it is basically consistent with this study. In the future development, we should pay attention to the relationship between urbanization and ecological environment protection, and should not blindly carry out urban expansion and development.
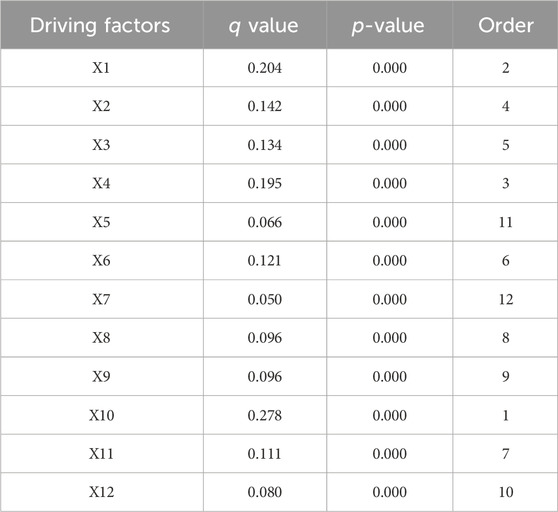
Table 6. Detection results of spatial differentiation driving factors of carbon storage of Ningwu County in 2020.
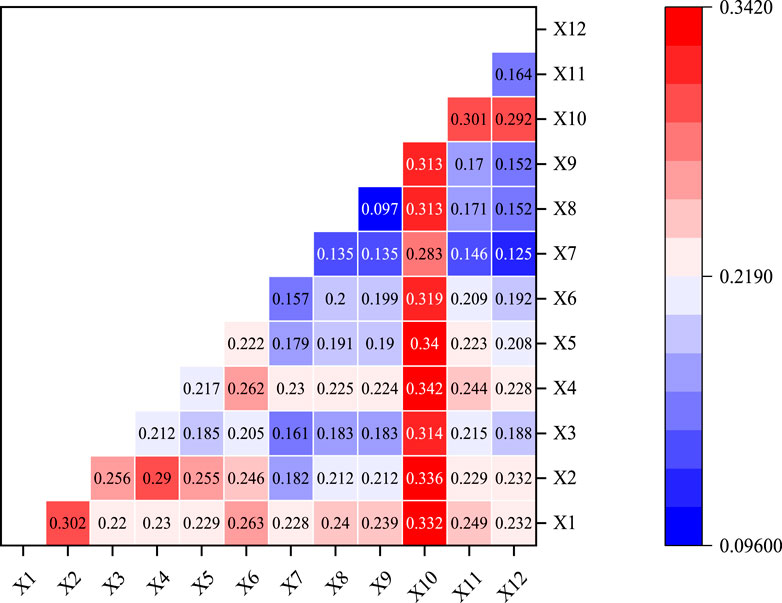
The interaction between the two factors was mainly manifested as two-factor enhancement (Table 4), and only the interaction between the slope and the distance factor from the road was nonlinear enhancement, indicating that the spatial differentiation of CS in the study area was the result of different driving factors (Figure 13). Among them, the q value of the interaction between GDP and population density was only 0.097, whereas that of the interaction of the other factors was greater than 0.10. The q value of the interaction between distance from construction land and slope of the dominant factor was 0.314, and the explanatory power is the highest. The distance from construction land reflects the influence of human activity intensity, while the slope directly affects the natural processes such as topography and soil erosion, which together promote the spatial differentiation of CS in the study area. Moreover, the interaction between the distance from the construction land and other factors is also relatively strong, and the explanatory power is about 30%. In addition, the interaction between elevation and slope, as well as between slope and annual average temperature was also strong. High elevation and large slopes lead to a reduction in human activities, and abundant precipitation can enhance the vegetation coverage and plant growth capacity of the study area, thus increasing CS in the study area (Chen et al., 2023). From the view of network topology, increasing the ecological corridor between ecological nodes can realize the optimization of vegetation ecological space network and provide the CS capacity of vegetation (Fang et al., 2021). In addition, some land management measures such as tending thinning, closing, fertilization, and returning farmland to grassland can also increase the CS of forest or grassland (Bustamante et al., 2014).
4.2 Limitations
In this study, we adopted the PLUS model to simulate future land use changes based on historical changes in land use in the study area. To a certain extent, the simulation results can objectively infer the future trend of land use change; however, some problems have to do with subjectivity in the model parameters and scenario setting. In a follow-up study, future climate change and socioeconomic development should be considered, as well as scenarios of increased development. The carbon density data in this study are mainly determined by relevant literature, and there may be errors in the results of calculation and simulation. In the future, the accuracy of carbon density can be improved through small-scale experiments: 1) the carbon density parameters of land use types can be corrected; 2) the dynamic change trend of carbon density of regional land use type is determined by sampling in different years, the future carbon density change is predicted, and the more accurate carbon density parameter setting is corrected and determined to improve the accuracy of prediction.
5 Conclusion
In this study, the PLUS-InVEST model was employed to investigate the impact of land use changes on CS in Ningwu County, Shanxi Province, from 1990 to 2020. By constructing various development scenarios (NDS, EPS, CLPS, UDS), this study predicts changes in land use and their potential impacts on CS. Furthermore, the research elucidates the spatiotemporal distribution trends of CS and the primary driving factors. The conclusions are as follows:
(1) The main land use type in Ningwu County is grassland, followed by forest land, cultivated land and construction land, and the proportion of unused land and water area is very small. From 1990 to 2020, the area of forest land and construction land shows a yearly increasing trend, while the area of cultivated land decreases year by year; a total of 28.55% of the land is transferred to other land use types during the 30-year period, and the transfer of land types mainly occurs between cultivated land, forest land and grassland. Cultivated land has been continuously transferred out, with grassland as the main type of land transferred out, while the main type of land transferred out of grassland is forest land, indicating that the relevant departments in Ningwu County are continuously promoting ecological restoration work.
(2) In the four future scenarios projected for 2040, there is an overall increasing trend in forest land, water area and construction land, and a decreasing trend in grassland and unused land. Only the area of cultivated land continues to grow under CLPS compared to the other three development scenarios. Under the NDS scenario, forest land increases the most and grassland area decreases the least. Under the UDS scenario, construction land increased the most. By comprehensively analysing a total of eight categories of driving factors from socio-economic and climatic environments, this study reveals that changes in land use patterns are jointly influenced by natural and economic factors. Among them, population growth and economic development are important drivers for the expansion of construction land.
(3) From 1990 to 2020, the total CS in Ningwu County continues to increase, from 1.20 × 10⁶ t to 1.29 × 10⁶ t. The CS in Ningwu County under all four future development scenarios is higher than that in 2020, and the CS is highest under the EPS scenario at 1.36 × 10⁶ t, and lowest under the CLPS scenario at 1.33 × 10⁶ t, which suggests that the ecological protection measures implementation can improve the CS rate in Ningwu County. By detecting the influencing factors, the factors with the main influence on the CS in the region were the distance from construction land, elevation, annual average temperature, slope, and annual average precipitation, while the interaction between distance from construction land and slope had the greatest influence on the spatial differentiation of CS. These indicated that human activities, topography, and climate change jointly affect the distribution of CS in the study area.
Data availability statement
The original contributions presented in the study are included in the article/supplementary material, further inquiries can be directed to the corresponding author.
Author contributions
SF: Methodology, Writing–original draft, Writing–review and editing. ZZ: Conceptualization, Writing–review and editing. HZ: Methodology, Writing–original draft. BW: Writing–review and editing. QQ: Writing–original draft.
Funding
The author(s) declare that financial support was received for the research, authorship, and/or publication of this article. This research was funded by the Fundamental Research Program of Shanxi Province (grant number 202103021224135).
Conflict of interest
The authors declare that the research was conducted in the absence of any commercial or financial relationships that could be construed as a potential conflict of interest.
Publisher’s note
All claims expressed in this article are solely those of the authors and do not necessarily represent those of their affiliated organizations, or those of the publisher, the editors and the reviewers. Any product that may be evaluated in this article, or claim that may be made by its manufacturer, is not guaranteed or endorsed by the publisher.
References
Adelisardou, F., Zhao, W., Chow, R., Mederly, P., Minkina, T., and Schou, J. S. (2022). Spatiotemporal change detection of carbon storage and sequestration in an arid ecosystem by integrating Google Earth Engine and InVEST (the Jiroft plain, Iran). Int. J. Environ. Sci. Technol. 19 (7), 5929–5944. doi:10.1007/s13762-021-03676-6
Adnan, M., Xiao, B., Bibi, S., Xiao, P., Zhao, P., and Wang, H. (2024). Addressing current climate issues in Pakistan: an opportunity for a sustainable future. Environ. Challenges 15, 100887. doi:10.1016/j.envc.2024.100887
Alam, S. A., Starr, M., and Clark, B. J. F. (2013). Tree biomass and soil organic carbon densities across the Sudanese woodland savannah: a regional carbon sequestration study. J. Arid Environ. 89, 67–76. doi:10.1016/j.jaridenv.2012.10.002
Beroho, M., Briak, H., Cherif, E. K., Boulahfa, I., Ouallali, A., Mrabet, R., et al. (2023). Future scenarios of land use/land cover (LULC) based on a CA-markov simulation model: case of a mediterranean watershed in Morocco. Remote Sens. 15 (4), 1162. doi:10.3390/rs15041162
Bhatt, R., Singh, P., and Kaur, G. (2022). “Soil management vis-à-vis carbon sequestration in relation to land use cover/change in terrestrial ecosystem—a review,” in Managing plant production under changing environment. Editors M. Hasanuzzaman, G. J. Ahammed, and K. Nahar (Singapore: Springer Nature Singapore), 43–78. doi:10.1007/978-981-16-5059-8_3
Bijalwan, A., Swamy, S. L., Sharma, C. M., Sharma, N. K., and Tiwari, A. K. (2010). Land-use, biomass and carbon estimation in dry tropical forest of Chhattisgarh region in India using satellite remote sensing and GIS. J. For. Res. 21 (2), 161–170. doi:10.1007/s11676-010-0026-y
Bustamante, M., Robledo-Abad, C., Harper, R., Mbow, C., Ravindranat, N. H., Sperling, F., et al. (2014). Co-benefits, trade-offs, barriers and policies for greenhouse gas mitigation in the agriculture, forestry and other land use (AFOLU) sector. Glob. Change Biol. 20 (10), 3270–3290. doi:10.1111/gcb.12591
Chen, G., Yang, Y., Liu, L., Li, X., Zhao, Y., and Yuan, Y. (2007). Research review on total belowground carbon allocation in forest ecosystems. J. Subtrop. Resour. Environ. 2, 34–42. doi:10.19687/j.cnki.1673-7105.2007.01.005
Chen, S., Ma, M., Wu, S., Tang, Q., and Wen, Z. (2023). Topography intensifies variations in the effect of human activities on forest NPP across altitude and slope gradients. Environ. Dev. 45, 100826. doi:10.1016/j.envdev.2023.100826
Chu, X., Zhan, J., Li, Z., Zhang, F., and Qi, W. (2019). Assessment on forest carbon sequestration in the Three-North Shelterbelt Program region, China. J. Clean. Prod. 215, 382–389. doi:10.1016/j.jclepro.2018.12.296
Chuai, X., Huang, X., Wang, W., Zhao, R., Zhang, M., and Wu, C. (2015). Land use, total carbon emissions change and low carbon land management in Coastal Jiangsu, China. J. Clean. Prod. 103, 77–86. doi:10.1016/j.jclepro.2014.03.046
Crockett, E. T., Vennin, S., Botzas-Coluni, J., Larocque, G., and Bennett, E. M. (2021). Bright spots of carbon storage in temperate forests. J. Appl. Ecol. 58 (12), 3012–3022. doi:10.1111/1365-2664.14042
Dass, A., Mishra, A. K., Santos, G. A. d.A., and Ranjan, R. K. (2024). Spatio-temporal variation of atmospheric CO2 and its association with anthropogenic, vegetation, and climate indices over the state of Bihar, India. Environ. Adv. 16, 100513. doi:10.1016/j.envadv.2024.100513
Duarte-Guardia, S., Peri, P., Amelung, W., Thomas, E., Borchard, N., Baldi, G., et al. (2020). Biophysical and socioeconomic factors influencing soil carbon stocks: a global assessment. Mitig. Adapt. Strategies Glob. Change 25 (6), 1129–1148. doi:10.1007/s11027-020-09926-1
Ersoy Mirici, M., and Berberoglu, S. (2024). Terrestrial carbon dynamics and economic valuation of ecosystem service for land use management in the Mediterranean region. Ecol. Inf. 81, 102570. doi:10.1016/j.ecoinf.2024.102570
Fang, M., Si, G., Yu, Q., Huang, H., Huang, Y., Liu, W., et al. (2021). Study on the relationship between topological characteristics of vegetation ecospatial network and carbon sequestration capacity in the Yellow River Basin, China. Remote Sens. 13 (23), 4926. doi:10.3390/rs13234926
Giardina, C. P., and Ryan, M. G. (2000). Evidence that decomposition rates of organic carbon in mineral soil do not vary with temperature. Nature 404 (6780), 858–861. doi:10.1038/35009076
Hasan, S. S., Zhen, L., Miah, M. G., Ahamed, T., and Samie, A. (2020). Impact of land use change on ecosystem services: a review. Environ. Dev. 34, 100527. doi:10.1016/j.envdev.2020.100527
He, J., Shi, X., Fu, Y., and Yuan, Y. (2020). Evaluation and simulation of the impact of land use change on ecosystem services trade-offs in ecological restoration areas, China. Land Use Policy 99, 105020. doi:10.1016/j.landusepol.2020.105020
Hernández-Guzmán, R., Ruiz-Luna, A., and González, C. (2019). Assessing and modeling the impact of land use and changes in land cover related to carbon storage in a western basin in Mexico. Remote Sens. Appl. Soc. Environ. 13, 318–327. doi:10.1016/j.rsase.2018.12.005
Hu, B., Kang, F., Han, H., Cheng, X., and Li, Z. (2021). Exploring drivers of ecosystem services variation from a geospatial perspective: insights from China’s Shanxi Province. Ecol. Indic. 131, 108188. doi:10.1016/j.ecolind.2021.108188
Isazade, E., Abdelkhair, F. Y. F., Isazade, V., Alavi, S. A., Ray, S., Kaplan, G., et al. (2024). Empowering local communities with strategies for monitoring and eliminating poverty in urban areas (Case study, District 9 of Tehran). doi:10.21203/rs.3.rs-4325671/v1
Ismaili Alaoui, H., Chemchaoui, A., El Asri, B., Ghazi, S., Brhadda, N., and Ziri, R. (2023). Modeling predictive changes of carbon storage using invest model in the Beht watershed (Morocco). Model. Earth Syst. Environ. 9 (4), 4313–4322. doi:10.1007/s40808-023-01697-3
Juliani, I. P., and Nasution, H. (2024). Spatial autocorrelation analysis using the Moran and LISA index on the spread of malaria disease in North Sumatra Province. J. Lebesgue J. Ilm. Pendidik. Mat. Mat. Dan. Stat. 5 (1), 154–164. doi:10.46306/lb.v5i1.543
Kuang-hu, D., Wen-jun, G., Gang, L., Guo-hua, R., Yong-xin, W., Bin-bin, Z., et al. (2017). Estimation on carbon distribution and storage of typical natural grassland in Shanxi province. Acta Agrestia Sin. 25 (1), 69–75. doi:10.11733/j.issn.1007-0435.2017.01.011
Li, C., Wu, Y., Gao, B., Zheng, K., Wu, Y., and Li, C. (2021). Multi-scenario simulation of ecosystem service value for optimization of land use in the Sichuan-Yunnan ecological barrier, China. Ecol. Indic. 132, 108328. doi:10.1016/j.ecolind.2021.108328
Li, P., Chen, J., Li, Y., and Wu, W. (2023). Using the InVEST-PLUS model to predict and analyze the pattern of ecosystem carbon storage in liaoning province, China. Remote Sens. 15 (16), 4050. doi:10.3390/rs15164050
Liang, X., Guan, Q., Clarke, K. C., Liu, S., Wang, B., and Yao, Y. (2021). Understanding the drivers of sustainable land expansion using a patch-generating land use simulation (PLUS) model: a case study in Wuhan, China. Comput. Environ. Urban Syst. 85, 101569. doi:10.1016/j.compenvurbsys.2020.101569
Liu, B., Pan, L., Qi, Y., Guan, X., and Li, J. (2021). Land use and land cover change in the Yellow River Basin from 1980 to 2015 and its impact on the ecosystem services. Land 10 (10), 1080. doi:10.3390/land10101080
Liu, K., Zhang, C., Zhang, H., Xu, H., and Xia, W. (2023). Spatiotemporal variation and dynamic simulation of ecosystem carbon storage in the Loess Plateau based on PLUS and InVEST models. Land 12 (5), 1065. doi:10.3390/land12051065
Ma, S., Qiao, Y.-P., Wang, L.-J., and Zhang, J.-C. (2021). Terrain gradient variations in ecosystem services of different vegetation types in mountainous regions: vegetation resource conservation and sustainable development. For. Ecol. Manag. 482, 118856. doi:10.1016/j.foreco.2020.118856
Mendoza-Ponce, A., Corona-Núñez, R., Kraxner, F., Leduc, S., and Patrizio, P. (2018). Identifying effects of land use cover changes and climate change on terrestrial ecosystems and carbon stocks in Mexico. Glob. Environ. Change 53, 12–23. doi:10.1016/j.gloenvcha.2018.08.004
Nel, L., Boeni, A. F., Prohászka, V. J., Szilágyi, A., Tormáné Kovács, E., Pásztor, L., et al. (2022). InVEST soil carbon stock modelling of agricultural landscapes as an ecosystem service indicator. Sustainability 14 (16), 9808. doi:10.3390/su14169808
Nunes, L. J. R. (2023). The rising threat of atmospheric CO2: a review on the causes, impacts, and mitigation strategies. Environments 10 (4), 66. doi:10.3390/environments10040066
Piyathilake, I. D. U. H., Udayakumara, E. P. N., Ranaweera, L. V., and Gunatilake, S. K. (2022). Modeling predictive assessment of carbon storage using InVEST model in Uva province, Sri Lanka. Model. Earth Syst. Environ. 8 (2), 2213–2223. doi:10.1007/s40808-021-01207-3
Qiao, Q., Zhen, Z., and Lin, Y. (2023). Assessment and simulation of thermal environments in Taiyuan urban built-up area, China. Front. Ecol. Evol. 11. doi:10.3389/fevo.2023.1261291
Qiu, S., Fang, M., Yu, Q., Niu, T., Liu, H., Wang, F., et al. (2023). Study of spatialtemporal changes in Chinese forest eco-space and optimization strategies for enhancing carbon sequestration capacity through ecological spatial network theory. Sci. Total Environ. 859, 160035. doi:10.1016/j.scitotenv.2022.160035
Ren, X., Pei, T., Chen, Y., Xie, B., and Cheng, D. (2021). Impact of land use change on carbon storage in Gansu Province based on carbon density correction. Ecol. Sci. 40 (4), 66–74. doi:10.14108/j.cnki.1008-8873.2021.04.008
Sharp, R., Douglass, J., Wolny, S., Arkema, K., Bernhardt, J., Bierbower, W., et al. (2018). InVEST user’s guide, integrated valuation of ecosystem services and tradeoffs (version 3.5. 0)[Software], the natural capital project. Stanford University, University of Minnesota, The Nature Conservancy, and World Wildlife Fund.
Song, Y., Wang, J., Ge, Y., and Xu, C. (2020). An optimal parameters-based geographical detector model enhances geographic characteristics of explanatory variables for spatial heterogeneity analysis: cases with different types of spatial data. GIScience and Remote Sens. 57 (5), 593–610. doi:10.1080/15481603.2020.1760434
Sun, B., Du, J., Chong, F., Li, L., Zhu, X., Zhai, G., et al. (2023). Spatio-Temporal variation and prediction of carbon storage in terrestrial ecosystems in the Yellow River Basin. Remote Sens. 15 (15), 3866. doi:10.3390/rs15153866
Voumik, L. C., Mimi, M. B., and Raihan, A. (2023). Nexus between urbanization, industrialization, natural resources rent, and anthropogenic carbon emissions in south asia: CS-ARDL approach. Anthropocene Sci. 2 (1), 48–61. doi:10.1007/s44177-023-00047-3
Wang, B., Fu, S., Hao, Z., and Zhen, Z. (2024). Ecological security pattern based on remote sensing ecological index and circuit theory in the Shanxi section of the Yellow River Basin. Ecol. Indic. 166, 112382.
Wang, J., Wu, Y., and Gou, A. (2023). Habitat quality evolution characteristics and multi-scenario prediction in Shenzhen based on PLUS and InVEST models. Front. Environ. Sci. 11. doi:10.3389/fenvs.2023.1146347
Wang, S.-Y., Liu, J.-S., and Ma, T.-B. (2010). Dynamics and changes in spatial patterns of land use in Yellow River Basin, China. Land Use Policy 27 (2), 313–323. doi:10.1016/j.landusepol.2009.04.002
Xi, F., Lin, G., Zhao, Y., Li, X., Chen, Z., and Cao, C. (2023). Land use optimization and carbon storage estimation in the Yellow River Basin, China. Sustainability 15 (14), 11278. doi:10.3390/su151411278
Xiang, S., Wang, Y., Deng, H., Yang, C., Wang, Z., and Gao, M. (2022). Response and multi-scenario prediction of carbon storage to land use/cover change in the main urban area of Chongqing, China. Ecol. Indic. 142, 109205. doi:10.1016/j.ecolind.2022.109205
Xiao, Y., Ma, D., Zhang, F., Zhao, N., Wang, L., Guo, Z., et al. (2023). Spatiotemporal differentiation of carbon emission efficiency and influencing factors: from the perspective of 136 countries. Sci. Total Environ. 879, 163032. doi:10.1016/j.scitotenv.2023.163032
Xie, Q., Han, Y., Zhang, L., and Han, Z. (2023). Dynamic evolution of land use/land cover and its socioeconomic driving forces in wuhan, China. Int. J. Environ. Res. Public Health 20 (4), 3316. doi:10.3390/ijerph20043316
Xu, C., Zhang, Q., Yu, Q., Wang, J., Wang, F., Qiu, S., et al. (2023). Effects of land use/cover change on carbon storage between 2000 and 2040 in the Yellow River Basin, China. Ecol. Indic. 151, 110345. doi:10.1016/j.ecolind.2023.110345
Yang, J., Xie, B., and Zhang, D. (2021). Spatio-temporal evolution of carbon stocks in the Yellow River Basin based on InVEST and CA-Markov models. Chin. J. Eco-Agriculture 29 (6), 1018–1029. doi:10.13930/j.cnki.cjea.200746
Yu, Y., Zhang, J., and Wang, M. (2008). Study on changes in forest biomass carbon storage in Shanxi province. For. Grassl. Resour. Res. 0 (6), 35–39. doi:10.13466/j.cnki.lyzygl.2008.06.004
Yu, Z., Ciais, P., Piao, S., Wang, J., Houghton, R. A., Lu, C., et al. (2022). Forest expansion dominates China’s land carbon sink since 1980. Nat. Commun. 13, 5374. doi:10.1038/s41467-022-32961-2
Zhang, D., Zhao, Y., and Wu, J. (2023). Assessment of carbon balance attribution and carbon storage potential in China's terrestrial ecosystem. Resour. Conservation Recycl. 189, 106748. doi:10.1016/j.resconrec.2022.106748
Zhang, J., Yang, J., Liu, P., Liu, Y., Zheng, Y., Shen, X., et al. (2024). Effects of land use/cover change on terrestrial carbon stocks in the Yellow River Basin of China from 2000 to 2030. Remote Sens. 16 (10), 1810. doi:10.3390/rs16101810
Keywords: PLUS model, InVEST model, carbon storage, land use, Fen River, Sanggan River
Citation: Fu S, Zhen Z, Zhou H, Wang B and Qiao Q (2024) Spatio-temporal evolution and prediction of carbon storage at the source of the Fen River and Sanggan River based on a PLUS-InVEST model. Front. Environ. Sci. 12:1449576. doi: 10.3389/fenvs.2024.1449576
Received: 17 June 2024; Accepted: 30 October 2024;
Published: 13 November 2024.
Edited by:
Shuisen Chen, Guangzhou Institute of Geography, ChinaReviewed by:
Wenfeng Gong, Hainan University, ChinaRuei-Yuan Wang, Guangdong University of Petrochemical Technology, China
Yujie Liu, Northern Arizona University, United States
Copyright © 2024 Fu, Zhen, Zhou, Wang and Qiao. This is an open-access article distributed under the terms of the Creative Commons Attribution License (CC BY). The use, distribution or reproduction in other forums is permitted, provided the original author(s) and the copyright owner(s) are credited and that the original publication in this journal is cited, in accordance with accepted academic practice. No use, distribution or reproduction is permitted which does not comply with these terms.
*Correspondence: Zhilei Zhen, emhlbmNoZW5nQHN4YXUuZWR1LmNu
 Shaotong Fu
 Zhilei Zhen
 Haoyan Zhou
 Qiong Qiao