 Robby Yussac Tallar
 Golan Geldoffer Mauregar
 Eishi Hirose2
- 1Department of Hydrology and Fluid Mechanic Labotatory, Universitas Kristen Maranatha, Maranatha Christian University, Bandung, Indonesia
- 2Department of Japanese Culture, Universitas Kristen Maranatha, Maranatha Christian University, Bandung, Indonesia
Previous research on watershed assessments has primarily emphasized general hydrological or technical findings, neglecting the spatiotemporal analysis of land-use change and its influence on surface runoff. This study addresses this gap by using a geographic information system (GIS)-based method to analyze surface runoff variations due to land-use change on Tsushima Island, Japan. By leveraging spatiotemporal analysis within a GIS framework, the study interprets satellite imagery (Landsat 8 data, 2014–2024) to assess land use and watershed characteristics. This approach culminates in a comprehensive map depicting potential flood risk across the island. In conclusion, this study offers an advanced method for communicating potential flood risks to the public and policymakers, enabling proactive mitigation strategies for the coming decade.
Introduction
Modernization promotes infrastructure such as highways, settlements, and office buildings to support economic growth. It requires the opening of new land, resulting in the disappearance of forests and agricultural land. The decrease in soil capacity to absorb rainwater as a result of this land disruption, combined with high precipitation caused by climate change, increases the risk of flood disasters (Else, 2021; Lukić, 2023; Sabelli, 2023). Despite the decrease in the number of flood disasters in post-World War II Japan, climate change in the 21st century and the development of industrial and settlement areas again increase the risk.
Tsushima Island, a small island located between mainland Japan and South Korea, is an interesting case study for examining the impact of land-use change on surface runoff. This island, from a geographical perspective, is categorized as an isolated island. It has a complex tapestry of habitats that support a diversified flora and fauna. However, Tsushima Island has a number of environmental concerns that demand proactive responses. Tsushima, as an island ecology, is naturally more vulnerable to environmental change than mainland areas. Land-use changes and climate change threat can have a greater impact on the delicate hydrological balance. Additionally, changes in precipitation patterns could exacerbate flood risks. Accessing resources and knowledge for environmental monitoring and management is difficult due to Tsushima’s distant location.
Given these distinct vulnerabilities, a thorough understanding of how land-use changes affect surface runoff is critical for Tsushima Island. This study seeks to bridge this information gap by using advanced geographic information system (GIS)-based approaches to examine spatiotemporal land-use changes and their possible impact on surface runoff patterns. The generated flood risk map will be an invaluable resource for local stakeholders in developing effective mitigation methods and ensuring the long-term viability of the island.
Advances in science and technology have made it possible to predict flood disasters with a variety of methods and parameters, for example, using the GIS (Karar, 2018; Zlatković et al., 2022). For more than three decades, flood potential analysis with the GIS has provided an accurate picture with an extensive area of analysis, in line with the availability of satellite image data (Giridhar and Viswanadh, 2009; Tallar and Mauregar, 2022; Popescu and Bărbulescu, 2023). The GIS can analyze water flows by collecting topographic data and Landsat 8 data for vegetation changes. These data will be managed and shared according to the river flow area (DAS) topographic analysis results. The water flow analysis is then done by adding rainfall data. Similar previous studies have shown the use of the GIS technique for flood potential analysis (Tallar and Mauregar, 2022). In this study, an analysis was conducted by enriching the land-use variables (water bodies, forest, open lands, and buildup). The other study also used GIS analysis conducted on Tsushima Island, Japan (Zhou, 2016; Niwa et al., 2022; Tashiro and Min, 2017), that uses land use and precipitation data from 2014. Based on this previous research, this study collected historical data from 2014 to 2024 and used the interactive supervised classification/color classification method for land-use determination.
The purpose of this study is 1) to conduct a runoff analysis using integrated GIS mapping with the main data parameters of land-use change and vegetation change so that its correlation can be observed and 2) to carry out a comprehensive integrated mapping of Tsushima Island for potential flood-causing saltwater; this mapping will be divided according to the area of river flow that is located throughout the island. In addition, Tsushima Island was selected as the research location due to the following reasons: 1) the location of the island has proven that topography, as well as high rainfall, makes the island vulnerable to flood disasters; 2) a strategic geographical location for the Japanese and Korean nations to do business and trade; it prompted the opening up of new land that could increase the potential for flooding; and 3) it is a historic island of ancient Japanese culture with important cultural heritage sites including temples and other archeological cysts.
Materials and methods
Study area
Tsushima Island, situated in the Korea Strait on the western edge of the Japanese main island, is geographically located in the middle of the two countries (Figure 1). Nevertheless, administratively, the island is part of Japan and belongs to Nagasaki Prefecture. With an area of 724.80 km2, the island stretches 18 km from east to west and 82 km from north to south, with a coastline of 915 km (Zhou et al., 2016; Yamaki and Kodera, 2020). Physically, Tsushima Island is divided into two parts, the northern and southern islands, which are connected by a bridge. The island topography is dominated by hills and mountains ranging in height from 100 to 650 m above sea level. Precipitation on Tsushima Island is generally higher than that on the main islands of Japan due to its remote location and being surrounded by a vast ocean. This exposes the island to humid sea air from all sides, which then releases rain as it passes over the hills and mountains on the island.
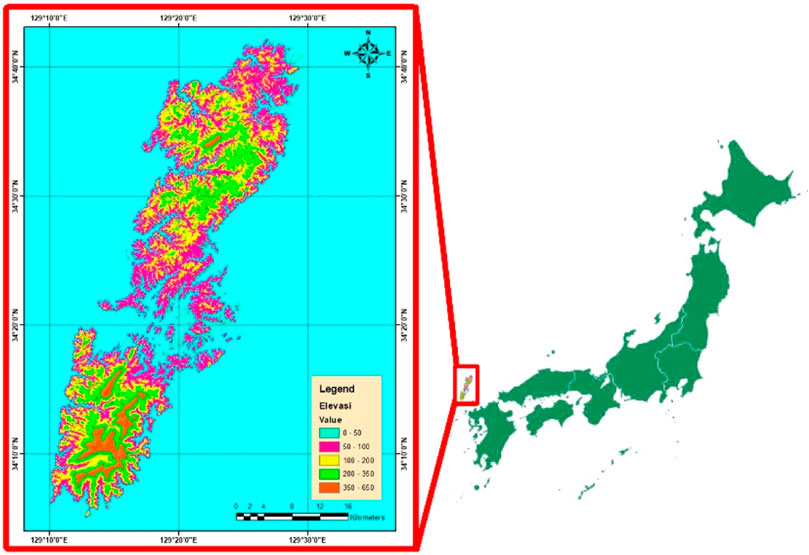
Figure 1. Location of the study area.
Source material and data processing
This study utilizes data from 2013 to 2023, encompassing three main datasets: rainfall, digital elevation model (DEM), and Landsat 8. Precipitation data were obtained from the Japan Meteorological Agency (JMA) using the Izuhara rain gauge station (WMO ID: 47800) as a reference. This rain gauge station is located at coordinates 34°11.8′N 129°17.5′E. The DEM data were acquired from the United States Geological Survey (USGS) EarthExplorer website using the Global Multi-resolution Terrain Elevation Data (GMTED 2010) dataset. Landsat data were obtained from the same website using the Landsat 8-9 Operational Land Imager and Thermal Infrared Sensor Collection 2 Level-1 dataset.
The use of the GIS to determine land use using the interactive supervised classification or color classification method is an appropriate method; however, this method has a limitation when it is used to review historical or annual data because the condition of satellite image data is relatively not ideal or consistent in the same season but in different years. Thus, it will reduce the accuracy of this method. Therefore, GIS techniques combined with other platforms such as Google Earth Pro can improve the results, and the accuracy of this method can be maximized.
Normalized difference vegetation index
The normalized difference vegetation index (NDVI) data are representative of the land-use data on Tsushima Island, which are divided into three classes, as shown in Table 1.
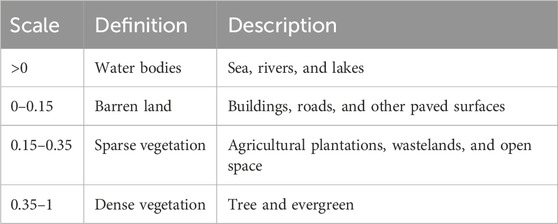
Table 1. Classification of the normalized difference vegetation index (NDVI).
Land-use data will be utilized to identify the runoff coefficient (c) value through the interpolation of land-use composition with the watershed area. The runoff coefficient is classified into three classes, as shown in Table 2.
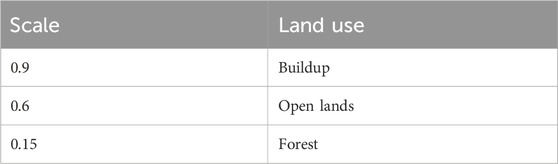
Table 2. Runoff coefficient classification (c).
River network data were obtained after analyzing the DEM and then performing spatial analyst hydrology modeling using ArcGIS. The result of this modeling will produce a river network that can then be developed into a watershed.
Methodology
After the DEM and Landsat data were collected and analyzed using ArcGIS, the parameters used to analyze the runoff discharge (Q) were obtained. The data were then divided by the drainage area (A) to obtain the runoff ratio. This ratio is classified into three potential classes, as shown in Table 3.
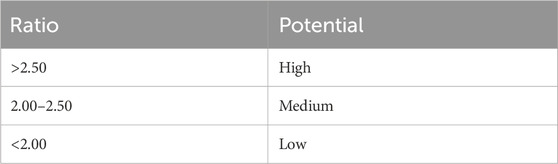
Table 3. Ratio risk of runoff (c).
The overall runoff classification methodology is given in Figure 2.
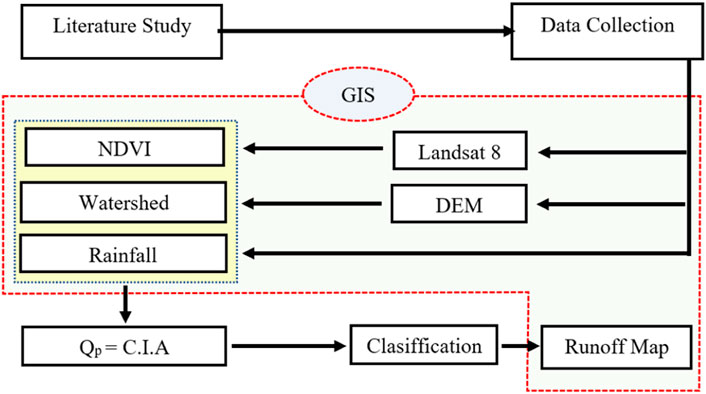
Figure 2. Methodology of research.
Results and discussion
Tsushima Island, an archipelago with high humidity levels, experiences higher annual precipitation than the national average of Japan, which is 1,700 mm/year. Data on the precipitation of Tsushima Island from 2013 to 2023 indicate an average annual precipitation of 2,625.2 mm/year (Fujibe, et al., 2005). The precipitation trend over the past 10 years shows an increase of 0.53%, which is in line with the findings of the JMA that reported an increase of −6.6% ± 6% in precipitation over the past century for the entire Japanese territory. The results are given in Figure 3.
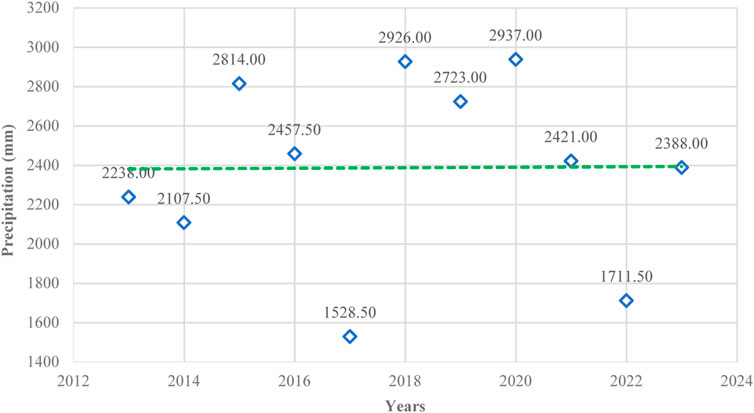
Figure 3. Precipitation and trendline of Tsushima, 2013–2023.
In this modeling, we obtained an area of river flow of 11 sections, which are given in Figure 4.
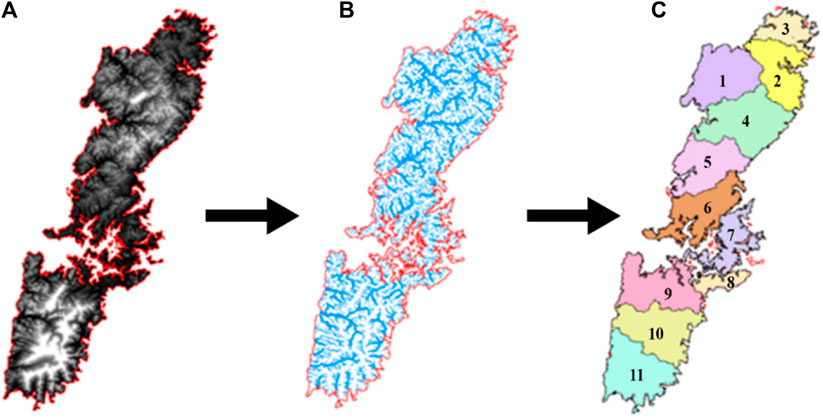
Figure 4. Watershed digital analysis process using ArcGIS. (A) Digital elevation model; (B) river flow; (C) and sections of the watershed.
The results of this watershed division, which are given in Table 4, can be divided as follows: Sections 1–7 comprise the northern part of Tsushima Island, while sections 8–11 comprise the southern part of Tsushima Island.
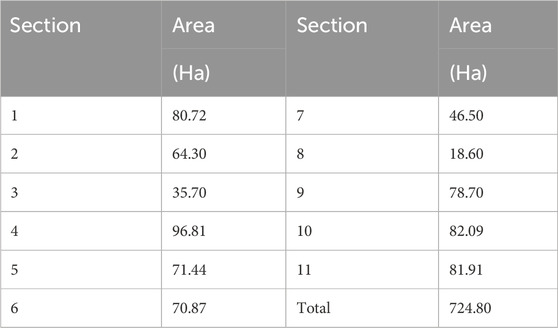
Table 4. Segregation section area.
Normalized difference vegetation index variability trends
Figure 5 presents the NDVI data trend from 2013 to 2023. A linear forecasting approach on the three datasets indicates that barren land and sparse vegetation experienced annual percentage increases of 8.29% and 7.75%, respectively. Meanwhile, dense vegetation experienced a decrease of −7.82%. It is observed that dense vegetation and sparse vegetation are interconnected; an increase in dense vegetation has an inverse effect on sparse vegetation. On the other hand, barren land experienced a significant increase in 2018. The data from 2019 to 2023 show a decrease, but they were not always cumulatively above 5%. In contrast to the data from 2013 to 2017, which were below 5%, the development of barren land is permanent. Furthermore, an analysis of the NDVI trend in each section from 2024 to 2034 reveals a change in the percentage of each NDVI classification.
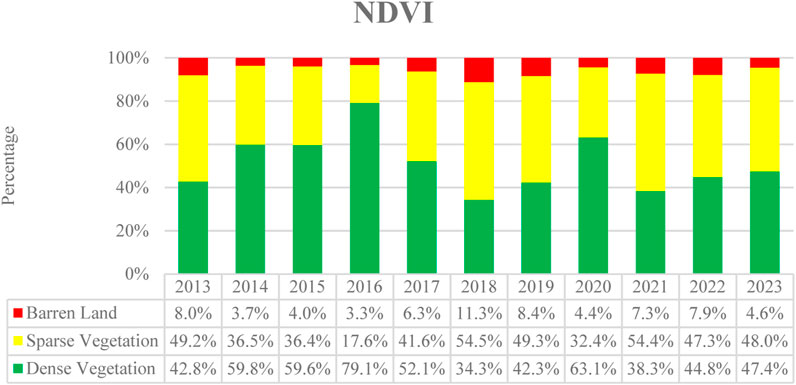
Figure 5. NDVI data presentation of Tsushima Island, 2013–2023.
The analysis of the data presented in Table 5 shows an average decrease of 37.7% in the area of dense vegetation over the next 10 years. This decrease has implications for the increase in the area of sparse vegetation and barren land. On average, the area of sparse vegetation increases by 46.9%, and the area of barren land increases by 14.9%.
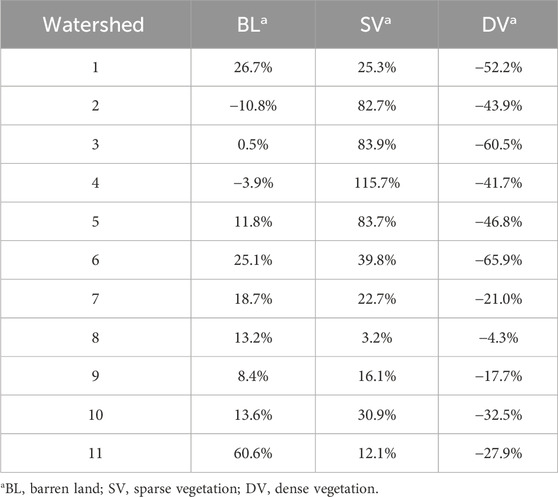
Table 5. Percentage of NDVI change between 2024 and 2034.
Runoff analysis
Runoff analysis for the period 2024–2034 showed an increase in runoff debit in each section with a different growth presentation, as shown in Table 6. The growth of sections 2–5 was consistently above 49% compared to 2024. This significant increase is closely linked to a decrease in dense vegetation in the section that reached more than 40% in the next 10 years.
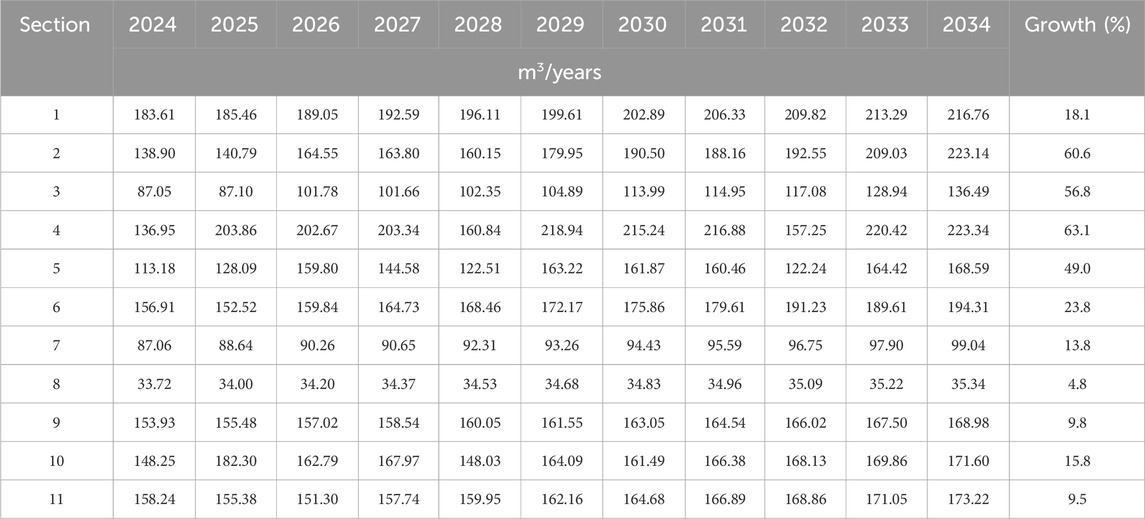
Table 6. Trend of runoff discharge.
Potential risk
The results given in Table 7 on the potential risk classification show an increase in risk in each area, with the exception of areas 8 and 11, which show consistency at the low-risk level. This increase in risk is directly proportional to the expected land-use change, which has a significant impact on runoff water discharge.
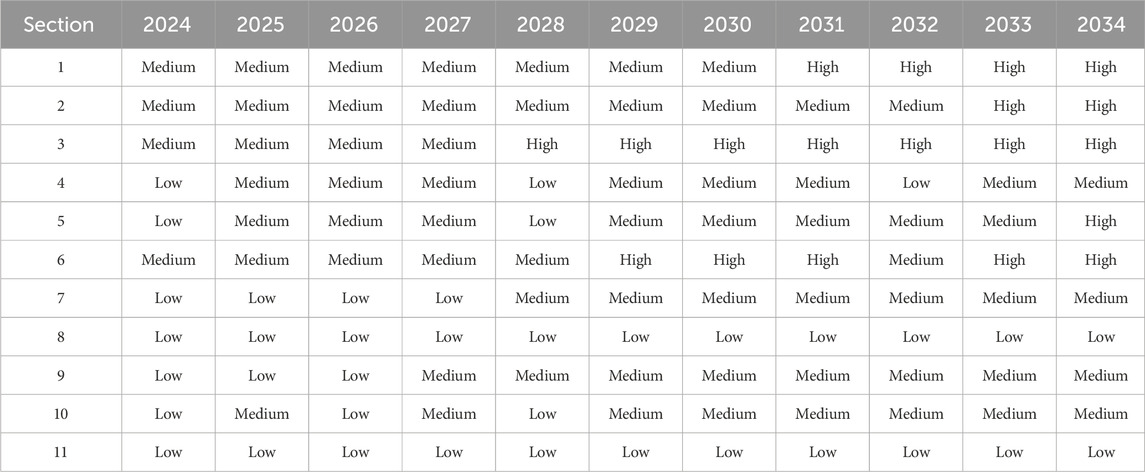
Table 7. Potential risk of Tsushima, 2024–2034.
The analysis of the potential and risk of Tsushima Island land in the next decade revealed some important findings. First, the size of low-potential areas is predicted to decrease significantly, from 476.09 ha in 2024 to 100.51 ha by 2034, or decrease by 78.89%. This decrease is accompanied by an increase in the area size of medium-risk areas, from 251.56 acres in 2024 to 520.59 acres by 2034 or an increase of 106.95%. However, in 2034, the area of medium risk again decreases to 304.13 ha, along with the development of areas with high potential. Second, by 2024, there are no high-risk areas yet. However, by 2034, high-risk areas are predicted to emerge with an area of 323.01 ha. This is due to land-use changes in the three major cities on the island, namely, Kamitsushima City, Kamiagatamachi City, and Toyotamamachi City. The city, which has international trade ports connecting Japan and Korea, undergoes land-use change from green and open land to residential and industrial land, thereby increasing potential risks. Third, sections 1–6, which lie in the northern part of Tsushima Island, are predicted to be a high-potential area by 2034, except for section 4. This is due to land-use changes in the three major cities. Fourth, sections 7–11, which lie in the southern part of Tsushima Island, are predicted to have improved status from low to medium. By 2034, the area with high potential in the southern part of the island will not be detected. However, areas 9 and 10 have the fastest potential for elevation to high-risk status as the largest city of Mitsushimaten lies there, which has a crossing port and an international airport. This could potentially lead to future land-use changes.
Overall, the Tsushima Island land potential and risk map for the next decade shows significant changes in the potential and risk categories in various parts of the island. This needs to be considered in land planning and management on Tsushima Island so that it can be carried out in a sustainable manner, as shown in Figure 6.
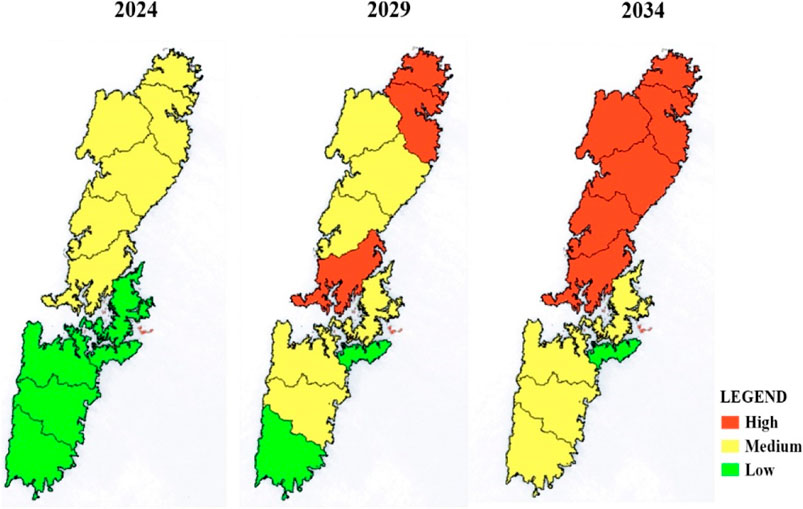
Figure 6. Runoff potential map: 2024, 2029, and 2034.
Conclusion
This study highlights the significant impact that land-use change can have on runoff discharge in a specific area. It predicts that the potential for high runoff discharge overflow will increase over the next decade. However, it emphasizes that excessive runoff does not necessarily indicate a flood-prone area as other factors contribute to such disasters. The study suggests that topographic conditions and urban land-use planning and systems can help reduce the potential for runoff discharge. This study also offers a modest and effective methodology by using a GIS-based method for surface runoff analysis, incorporating factors like land-use change, rainfall data, topography, and satellite imagery analysis. This is a significant advancement compared to the general hydrological or technical approaches used previously. The study also presents improved communication by creating a comprehensive mapping of potential flooding status, which is a valuable tool for public education and policymaking related to flood mitigation efforts. Policymakers can use the potential maps presented in this study to understand the potential for excessive runoff discharge and develop strategies to mitigate future disasters. Lastly, this study provides an advanced approach to communicate information on potential flooding status to the public and related policymakers in the study area so that they can produce some related regulations for mitigation efforts.
Data availability statement
The original contributions presented in the study are included in the article/Supplementary Material; further inquiries can be directed to the corresponding author.
Author contributions
RT: writing–original draft and writing–review and editing. GM: data curation, software, and writing–review and editing. EH: project administration, supervision, and writing–review and editing.
Funding
The author(s) declare that financial support was received for the research, authorship, and/or publication of this article. The authors acknowledge LPPM Maranatha, Universitas Kristen Maranatha (Maranatha Christian University), Indonesia, and under collaboration research with the Hydraulics and Ocean Engineering Department, National Cheng Kung University, Taiwan R.O.C.
Conflict of interest
The authors declare that the research was conducted in the absence of any commercial or financial relationships that could be construed as a potential conflict of interest.
Publisher’s note
All claims expressed in this article are solely those of the authors and do not necessarily represent those of their affiliated organizations, or those of the publisher, the editors, and the reviewers. Any product that may be evaluated in this article, or claim that may be made by its manufacturer, is not guaranteed or endorsed by the publisher.
References
Ahmad, K. (2018). Application of Remote Sensing and GIS for Flood Hazard Management: A Case Study of Bihar (India): A Case Study of Bihar (India). Contemp. Soc. Sci. 27 (2), 69–77. doi:10.29070/27/57466
Else, H. (2021). Climate Change Implicated in Germany’s Deadly Floods. Nature. doi:10.1038/d41586-021-02330-y
Fujibe, F., Yamazaki, N., Katsuyama, M., and Kobayashi, K. (2005). The Increasing Trend of Intense Precipitation in Japan Based on Four-Hourly Data for a Hundred Years. SOLA 1, 41–44. doi:10.2151/sola.2005-012
Giridhar, M. V. S. S., and Viswanadh, G. K. (2009). “Evaluation of Land Use Land Cover Changes in Palleru (K-11) Sub Basin of River Krishna Using GIS and NDVI,” in World Environmental and Water Resources Congress 2009. Kansas City, MO: American Society of Civil Engineers. doi:10.1061/41036(342)381
Lukić, A. (2023). Gis Analysis of The Vulnerability of Flash Floods in the Porečka River Basin (Serbia). Archives Tech. Sci. 1 (28), 57–68. doi:10.59456/afts.2023.1528.057l
Niwa, K., Tran, D. V., and Nishikawa, K. (2022). Differentiated Historical Demography and Ecological Niche Forming Present Distribution and Genetic Structure in Coexisting Two Salamanders (Amphibia, Urodela, Hynobiidae) in a Small Island, Japan. PeerJ 10, e13202. doi:10.7717/peerj.13202
Popescu, C., and Bărbulescu, A. (2023). Floods Simulation on the Vedea River (Romania) Using Hydraulic Modeling and GIS Software: A Case Study. Water 15 (3), 483. doi:10.3390/w15030483
Sabelli, C. (2023). Examining the Role of Climate Change in the Emilia-Romagna Floods. Nat. Italy. doi:10.1038/d43978-023-00082-z
Tallar, R. Y., and Golan, M. G. (2022). A Micro-Scale Study of Flood Risk Assessment in Urban Fluvial Areas Using the Flood Potential Index. Front. Environ. Sci. 10. doi:10.3389/fenvs.2022.846450
Tashiro, T., and Min, A. K. (2017) “Flood Risks and Their Management in Urban Japan—Modeling Inner Flooding in Tsushima City, Tokai Region,” in Towards the Implementation of the New Urban Agenda. Switzerland: Springer International Publishing, 117–126. doi:10.1007/978-3-319-61376-5_9
Yamaki, Go, and Kodera, K. (2020). River Water Quality and Basin Environment on Islands in Nagasaki Prefecture: Mainly in Tsushima, Iki and Hirado Islands. J. Isl. Stud. 21 (2), 167–178. doi:10.5995/jis.21.2.167
Zhou, S., Chen, G., Fang, L., and Nie, Y. (2016). GIS-Based Integration of Subjective and Objective Weighting Methods for Regional Landslides Susceptibility Mapping. Sustainability 8 (4), 334. doi:10.3390/su8040334
Keywords: Tsushima Island, geographic information system, land use, normalized difference vegetation index, runoff
Citation: Tallar RY, Mauregar GG and Hirose E (2024) Spatiotemporal analysis of land-use change and its impact on surface runoff in Tsushima Island, Japan. Front. Environ. Sci. 12:1448542. doi: 10.3389/fenvs.2024.1448542
Received: 13 June 2024; Accepted: 08 July 2024;
Published: 26 July 2024.
Edited by:
Jaan H. Pu, University of Bradford, United KingdomReviewed by:
Shivashankar Mali, Jayawant Shikshan Prasarak Mandal (JSPM), IndiaManish Pandey, Indian Institute of Technology Kharagpur, India
Copyright © 2024 Tallar, Mauregar and Hirose. This is an open-access article distributed under the terms of the Creative Commons Attribution License (CC BY). The use, distribution or reproduction in other forums is permitted, provided the original author(s) and the copyright owner(s) are credited and that the original publication in this journal is cited, in accordance with accepted academic practice. No use, distribution or reproduction is permitted which does not comply with these terms.
*Correspondence: Robby Yussac Tallar, cm9iYnl5dXNzYWNAeWFob28uY29t