 Weichun Gao
 Wei He1,2,3
95% of researchers rate our articles as excellent or good
Learn more about the work of our research integrity team to safeguard the quality of each article we publish.
Find out more
ORIGINAL RESEARCH article
Front. Environ. Sci. , 14 October 2024
Sec. Environmental Economics and Management
Volume 12 - 2024 | https://doi.org/10.3389/fenvs.2024.1447728
This article is part of the Research Topic Urban Carbon Emissions and Anthropogenic Activities View all 17 articles
China’s rapid urbanization has significantly impacted carbon emissions in rural areas, driving the need for region-specific carbon management strategies to achieve the country’s dual carbon goals. However, previous research has primarily focused on large urban centers, leaving a gap in understanding the spatial and temporal patterns of carbon emissions at the county level in rural regions. This study focuses on the Guanzhong region of Shaanxi Province and develops a county-level carbon emission accounting system based on geographic, socio-economic, and land-use data. The carbon emissions are categorized into energy, industrial processes, agriculture, and waste management. Key findings indicate that industrial and residential sectors are the primary contributors to carbon emissions, with Xi’an being the largest emitter. Carbon emission intensity follows a ranking of Xi’an < Weinan < Baoji < Xianyang < Tongchuan. Spatial patterns show a “core-edge” distribution, with higher emissions in urban centers and lower emissions in rural areas. The study also highlights the carbon sink potential in the southern Qinling National Park. This research provides a valuable framework for rural low-carbon development and offers critical insights for policymakers aiming to balance carbon reduction and economic growth in rural China.
Greenhouse gases from agricultural, livestock and industrial sectors is the main reasons of climate change (Abbas et al., 2022b; Abbas et al., 2022a; Abbas et al., 2023; Ullah et al., 2022; Abam et al., 2023; Elahi et al., 2024a; Elahi et al., 2024b). Global climate change has always been one of the most pressing problems faced by the world (Sage, 2020). Controlling greenhouse gas emissions to slow down the pace of global warming has become a societal consensus. Climate change and sustainable development have become urgent and major issues requiring immediate attention (Ucal and Xydis, 2020; Zurek et al., 2022). As a result, governments and international organizations globally have proposed goals for carbon reduction and low-carbon development (Caetano et al., 2020; Wimbadi and Djalante, 2020; Li et al., 2022). China, the world’s largest developing country, has committed to peaking carbon emissions by 2030 and striving to achieve carbon neutrality before 2060 (Sun et al., 2022; Zhao, 2022). China’s rapid urbanization process has led to a significant increase in carbon emissions in rural areas. Recent studies have shown that between 2000 and 2015, rural carbon emissions increased by 4.2% annually, primarily due to increased infrastructure development, modernization of agriculture, and the adoption of urban energy consumption patterns in rural communities (Zhu et al., 2021; Guo et al., 2023). The construction of rural residential buildings and the expansion of rural transportation networks further contributed to this rise in emissions (Zhang et al., 2020; Xu et al., 2024).
At present, extensive research has been conducted on low-carbon ecological rural areas (Song et al., 2020; Wang C. et al., 2020; Wang et al., 2021), primarily focusing on carbon emission accounting (Harris et al., 2020), carbon emission spatialization (Sun et al., 2024), carbon emission spatiotemporal patterns (Lin et al., 2021), and low-carbon ecological rural evaluation models (Yu et al., 2023). This is because through the systematic accounting and evaluation of carbon emissions in rural areas, the current status and trends can be precisely determined. Such data provides a basis for formulating scientific emission reduction measures and policies. Meanwhile, rural carbon emission accounting helps to identify key sources of carbon emissions and potential areas for emission reduction, optimize resource allocation, and improve energy efficiency (Zhang et al., 2014). In addition, establishing and improving a rural carbon emission accounting system can enable rural areas to participate in national and regional carbon trading markets, realize economic benefits through carbon trading, and promote the green and low-carbon transformation of rural areas.
Comprehensive research on regional carbon emissions, both domestically and internationally, mainly utilizes the emission factor method for calculation (Shan et al., 2017). Based on the scale differences of the research areas, it is observed that carbon emission accounting research mainly focuses on macro scales such as national and provincial regions, cities, or micro scales such as individual buildings. However, research on carbon emission accounting at the village scale is scarce (Lai et al., 2022). There are significant differences and interactions among regions regarding carbon emission intensity. In optimizing resource allocation, adjusting industrial structure, and promoting the application of clean energy, agriculture is an important area for carbon emission reduction, and regions must consider regional characteristics when formulating carbon emission reduction policies (Chen et al., 2020). In addition, the spatiotemporal pattern of carbon emissions helps identify hotspots of carbon emissions. It also provides a scientific basis for evaluating the effectiveness of carbon reduction policies and formulating more effective carbon reduction strategies (Wang Y. et al., 2020). The low-carbon ecological rural evaluation model can not only effectively reduce greenhouse gas emissions, but also promote sustainable development of the rural economy and improve the quality of life of rural residents (Zhang et al., 2021). Although numerous studies have achieved certain results, there are still problems in rural research, such as the synchronous growth of carbon emissions caused by infrastructure construction, the significant driving effect of rural industrial development on carbon emissions, and the serious lack of low-carbon management and research capabilities in rural areas, resulting in relatively weak green and low-carbon awareness (Zhou et al., 2020). Therefore, promoting agricultural and rural emission reduction and carbon sequestration during the implementation of the rural revitalization strategy is a practical requirement and top priority for achieving the “dual carbon” goal.
However, existing research on quantitatively calculating greenhouse gas emissions in spatial regions mainly focuses on the national, provincial, and large city levels (Guo et al., 2023), or the individual building level. Research at the village level is scarce, which is not conducive to low-carbon rural development and planning. In addition, the Guanzhong region has actively responded to the national low-carbon development strategy in recent years (Guo, 2023), committing to rural low-carbon development and ecological civilization construction. Preliminary results have been achieved through measures such as promoting agricultural greening, optimizing the rural energy structure, and utilizing agricultural waste resources. There is relatively little research on the Guanzhong region. The Guanzhong region still faces challenges such as a single industrial structure, limited application of green and low-carbon technologies, and outdated rural energy facilities (Yu et al., 2022). In the context of accelerating urbanization, addressing the major challenge of achieving sustainable economic and social development while protecting the ecological environment is a prerequisite for promoting the low-carbon ecological rural evaluation system and planning strategies.
In order to address these issues, the Guanzhong region of Shaanxi Province is examined in this paper, and based on the analysis of its geography, natural conditions, land use status, and socio-economic conditions, a county-level carbon emission accounting system and carbon balance zoning evolution are meticulously constructed. This study offers theoretical and practical guidance for rural development in this region and similar areas under the dual carbon background, and also has important theoretical and practical value for promoting low-carbon development and ecological civilization construction in China and globally.
The object selected for this paper is located in the Guanzhong area of Shaanxi Province, positioned in the central part of Shaanxi Province and named after its location west of Hangu Pass. The geographical coordinates are approximately from 107° 40′E to 110° 10′E, and 33° 42′N to 35° 29′N. The Guanzhong Plain constitutes a part of the Loess Plateau in China. Due to the historical alluvial effect of the Yellow River, it has become a fertile plain area and is known as the “800 mile Qinchuan”. The Guanzhong region is bordered by the Liupan Mountains to the north, the Qinling Mountains to the south, the Longdong Mountains to the west, and the Wei River to the east, making it a transportation hub connecting the three major geographical regions of east, west, and north. The geographical location of the Guanzhong region endows it with unique strategic and economic value. It has been a battleground for military strategists and a political center in Chinese history since ancient times. It is also a focus of economic and cultural development, having a profound impact on the development of ancient Chinese civilization. Now, with the promotion of the national “Belt and Road” initiative (Zhu et al., 2024), the Guanzhong region has once again demonstrated its important strategic position, becoming an important transportation and economic corridor connecting China’s eastern coast and western inland, and even connecting Asia and Europe. Therefore, examining the Guanzhong region as the research object is both representative and highly significant.
The data used in this paper include DEM, basic geographic information, land use status, and socio-economic data. Among them, DEM data come from the geospatial data cloud platform; basic geographic information data mainly include water systems, residential areas, roads, etc., sourced from the National Geographic Information Resource Catalog Service System. The data on the current state of land use are sourced from the land use change survey data of Huayi District for 2010, 2015, and 2020; socio-economic data include population density data, POI data, GDP data, and energy consumption data, which are sourced from data platforms such as WorldPop, the Resource and Environmental Science and Data Center, as well as statistical yearbooks.
The IPCC has published a series of technical guidelines for carbon emission accounting methodology based on relevant standards and guidelines (Amon et al., 2021). Based on two major categories of natural emission sources and socio-economic emission sources, carbon emission sources are subdivided into six sectors: energy, industrial processes, solvent and other product use, land use change and forest land, agriculture, and waste. Further detailed emission projects are provided for each sector. Subsequently, a new inventory guide was published, which merges carbon sources into four sectors: energy activities, industrial processes and product use, agriculture, forestry and other land use, and waste.
Energy: The main source of carbon emissions from human activities is energy activities, which account for 80% of the total greenhouse gas emissions from human activities (Zhong et al., 2021). According to the guidelines, energy activities are divided into four parts: fixed source combustion, mobile source combustion, fugitive emissions, and carbon dioxide transportation, injection, and geological storage. Energy activities specifically involve the energy industry, manufacturing, transportation, coal mining, oil and gas extraction and processing, and other aspects (Mehedi et al., 2022).
Industrial processes and product use: They mainly include carbon emissions from production processes in industries such as mining, chemical, metal, non-energy products, electronics, and other product manufacturing and use (Chen et al., 2024). The greenhouse gas emissions in product use mainly involve the use of ozone-depleting substances and fluoride substitutes.
Agriculture, forestry, and other land use: Land use change and management can affect ecosystem processes, biological processes, and physical processes, leading to carbon and nitrogen conversion, which in turn affects greenhouse gas flows (Noda et al., 2024). Agriculture, forestry, and other land use mainly involves forest land, cultivated land, grassland, wetland, residential land, other land use, livestock and poultry manure management, and the application of lime and urea. Subsequently, estimation methods for greenhouse gas emissions and absorption in wetland drainage, wetland return, coastal wetlands, and constructed wetlands for sewage treatment were included.
Waste: Waste mainly includes urban solid waste, sludge, industrial waste, and other waste (Khan et al., 2022). During the waste disposal process, methane, carbon dioxide, non-methane volatile organic compounds, and relatively small amounts of nitrous oxide, nitrogen oxides, and carbon monoxide are produced.
The carbon emission accounting boundary of this study is limited to the administrative divisions within the study area, and the carbon exchange occurring within and outside the study area due to atmospheric activities falls outside the scope of this study’s accounting. Based on the energy activities of the Guanzhong Plain urban agglomeration and the availability of data, the carbon emission accounting system of this study is depicted in Figure 1.
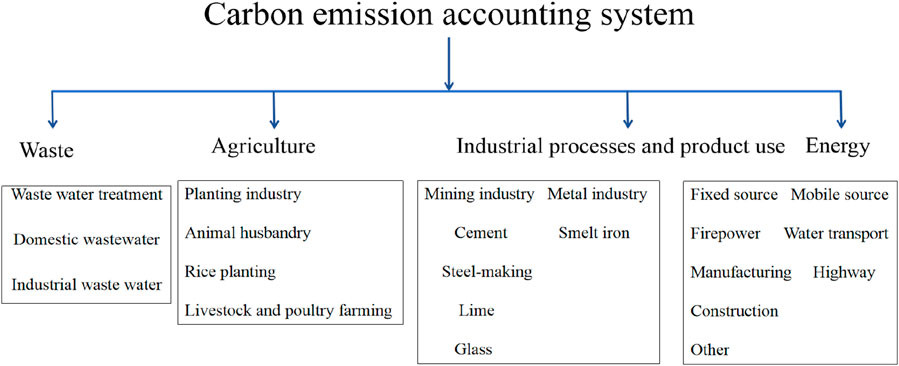
Figure 1. Carbon emission accounting inventory system.
This paper calculates carbon emissions using a carbon emission accounting checklist, incorporating the four aforementioned sectors. Energy: The calculation of carbon emissions from fossil fuels is shown in Equation 1 (Meng and Niu, 2011):
where
where EF is the carbon emission factor.
Table 1 provides the default values for commonly used fossil fuel-related parameters. Industrial processes and product use: Carbon emissions accounting for industrial processes and product usage mainly focuses on industries such as cement, steel, raw aluminum, and flat glass. Among these, the carbon emissions from the production process of cement clinker represent the most significant part of the carbon emissions from industrial processes and product usage (Na et al., 2024). Table 2 presents carbon emission products and emission factors for industrial processes.
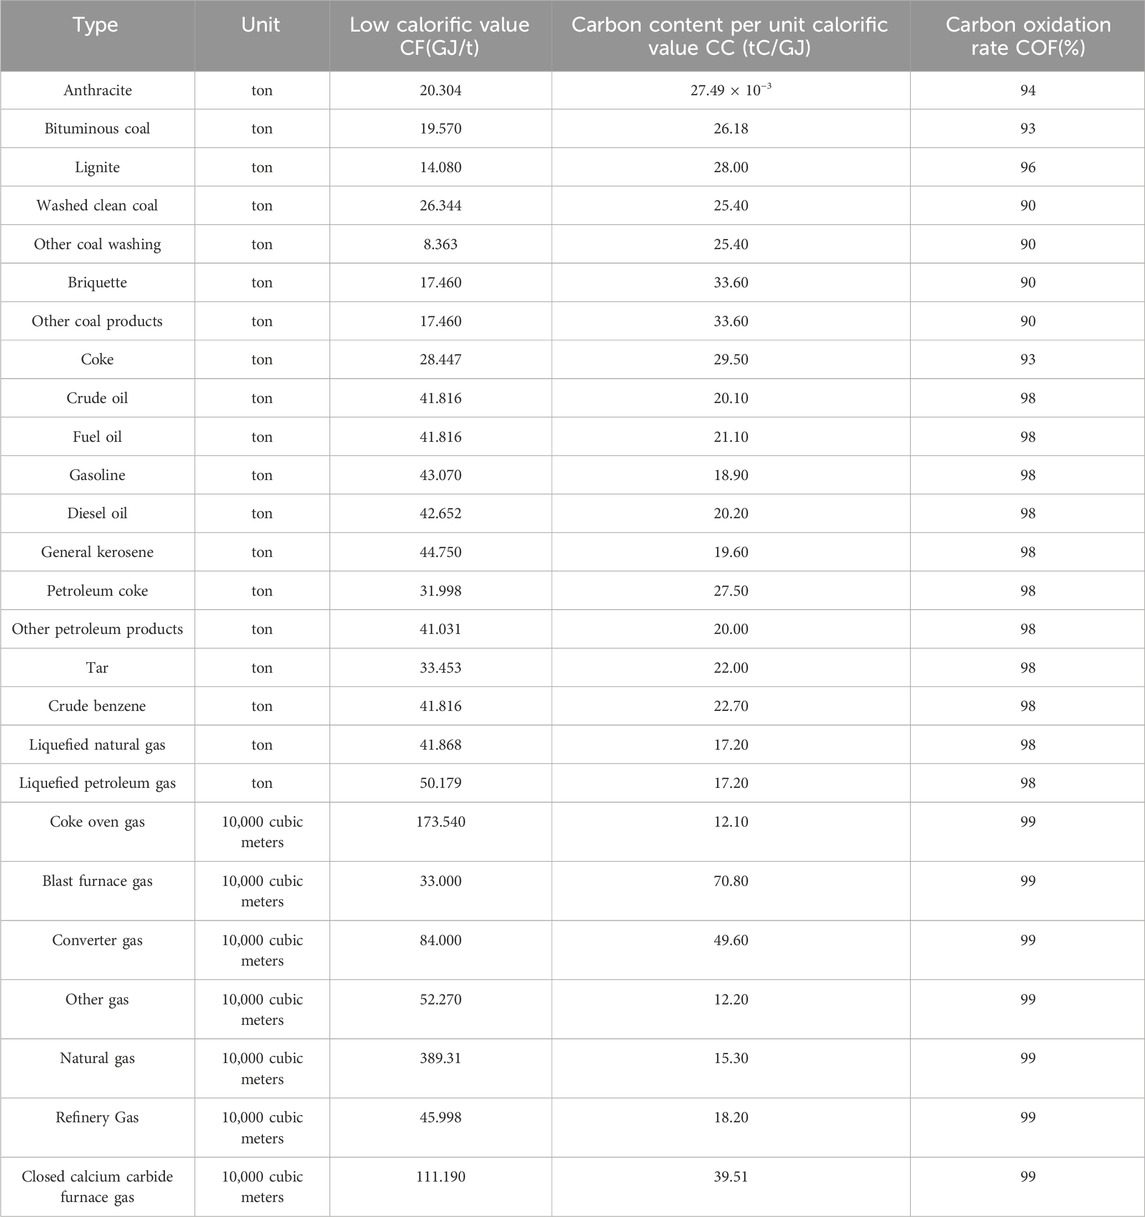
Table 1. Default values for fossil fuels.
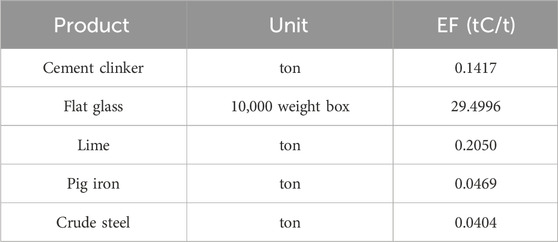
Table 2. Carbon emission products and emission factors in industrial processes.
Agricultural carbon emissions: Using the carbon emission coefficient method released by the IPCC and combining existing research results to calculate agricultural carbon emissions, the calculation is shown in Equation 3 (Meng et al., 2024).
where C is the total agricultural carbon emissions, Ci is the carbon emissions of each source category, Ti is the activity level of each source category,
Table 3 presents the carbon emissions from the planting and livestock industries, while Table 4 presents the agricultural carbon emission factors. Waste: Due to the availability of waste data, this paper only covers carbon emissions during the treatment process of industrial and domestic sewage treatment plants (Lv et al., 2022). The production of methane depends on the amount of degradable organic matter in wastewater. The commonly used parameters for determining the organic components of wastewater are Biochemical Oxygen Demand (BOD) and Chemical Oxygen Demand (COD). The reporting frequency of BOD in domestic wastewater is higher, while COD is mainly used for industrial wastewater. This paper calculates the carbon emissions related to sewage based on data from sewage treatment plants. The reduction of BOD (or COD) can be obtained by the concentration of BOD (or COD) in the inlet and outlet of the sewage treatment plant. The calculation of carbon emissions during sewage treatment and carbon emissions into the environment is shown in Equation 4 (Liu et al., 2023).
where CEw is the carbon emissions from sewage treatment, TOW is the total amount of organic matter in the wastewater in the inventory year, B0 is the maximum CH4 production, MCF is the methane correction factor. The default values are shown in Table 5.
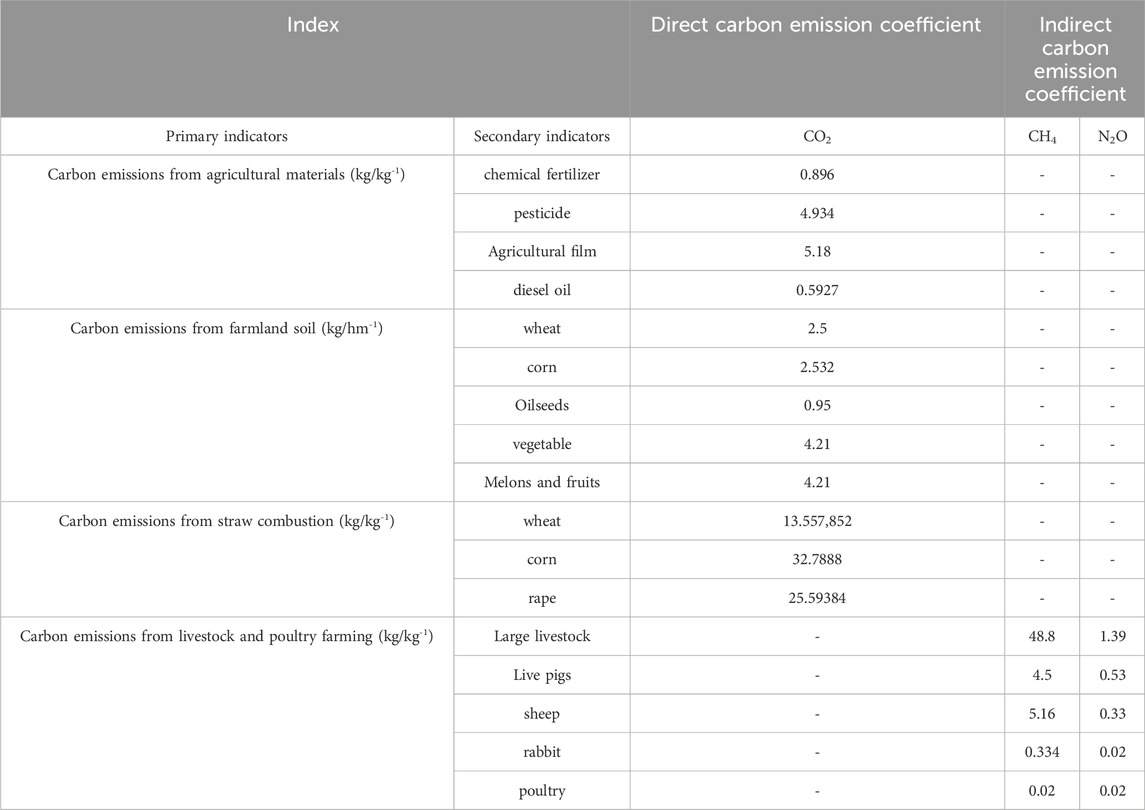
Table 3. Agricultural carbon emission calculation indicators.
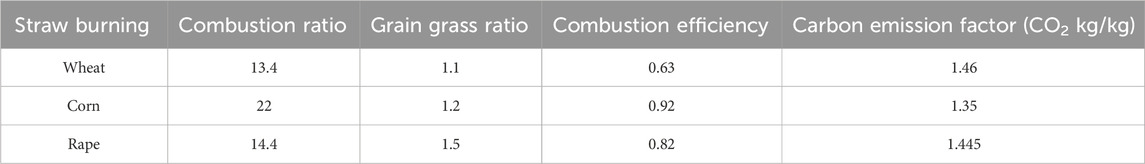
Table 4. Agricultural carbon emission factor.
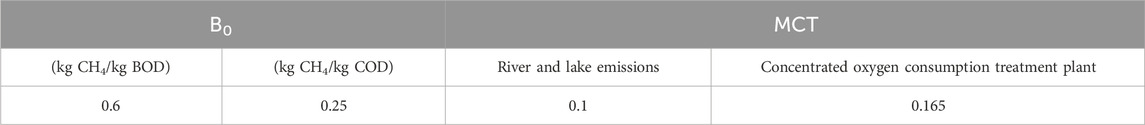
Table 5. Default values for waste related emission factors.
The total carbon emissions of each city are shown in Table 6. Table 6 shows that the industrial and living sectors in each city exhibit high carbon emissions, while the agricultural sector demonstrates low carbon emissions. Xi’an has the highest total carbon emissions and is at a relatively high level in all sectors. The total carbon emissions are as follows: Xi’an (29.8978 million tons) > Baoji (9.837 million tons) > Weinan (7.2974 million tons) > Tongchuan (3.4849 million tons) > Xianyang (3.3163 million tons). Xi’an records the highest carbon emissions, especially in its domestic and industrial sectors, which are 7.301 million tons and 13.4619 million tons, respectively. This is attributed to its population size and industrial activity intensity. The total carbon emissions of Xianyang and Baoji are relatively high, while the total carbon emissions of Tongchuan and Weinan are relatively low due to their smaller populations (Meng et al., 2023). The carbon emissions statistics for each city are shown in Figure 2.
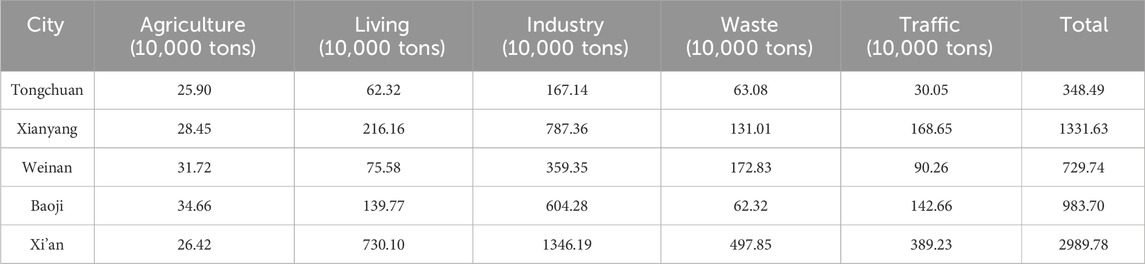
Table 6. Total carbon emissions of each city.
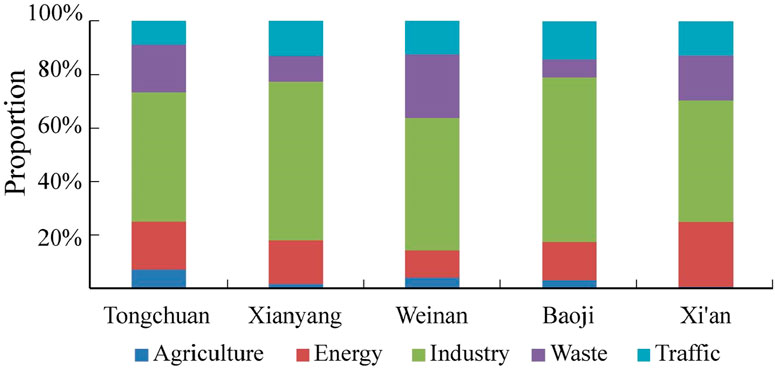
Figure 2. Carbon emission structure of each city.
As shown in the carbon emission structure in Figure 2, the agricultural carbon emissions of all cities are relatively low. Specifically, Tongchuan City has the lowest agricultural carbon emissions (259,000 tons), while Xianyang City has the highest agricultural carbon emissions (346,600 tons). The carbon emissions from daily life vary greatly among cities, with Xi’an having the highest carbon emissions (730.1 million tons), far higher than other cities. There are significant differences in industrial carbon emissions among cities, with Xi’an having the highest industrial carbon emissions (13.4619 million tons), followed by Xianyang (7.8736 million tons). The carbon emissions from waste in various cities are relatively low, with Xi’an having the highest (4.9785 million tons). In terms of carbon emissions from transportation, Xi’an has the highest (3.8923 million tons), followed by Xianyang (1.6865 million tons), and Tongchuan has the lowest (3.005 million tons). Further analysis of carbon emission intensity is presented in Table 7.
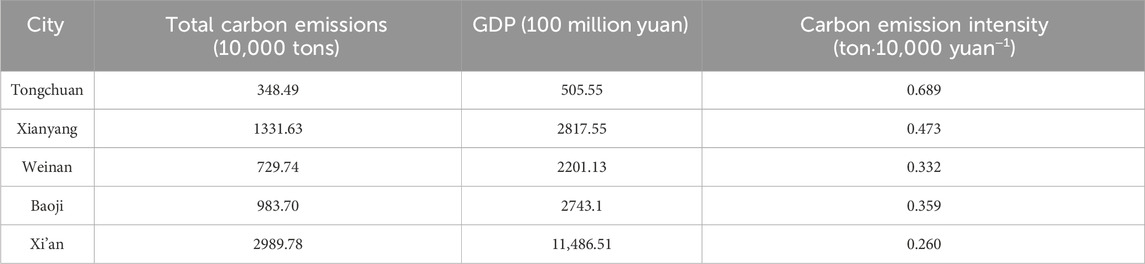
Table 7. Carbon emission intensity of each city.
From the perspective of carbon emission intensity, the average carbon emission intensity of the Shaanxi section of the Guanzhong Plain urban agglomeration is 0.506 tons per 10,000 yuan. There are significant differences in carbon emission intensity among different cities, and the order of carbon emission intensity from low to high is: Xi’an < Weinan < Baoji < Xianyang < Tongchuan. The carbon emission intensity in Xi’an is the lowest, at 0.260 tons per 10,000 yuan, indicating that the amount of carbon dioxide emitted per unit of GDP in Xi’an is relatively low. The economic development is more focused on low-carbon industries and has higher energy utilization efficiency (Meng et al., 2023). Next is Weinan City, with a carbon emission intensity of 0.332 tons per 10,000 yuan. It has a relatively high carbon emission efficiency in economic development. Baoji City ranks third, with a carbon emission intensity of 0.359 tons per 10,000 yuan, slightly higher than Weinan City, but still at a relatively low level. Xianyang City ranks fourth, with a carbon emission intensity of 0.473 tons per 10,000 yuan. Although the carbon emission intensity of Xianyang City is lower than the average level of the Guanzhong Plain urban agglomeration, there is still room for improvement, and further optimization of the industrial structure is needed to improve energy efficiency. The carbon emission intensity in Tongchuan City is the highest, at 0.689 tons per 10,000 yuan. Tongchuan City emits the highest amount of carbon dioxide per unit of GDP, indicating that its industrial structure is biased, the energy structure is not clean enough, or its technological level needs to be improved.
The overall carbon emission distribution of the Guanzhong Plain urban agglomeration is shown in Figure 3.
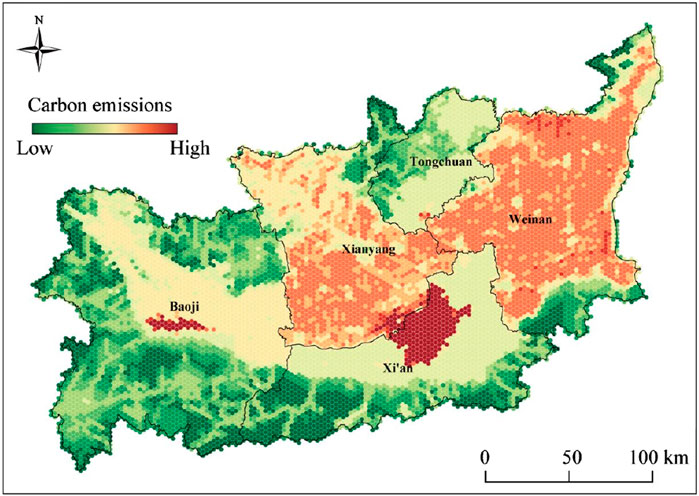
Figure 3. Overall carbon emission spatial pattern.
Figure 3 shows that the spatial pattern of carbon emissions in the Shaanxi section of the Guanzhong Plain urban agglomeration exhibits “core-edge” and “layered agglomeration” characteristics, with significant differences in carbon emissions between urban and rural areas. Carbon emission cores are formed in the central areas of cities such as Xi’an and Baoji. Weinan and Xianyang also exhibit higher carbon emissions, while the surrounding Guanzhong Plain is a region with lower carbon emissions. The southern Qinling National Park and the northern Loess Plateau are mainly rural areas, exhibiting the lowest total carbon emissions. This is because in the core areas, Xi’an and Baoji, as the core cities of the Guanzhong Plain urban agglomeration, have become the core areas of carbon emissions due to their dense population, concentrated industry, and frequent economic activities. The energy consumption, transportation, industrial production, and residential activities in these urban centers are the main sources of carbon emissions. In high-value areas, Weinan City and Xianyang City, as secondary cities, although their scale and economic activity intensity are not as high as Xi’an and Baoji, they still have high levels of carbon emissions. These cities play an important role in regional development, and their industrialization and urbanization processes have resulted in relatively high carbon emissions. In the lower value areas, the peripheral areas of the Guanzhong Plain have relatively low carbon emissions due to low population density and relatively fewer industrial activities. These regions may be predominantly agricultural, with relatively low energy consumption and carbon emission intensity. In the lowest value areas, the Qinling National Park in the south and the Loess Plateau in the north have limited human activities due to the importance of natural protection and ecological restoration. These areas are mainly rural, resulting in the lowest total carbon emissions. However, when formulating regional carbon reduction strategies, it is important to consider this layered and clustered carbon emission spatial pattern, along with the development characteristics and carbon emission characteristics of different regions. To further analyze the carbon emission patterns of each sector, refer to Figure 4.
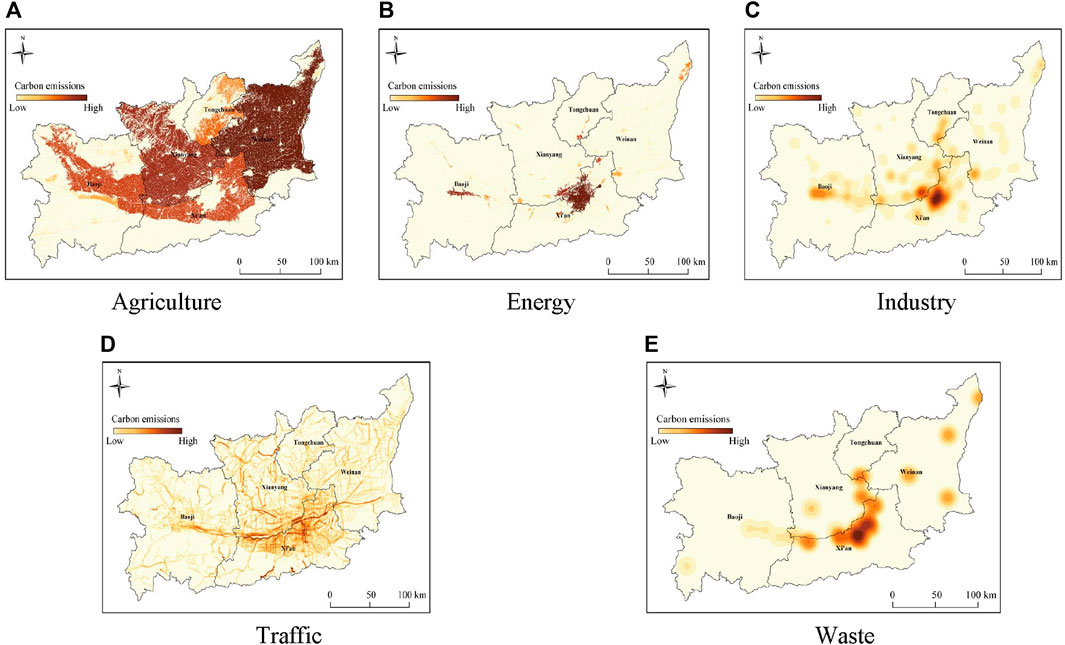
Figure 4. Carbon emission patterns of agriculture (A), energy (B), industry (C), traffic (D), waste (E) departments.
As shown in Figures 4, 4A shows a clustering distribution feature of high in the east and low in the west, with high agricultural carbon emissions in the Guanzhong Plain region. The spatial pattern of agricultural carbon emissions exhibits certain regional characteristics, which are influenced by various factors, including land use types, agricultural production methods, topography, etc. In the Guanzhong Plain region, due to its geographical location and natural conditions (Yan et al., 2023), agricultural activities are relatively concentrated and arable land resources are abundant, resulting in relatively high agricultural carbon emissions. The Qinling National Park in the southern part of the Guanzhong Plain and the Loess Plateau area on the northern side have limited arable land and relatively fewer agricultural activities due to terrain, topography, and soil conditions, resulting in lower agricultural carbon emissions. At the urban scale, the total agricultural carbon emissions in Weinan and Xianyang regions are relatively high, which may be related to their agricultural industry structure, agricultural technology level, and agricultural production scale. The relatively low agricultural carbon emissions in cities such as Tongchuan, Baoji, and Xi’an may be related to their higher proportion of non-agricultural industries, higher level of agricultural modernization, and possible carbon reduction measures.
Figure 4B shows that the spatial pattern of energy carbon emissions presents a “core periphery” feature. In the Guanzhong Plain region, the central urban areas of Xi’an and Baoji have formed the core areas of energy and carbon emissions due to their large urban scale and population density. The production activities and energy consumption of residents in the central areas of these cities are relatively concentrated, resulting in higher levels of energy and carbon emissions (Hu and Fan, 2020). At the same time, the central areas of peripheral districts and counties have formed a sub-core area of carbon emissions due to their relatively small scale and population. Although their energy carbon emissions are lower than those of the core areas, they are still higher than those of rural areas. Rural areas have relatively low energy consumption and carbon emissions due to sparse population distribution and relatively dispersed living and production activities. The formation of this spatial difference is closely related to the changes in land use patterns during the urbanization process. The construction land area in urban areas is relatively large, and with the concentration of population and intensive economic activities, energy demand and consumption have increased, especially in residential, commercial, and industrial construction land. On the other hand, rural areas are mainly occupied by agriculture and natural land, with relatively low energy consumption and correspondingly reduced carbon emissions.
Figure 4C shows that the spatial pattern of industrial carbon emissions presents a core-edge feature of “two centers and one belt,” forming a core area of industrial carbon emissions in the central urban areas of Xi’an and Baoji. The Guanzhong transportation corridor connecting Xi’an and Baoji forms a high-value industrial carbon emission belt, with secondary high industrial carbon emission centers in the central areas of peripheral districts and counties. Rural areas have almost no industrial carbon emissions. Xi’an and Baoji, as important cities in the region, have formed core areas for industrial carbon emissions due to their high level of industrialization and concentration of industrial enterprises. These cities have a relatively high proportion of manufacturing and heavy industry in terms of energy consumption and carbon emissions. The Guanzhong transportation corridor connecting Xi’an and Baoji serves as an important channel for regional transportation and logistics, with numerous industrial parks and bases distributed along the route. As a result, it forms a high-value zone for industrial carbon emissions (Chen et al., 2021). The frequent industrial activities and dense logistics transportation in this area have led to high energy consumption and carbon emissions. The central areas of peripheral districts and counties have formed secondary centers of industrial carbon emissions due to their relatively small industrial scale. Although the industrial carbon emissions in these regions are lower than those in the core areas, they are still an undeniable source of carbon emissions within the region. In contrast, rural areas have almost no industrial carbon emissions due to their lower level of industrialization. Rural areas are mainly dominated by agricultural production with fewer industrial activities, resulting in relatively low carbon emissions.
Figure 4D shows obvious networked characteristics in the Guanzhong Plain region. The formation of this pattern is closely related to factors such as transportation infrastructure construction, urban development level, and population distribution within the region. Xi’an and Xianyang, as important cities in the Guanzhong Plain region, have dense road networks and highly developed transportation systems. These cities are not only transportation hubs within the region, but also centers of economic activity and population gathering, resulting in relatively high carbon emissions from transportation. The dense road network and frequent vehicle traffic have led to high energy consumption and carbon emissions, especially in the central urban areas and surrounding major transportation arteries. The Guanzhong transportation corridor connecting Baoji, Xianyang, Xi’an, and Weinan has formed a high-value zone of transportation carbon emissions due to the distribution of many high-grade roads, such as highways and national highways. These transportation arteries serve as the main channels for internal and external connections within the region, carrying a large amount of logistics and human flow, resulting in higher carbon emissions from transportation in the areas along them. In contrast, rural areas have lower traffic carbon emissions due to lower road network density, fewer roads, and relatively lower frequency and density of transportation. The main modes of transportation in rural areas may be non-motorized and low-speed motor vehicles, which have relatively low carbon emission intensity. In addition, the population distribution in rural areas is relatively scattered, and the demand for transportation is relatively small, which also leads to a reduction in transportation carbon emissions.
Figure 4E exhibits a “one core, multiple points” feature, with Xi’an as the regional center city, forming the core area of waste carbon emissions. The formation of this pattern is closely related to factors such as the population size, economic development level, industrial structure, and distribution of environmental protection facilities in cities. As the largest city in the Guanzhong Plain region, Xi’an has a large population, frequent economic activities, and a large amount of waste generated in daily life and industrial production. These wastes generate a certain amount of carbon emissions during the treatment process, especially in the sewage treatment process (Wang et al., 2023). Due to the fact that urban sewage treatment plants typically consume energy and may produce greenhouse gases such as methane during the treatment of sewage and industrial wastewater, these factors collectively contribute to Xi’an’s core position in waste carbon emissions. Baoji, Xianyang, Tongchuan, Weinan, and other cities, as secondary cities in the region, have also formed their own waste carbon emission centers. Although the economic development level, industrial structure, and population size of these cities are not as high as Xi’an, they still have a certain amount of waste generation and carbon emissions, with a multi-point distribution feature in their spatial pattern. In addition, due to the fact that sewage treatment plants are often laid out along major rivers to facilitate the use of water resources and reduce transportation costs, this has led to the phenomenon of waste carbon emission centers being distributed in a strip pattern along major rivers. The distribution pattern along the river is conducive to the construction and operation of sewage treatment stations, and also facilitates the discharge or reuse of wastewater.
The distribution of carbon sinks in the Guanzhong Plain region is shown in Figure 5, and the distribution of carbon intensity is shown in Figure 6. Figure 5 shows that the distribution characteristics of carbon sinks in the Guanzhong Plain region exhibit a spatial pattern of “high in the south and low in the north,” which is closely related to factors such as natural geographical conditions, vegetation types, and land use patterns. The southern Qinling Mountains, as the geographical boundary between North and South China, have rich biodiversity and high vegetation coverage. This area is mainly dominated by tree forests, and the carbon sequestration capacity of forest ecosystems is strong, resulting in high carbon sequestration. The central Guanzhong Plain region is mainly dominated by modern agriculture. Crops such as wheat and rapeseed have a good protective effect on the soil and absorb carbon dioxide through vegetation growth, contributing to a high carbon sink (Liu et al., 2016). In addition, agricultural measures such as organic matter management and straw returning in farmland can also help improve soil carbon storage capacity. Due to natural limitations, the vegetation coverage in the northern Loess Plateau region is relatively low, mainly consisting of shrubs and grasslands. The carbon sequestration capacity of vegetation types in these regions is relatively weak, resulting in lower carbon sinks. Moreover, soil erosion and land degradation issues may also affect the carbon sequestration capacity of the region. In addition, urban areas have the lowest carbon sequestration due to their large amount of construction land and dense population, resulting in less natural vegetation coverage. The carbon sink in urban areas mainly comes from parks, green spaces, roadside trees, and rooftop greenery. Compared to natural ecosystems, the carbon sink capacity of cities is relatively weak.
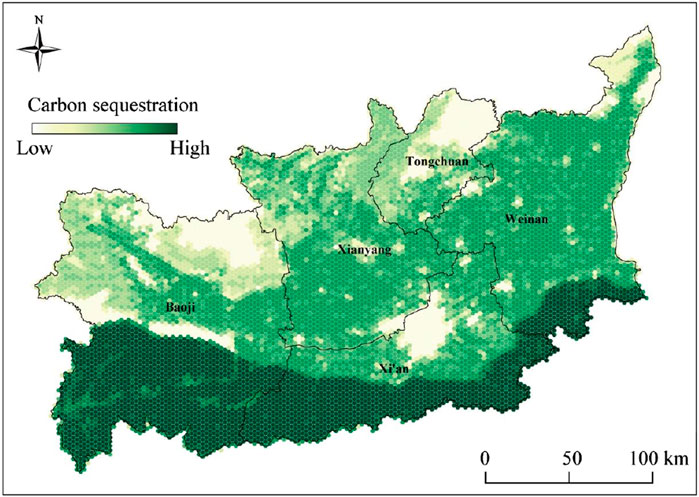
Figure 5. Carbon sink space.
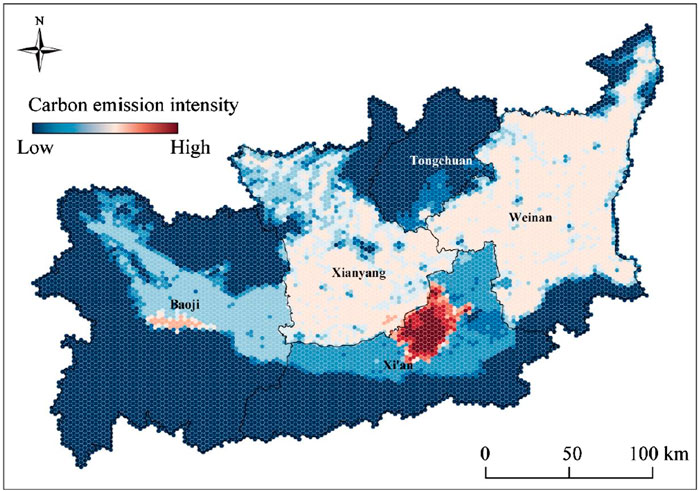
Figure 6. Carbon emission intensity.
As shown in Figure 6, the carbon emission intensity exhibits a layered agglomeration feature. As the core of the Guanzhong Plain urban agglomeration, the central urban area of Xi’an has a dense population and frequent economic activities, including industrial production, transportation, construction industry, and residential life. These activities have led to significant energy consumption, especially the use of fossil fuels, resulting in higher carbon emission intensity. In addition, the expansion of construction land and infrastructure construction in the process of urbanization is also an important source of carbon emissions. As an important industrial city in the region, Baoji City has numerous industrial enterprises, especially in heavy industry and manufacturing. The production and operation activities of these industrial enterprises require a large amount of energy input, often accompanied by high carbon emissions. Therefore, the carbon emission intensity in the central urban area of Baoji is relatively high, second only to the central urban area of Xi’an. Weinan City and Xianyang City have a relatively large population and a considerable number of enterprises, including industrial and service industries. The economic and population activities in these cities are relatively concentrated, resulting in higher carbon emission intensity. Meanwhile, Weinan and Xianyang are also important agricultural areas, and agricultural production activities also contribute to carbon emission intensity. The carbon emission intensity in rural areas of the Guanzhong Plain is relatively low, mainly due to agriculture and sparse population distribution. Although agricultural production activities generate certain carbon emissions, such as fertilizer use and agricultural machinery operations, their carbon emission intensity is lower compared to urban and industrial activities. Qinling National Park and the northern Loess Plateau have sparse populations and relatively low human activities, mainly relying on natural ecosystems and agricultural production. The carbon emission intensity in these areas is relatively low.
The carbon sink zoning in the Guanzhong Plain region is shown in Figure 7. Figure 7 shows that the carbon sequestration functional areas of the Guanzhong Plain urban agglomeration are mainly distributed in the southern Qinling National Park and northern Tongchuan City. These regions have a relatively large proportion of ecological land and good carbon sequestration capacity. As an important nature reserve, Qinling National Park has high vegetation coverage and strong carbon sequestration capacity of forest ecosystems, making it an important carbon sink area in the region (Gogoi et al., 2022). Due to its specific natural conditions and ecological protection measures, Tongchuan City also exhibits strong carbon sequestration potential. These regions are dominated by agriculture, and overall carbon sinks exceed carbon emissions. The carbon balance zone is mainly located in rural areas of the Guanzhong Plain. These areas have relatively dense villages, mainly focused on agriculture, with strong carbon sequestration capabilities. Due to agricultural production activities generating certain carbon emissions, such as fertilizer use and agricultural machinery operations, overall carbon emissions and carbon sinks are essentially balanced (Huang et al., 2024). The low-carbon optimization zone is mainly located in rural areas of Xianyang City and Weinan City. Agricultural carbon emissions in these regions are relatively high, and measures such as promoting low-carbon agricultural technology and optimizing land use structure are needed to further reduce carbon emissions. The carbon intensity control zone is mainly distributed in the central urban areas of cities such as Xi’an and Baoji. These regions have a high population density and a large number of industrial enterprises, resulting in much higher energy consumption and carbon emissions than carbon sinks. The human activity intensity in the central urban area of Xi’an is high, with the highest carbon emission intensity, while there are many industrial enterprises in Baoji City, resulting in high carbon emission intensity. These urban centers need to take measures such as promoting green and low-carbon development, optimizing energy structure, and improving energy efficiency to reduce carbon emissions and enhance carbon sequestration capacity.
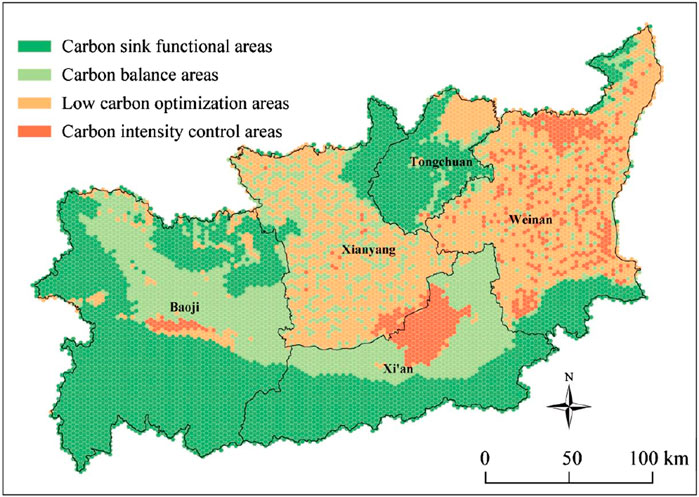
Figure 7. Results of carbon sink spaceCarbon balance zoning.
This study presents a comprehensive analysis of county-level carbon emissions in the Guanzhong area of Shaanxi Province, using a detailed carbon emission accounting system that reflects the unique geographic, socio-economic, and land-use characteristics of the region. The innovative aspect of this research lies in its focus on rural county-level emissions, which are often underrepresented in existing literature that primarily focuses on urban areas or national-level studies. By adopting a granular, county-level approach, this study fills a critical gap in understanding rural emissions and offers a replicable model for similar regions across China.
In terms of carbon neutrality, the study reveals that industrial and residential sectors are the largest contributors to carbon emissions, while agricultural emissions remain relatively low. The findings indicate that achieving carbon neutrality at the county level will require a targeted approach, focusing on optimizing industrial energy use, promoting renewable energy, and enhancing energy efficiency in residential areas. The study also underscores the importance of integrating low-carbon agricultural practices and land-use management to further balance carbon emissions.
The unique contribution of this research is its practical framework for understanding and managing carbon emissions in rural regions, providing policymakers with critical insights on how to balance economic development and environmental sustainability. By focusing on county-level emissions, the study provides a crucial foundation for China’s broader efforts to achieve its dual carbon goals, demonstrating that effective carbon management strategies must extend beyond urban areas to include the rural sectors that are essential to the country’s overall carbon neutrality objectives.
Firstly, focus on optimizing industrial and energy structures. The study reveals that the industrial and energy sectors contribute significantly to carbon emissions in the Guanzhong region. To address this, policymakers should prioritize the optimization of industrial structures by promoting low-carbon industries and technologies. This includes supporting the development of renewable energy sources, such as solar and wind power, and incentivizing the adoption of clean energy in industrial processes. Additionally, the implementation of energy efficiency standards and regulations can help reduce energy consumption and carbon emissions across various sectors.
Secondly, enhance agricultural carbon management and land use practices. While agricultural carbon emissions are relatively low compared to industrial and energy sectors, there is still potential for improvement. Policymakers should encourage farmers to adopt low-carbon agricultural practices, such as precision agriculture, organic farming, and straw returning. These practices can help reduce chemical fertilizer and pesticide usage, decrease greenhouse gas emissions, and improve soil carbon sequestration. Furthermore, optimizing land use patterns, such as restoring degraded land and promoting afforestation, can significantly enhance the carbon sink capacity of the region.
Third, establish a comprehensive carbon management and trading system. To effectively reduce carbon emissions and promote low-carbon development, it is crucial to establish a comprehensive carbon management system. This includes developing clear carbon emission reduction targets and implementing effective monitoring and reporting mechanisms. Additionally, policymakers should explore the feasibility of establishing a regional carbon trading market, which can incentivize emitters to reduce their carbon footprint and reward those who sequester carbon. This approach can not only help achieve carbon reduction goals but also stimulate economic growth and innovation in low-carbon technologies.
Finally, the policy recommendations derived from this study are not only pertinent to the Guanzhong region but also offer valuable insights for other rural areas across China. For instance, agricultural carbon management practices in northeastern China could inform efforts in other western and central regions, while the optimization of rural energy structures in eastern coastal regions provides valuable lessons for inland areas like the Guanzhong Plain. As such, it is recommended that the national government support the dissemination and implementation of county-level carbon emission accounting systems across the country. Tailored carbon emission reduction strategies, based on local characteristics, will be crucial to achieving China’s broader rural carbon neutrality goals.
The original contributions presented in the study are included in the article/supplementary material, further inquiries can be directed to the corresponding author.
WG: Conceptualization, Data curation, Formal Analysis, Funding acquisition, Investigation, Methodology, Project administration, Resources, Software, Supervision, Validation, Visualization, Writing–original draft, Writing–review and editing. WH: Conceptualization, Data curation, Formal Analysis, Funding acquisition, Investigation, Methodology, Project administration, Resources, Software, Supervision, Validation, Visualization, Writing–original draft, Writing–review and editing. JZ: Conceptualization, Data curation, Formal Analysis, Methodology, Writing–original draft, Writing–review and editing. YC: Software, Supervision, Validation, Visualization, Writing–original draft, Writing–review and editing. ZW: Data curation, Funding acquisition, Investigation, Validation, Writing–original draft, Writing–review and editing.
The author(s) declare that financial support was received for the research, authorship, and/or publication of this article. This paper was granted by Technology Innovation Center for Land Engineering and Human Settlements, Shaanxi Land Engineering Construction Group Co., Ltd and Xi’an Jiaotong University (Grant No. 2024WHZ0234), 2023 Annual Shaanxi Province State Capital Operation Budget Science and Technology Innovation Special Fund Project “Guanzhong Area Green Farmland Construction Key Technology Research and Demonstration Promotion Project”.
Authors WG, WH, JZ, YC, and ZW were employed by Shaanxi Dijian Guantian Investment and Construction Co., Ltd.
Authors WG, WH, JZ, YC, and ZW were employed by Shaanxi Provincial Land Engineering Construction Group Co., Ltd.
All claims expressed in this article are solely those of the authors and do not necessarily represent those of their affiliated organizations, or those of the publisher, the editors and the reviewers. Any product that may be evaluated in this article, or claim that may be made by its manufacturer, is not guaranteed or endorsed by the publisher.
Abam, F. I., Inah, O. I., Ekwe, E. B., Igbong, D. I., Effiom, S. O., Ovat, F. A., et al. (2023). CO2 emissions decoupling from added value growth in the chemical and pharmaceutical (CHPH) industry in Nigeria. Green Low-Carbon Econ. 1, 52–59. doi:10.47852/bonviewGLCE3202622
Abbas, A., Mushtaq, Z., Ikram, A., Yousaf, K., and Zhao, C. (2023). Assessing the factors of economic and environmental inefficiency of sunflower production in Pakistan: an epsilon-based measure model. Front. Environ. Sci. 11. doi:10.3389/fenvs.2023.1186328
Abbas, A., Waseem, M., Ahmad, R., khan, K. A., Zhao, C., and Zhu, J. (2022a). Sensitivity analysis of greenhouse gas emissions at farm level: case study of grain and cash crops. Environ. Sci. Pollut. Res. 29, 82559–82573. doi:10.1007/s11356-022-21560-9
Abbas, A., Zhao, C., Waseem, M., Ahmed khan, K., and Ahmad, R. (2022b). Analysis of energy input–output of farms and assessment of greenhouse gas emissions: a case study of cotton growers. Front. Environ. Sci. 9. doi:10.3389/fenvs.2021.826838
Amon, B., Çinar, G., Anderl, M., Dragoni, F., Kleinberger-Pierer, M., and Hörtenhuber, S. (2021). Inventory reporting of livestock emissions: the impact of the IPCC 1996 and 2006 Guidelines. Environ. Res. Lett. 16, 075001. doi:10.1088/1748-9326/ac0848
Caetano, T., Winkler, H., and Depledge, J. (2020). Towards zero carbon and zero poverty: integrating national climate change mitigation and sustainable development goals. Clim. Policy 20, 773–778. doi:10.1080/14693062.2020.1791404
Chen, L., Xu, L., Cai, Y., and Yang, Z. (2021). Spatiotemporal patterns of industrial carbon emissions at the city level. Resour. conservation Recycl. 169, 105499. doi:10.1016/j.resconrec.2021.105499
Chen, S., Shi, A., and Wang, X. (2020). Carbon emission curbing effects and influencing mechanisms of China’s Emission Trading Scheme: the mediating roles of technique effect, composition effect and allocation effect. J. Clean. Prod. 264, 121700. doi:10.1016/j.jclepro.2020.121700
Chen, Y., Billings, B. W., and Powell, K. M. (2024). Industrial processes and the smart grid: overcoming the variability of renewables by using built-in process storage and intelligent control strategies. Int. J. Prod. Res. 62, 1686–1698. doi:10.1080/00207543.2023.2199436
Elahi, E., Li, G., Han, X., Zhu, W., Liu, Y., Cheng, A., et al. (2024a). Decoupling livestock and poultry pollution emissions from industrial development: a step towards reducing environmental emissions. J. Environ. Manag. 350, 119654. doi:10.1016/j.jenvman.2023.119654
Elahi, E., Zhu, M., Khalid, Z., and Wei, K. (2024b). An empirical analysis of carbon emission efficiency in food production across the Yangtze River basin: towards sustainable agricultural development and carbon neutrality. Agric. Syst. 218, 103994. doi:10.1016/j.agsy.2024.103994
Gogoi, A., Ahirwal, J., and Sahoo, U. K. (2022). Evaluation of ecosystem carbon storage in major forest types of Eastern Himalaya: implications for carbon sink management. J. Environ. Manag. 302, 113972. doi:10.1016/j.jenvman.2021.113972
Guo, D., Li, B., Yu, W., Han, J.-C., Zhou, Y., Ye, Z., et al. (2023). Revisiting China’s domestic greenhouse gas emission from wastewater treatment: a quantitative process life-cycle assessment. Sci. Total Environ. 876, 162597. doi:10.1016/j.scitotenv.2023.162597
Guo, S. (2023). Exploring low-carbon pilot city policy implementation: evidence from China. Clim. Policy 23, 1045–1057. doi:10.1080/14693062.2022.2140096
Harris, S., Weinzettel, J., Bigano, A., and Källmén, A. (2020). Low carbon cities in 2050? GHG emissions of European cities using production-based and consumption-based emission accounting methods. J. Clean. Prod. 248, 119206. doi:10.1016/j.jclepro.2019.119206
Hu, W., and Fan, Y. (2020). City size and energy conservation: do large cities in China consume more energy? Energy Econ. 92, 104943. doi:10.1016/j.eneco.2020.104943
Huang, H., Jia, J., Chen, D., and Liu, S. (2024). Evolution of spatial network structure for land-use carbon emissions and carbon balance zoning in Jiangxi Province: a social network analysis perspective. Ecol. Indic. 158, 111508. doi:10.1016/j.ecolind.2023.111508
Khan, S., Anjum, R., Raza, S. T., Bazai, N. A., and Ihtisham, M. (2022). Technologies for municipal solid waste management: current status, challenges, and future perspectives. Chemosphere 288, 132403. doi:10.1016/j.chemosphere.2021.132403
Lai, S., Lu, J., Luo, X., and Ge, J. (2022). Carbon emission evaluation model and carbon reduction strategies for newly urbanized areas. Sustain. Prod. Consum. 31, 13–25. doi:10.1016/j.spc.2022.01.026
Li, W., Bao, L., Li, Y., Si, H., and Li, Y. (2022). Assessing the transition to low-carbon urban transport: a global comparison. Resour. Conservation Recycl. 180, 106179. doi:10.1016/j.resconrec.2022.106179
Lin, Q., Zhang, L., Qiu, B., Zhao, Y., and Wei, C. (2021). Spatiotemporal analysis of land use patterns on carbon emissions in China. Land 10, 141. doi:10.3390/land10020141
Liu, C., Cutforth, H., Chai, Q., and Gan, Y. (2016). Farming tactics to reduce the carbon footprint of crop cultivation in semiarid areas. A review. Agron. Sustain. Dev. 36, 69. doi:10.1007/s13593-016-0404-8
Liu, T., Wu, Z., Chen, C., Chen, H., and Zhou, H. (2024). Carbon emission accounting during the construction of typical 500 kV power transmissions and substations using the carbon emission factor approach. Buildings 14, 145. doi:10.3390/buildings14010145
Liu, Z., Xu, Z., Zhu, X., Yin, L., Yin, Z., Li, X., et al. (2023). Calculation of carbon emissions in wastewater treatment and its neutralization measures: a review. Sci. Total Environ. 912, 169356. doi:10.1016/j.scitotenv.2023.169356
Lv, Z., Shan, X., Xiao, X., Cai, R., Zhang, Y., and Jiao, N. (2022). Excessive greenhouse gas emissions from wastewater treatment plants by using the chemical oxygen demand standard. Sci. China Earth Sci. 65, 87–95. doi:10.1007/s11430-021-9837-5
Mehedi, T. H., Gemechu, E., and Kumar, A. (2022). Life cycle greenhouse gas emissions and energy footprints of utility-scale solar energy systems. Appl. Energy 314, 118918. doi:10.1016/j.apenergy.2022.118918
Meng, B., Zhang, J., and Zhang, X. (2023). Detecting the spatial network structure of the Guanzhong Plain urban agglomeration, China: a multi-dimensional element flow perspective. Land 12, 563. doi:10.3390/land12030563
Meng, F., Chen, H., Tan, Y., and Xiong, W. (2024). Changes in crop mix and the effects on agricultural carbon emissions in China. Int. J. Agric. Sustain. 22, 2335141. doi:10.1080/14735903.2024.2335141
Meng, M., and Niu, D. (2011). Modeling CO2 emissions from fossil fuel combustion using the logistic equation. Energy 36, 3355–3359. doi:10.1016/j.energy.2011.03.032
Na, H., Yuan, Y., Du, T., Zhang, T., Zhao, X., Sun, J., et al. (2024). Multi-process production occurs in the iron and steel industry, supporting ‘dual carbon’target: an in-depth study of CO2 emissions from different processes. J. Environ. Sci. 140, 46–58. doi:10.1016/j.jes.2023.03.031
Noda, I., Asada, M., and Nagao, H. (2024). Elucidation of the mechanism of greenhouse gas generation by abiotic transformation of nutrient ions flowing into closed water areas with little phytoplankton. ACS ES&T Water 4, 436–443. doi:10.1021/acsestwater.3c00455
Sage, R. F. (2020). Global change biology: a primer. Glob. Change Biol. 26, 3–30. doi:10.1111/gcb.14893
Shan, Y., Guan, D., Liu, J., Mi, Z., Liu, Z., Liu, J., et al. (2017). Methodology and applications of city level CO2 emission accounts in China. J. Clean. Prod. 161, 1215–1225. doi:10.1016/j.jclepro.2017.06.075
Song, M., Zhao, X., and Shang, Y. (2020). The impact of low-carbon city construction on ecological efficiency: empirical evidence from quasi-natural experiments. Resour. Conservation Recycl. 157, 104777. doi:10.1016/j.resconrec.2020.104777
Sun, J., Qi, Y., Guo, J., Zheng, J., Zhang, L., and Yang, X. (2024). Impact of nighttime light data saturation correction on the application of carbon emissions spatialization: a comparative study of the correction effect and application effect based on five methods in China. J. Clean. Prod. 438, 140815. doi:10.1016/j.jclepro.2024.140815
Sun, L.-L., Cui, H.-J., and Ge, Q.-S. (2022). Will China achieve its 2060 carbon neutral commitment from the provincial perspective? Adv. Clim. Change Res. 13, 169–178. doi:10.1016/j.accre.2022.02.002
Ucal, M., and Xydis, G. (2020). Multidirectional relationship between energy resources, climate changes and sustainable development: technoeconomic analysis. Sustain. Cities Soc. 60, 102210. doi:10.1016/j.scs.2020.102210
Ullah, S., You, Q., Wang, G., Ullah, W., Sachindra, D. A., Yan, Y., et al. (2022). Characteristics of human thermal stress in South Asia during 1981–2019. Environ. Res. Lett. 17, 104018. doi:10.1088/1748-9326/ac8fa6
Wang, C., Zhan, J., and Xin, Z. (2020a). Comparative analysis of urban ecological management models incorporating low-carbon transformation. Technol. Forecast. Soc. Change 159, 120190. doi:10.1016/j.techfore.2020.120190
Wang, Q., Li, X., Liu, W., Zhai, S., Xu, Q., Nie, S., et al. (2023). Carbon source recovery from waste sludge reduces greenhouse gas emissions in a pilot-scale industrial wastewater treatment plant. Environ. Sci. Ecotechnology 14, 100235. doi:10.1016/j.ese.2022.100235
Wang, Y., Fang, X., Yin, S., and Chen, W. (2021). Low-carbon development quality of cities in China: evaluation and obstacle analysis. Sustain. Cities Soc. 64, 102553. doi:10.1016/j.scs.2020.102553
Wang, Y., Yang, H., and Sun, R. (2020b). Effectiveness of China’s provincial industrial carbon emission reduction and optimization of carbon emission reduction paths in “lagging regions”: efficiency-cost analysis. J. Environ. Manag. 275, 111221. doi:10.1016/j.jenvman.2020.111221
Wimbadi, R. W., and Djalante, R. (2020). From decarbonization to low carbon development and transition: a systematic literature review of the conceptualization of moving toward net-zero carbon dioxide emission (1995–2019). J. Clean. Prod. 256, 120307. doi:10.1016/j.jclepro.2020.120307
Xu, Y., Li, H., Zhang, R., Wang, T., Sui, P., Sheng, J., et al. (2024). Balancing the development and carbon emissions in rural areas of China. J. Clean. Prod. 454, 142338. doi:10.1016/j.jclepro.2024.142338
Yan, Z., Li, Z., Li, P., Zhao, C., Xu, Y., Cui, Z., et al. (2023). Spatial and temporal variation of NDVI and its driving factors based on geographical detector: a case study of Guanzhong plain urban agglomeration. Remote Sens. Appl. Soc. Environ. 32, 101030. doi:10.1016/j.rsase.2023.101030
Yu, Y., Yin, S., and Zhang, A. (2022). Clean energy-based rural low carbon transformation considering the supply and demand of new energy under government participation: a three-participators game model. Energy Rep. 8, 12011–12025. doi:10.1016/j.egyr.2022.09.037
Yu, Z., Wang, Y., Zhao, B., Li, Z., and Hao, Q. (2023). Research on carbon emission structure and model in low-carbon rural areas: bibliometric analysis. Sustainability 15, 12353. doi:10.3390/su151612353
Zhang, L. X., Wang, C. B., and Bahaj, A. S. (2014). Carbon emissions by rural energy in China. Renew. Energy 66, 641–649. doi:10.1016/j.renene.2014.01.005
Zhang, W., Zhang, M., Wu, S., and Liu, F. (2021). A complex path model for low-carbon sustainable development of enterprise based on system dynamics. J. Clean. Prod. 321, 128934. doi:10.1016/j.jclepro.2021.128934
Zhang, Y., Wang, W., Liang, L., Wang, D., Cui, X., and Wei, W. (2020). Spatial-temporal pattern evolution and driving factors of China’s energy efficiency under low-carbon economy. Sci. Total Environ. 739, 140197. doi:10.1016/j.scitotenv.2020.140197
Zhao, W. (2022). China’s goal of achieving carbon neutrality before 2060: experts explain how. Natl. Sci. Rev. 9, nwac115. doi:10.1093/nsr/nwac115
Zhong, X., Hu, M., Deetman, S., Steubing, B., Lin, H. X., Hernandez, G. A., et al. (2021). Global greenhouse gas emissions from residential and commercial building materials and mitigation strategies to 2060. Nat. Commun. 12, 6126. doi:10.1038/s41467-021-26212-z
Zhou, Z., Nie, L., Ji, H., Zeng, H., and Chen, X. (2020). Does a firm’s low-carbon awareness promote low-carbon behaviors? Empirical evidence from China. J. Clean. Prod. 244, 118903. doi:10.1016/j.jclepro.2019.118903
Zhu, H., Chen, S., Irfan, M., Hu, M., and Hu, J. (2024). Exploring the role of the belt and road initiative in promoting sustainable and inclusive development. Sustain. Dev. 32, 712–723. doi:10.1002/sd.2705
Zhu, X., Zou, X., Lu, E., Deng, Y., Luo, Y., Chen, H., et al. (2021). Litterfall biomass and nutrient cycling in karst and nearby non-karst forests in tropical China: a 10-year comparison. Sci. Total Environ. 758, 143619. doi:10.1016/j.scitotenv.2020.143619
Keywords: county scale, carbon emissions, carbon balance, influence factor, guanzhong urban agglomeration
Citation: Gao W, He W, Zhang J, Chen Y and Wei Z (2024) County-level carbon emissions in the guanzhong area of Shaanxi province: towards achieving China’s dual carbon goals. Front. Environ. Sci. 12:1447728. doi: 10.3389/fenvs.2024.1447728
Received: 12 June 2024; Accepted: 03 October 2024;
Published: 14 October 2024.
Edited by:
Mariarosaria Lombardi, University of Foggia, ItalyReviewed by:
Adnan Abbas, Nanjing University of Information Science and Technology, ChinaCopyright © 2024 Gao, He, Zhang, Chen and Wei. This is an open-access article distributed under the terms of the Creative Commons Attribution License (CC BY). The use, distribution or reproduction in other forums is permitted, provided the original author(s) and the copyright owner(s) are credited and that the original publication in this journal is cited, in accordance with accepted academic practice. No use, distribution or reproduction is permitted which does not comply with these terms.
*Correspondence: Weichun Gao, Z2Fvd2VpY2h1bjEyM0AxNjMuY29t
Disclaimer: All claims expressed in this article are solely those of the authors and do not necessarily represent those of their affiliated organizations, or those of the publisher, the editors and the reviewers. Any product that may be evaluated in this article or claim that may be made by its manufacturer is not guaranteed or endorsed by the publisher.
Research integrity at Frontiers
Learn more about the work of our research integrity team to safeguard the quality of each article we publish.