 Lin Gan
94% of researchers rate our articles as excellent or good
Learn more about the work of our research integrity team to safeguard the quality of each article we publish.
Find out more
ORIGINAL RESEARCH article
Front. Environ. Sci., 11 October 2024
Sec. Water and Wastewater Management
Volume 12 - 2024 | https://doi.org/10.3389/fenvs.2024.1447120
Rivers are cradles of human civilisations and continual innovations in water technologies are the key to sustainable human development. Yet, limited research has explored the interactive dynamics among different technologies, hindering our ability to effectively manage technological transition. This paper presents a framework that conceptualizes water technology as a complex adaptive system containing three interrelated sub-systems: water demand, water supply, and water management. The interactions among these sub-systems were measured using three network-based metrics: intensity, brokerage, and efficiency. Patents registered in the World Intellectual Property Organization from 1863 to 2020 were used as the data source. It was found that 40,304 patents from 44 countries were registered, with 40% of them belonging to the water management sub-system, followed by water supply (35%), and water demand (25%). Technological development in the three sub-systems presented linear growth over the past 160 years, focusing on water treatment, hydroelectric power, hydraulic engineering and water monitoring. The water-demand sub-system was identified as the structural “bottleneck” with the highest brokerage value, which was considered crucial for knowledge transfer between the other two sub-systems. Overall, the water technology system is characterized by slow development, skewed spatial coverage, categorical homogeneity, and structural imbalances, limiting our ability to address the escalating global water threats.
Rivers are the cradle of human civilisation (Khalid, 2004). However, as the economy expands, the population grows and climate changes, water scarcity and water pollution have represented global threats to human society (Mekonnen and Hoekstra, 2016). According to the U.N., 20% of the world’s population, or 1.1 billion people, will not be able to drink clean water by 2050 and at least 2 billion people in 48 countries, and up to 7 billion people in 60 countries, will struggle to get sufficient water. Managing water also plays an important role in achieving the sustainable development goals (SDGs) and the Paris Agreement on climate change (Merrey et al., 2015). The challenges of the twenty-first century cannot be addressed without recognizing these water-related problems and systemic interventions towards more sustainable resource uses (Biggs et al., 2021).
“Technology is as old as humankind” (Basalla, 1988). Continual innovations in water technologies have contributed to a significant expansion of civilisation, helping humankind cope with varying natural and societal challenges. Emerging in about 8,000 - 10,000 BC (Wu et al., 2019), water technologies had initial aims to divert water from rivers or lakes to riparian land. Over time, more complex engineering and management systems (e.g., canals and aqueducts) were developed to convey water over longer distances, which allowed the irrigation of relatively dry regions. Then, multiple technology systems that include non-consumptive use activities (for example, the use of water as a source of power and the use of water for recreation and transportation) were developed. Development in pumping expanded groundwater use and increased pumping power led to the emergence of conjunctive use of surface water and groundwater (Schoengold and Zilberman, 2007). In recent years, technologies such as reverse osmosis have allowed the recycling, reuse, and desalination of water. Globally, a “techno-sphere” within which humans lives has been created by technological advancement (Haff, 2014). However, advances in water technologies in the last hundred years have not resolved, rather, aggravated water conflicts between water supply and demand, water quantity and quality, and water for society and the environment (Qiao et al., 2020). Our ability to manage technology development is far behind technology development itself. Therefore, there is an urgent need to re-orient water technological innovation to escape from “locked-in” development in many parts of the world (Wei et al., 2018).
Technology is broadly defined as beliefs, artefacts, and evaluation routines based on its representation as knowledge (Garud and Rappa, 1994). More specifically, technology refers to artefacts, methods and practices “to fulfil certain human purposes in a specifiable and reproducible way” (Anadon et al., 2016). Technology is initially studied empirically to track its development, in which representatives (e.g., research expenditures, trade data, scientific publications, patent data, machine productivity and efficiency indicators) were used (Aharonson and Schilling, 2016). Empirical evidence supports that the evolution of technology follows an S-curve experiencing pre-development, take-off, rapid development, and stabilization. Neoclassical economics is a major stream to study technology, which regards technology as an economic entity and develops approaches to quantitatively estimate its impacts in terms of economic values to fix the “market failures” of the technology development (Edquist, 2005; Schot and Steinmueller, 2018; Weber and Truffer, 2017; Woolthuis et al., 2005). Sociology is another major stream of technology research. It, built on the social construction of technology and the actor-network theory, considers technology development as a social process, and that the interactions among different technologies form a set of social connections (Cressman, 2009; Klein and Kleinman, 2002). Recently, technology has been increasingly recognised as a complex adaptive system containing numerous co-evolving technological clusters drawing knowledge from different disciplinary areas (Fleming and Sorenson, 2001). These clusters interact and diffuse among each other to create innovations in the technology system, and will change in response to the removal or modification of the others (Hughes, 1987). These interactions formed the structural dynamics of a technology system. However, few studies have examined such internal, interactive dynamics of a technology system, compromising our capacity to efficiently manage and direct technology transition (Wiedenhofer et al., 2015).
With online access to huge patent information, patent search and analysis have become vital for determining novelty in technology, analysing trends of technology development, and planning and managing R&D investment. The patent analysis has been widely applied to investigate the technological development in the water sector, for example, wastewater treatment and desalination (Cerveira et al., 2022; Im and Kim, 2012; Mao et al., 2022; Moreira et al., 2019; Sun et al., 2022; Yuan et al., 2010). While these studies tracked a certain type of water technology development in depth, they have not contributed to the understanding of water technology from a whole-of-system perspective covering supply, demand, and management.
This paper aims to develop a structural understanding of water technology. It will define water technology as a system containing three sub-systems: water demand, water supply, and water management, corresponding to the common water practices across the world. The interactions among these sub-systems will be measured with the social network analysis to decipher and assess the evolutionary dynamics of the water technology system. Patents registered in the World Intellectual Property Organization (WIPO) from 1863 to 2020 will be used as the data source. It is expected that the findings from this study will assist in the identification of structural failure in the water technology system for addressing the increasing global water threats.
Rivers are fundamental components of the Earth system, which are also logical management units for water cycles that link to other cycles (such as nutrients, energy, and carbon) in the Earth system. All human actions through the development and use of technology on rivers (such as dam development, canal modernization, river regulation, wastewater treatment, farm irrigation and streamflow forecasting) have interdependent environmental, economic, societal, and climatic implications (Newson, 2008). Although there are many ways to define a water technology system (Gray, 2017), we define it from the whole-of-system perspective covering the supply, demand, and management of water (Figure 1).
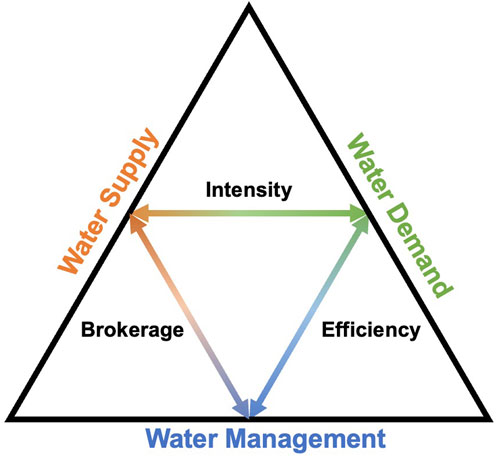
Figure 1. Defining and measuring a water technology system (modified with permission from (Gan et al., 2024); published by Water, 2024).
Three sub-systems: water supply, water demand and water management are defined within a water technology system. It is commonly recognised that a water supply technology sub-system includes those technologies related to diverting, conveying, distributing water, and disposing of drainage (Brikké et al., 2003; Stephenson, 2012). It should be noted the drainage may be treated and reused as part of the water supply system. A water demand technology sub-system includes those that “accomplish one (or more) of the following five things: (1) Reduce the quantity or quality of water required to accomplish a specific task; (2) Adjust the nature of the task or the way it is undertaken so that it can be accomplished with less water or with lower quality water; (3) Reduce the loss in quantity or quality of water as it flows from source through use to disposal; (4) Shift the timing of use from peak to off-peak periods; (5) Increase the ability of the water system to continue to serve society during times when water is in short supply” (Brooks, 2006). This subsystem emphasizes the sectoral innovation approach for the fulfilment of certain societal functions (e.g., agriculture, transport, communication, energy, pharmaceutics, and petroleum). The third sub-system refers to water management technologies, which include river harnesses and regulations that support river functioning and making water available for both water supply and demand. Most of them were techniques for flow process regulations in hydraulic and environmental engineering, as well as modern smart electronics for data gathering from both the laboratory and the field, and monitoring techniques like global-positioning satellites, satellite photography and geographical data systems (Liggett, 2002).
Drawing on complex adaptive system theory, network analysis and previous studies on socio-technical systems, we adopted three network metrics to quantify and assess the connections among different technologies as the structure of the water technology system. Individual patents were represented as “nodes” and their interactions are as “ties”. With the aim of identifying the patterns of technology development in different countries, it was assumed that the co-occurrence of patents within the same country at the same time was technically connected. In other words, if two patents were developed in the same countries at the same time, one connection was counted between the two patents. Square matrix tables (i.e., tables with the same number of rows and columns of patents) were used to store the connections.
As the patents were assigned to water demand, water supply and water management sub-systems according to their IPC codes (see details in Supplementary Appendix Table A1), the connections between water demand and water supply patents, water demand and water management patents, and water supply and water management patents can be created by summing the number of connections in each country at three stages. In total, there were nine matrix tables to demonstrate the connections of patents in three sub-systems at three stages. An example of the matrix of water demand water supply sub-systems for Stage 1, and the corresponding values of the three metrics can be found in the Supplementary Excel document titled ‘network matrix example’.
Three metrics were then proposed to reflect key features of the water technology network formed by these connections (Table 1). Similar network indicators have also been adapted to analyse the structure of the patent network, as well as in other disciplines (e.g., trophic networks in ecology and neural networks in medical science) (Siegenfeld and Bar-Yam, 2020; Walker et al., 2004). The intensity metric was calculated by counting the total number of connections to each of the patents. A patent with a high-intensity value has high contributions to the interactions and plays as an “influencer” to other technological developments (Valente et al., 2008). The brokerage metric was calculated by counting the number of times a patent sits between the two otherwise unconnected patents. A patent with a high brokerage value has high bridging power and acts as a key “broker”, and indicates the extent to which certain technologies encourage cross-disciplinary knowledge transfer (Hung and Wang, 2010). Finally, the efficiency metric was calculated as the inverse of the total number of connections of one patent to all other patents. A patent with a high-efficiency value has a small number of connections to reach any other technologies and acts as a “stimulator” for effective information transfer and technological innovation (Wu et al., 2021). These three metrics reflect the general characteristics of a complex adaptive system (Freeman, 1978).
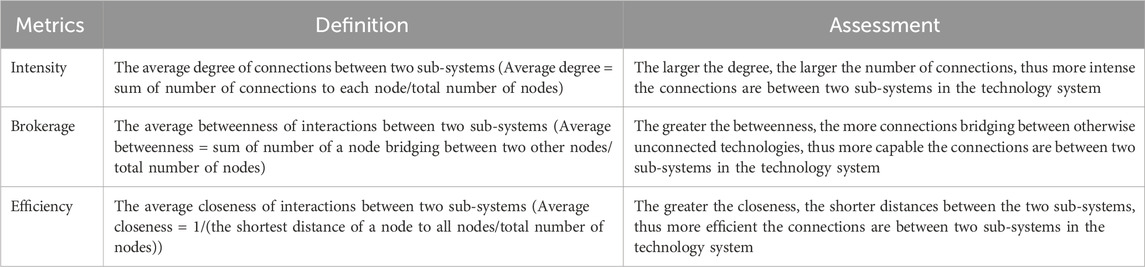
Table 1. Metrics to measure and assess the structure of a water technology system.
An ideal water technology system requires a balanced structure among subsystems (Bodin et al., 2006). A technology system with only high intensity may imply that there were too many connections and strong “path dependency” in technology development. A system with high brokerage may indicate that there are limited alternative connections with otherwise unconnected technologies which may impact the knowledge transfer between them, and thus a strong “bottleneck” effect and cast a high risk of system collapse or failure due to lack of system redundancy. Moreover, high efficiency may imply limited motivation to develop dissimilar or complementary technologies, in turn hampering learning and knowledge diffusion. The imbalance between intensity, brokerage and efficiency may indicate a structural failure of the technology system (Burt, 1982; Granovetter, 1983; Granovetter, 1973).
Patent data registered in the PATENTSCOPE database from the World Intellectual Property Organization (WIPO) (https://www.wipo.int/patentscope/en/) were used as the data source. The PATENTSCOPE database is one of the biggest global patent databases which was established in 1967 with more than 107 million patent documents from 193 countries, regions, and organizations dated back to 1782 (WIPO, 2022b). PATENTSCOPE provides information on the specific technologies invented, including the date of application, the spatial locations in which these technologies were registered, and a technology classification ID (Albino et al., 2014). Therefore, PATENTSCOPE allows in-depth analysis of water technologies over a long timeframe and on a global scale (De Rassenfosse et al., 2013).
A keyword-based search was conducted using “river” as the keyword. Initially, the term “water” was used as the search keyword. It was found that this term was too broad containing substantial technical fields beyond the scope of this study. The search returned 5,103,572 patents, with more than half of the patents were not highly related to water resource management. For example, some patents showed up due to their applicant’s name or company containing the keyword “water”. To better focus on the scope of this study, which was on the supply, demand, and management of water resources, we refined the search keyword to the term “river”, as it is the basic system unit of water resources and is of high relevance to all the supply, demand, and management of water resources. 1863 to 2020 was set up as the time range to capture the earliest available patents related to water technology. The initial search found 79,483 patents, of which the patent title, application number, publication date, country or patent office of registration, International Patent Classification (IPC) code, applicants, inventors, and patent citations were collected from each patent. After that, an additional manual validity check was conducted and irrelevant patents (39,179) and patents with missing IPC codes (338) were removed. Finally, a total of 40,304 patents were used for further analysis. It was also noted that some of the patents may be registered in multiple countries; in that case, the patents were collected and counted in both countries.
Based on our definition in Section 2.1, these patents were further categorized into three sub-systems: water demand, water supply, and water management. This classification was conducted based on the IPC codes automatically assigned to each patent by the Patent Offices to ensure consistency. There are 70,000 different IPC codes for different technical areas. The IPC classified each patent into five levels (WIPO, 2022a). The first level contains eight areas: human necessities, operations, chemistry, textiles, constructions, engineering, physics, and electricity (Table 2), each of which is subdivided into more detailed sub-levels. Then, the following rules were followed to classify these IPC codes into the three sub-systems (Brikké et al., 2003; Gray, 2010; Stephenson, 2012) (refer to Supplementary Appendix Table A1 for detailed classifications of IPC codes under each sub-system):
• All patents related to domestic and municipal (including recreational use), agricultural (including horticulture, animal husbandry and fishing), industrial (including transportation, energy, material, manufacturing and construction) water use were classified into the water demand sub-system;
• All patents related to water collection, water quality treatment (including water pollution and wastewater treatments), domestic and industrial supply of water were classified into the water supply sub-system;
• All patents related to hydraulic engineering, monitoring and measuring river conditions were classified into the water management sub-system; and
• Although we recognise that there may be overlaps among sub-systems, each patent was exclusively assigned to one sub-system based on its major function to reduce ambiguity.
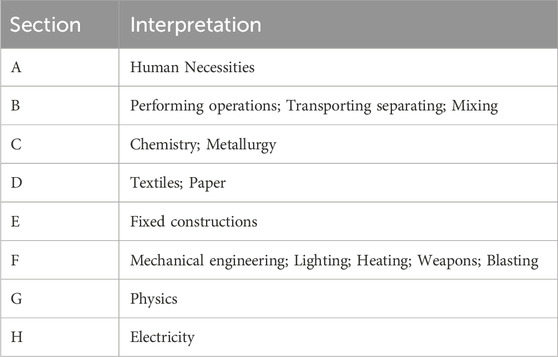
Table 2. Classification of patents.
Firstly, the study period was divided into three stages based on the rate of increase in the number of patents registered each year. The total number of patents and those classified under each of the water demand, water supply, and water management sub-systems were analysed at each stage, and ordinary least square linear regressions were conducted to measure the growth rates for each sub-system in time. Stage 1 spanned from 1863 to 1993 with an annual growth rate of about 10 patents per year, followed by Stage 2 (1994–2013) and a much shorter Stage 3 (2014–2020) that demonstrated much faster growth rates of over 100 and over 1,000 patents per year, respectively.
Then, Kernel densities, which is a non-parametric measure of the clustering level of points (Marin et al., 2017) were calculated for each year based on the relative proportions of patents distributed among the three sub-systems. This was done to understand both the temporal and spatial patterns based on the country or patent office of registration, based on the relative proportions of each country’s patents distributed among the water demand, water supply and water management sub-systems.
Finally, to analyse the structure of the water technology system, the highly developed patents with the top five IPC codes under each of the water demand, water supply, and water management sub-systems were examined in detail. The technology networks were then conducted by establishing connections among the technologies that co-occur within the same country at the same stage. They were measured using the intensity, efficiency and brokerage metrics as described in Section 2.2.
The first patent related to water technology was registered in 1863 which aimed to improve methods for defending of harbors and river channels. The total number of patents accumulated to 40,304 in 2020. The water technology system was characterized by slow accumulation then initial take-off (Stage 1, 1863–1973 then 1974–1993), steady expansion (Stage 2, 1994–2013) and rapid expansion (Stage 3, 2014–2020) (Figure 2A). Water management patents have always been dominant with relative proportions (40%) and remained the highest-growing sub-system. Hydraulic engineering (E02B) remained the most important technology. However, the proportion of hydraulic engineering has been declining and replaced by river measuring and monitoring techniques. A “supply-driven” growth in patents was reflected by the over three-fold greater growth rate for the water supply patents compared to that of water demand patents. It was noted that the methodology of water treatment (C02F) was becoming increasingly diverse, from simple physical and chemical methods in Stage 1 to more biological water treatment techniques in Stage 2 and Stage 3. Besides, more and more patents were focused on the construction of bridges (E01D), embankments or underwater structures (E02D). Unlike the sharp growth of water supply and water management patents, water demand patents were increased slowly. The number of patents related to animal husbandry, pisciculture and fishing (A01K) has surpassed patents related to machines or engines for liquid (F03B) and ship or other waterborne vessels for shipping (B63B) in Stage 3 and became the major technology under water demand (Figures 2B–D).
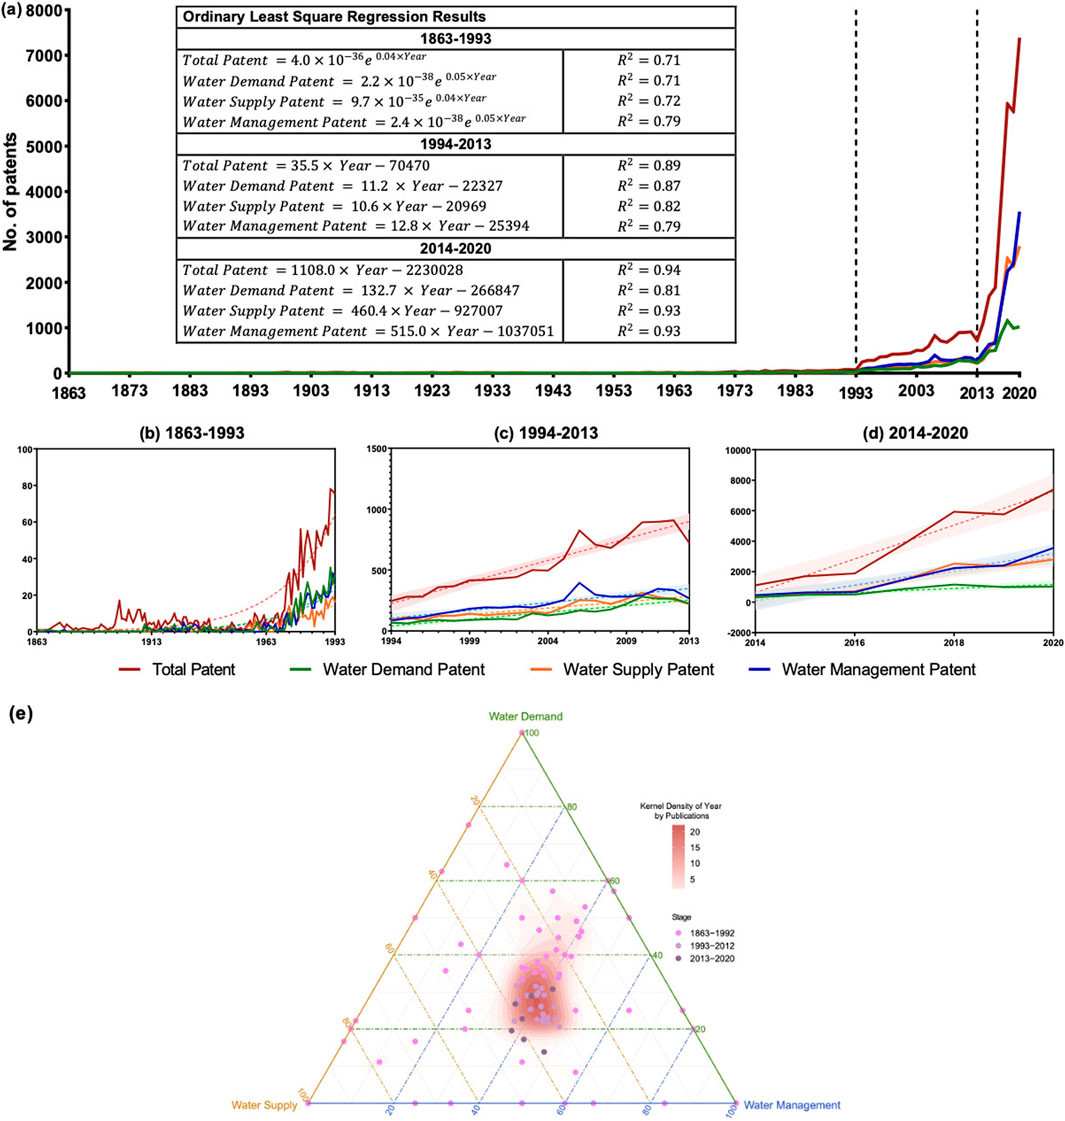
Figure 2. (A) The temporal development and ordinary least square regression for the total water technology patents and classified under the Water Demand, Water Supply, and Water Management sub-systems, and the temporal development of patents in (B) Stage 1 (1863–1993), (C) Stage 2 (1994–2013), and (D) Stage 3 (2014–2020). (E) The distributions of proportions among Water Demand, Water Supply, and Water Management sub-systems in each year.
In contrast to the rapid increase in the number of water patents registered, the relative proportions distributed among the three sub-systems demonstrated a sign of stabilization (Figure 2E). During Stage 1, except for the water technologies that missing the IPC codes, the proportions of patents were sparsely and evenly distributed among the three sub-systems, with an average relative proportion of 26% for water supply, 25% for water management, and 24% for water demand patents. During Stages 2 and 3, the relative proportions have shifted towards water management patents (40%) dominated, with relatively stronger focuses on water supply (from 33% to 37%) than on water demand (from 25% to 23%) patents.
From a spatial perspective, these water technology patents were registered in 44 countries (Figure 3A), with 1,142 patents directly registered by 5 global or regional patent offices and no specific mention of countries (Supplementary Appendix Table A2). Among the 44 countries, China has registered significantly more patents (26,985) than the following countries: the Republic of Korea (4,032), Japan (3,965), Russia (866) and the United States (815). Asian countries registered about 88% of total water patents across all three sub-systems. European countries contributed to about 5% (2,192) of total patents, followed by North America (3%, 1,047) and the remaining countries made up less than 5% in total. In addition, the developed countries in Europe and North America tended to develop water demand technologies while other countries were either water-supply driven (e.g., China, Japan, Malaysia, Netherlands, Spain) or water-management driven (e.g., Australia, Argentina, Estonia, Kazakhstan, Tunisia and Sweden) (Figure 3B).
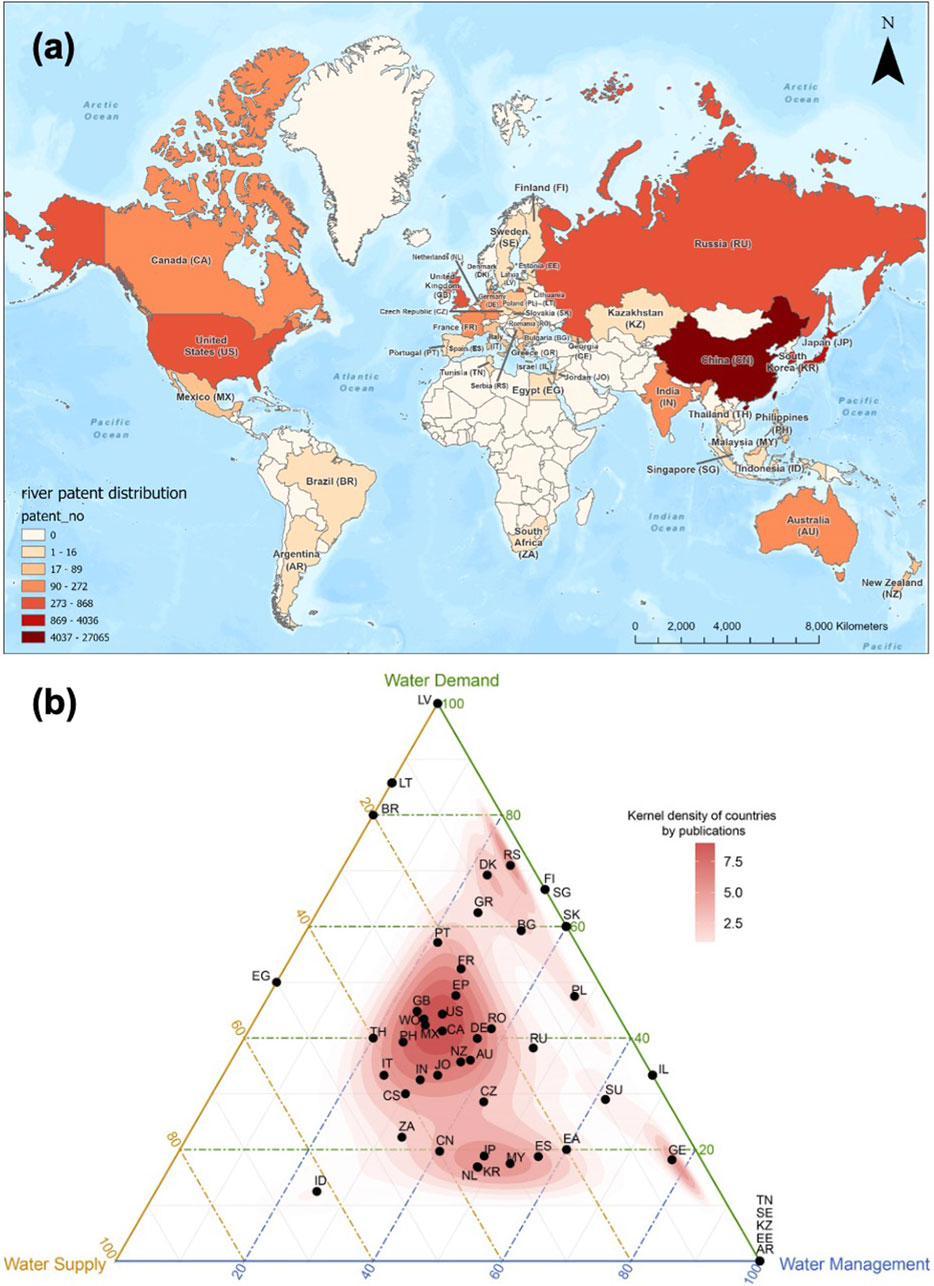
Figure 3. (A) The spatial distribution of total water technology patents during 1863–2020, and (B) the average distributions of proportions in time among water demand, water supply, and water management sub-systems for each country (refer to Supplementary Appendix A3 for full names of country).
The compositions of the system represented by key patents registered under each of the water demand, water supply, and water management sub-systems changed from one stage to another stage with the change of the overall water technology system in time (Figure 4). At Stage 1 (Figure 4A), the water demand patents mainly focused on energy, transportation, and agriculture sectors. For example, those on hydroelectric power (F03B), ships or other waterborne vessels for shipping (B63B), animal husbandry, pisciculture, and fishing (A01K), marine propulsion or steering (B63H) and transport or storage device near river ports (B65G). With similar relative proportions, the water management patents were dominated by hydraulic engineering (E02B, 72%), including those to better control or use rivers, streams, or other marine sites (E02B), barrages or weirs (E02B), and the surface of open water cleaning (E02B). Additionally, measuring and monitoring river using computer or electricity techniques were also the focus of water management, e.g., measuring river pollutant properties (G01N), water volume flow (G01F), the geometries of river basins (G01C) and water velocity (G01S). The key water supply patents were related to water supply infrastructures, including techniques of the treatment of water, wastewater, sewage or sludge (C02F), river dredging (E02F), hydraulic engineering foundations and embankments construction (E02D), water treatment by using separation methods (B01D), and bridges (E01D).
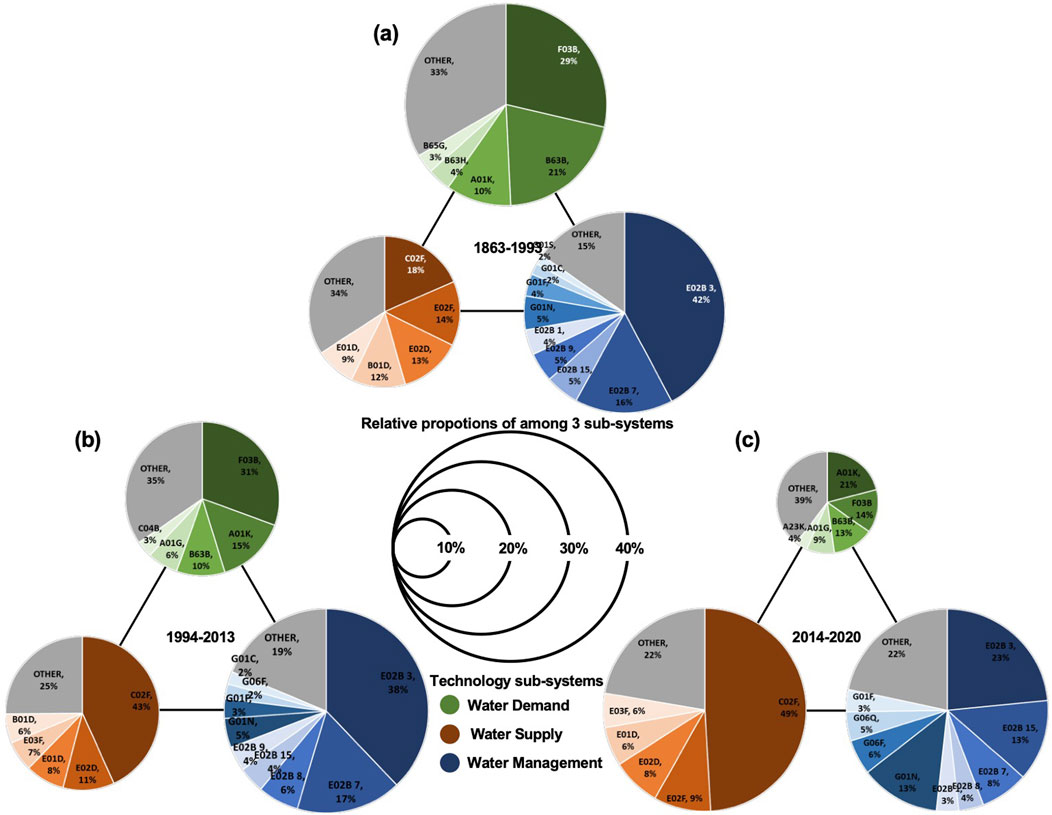
Figure 4. The evolution and relationship between water demand patents (gradient green), water supply patents (gradient orange) and water management patents (gradient blue) with the detailed patent groups at (A) Stage 1 (1863–1993), (B) Stage 2 (1994–2013), and (C) Stage 3 (2014–2020).
During Stage 2, with the relative proportion of water management patents remaining constant and the greatest, the compositions of key patents also remained largely unchanged (Figure 4B). Only techniques for improved river flooding predictions (G06F) emerged in the top 5 most registered patents, replacing river velocity measurement (G01S). Both water demand and water supply patents demonstrated greater changes in their respective compositions. While hydroelectric power techniques (F03B) remained the most dominant for water demand, increasing development in horticulture (A01G) like soilless cultivation (A01G) and cultivation of seaweed (A01G), and the industrial sector (e.g., using river sand as an important construction material (C04B) had emerged. On the other hand, a rapid increase in water treatment techniques (C02F) was observed, about 44% of which were related treatment of water by using physical and chemical methods like sorption (C02F) and biological water treatment (C02F).
Both water management and water supply patents dominated the development in Stage 3 (Figure 4C). Water supply patents showed similar compositions to those in Stage 2. It was noticed that more patents have been related to sludge treatment, especially by using biological treatment (C02F). Water management patents demonstrated much more balanced distributions between hydraulic engineering (E02B) and various techniques used to measure and monitor rivers. Greater changes in compositions for water demand patents were observed. Patents in the agricultural sector had become the most dominant, and a large number of the patents were highly related to the culture of aquatic animal, including animal husbandry, pisciculture, and fishing (A01K), horticulture (A01G), aquatic animal feeding (A23K) and fish physiology and pathology testing process. Besides, there was substantial growth of innovations regarding smaller-scale water demand control, such as water taps or water-delivery valves techniques (F16K).
Considering the intensity of interactions among technologies in the sub-systems (Figure 5A), the interactions between water demand and management patents were strongest at Stage 1 (average degree = 1748), with those between water demand and supply, and between water supply and management being similar (average degree = 1,357 and 1,461, respectively). Hydraulic engineering (E02B) from the water management sub-system contributed the most to the interactions between water demand and management. These technologies mainly focus on stream regulation like waterways beds or open water surface cleaning, the structures or apparatus for revetment of banks, dams and watercourses, as well as the construction or equipment of building barrages, weirs and water-power plants. For the interaction between water supply and demand, the river sand screening plants (B07B) was the dominating contributor. At Stage 2, the intensity between water demand and management patents continued to be the strongest (average degree = 16197). Soil working in agriculture or forestry (A01B) focusing on the restoration of riverbank vegetation, river bottom, and the barren area of riverways were the most dominant contributing technologies. The increasing development in the construction (such as bridges E01D, and hydraulic embankments E02D) sector has increased the intensity between water supply and demand. At Stage 3, the intensity of connections between water supply and management became the strongest (average degree =42381). Its increases were mainly contributed by hydraulic engineering (E02B), water treatment (C02F) and the measurement of water chemical or physical properties (G01N).
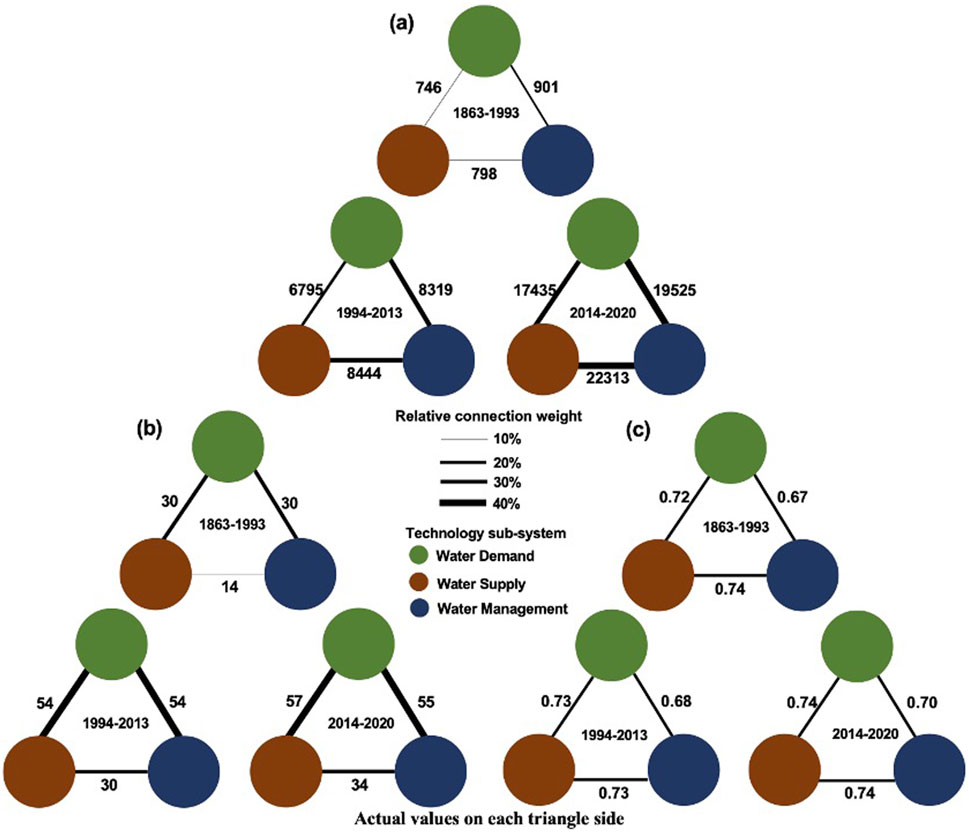
Figure 5. The connections for the Water Demand, Water Supply and Water Management sub-systems measured as (A) intensity, (B) Brokerage, (C) Efficiency at Stage 1 (1863–1993), Stage 2 (1994–2013), and Stage 3 (2014–2020). Each side of the triangle represents the relationship between two sub-systems, with the number on each line indicating the intensity, brokerage and efficiency values of their connections.
It was identified that the interactions with water demand patents demonstrated the strongest brokerage (Figure 5B) in all three stages. At Stage 1, although the brokerage between the water demand and supply sub-systems is similar to that between the water demand and management sub-systems (average betweenness = 18), the patents with high betweenness values differed. For brokerage between water supply and demand, all technologies with high betweenness values belonged to the water demand sub-system. Most of these technologies were related to river sand screening plants (B07B) and ships like launching ships, marine propulsion, or steering (B63B, B63H, B63C). On the other hand, the high betweenness patents that contribute to brokerage between water demand and management patents most belonged to the water management sub-system. Except for the construction of hydraulic engineering, most of the patents focused on the measure of the physical condition of river, such as the measurement of river silt thickness (G01B), river channel distance (G01C) and water toxicity (G01J). Water supply patents were dominant in contributing to brokerage between water supply and water management sub-systems. Most of these technologies were related to the industrial water supply construction technologies such as the construction of embankments (E02D), river dredging (E02F) and ship-lifting devices (E02C). At Stages 2 and 3, the brokerage among all three interactions stabilised, and patent groups with high betweenness values remained largely unchanged from the previous stage.
The efficiency of the interactions (Figure 5C) between water demand and water supply patents, and between water supply and water management remained similar and almost unchanged at all three stages (average closeness = 0.53). On the other hand, the efficiencies between water demand and management patents remained slightly smaller (average closeness value = 0.39) but increased in time. The interactions were dominated by water management patents. It should be noticed that those patents with high betweenness patents were also those with high efficiency in all three interactions throughout the three stages.
This paper developed an understanding of the evolution of the water technology system from a structural perspective. It defined the water technology system as three interactive sub-systems: water demand, water supply, and water management and assessed their interactions as the structure of the water technology system using three network-based metrics: intensity, brokerage, and efficiency. The key findings from this study and their implications are summarized as follows:
• The water technology system was characterized by slow accumulation with limited development (1863–1973), take-off with an exponential growth rate (1974–1993), steady (1994–2013) and then rapid expansions (2014–2020) with linear growth rates in time. The water management patents dominated in all time with the relative proportions about 40% of water management. 44 countries were involved in the invention of these patents with the top five being China, Japan, the Republic of Korea, Russia and the United States. The developed countries were water demand-driven while other countries were more interested in water demand and water management.
• While there were an increasing number of patents in the water supply sub-system developed over time, the composition of this sub-system tended to be homogeneous focusing on water treatment. Diversifications in the compositions of both the water demand (from hydroelectric power to agricultural patents) and water management (from hydraulic engineering to water monitoring) sub-systems.
• It was identified that the water management sub-system had the highest in connection intensity, while the water demand sub-system demonstrated the strongest brokerage. All three sub-systems have similar connection efficiency.
These findings identified the structural failures of the water technology system. First is slow development in time. The overall water technology system demonstrated linear growth since Stage 2, which was slower than many modern technologies such as gene technology and nanotechnology often with an exponential growth pattern (Dua et al., 2008; Li et al., 2007). Second is the spatial imbalance. Globally, only 44 countries had registered water technology patents and there were huge differences in terms of the number of patents registered in these countries. Third is the homogeneousness with limited diversification. Fourth is the structural bottleneck effects. The flow of knowledge is transferred through the technical connection, and technologies with a high betweenness value act as bridges to facilitate knowledge transfer between other technologies across the whole network (Hung and Wang, 2010). The water demand technology sub-system had the strongest bridging effects in the system but was the least developed. Thus, the slow development of water demand may impact the knowledge transfer among water supply and water management sub-systems. The water demand technology sub-system which was the least developed with but the strongest bridging effects in the system. By addressing these structural failures of the water technology system, our capacity for efficiently managing and directing water technology transition to cope with global water threats would be substantially increased.
These developments of the water technology system reflected different regimes of water governance philosophy over time. The dominant development of water supply technologies particularly at an early stage reflected the “hydraulic regime” as increasing water supply was considered the major solution to population growth and economic development. Water resource management during this regime favoured top-down, centralised institutional control and an engineering approach to investing in large-scale infrastructures. For example, China focuses on the construction of large-scale infrastructure projects like dams, reservoirs, and transfer schemes (Liu et al., 2013). Then, the development of a large number of water management technologies implies a “water sensitive regime”. For example, Australia has been considered a benchmark practicing integrated water resource management principle, which focuses on better informational support and bottom-up, community based decision-makings (Connell and Grafton, 2011; Ferguson et al., 2013; Zhai et al., 2022). The development of water demand technologies demonstrated a “water market regime” that flexibly adjusted its development priorities in time to improve economic efficiency. For example, the United Kingdom tends to focus on using multiple innovations to more effectively manage water demand (Parker and Wilby, 2013). Therefore, to address these structural failures of the water technology system requires a shift of water governance philosophy which is a combination of the cultural, economic, and institutional settings.
Methodologically, our approach contributes to a move towards more configurational theorizing in technological innovation towards sustainability transitions. By explicitly connecting technology development to a specific water governance challenge (water supply, water demand, water management) and by analysing the structure of a technology system from its composition and interactions using network-based metrics, our approach can quantitively assess the structure of a water technology system to address the structural failure of technology innovation. This will complement the existing knowledge on neoclassical economics which aims to address the market failure of technology innovation and the existing knowledge on sociology to address the institutional failure of technology innovation. In addition, our approach enables comparisons of context-specific technology systems across different sectors and different development stages, thus providing systemic diagnosis for reconfigurations of the water technology system (Bodin et al., 2019).
There are certain limitations to this study. Firstly, patents are only one main source of technology. We recognise that there may be water technologies that are not patented and/or documented in grey literature. Secondly, registering a patent does not mean the application of a technology. It is therefore important to consider the practical realities regarding human and financial resource investments required to deploy a patent into practice. Finally, we analysed interactions among technology sub-systems based on the co-occurrences of patents from different sub-systems within the same country. Future studies could provide a more precise construction of the network based on the citations between patents, and analysing the patent texts will provide a more detailed understanding of the content of patents.
In conclusion, the study develops a framework to define water technology as a complex adaptive system containing three sub-systems: water demand, water supply, and water management. The structure of the system was measured as an interacted network using three network-based metrics: intensity, brokerage, and efficiency metrics. It was found that the water technology system had linear growth rates in time, skewed spatial coverage, categorical homogeneity, and structural imbalances. These findings imply that past development of water technology could not address the increasing global water threats to human society. The findings from this study will assist in the identification of structural failure in water technology system.
The original contributions presented in the study are included in the article/Supplementary Material, further inquiries can be directed to the corresponding author.
LG: Conceptualization, Data curation, Formal Analysis, Methodology, Writing–original draft, Writing–review and editing. YW: Conceptualization, Methodology, Validation, Writing–review and editing. SW: Conceptualization, Methodology, Validation, Writing–review and editing.
The author(s) declare that financial support was received for the research, authorship, and/or publication of this article. The research is funded by the University of Queensland Graduate School for Research Training Program scholarship. This study is supported by the Australian Research Council Special Research Initiative (SR200200186).
The authors declare that the research was conducted in the absence of any commercial or financial relationships that could be construed as a potential conflict of interest.
The author(s) declared that they were an editorial board member of Frontiers, at the time of submission. This had no impact on the peer review process and the final decision.
All claims expressed in this article are solely those of the authors and do not necessarily represent those of their affiliated organizations, or those of the publisher, the editors and the reviewers. Any product that may be evaluated in this article, or claim that may be made by its manufacturer, is not guaranteed or endorsed by the publisher.
The Supplementary Material for this article can be found online at: https://www.frontiersin.org/articles/10.3389/fenvs.2024.1447120/full#supplementary-material
Aharonson, B. S., and Schilling, M. A. (2016). Mapping the technological landscape: measuring technology distance, technological footprints, and technology evolution. Res. Policy 45 (1), 81–96. doi:10.1016/j.respol.2015.08.001
Albino, V., Ardito, L., Dangelico, R. M., and Petruzzelli, A. M. (2014). Understanding the development trends of low-carbon energy technologies: a patent analysis. Appl. Energy 135, 836–854. doi:10.1016/j.apenergy.2014.08.012
Anadon, L. D., Chan, G., Harley, A. G., Matus, K., Moon, S., Murthy, S. L., et al. (2016). Making technological innovation work for sustainable development. Proc. Natl. Acad. Sci. 113 (35), 9682–9690. doi:10.1073/pnas.1525004113
Biggs, R., Clements, H., de Vos, A., Folke, C., Manyani, A., Maciejewski, K., et al. (2021). “What are social-ecological systems and social-ecological systems research?,” in The Routledge handbook of research methods for social-ecological systems (Abingdon, Oxon, United Kingdom: Routledge), 3–26.
Bodin, Ö., Alexander, S. M., Baggio, J., Barnes, M. L., Berardo, R., Cumming, G. S., et al. (2019). Improving network approaches to the study of complex social–ecological interdependencies. Nat. Sustain. 2 (7), 551–559. doi:10.1038/s41893-019-0308-0
Bodin, Ö., Crona, B., and Ernstson, H. (2006). Social networks in natural resource management: what is there to learn from a structural perspective? Ecol. Soc. 11 (2), resp2. doi:10.5751/es-01808-1102r02
Brikké, F., Bredero, M., Supply, W., and Network, M. (2003). Linking technology choice with operation and maintenance in the context of community water supply and sanitation: a reference document for planners and project staff.
Brooks, D. B. (2006). An operational definition of water demand management. Int. J. Water Resour. Dev. 22 (4), 521–528. doi:10.1080/07900620600779699
Cerveira, G. S., Magalhães, J. L. d., and Antunes, A. M. d. S. (2022). Status and trends of membrane technology for wastewater treatment: a patent analysis. Sustainability 14 (21), 13794. doi:10.3390/su142113794
Connell, D., and Grafton, R. Q. (2011). Water reform in the murray-darling basin. Water Resour. Res. 47 (12). doi:10.1029/2010wr009820
Cressman, D. (2009). A brief overview of actor-network theory: punctualization, heterogeneous engineering & translation.
De Rassenfosse, G., Dernis, H., Guellec, D., Picci, L., and de la Potterie, B. v. P. (2013). The worldwide count of priority patents: a new indicator of inventive activity. Res. Policy 42 (3), 720–737. doi:10.1016/j.respol.2012.11.002
Dua, P., Kim, S., and Lee, D.-K. (2008). Patents on SELEX and therapeutic aptamers. Recent Pat. DNA & Gene Sequences Discontin. 2 (3), 172–186. doi:10.2174/187221508786241710
Edquist, C. (2005). in Systems of innovation: perspectives and challenges/the oxford handbook of innovation. Editors J. Fagerberg, D. C. Mowery, and R. Nelson
Ferguson, B. C., Brown, R. R., Frantzeskaki, N., de Haan, F. J., and Deletic, A. (2013). The enabling institutional context for integrated water management: lessons from Melbourne. Water Res. 47 (20), 7300–7314. doi:10.1016/j.watres.2013.09.045
Fleming, L., and Sorenson, O. (2001). Technology as a complex adaptive system: evidence from patent data. Res. Policy 30 (7), 1019–1039. doi:10.1016/s0048-7333(00)00135-9
Freeman, L. C. (1978). Centrality in social networks conceptual clarification. Soc. Netw. 1 (3), 215–239. doi:10.1016/0378-8733(78)90021-7
Gan, L., Wei, Y., and Wu, S. (2024). Using the evolution of a river technology system to compare classification-based and citation-based technology networks. Water 16.
Garud, R., and Rappa, M. A. (1994). A socio-cognitive model of technology evolution: the case of cochlear implants. Organ. Sci. 5 (3), 344–362. doi:10.1287/orsc.5.3.344
Granovetter, M. (1983). The strength of weak ties: a network theory revisited. Sociol. theory 1, 201–233. doi:10.2307/202051
Granovetter, M. S. (1973). The strength of weak ties. Am. J. Sociol. 78 (6), 1360–1380. doi:10.1086/225469
Gray, N. (2010). Water technology: an introduction for environmental scientists and engineers. 3rd ed. Colchester, United Kingdom: CRC Press.
Haff, P. (2014). Humans and technology in the anthropocene: six rules. Anthropocene Rev. 1 (2), 126–136. doi:10.1177/2053019614530575
Hughes, T. P. (1987). The evolution of large technological systems. Soc. Constr. Technol. Syst. New Dir. Sociol. Hist. Technol. 82, 51–82.
Hung, S.-W., and Wang, A.-P. (2010). Examining the small world phenomenon in the patent citation network: a case study of the radio frequency identification (RFID) network. Scientometrics 82 (1), 121–134. doi:10.1007/s11192-009-0032-z
Im, E.-J., and Kim, S.-H. (2012). Patents map on the desalination technology using solar energy. New & Renew. Energy 8 (1), 35–43. doi:10.7849/ksnre.2012.8.1.035
Khalid, A. R. M. (2004). The interlinking of rivers project in India and International water law: an overview. Chin. J. Int'l L. 3, 553–570. doi:10.1093/oxfordjournals.cjilaw.a000534
Klein, H. K., and Kleinman, D. L. (2002). The social construction of technology: structural considerations. Sci. Technol. & Hum. Values 27 (1), 28–52. doi:10.1177/016224390202700102
Li, X., Lin, Y., Chen, H., and Roco, M. C. (2007). Worldwide nanotechnology development: a comparative study of USPTO, EPO, and JPO patents (1976–2004). J. Nanoparticle Res. 9, 977–1002. doi:10.1007/s11051-007-9273-z
Liggett, J. A. (2002). What is hydraulic engineering? J. Hydraulic Eng. 128 (1), 10–19. doi:10.1061/(asce)0733-9429(2002)128:1(10)
Liu, J., Zang, C., Tian, S., Liu, J., Yang, H., Jia, S., et al. (2013). Water conservancy projects in China: achievements, challenges and way forward. Glob. Environ. Change 23 (3), 633–643. doi:10.1016/j.gloenvcha.2013.02.002
Mao, G., Han, Y., Liu, X., Crittenden, J., Huang, N., and Ahmad, U. M. (2022). Technology status and trends of industrial wastewater treatment: a patent analysis. Chemosphere 288, 132483. doi:10.1016/j.chemosphere.2021.132483
Marin, D., Tang, M., Ayed, I. B., and Boykov, Y. (2017). Kernel clustering: density biases and solutions. IEEE Trans. pattern analysis Mach. Intell. 41 (1), 136–147. doi:10.1109/tpami.2017.2780166
Mekonnen, M. M., and Hoekstra, A. Y. (2016). Four billion people facing severe water scarcity. Sci. Adv. 2 (2), e1500323. doi:10.1126/sciadv.1500323
Merrey, D., and Awulachew, S. B. (2015) “Critical roles of water in achieving the proposed SDGs: a nexus perspective (water-energy-food-climate change),”. United Nations, New York City, NY. Lecture, Workshop on “Capacity Development in Advancing Water and Sustainable Development.
Moreira, F. d. S., Antunes, A. M. d. S., and de Freitas, M. A. V. (2019). Trends in wind-power desalination for water supply. J. Environ. Prot. 10 (06), 807–820. doi:10.4236/jep.2019.106048
Newson, M. (2008). Land, water and development: sustainable and adaptive management of rivers. Abingdon, Oxon, United Kingdom: Routledge.
Parker, J. M., and Wilby, R. L. (2013). Quantifying household water demand: a review of theory and practice in the UK. Water Resour. Manag. 27, 981–1011. doi:10.1007/s11269-012-0190-2
Qiao, N., Fang, L., and Mu, L. (2020). Evaluating the impacts of water resources technology progress on development and economic growth over the Northwest, China. PloS one 15 (3), e0229571. doi:10.1371/journal.pone.0229571
Schoengold, K., and Zilberman, D. (2007). The economics of water, irrigation, and development. Handb. Agric. Econ. 3, 2933–2977. doi:10.1016/S1574-0072(06)03058-1
Schot, J., and Steinmueller, W. E. (2018). Three frames for innovation policy: R&D, systems of innovation and transformative change. Res. Policy 47 (9), 1554–1567. doi:10.1016/j.respol.2018.08.011
Siegenfeld, A. F., and Bar-Yam, Y. (2020). An introduction to complex systems science and its applications. Complexity 2020, 1–16. doi:10.1155/2020/6105872
Sun, X., Jin, L., Zhou, F., Jin, K., Wang, L., Zhang, X., et al. (2022). Patent analysis of chemical treatment technology for wastewater: status and future trends. Chemosphere 135802. doi:10.1016/j.chemosphere.2022.135802
Valente, T. W., Coronges, K., Lakon, C., and Costenbader, E. (2008). How correlated are network centrality measures? Connect. Tor. Ont. 28 (1), 16–26.
Walker, B., Holling, C. S., Carpenter, S. R., and Kinzig, A. (2004). Resilience, adaptability and transformability in social–ecological systems. Ecol. Soc. 9 (2), art5. doi:10.5751/es-00650-090205
Weber, K. M., and Truffer, B. (2017). Moving innovation systems research to the next level: towards an integrative agenda. Oxf. Rev. Econ. Policy 33 (1), 101–121. doi:10.1093/oxrep/grx002
Wei, Y., Wu, S., and Tesemma, Z. (2018). Re-orienting technological development for a more sustainable human–environmental relationship. Curr. Opin. Environ. Sustain. 33, 151–160. doi:10.1016/j.cosust.2018.05.022
Wiedenhofer, D., Steinberger, J. K., Eisenmenger, N., and Haas, W. (2015). Maintenance and expansion: modeling material stocks and flows for residential buildings and transportation networks in the EU25. J. Industrial Ecol. 19 (4), 538–551. doi:10.1111/jiec.12216
WIPO. (2022a). IPC publication. Available at: https://ipcpub.wipo.int/?notion=scheme&version=20220101&symbol=none&menulang=en&lang=en&viewmode=f&fipcpc=no&showdeleted=yes&indexes=no&headings=yes¬es=yes&direction=o2n&initial=A&cwid=none&tree=no&searchmode=smart
WIPO (2022b). National collections - data coverage. Available at: https://patentscope.wipo.int/search/en/help/data_coverage.jsf.
Woolthuis, R. K., Lankhuizen, M., and Gilsing, V. (2005). A system failure framework for innovation policy design. Technovation 25 (6), 609–619. doi:10.1016/j.technovation.2003.11.002
Wu, S., Wei, Y., Head, B., and Hanna, S. (2021). Measuring the structure of a technology system for directing technological transition. Glob. Challenges 5 (2), 2000073. doi:10.1002/gch2.202000073
Wu, S., Wei, Y., Head, B., Zhao, Y., and Hanna, S. (2019). The development of ancient Chinese agricultural and water technology from 8000 BC to 1911 AD. Palgrave Commun. 5 (1), 77. doi:10.1057/s41599-019-0282-1
Yuan, J., Yue, W., Su, C., Wu, Z., Ma, Z., Pan, Y., et al. (2010). Patent activity on water pollution and treatment in China—a scientometric perspective. Scientometrics 83 (3), 639–651. doi:10.1007/s11192-009-0126-7
Keywords: patent analysis, network-based framework, water demand, water supply, water management
Citation: Gan L, Wei Y and Wu S (2024) Evolution of water technology from a structural perspective. Front. Environ. Sci. 12:1447120. doi: 10.3389/fenvs.2024.1447120
Received: 11 June 2024; Accepted: 25 September 2024;
Published: 11 October 2024.
Edited by:
Buddhi Wijesiri, Queensland University of Technology, AustraliaReviewed by:
Chen Wang, Nanjing University of Finance and Economics, ChinaCopyright © 2024 Gan, Wei and Wu. This is an open-access article distributed under the terms of the Creative Commons Attribution License (CC BY). The use, distribution or reproduction in other forums is permitted, provided the original author(s) and the copyright owner(s) are credited and that the original publication in this journal is cited, in accordance with accepted academic practice. No use, distribution or reproduction is permitted which does not comply with these terms.
*Correspondence: Shuanglei Wu, c2h1YW5nbGVpLnd1QGd4dS5lZHUuY24=
Disclaimer: All claims expressed in this article are solely those of the authors and do not necessarily represent those of their affiliated organizations, or those of the publisher, the editors and the reviewers. Any product that may be evaluated in this article or claim that may be made by its manufacturer is not guaranteed or endorsed by the publisher.
Research integrity at Frontiers
Learn more about the work of our research integrity team to safeguard the quality of each article we publish.