
95% of researchers rate our articles as excellent or good
Learn more about the work of our research integrity team to safeguard the quality of each article we publish.
Find out more
ORIGINAL RESEARCH article
Front. Environ. Sci. , 13 September 2024
Sec. Environmental Informatics and Remote Sensing
Volume 12 - 2024 | https://doi.org/10.3389/fenvs.2024.1446313
 Feiyu Wang1†
 Yang Han1*†
 Yaping Xu2Ruifei Zhu3Chunmei Qu3Peng Zhang3
 Stanton Martin4
 Lijuan Zhuang1Zhuxin Liu1Jiani Zhang1
 Fang Huang1*
Jilin Province is a crucial region of interest for agricultural and forestry development in China. The deterioration of its ecological environment could have a severe impact on agricultural production and ecological conservation. A systematic assessment of ecological environment quality in Jilin Province is essential for its sustainable development. In this study, we utilized Landsat data from 1990 to 2020 (every 5 years) to construct the Remote Sensing Ecological Index (RSEI) for Jilin Province. We applied the Sen’s slope estimator and the Mann-Kendall trend test to examine the spatiotemporal changes in ecological environment quality over a 30-year period. Additionally, we employed the Geo-detector to explore the socioeconomic and natural factors influencing ecological environment quality. The results revealed: 1) From 1990 to 2020, the average RSEI index in Jilin Province ranged from 0.586 to 0.699, indicating overall good ecological environment quality. Spatially, ecological environment quality gradually declined from east to west. 2) The RSEI in Jilin Province exhibited an initial increase, followed by a decrease, and then another increase trend. This improvement can be attributed to the implementation of government policies, which reversed the expansion of saline-alkali land. Ecological environment quality significantly improved in the western region of Jilin Province over the 30-year period. 3) Socioeconomic and natural factors both influence ecological environment quality in Jilin Province. Among these factors, vegetation coverage has the most significant impact on the ecological environment quality in the study area, with natural factors exerting a more significant influence than socioeconomic factors. Our research can provide relevant data support for policy-making in Jilin Province.
Biosphere is the foundation for human survival and production, and a healthy ecological environment within the biosphere is essential for human development and fundamental wellbeing (Liu et al., 2017). As human society has progressed, the ecological environment has suffered serious damage (Wang et al., 2018; Zhu et al., 2022), including but not limited to air pollution, water pollution, land degradation, and diminishing vegetation coverage (Feng et al., 2021; Shen et al., 2022; Wu et al., 2022). The IPCC Sixth Assessment Report underscores the significant role of human activities in driving global warming and the extensive changes occurring within the global climate system (Allan et al., 2021). Consequently, the assessment of regional ecological environment quality takes on paramount significance in the pursuit of environmental protection (Gómez et al., 2018).
Remote sensing, with its unique characteristics of providing a macroscopic view, multispectral capability and availability of multi-temporal data, has proven to be indispensable in assessing regional ecological environment quality (Zhou and He, 2014; Li J. et al., 2020; Qian et al., 2022). Through remote sensing, critical insights into ecosystem dynamics can be gained, aiding in environmental monitoring and resource management. For instance, the creation of indices such as the Normalized Difference Vegetation Index (NDVI) or Leaf Area Index (LAI) has been pivotal in evaluating vegetation coverage (Yu et al., 2019; Zuo et al., 2022), and the development of the Net Primary Productivity (NPP) has facilitated the assessment of wetland ecosystems (Li X. W. et al., 2020; Zhang T. T. et al., 2022). Despite these individual indicators are significant, these indicators may fall short in capturing the full complexity of environmental conditions.
Remote Sensing Ecological Index (RSEI) is a comprehensive ecological index constructed through principal component analysis of four factors: greenness, wetness, dryness, and warmth (Xu, 2013b). RSEI serves as a valuable tool for evaluating the ecological environment quality of a region. All the required indicators for this index come from remote sensing imagery, which not only overcomes spatial scale limitations but also allows for the visualization of regional ecological conditions. Consequently, RSEI has been widely applied in ecological environment quality assessments (Yuan et al., 2021; An et al., 2022; Yang and Li, 2023). Currently, RSEI has achieved positive results in ecosystem monitoring and management, ecological environment assessment, and biodiversity conservation (Ariken et al., 2020; Zhang M. M. et al., 2022; Liu et al., 2023; Liu et al., 2024).
From the previous studies, the scale of ecological quality evaluation is usually based on regions, for example, (Huang et al., 2024), conducted research on ecological environment quality in the Beijing-Tianjin-Hebei region; (Li N. et al., 2024); conducted research on ecological environment quality in the Chaohu Lake Basin. These studies cover relatively large areas, enabling policymakers to make recommendations from a macro perspective. However, in the top-down policy implementation process of macro-level ecological management policies, there is a policy lag. Every district and county lacks freedom and initiative, which is not conducive to the development of local conditions. Therefore, dividing the research area into smaller administrative regions is conducive to the policy formulation of the local government.
Jilin Province is a multifunctional region in northeastern China, rich in agricultural and forest resources (Hou et al., 2010), with significant industrial bases, and unique natural landscapes and tourism resources. It plays a crucial role in both development and ecological conservation in the northeastern region of China (Shuqing and Qi, 2010). Based on the above background, this study utilizes the Google Earth Engine (GEE) platform to assess the ecological environment quality of Jilin Province over the past 30 years objectively. Between 1990 and 2020, an image was selected every 5 years for RSEI index calculation.We subdivided Jilin province into 47 administrative units (county-level administrative units) to analyze the variation of ecological environment quality. Additionally, eight factors were chosen to explore their contributions and interactions. Integrating these analyses, the main objectives of this study are as follows: 1) Investigate the spatial distribution characteristics of ecological environment quality in Jilin Province; 2) The county administrative unit was taken as the research unit to studied the changes of each county in Jilin Province in the past 30 years. 3)Analyze the influencing factors of spatial differences in ecological environment quality in Jilin Province. The main innovation of this paper lies in dividing Jilin Province into regions by county and analyzing the ecological environment quality of each county, with the aim of providing valuable references for relevant departments.
Jilin Province located in the central part of Northeast China and holds significant geographical importance. The provincial capital is Changchun City. Jilin Province has a vast territory, with a total area of approximately 187,400 square kilometers. The climate in Jilin Province falls under a continental climate, characterized by cold and dry winters and warm and humid summers, with an annual average temperature ranging from 0°C to 7°C. The terrain of Jilin Province is diverse, encompassing plains, hills, mountain ranges and lakes. From the regional location, Jilin Province can be divided into eastern Jilin, central Jilin and western Jilin. In the eastern, central, and western regions of Jilin Province, each area has distinct characteristics. The eastern region is primarily characterized by its connection to the Changbai Mountains, which contributes to its predominant forest coverage. The central region is an economically developed area of Jilin Province. As for the western region, it is notable for its vast expanse of saline-alkali land, being one of the concentrated distribution areas of the world’s three major soda-saline land regions (Figure 1).
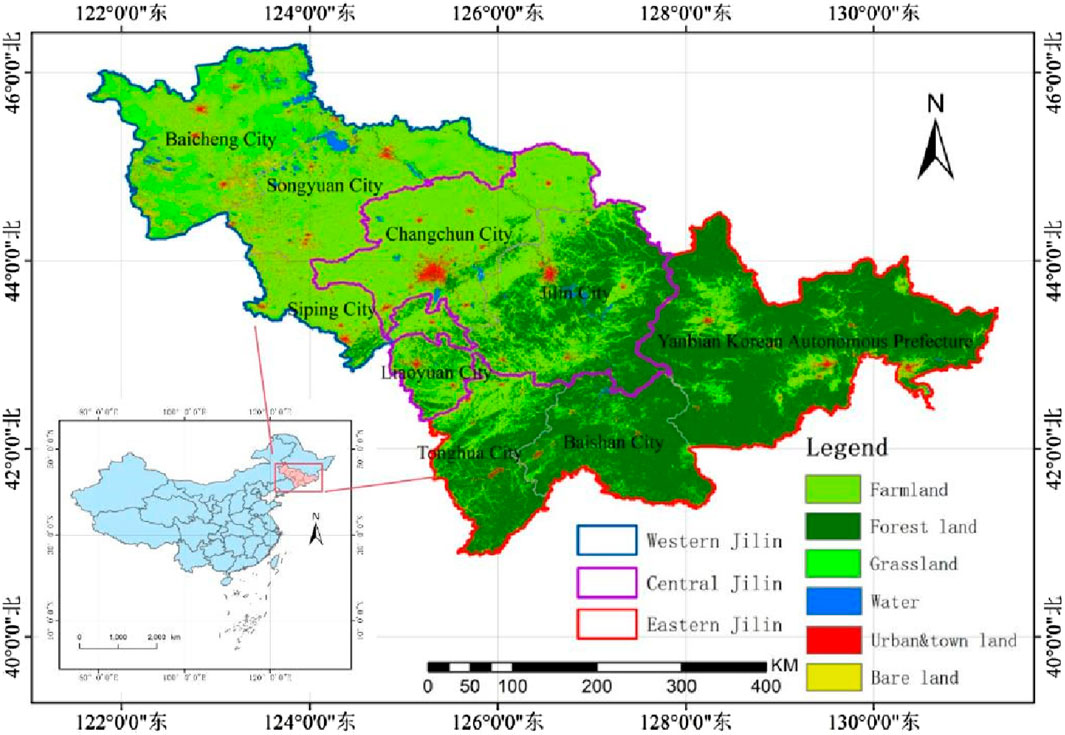
Figure 1. Land use types in the Study Area.
Google Earth Engine (GEE) is the world’s leading cloud-based platform and geographic information processor, specializing in the handling of remote sensing imagery and a myriad of Earth observation data. Its exceptional convenience and visualization features have rendered it a highly preferred choice.
The data utilized in this study include remote sensing data and statistical data. Quantitative retrieval calculations of remote sensing indices require atmospheric correction. GEE provides data from the Landsat sensor, which has undergone atmospheric correction using the Land Surface Reflectance Code (LaSRC) for all bands. Therefore, this paper selects Landsat surface reflectance data from GEE as the data source for RSEI inversion, as listed in Table 1. The study selects imagery from the months of July and August to represent the conditions of the year. The reasons of this selection are as follows: 1) The Northeast region experiences cold winters, and selecting imagery from July and August ensures that there is no snow cover across Jilin Province. 2) As vegetation is in its peak growing season during these months, it allows for better differentiation of various land cover types in Jilin Province. During the data acquisition process, it was noted that obtaining complete coverage of Jilin Province for a full year’s worth of Landsat imagery is challenging. Therefore, leveraging the advantages of the GEE platform, this study uses the median values of remote sensing imagery from 1 year before and after, totaling 3 years for analysis (Jia et al., 2021). The specific methodology is illustrated in Figure 2.
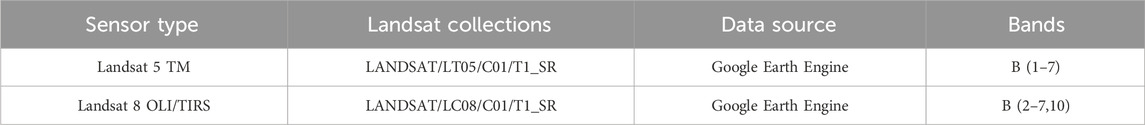
Table 1. Datasets used in this study.
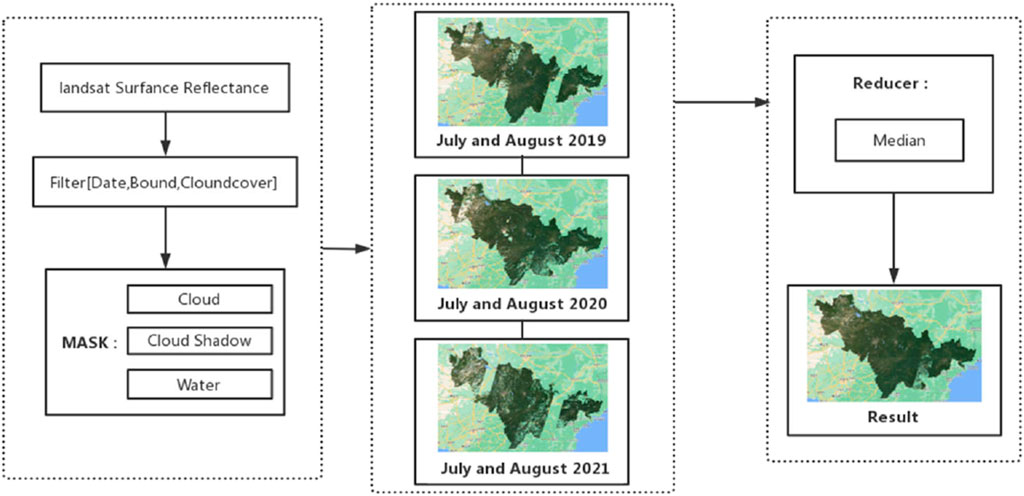
Figure 2. Remote sensing data processing diagram.
This study selected eight factors influencing the ecological environment from both socio-economic and natural perspectives. Population density, agricultural output value, and forestry output value data were sourced from the Jilin Provincial Statistical Yearbook (http://tjj.jl.gov.cn/tjsj/tjnj/). Elevation, temperature, and precipitation data were obtained directly from the GEE platform. Slope was calculated in ArcGIS using elevation data, and vegetation cover data were calculated using NDVI on the GEE platform.
RSEI is a comprehensive ecological indicator specifically designed for assessing ecological conditions (Xu, 2013b). RSEI is constructed by selecting four components that are closely related to ecological and environmental quality: greenness, wetness, heat, and dryness.
The four remote sensing indices are as follows: Normalized Difference Vegetation Index (NDVI) represents greenness; Wetness (WET)represents wetness; WET is represented by the wet component of a Tasseled Cap Transformation, different formulas are used for different sensors (TM and OLI); Normalized Difference Building Soil Index (NDBSI) represents dryness, where NDBSI is generated by the Soil Index (SI) and Index-based Built-up Index (IBI); Land Surface Temperature (LST) represents heat, which is represented by the temperature corrected by the specific emissivity.
The presence of water bodies can have a notable effect on the calculation of NDVI and various other index components, consequently affecting the RSEI value determined via Principal Component Analysis. Therefore, it is imperative to employ masking techniques to exclude water bodies within the study area. In this paper, we used the Modified Normalized Difference Water Index (MNDWI) (Xu, 2006) to mask the water body. The formulas for calculating the above remote sensing indices are provided in Table 2.
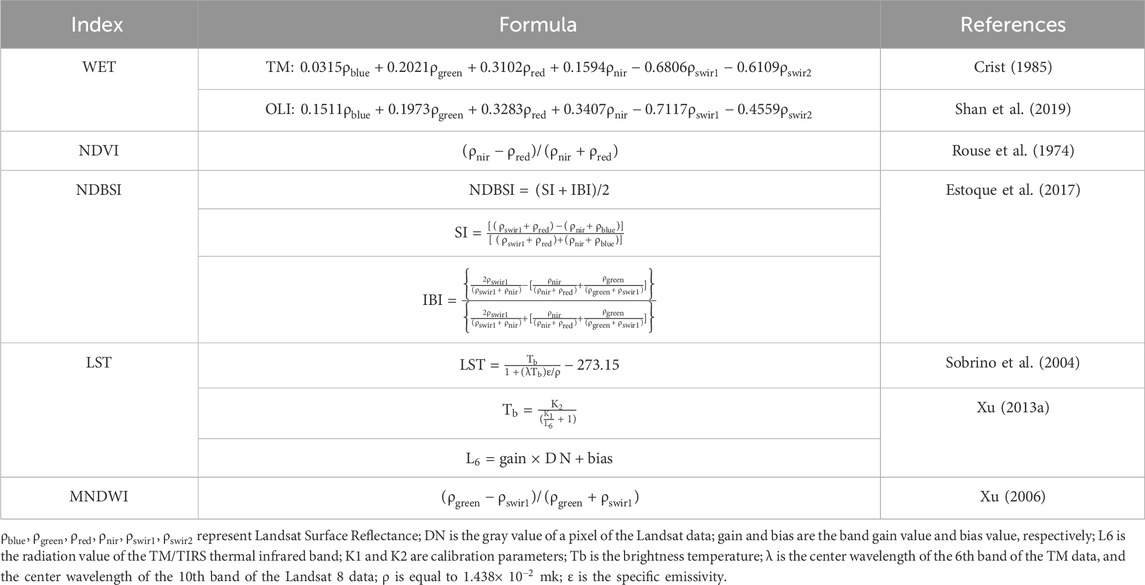
Table 2. WET, NDVI, NDBSI, LST and MNDWI calculation formulas.
Principal Component Analysis (PCA) is used to combine the four component indices mentioned above, and the first principal component (PC1) is used to construct RSEI. Since each index has different units and numerical ranges, it is necessary to normalize the values of these indices to bring their ranges into a uniform scale between 0 and 1. The normalization is expressed as:
Where
PC1 is the first principal component of four indicators, expressed as RSEI0. RSEI is calculated from RSEI0 using a normalization method, the final RSEI value represents the ecological condition of the study area. RSEI ranges from [0, 1], A higher RSEI value indicates better ecological environmental quality. In order to distinguish the ecological quality of the study area, we use the equal interval classification method categorize the RSEI values into five levels: Excellent (0.8, 1], Good (0.6, 0.8], Moderate (0.4, 0.6], Poor (0.2, 0.4], and Very Poor [0.0, 0.2] (Firozjaei et al., 2021; Peng et al., 2023).
Geographic detector assesses spatial heterogeneity by examining the spatial consistency of two different variables, and the ultimate result of the analysis is the detection of a potential causal relationship between these two different variables. This research employs factor detectors and interaction detectors to investigate the factors contributing to differences in spatial pattern distribution (Wang and Xu, 2017). Prior to modeling, data preprocessing was performed, and data integration depended on spatial units.We set sampling points to enable use geographic detectors. A grid of 5 km × 5 km was established within the study area, and the central points of the grid cells were obtained as sample points, totaling 9,854. After that, we used the Natural Breaks method in ArcGIS 10.8 to categorize the independent variables.
Factor detection: Typically calculated by the q-value, the purpose is to assess the extent to which factors explain differences in attribute space. The formula is represented as:
In the equation: h = 1, … , L represents the strata or layers of variable Y or factor X, which can be considered as categories or zones;
Interaction Detection: The primary function of interaction detectors is to identify interactions between different independent variables. By calculating the q-statistic values for each independent variable’s individual effect on the dependent variable and then calculating the q-statistic values for their pairwise interactions on the dependent variable, a comparison is made between the two. The assessment of interactions is determined by the relative magnitudes. The specific method for making judgments (Table 3) is illustrated with factors X1 and X2 as examples. Firstly, two influencing factors are selected as independent variables, and the explanatory power of each selected independent variable on the dependent variable Y is calculated, denoted as q(X1) and q(X2) respectively. Secondly, the explanatory power of the two independent variables interacting with each other on the dependent variable Y, denoted as q (X1 ∩ X2), is computed. Finally, a comparison is made among these three results to determine whether the interaction between the two factors enhances or diminishes their influence on the dependent variable compared to when considered individually.
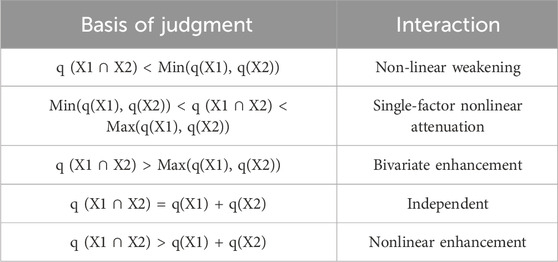
Table 3. Interaction types and criteria for judgment.
The combination of the Sen’s slope estimator and the Mann-Kendall trend test has become an important method for assessing trends in time series data and is gradually being applied in the analysis of temporal changes. The Sen’s slope estimator is used to calculate the Sen value by computing the median of the sequence, but it alone cannot determine the significance of the trend in the sequence. Significance testing of the Sen value is carried out using the Mann-Kendall test. This method is suitable for analyzing data with missing values, reduces the interference of outliers, has good robustness against outlier data and measurement errors, and does not require specific data distribution assumptions. The calculation of Sen’s slope estimator is as follows:
In the equation: i and j represent the years i and j, respectively;
Mann-Kendall Trend Test: For a sequence X = (
In the equation, Z represents the standardized test statistic; S is the test statistic; n is the sample size of the sequence; m is the number of data groups with repeated values in the sequence. At the given significance level α, the critical value ‘a' is obtained from the normal distribution table. When |Z| ≤
In the seven remote sensing images spanning from 1990 to 2020 in Jilin Province, the contribution rate of pc1 ranged from 82.83% to 93.57%, indicating that pc1 captures most characteristics from the four component indices. In PC1, the eigenvalues of NDVI and WET are positive, while the eigenvalues of NDBSI and LST are negative. This indicates that there is a positive correlation between RSEI and NDVI as well as WET, and a negative correlation between RSEI and NDBSI as well as LST, which aligns with the actual situation (Table 4).
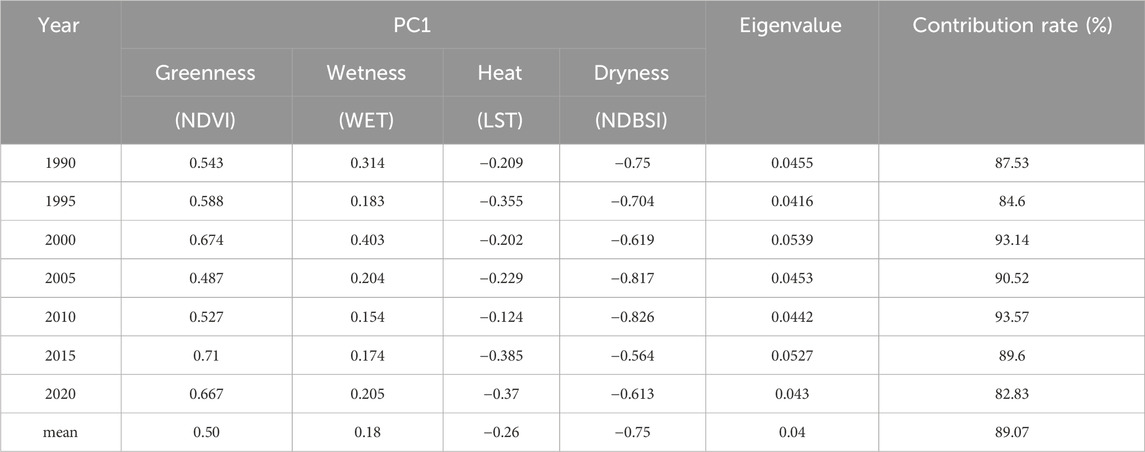
Table 4. First principal component of principal component analysis.
The spatial distribution of RSEI in Jilin Province from 1990 to 2020 is depicted in the Figure 3. Two key characteristics of the spatial distribution of ecological environmental quality in Jilin Province can be observed. Firstly, in terms of spatial distribution a distinct disparity in ecological environmental quality is evident between the eastern and western regions of Jilin Province. The eastern regions receive higher ecological environmental quality assessments, whereas the western regions receive lower assessments. Secondly, considering urban-rural disparities, urban areas tend to exhibit less favorable ecological environmental quality assessments compared to their rural counterparts. Notably, specific urban areas, such as the city centers of Changchun and Jilin City, demonstrate particularly low ecological environmental quality.
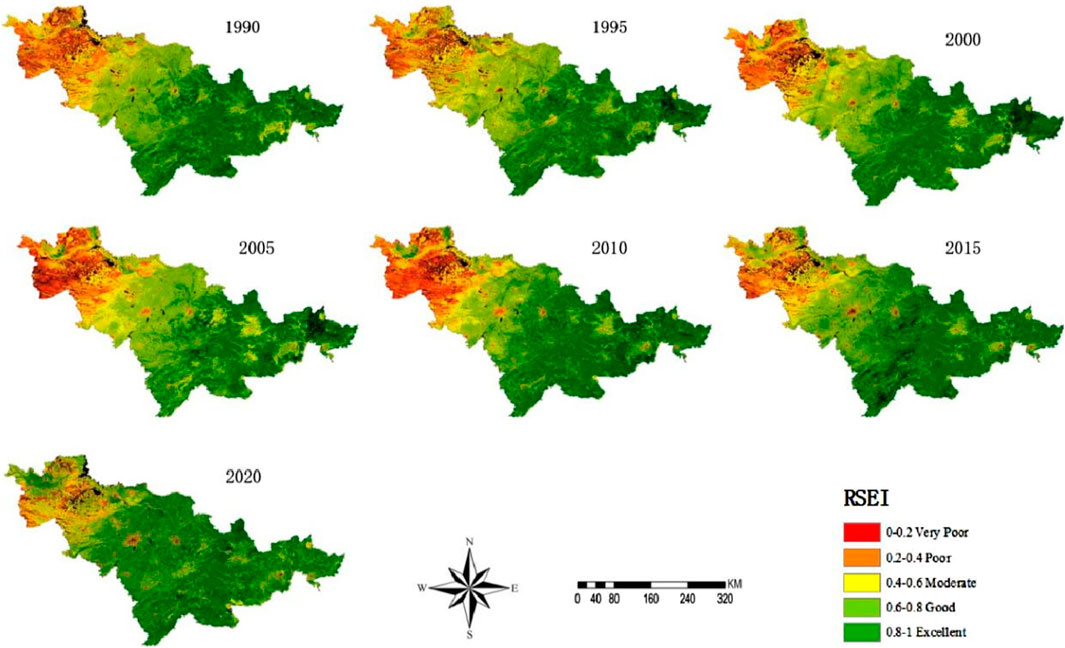
Figure 3. Spatial distribution pattern of Jilin Province’s RSEI from 1990 to 2020.
In Jilin Province, we selected representative land cover types including agricultural, forested, saline-alkali, and urban areas, to discern the variations in RSEI assessment outcomes (Figure 4). We found that the water separated with MNDWI was consistent with the actual situation. Subsequently, due to saline-alkali areas contend with challenges such as soil quality degradation and limited water resources, while urban regions are directly impacted by urbanization and extensive land development, resulting in poor RSEI evaluations for both these zones (Figures 4C,D). Conversely, agricultural areas, characterized by crop cultivation, exhibited RSEI levels tending towards moderate to high (Figure 4A). Forested regions showcased dense vegetation, indicating superior ecological quality (Figure 4C). The congruence between assessment outcomes and ground realities underscores the efficacy of RSEI methodology in appraising ecological quality across diverse land cover types.
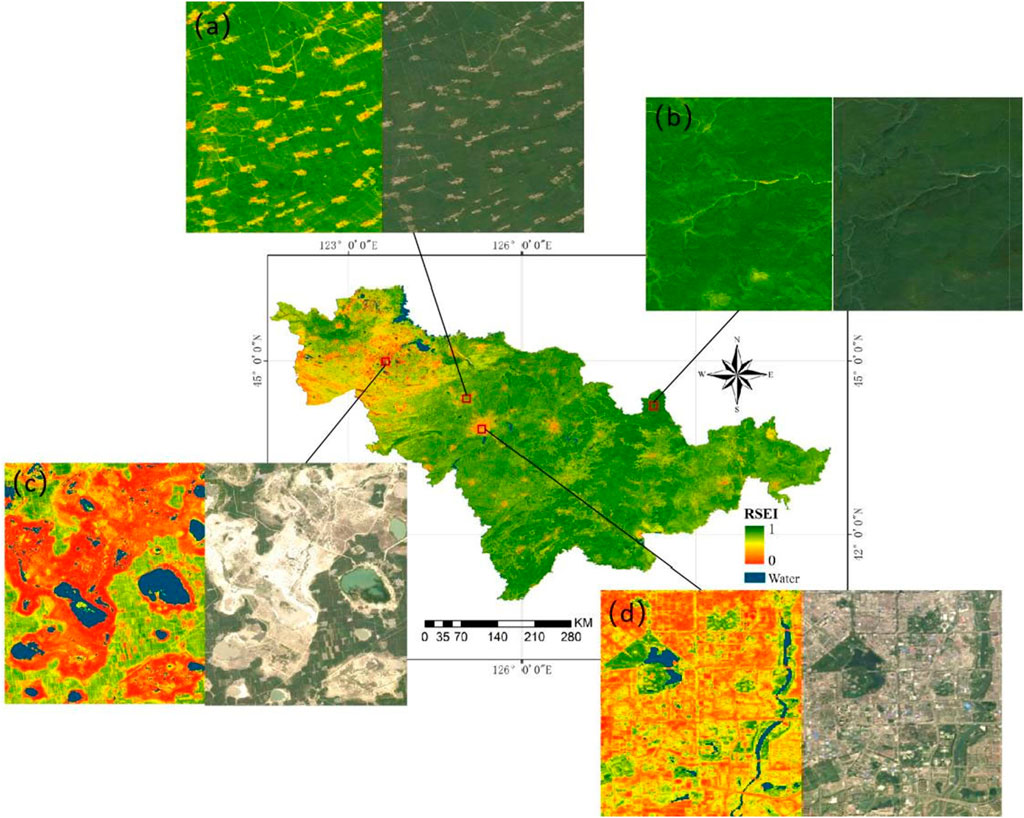
Figure 4. Ecological quality under different land cover types. The left image is RSEI and the right image is a true color composite image. (A) Farmland area (B) forest area (C) saline land area (D) urban area.
Overall, the analysis of RSEI changes in Jilin Province from 1990 to 2020 reveals a trend of improvement in ecological environmental quality (Figure 5). Notably, the average annual growth rate estimated through linear regression analysis stands at 0.022 per decade, indicating a steady enhancement in ecological conditions. Particularly, between 1990 and 2005, RSEI exhibited an initial ascent followed by a temporary decline, reaching its lowest point in 2005 at 0.655. However, from 2005 onwards, there was a sustained upward tendency, indicating a gradual enhancement in ecological environmental quality. By 2020, significant progress was evident, with the highest recorded RSEI value reaching 0.753. This trend reflects the positive impact of ongoing efforts towards ecological conservation and management in Jilin Province.
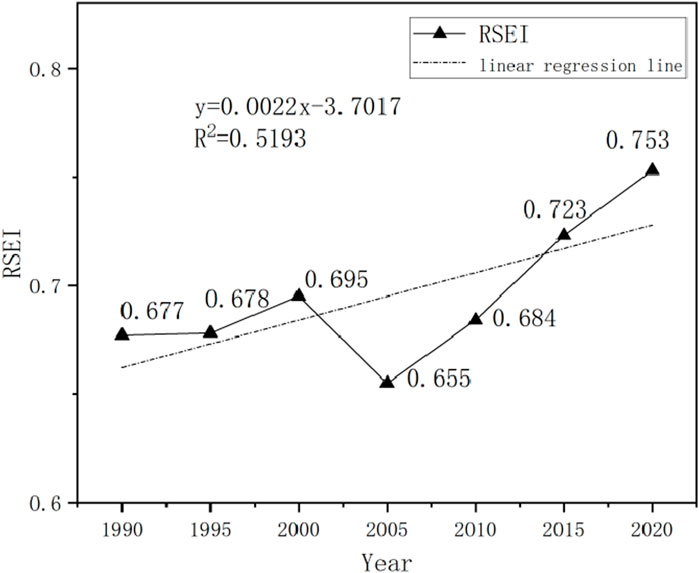
Figure 5. The changes in Jilin Province’s RSEI from 1990 to 2020 and the results of linear fitting.
We divided Jilin Province into 47 regions based on county and urban district demarcations. The average RSEI values for each region from 1990 to 2020 were calculated and are presented in Figure 6. The results showed that in the past 30 years, RSEI in 40 counties or urban areas showed an improving trend, while RSEI in only 7 counties or urban areas showed a worsening trend. On the whole, ecological environment quality in Jilin Province was improving. In the eight administrative districts of Baicheng City, Fuyu City, Zhenlai County, Dehui City, Nongan County, Shuangliao City and Yushu City, the RSEI improvement trend is the most significant, and the growth rate is more than 0.05 units per decade. Therefore, the whole western region of Jilin Province has shown an obvious positive trend in the past 30 years. In contrast, the RSEI of Tonghua County, Tumen City, Antu County, Helong City and Jingyu County remained stable in the past 30 years, with a change rate of no more than 0.002 units per 10 years. These regions are mainly located in the eastern part of Jilin Province.
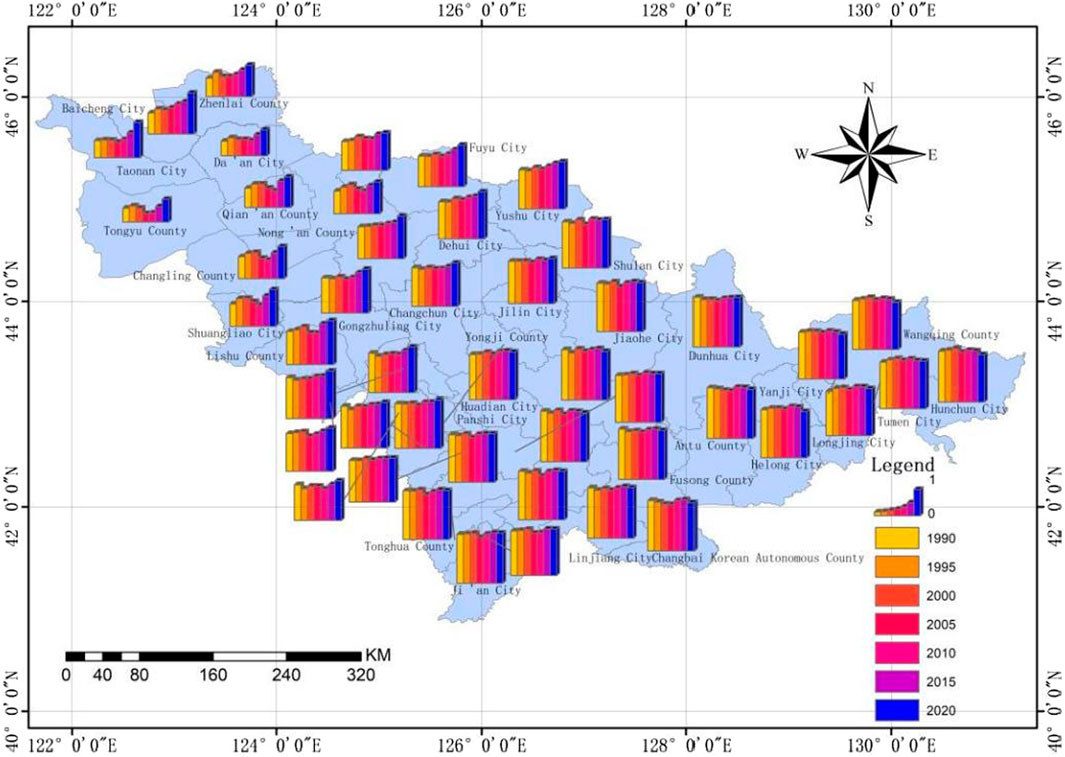
Figure 6. Statistical chart of RSEI values for counties and urban areas in Jilin province.
The regions with different quality levels were counted (Table 5). The ecological quality in Jilin Province predominantly characterized by the prevalence of ‘good’ grades, followed by ' moderate’, and the other three grades are relatively small proportion. Examining the trends across these grades (Figure 7), over the span of 30 years, there has been a consistent expansion in the area covered by ‘excellent’ grade regions, accompanied by a gradual reduction in the extent of other graded areas. We found that the enlargement of areas exhibiting ‘excellent’ ecological quality and the simultaneous contraction of ‘poor’ and ‘very poor’ ecological quality regions. These transformations had contributed an enhancement in the overall ecological environment quality in Jilin Province over the past three decades.
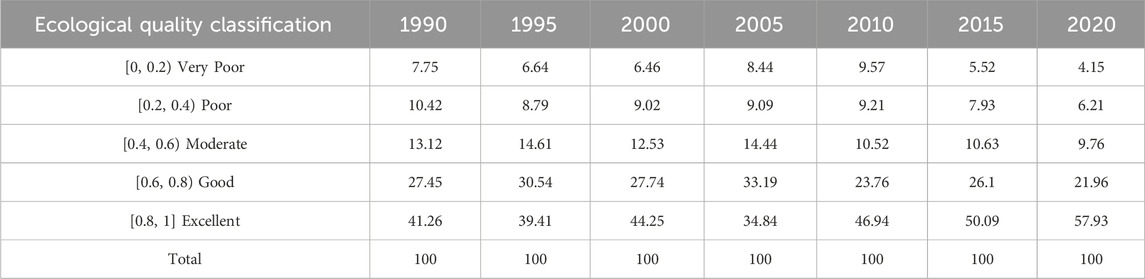
Table 5. The area proportion of different ecological quality in Jilin Province in 30 years.
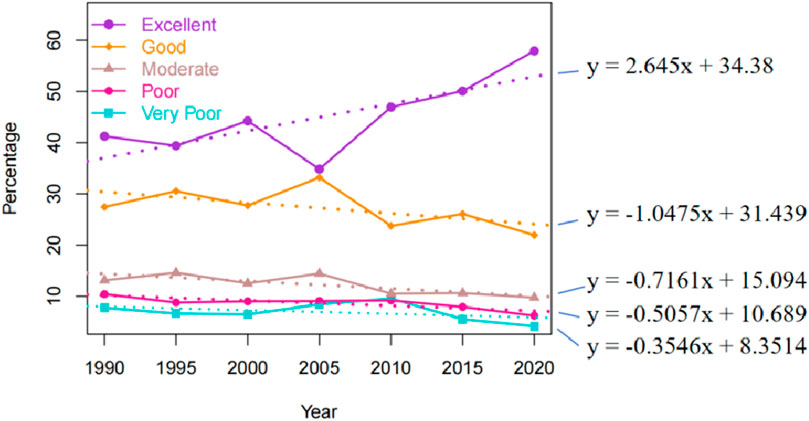
Figure 7. The changes and trends of different ecological quality grades in different years. (The dotted lines represent linear trend lines).
There were significant differences in the ecological quality evolution in the eastern, central and western regions of Jilin Province.In the eastern counties, except for Meihekou City, which was relatively special, the ecological quality of the other areas mainly tends to be “excellent”, accounting for about 60%–80%, followed by the areas classified as “good”. Over a span of 30 years, the ecological quality in the eastern region experienced minimal fluctuations, maintaining a relatively stable trajectory (Figure 8). The central region was the transition area in Jilin Province, the counties near the eastern region were mainly “excellent”, and the counties near the west were mainly “good”. Huadian City, Jiaohe City, Panshi City, Yongji County, and Shulan City are dominated by “excellent” ecological quality, while the remaining regions lean toward “good” quality. Notably, there was a conspicuous shift from “good” to “excellent” quality areas, although areas categorized as “poor” and “moderate” exhibited negligible changes (Figure 9). The western region is the most fragile ecological area in Jilin Province. Despite a relatively low proportion of “excellent” quality areas, the western region underwent the most pronounced changes over the past three decades. This transformation primarily manifested in an increase in “excellent” and “good” quality areas, accompanied by a reduction in areas characterized as “poor’ and “very poor” (Figure 10).
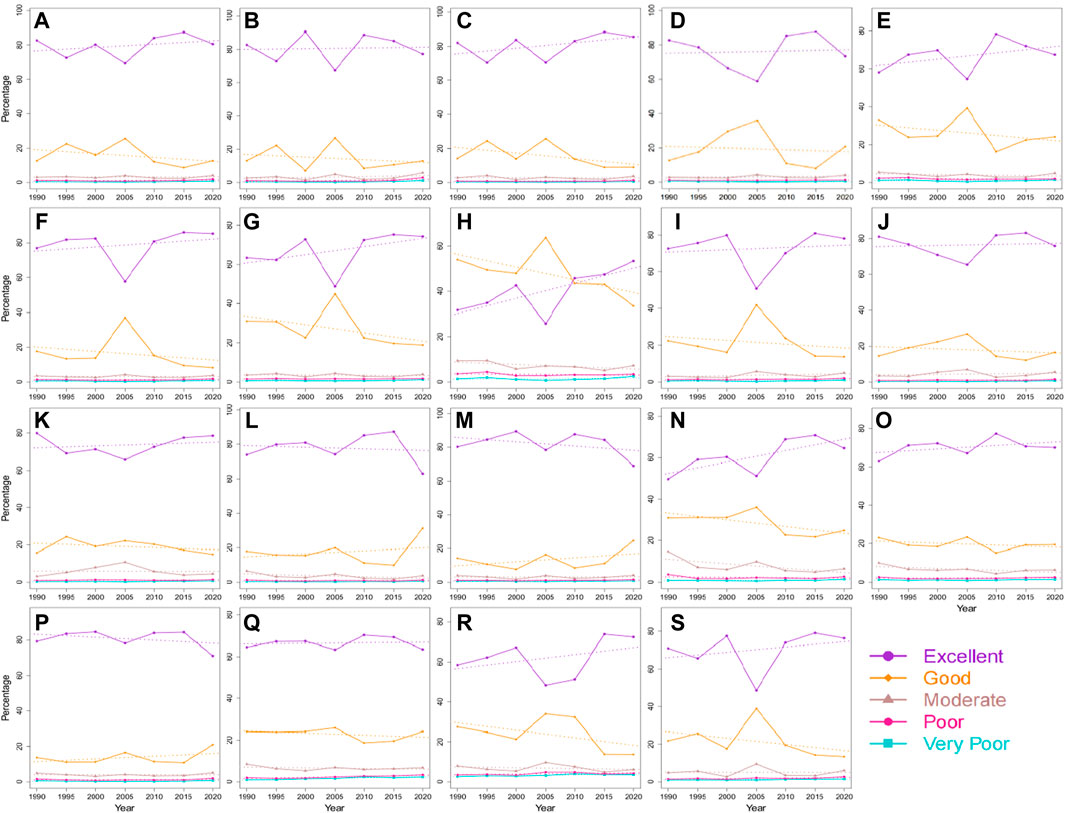
Figure 8. The changes in the proportion of different ecological quality types across counties in eastern Jilin Province. (A) Fusong County (B) Jingyu County (C) Linjiang City (D) Changbai Korean Autonomous County (E) Huinan County (F) Jilin City (G) Liuhe County (H) Meihekou City (I) Tonghua County (J) Antu County (K) Dunhua City (L) Helong City (M) Hunchun City (N) Longjing City (O) Tumen City (P) Wangqing County (Q) Yanji City (R) Tonghua (Urban District) (S) Baishan (Urban District) (The dotted lines represent linear trend lines).
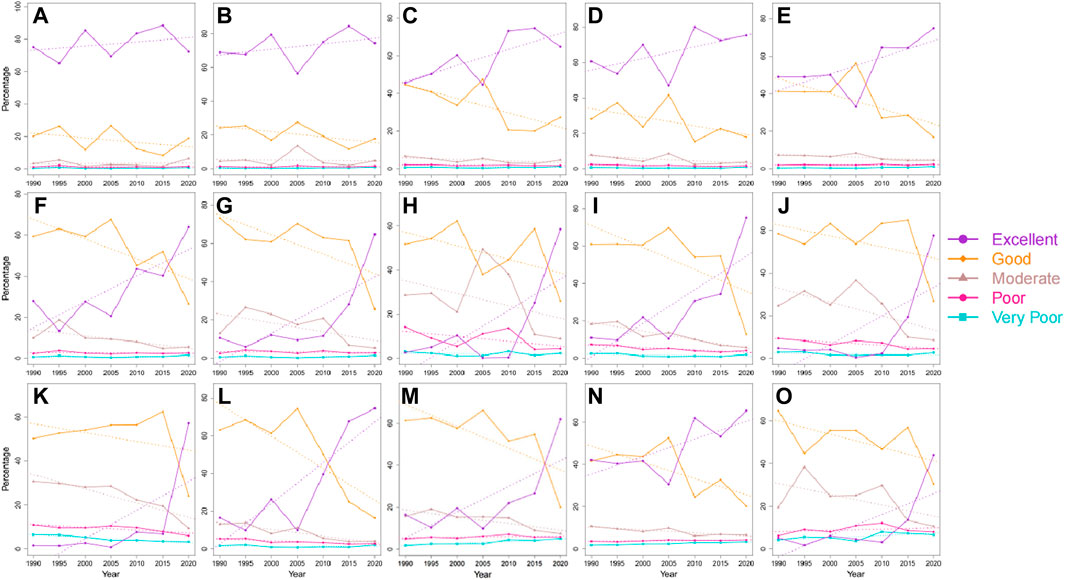
Figure 9. The changes in the proportion of different ecological quality types across counties in central Jilin Province. (A) Huadian City (B) Jiaohe City (C) Panshi City (D) Shulan City (E) Yongji County (F) Dongfeng County (G) Dongliao County (H) Lishu County (I) Dehui City (J) Gongzhuling City (K) Nong’an County (L) Yushu City (M) Changchun (Urban District) (N) Jilin City (Urban District) (O) Liaoyuan (Urban District) (The dotted lines represent linear trend lines).
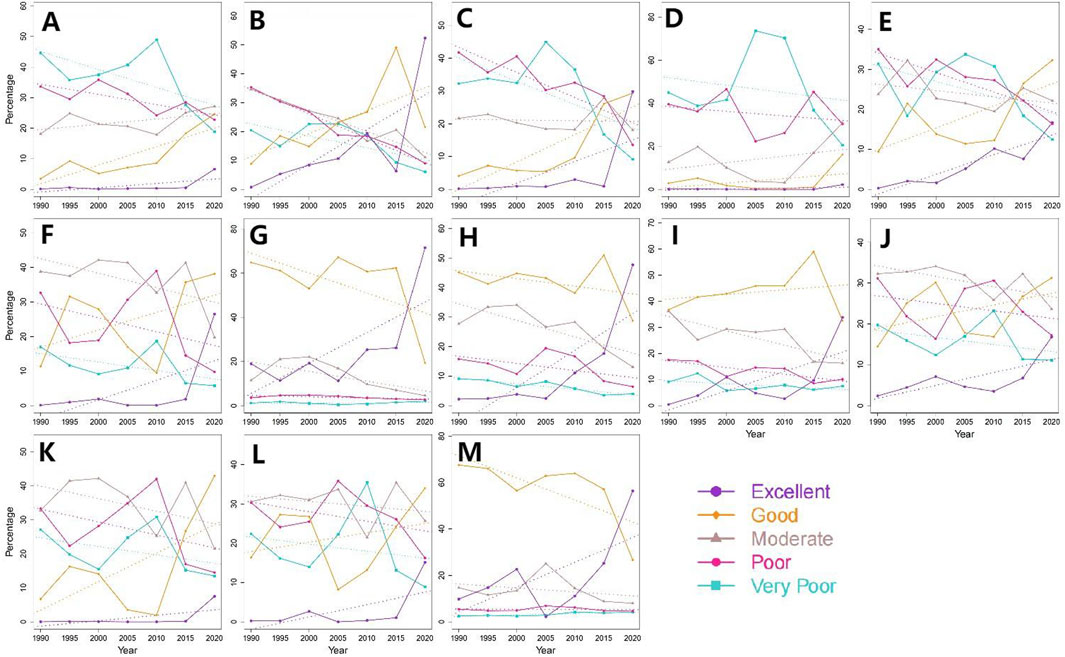
Figure 10. The changes in the proportion of different ecological quality types across counties in western Jilin Province. (A) Da’an City (B) Baicheng (Urban District) (C) Taonan City (D) Tongyu County (E) Zhenlai County (F) Shuangliao City (G) Yitong Manchu Autonomous County (H) Fuyu City (I) Songyuan (Urban District) (J) Qianguoerluosi Mongolian Autonomous County (K) Qian’an County (L) Changling County (M) Siping (Urban District) (The dotted lines represent linear trend lines).
The application of the Sen’s slope estimator and the Mann-Kendall trend test effectively captured the spatial distribution characteristics of RSEI changes in Jilin Province from 1990 to 2020. Based on the actual values of SRESI and Z, the RSEI change trends were classified into four categories (Table 6). The area of improvement (including significant improvement and Insignificant improvement) accounted for 74.13%. As observed from Figure 11, the areas with significant improvement are mainly concentrated in the western regions of Jilin Province, which is mainly due to the improvement of saline-alkali land (Li et al., 2022). On the contrary, areas with insignificant deterioration are mainly located in urban areas, primarily as a result of urban expansion, with Changchun City exhibiting the most noticeable decline.
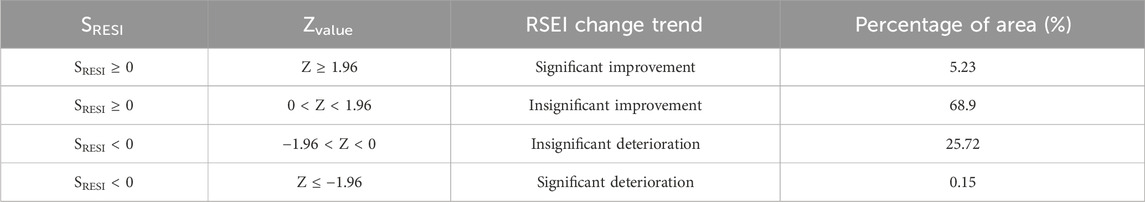
Table 6. Significance of changing trends and Area Proportions.
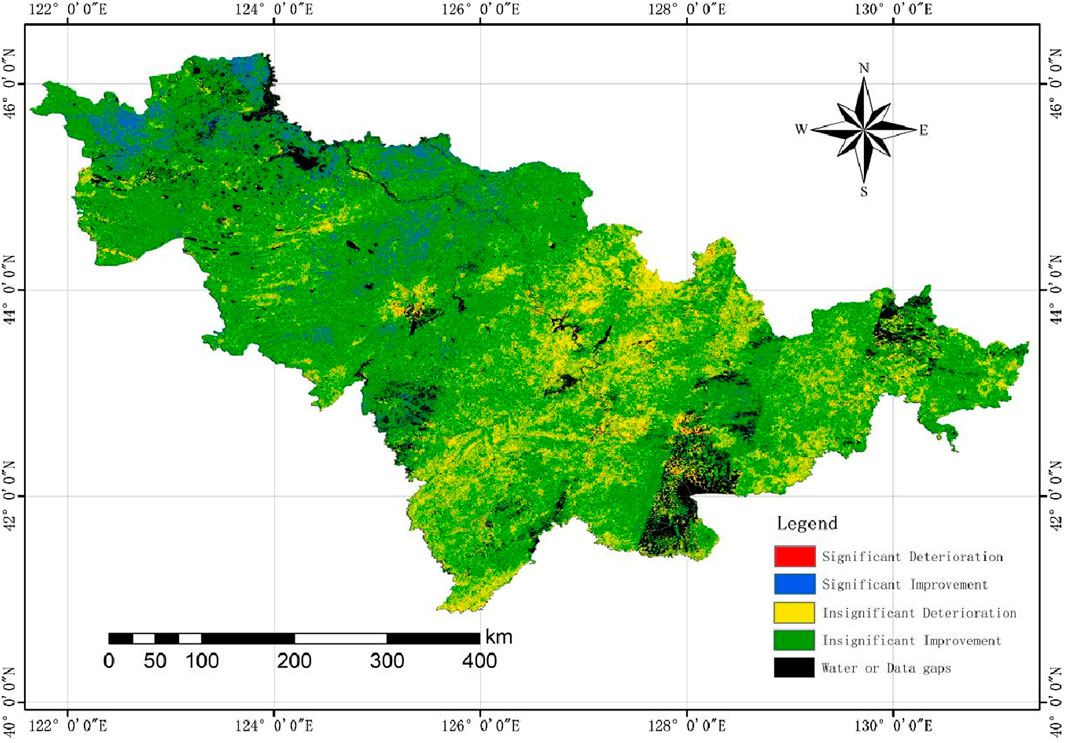
Figure 11. Trend chart of ecological environmental quality changes in Jilin Province.
The spatiotemporal differentiation patterns of the RSEI index in Jilin Province are a result of the interaction between human and natural factors. In this study, eight factors related to the ecological environment in the research area were selected from both socio-economic and natural phenomena perspectives (Table 7). We employed geographic detectors to evaluate the driving factors influencing ecological environmental quality. From Figure 12, the central part of Jilin Province is densely populated, and the central and western regions are agricultural concentration areas. The eastern region has numerous mountains, higher elevation, steeper slope, low temperature, increased precipitation, and high vegetation cover.
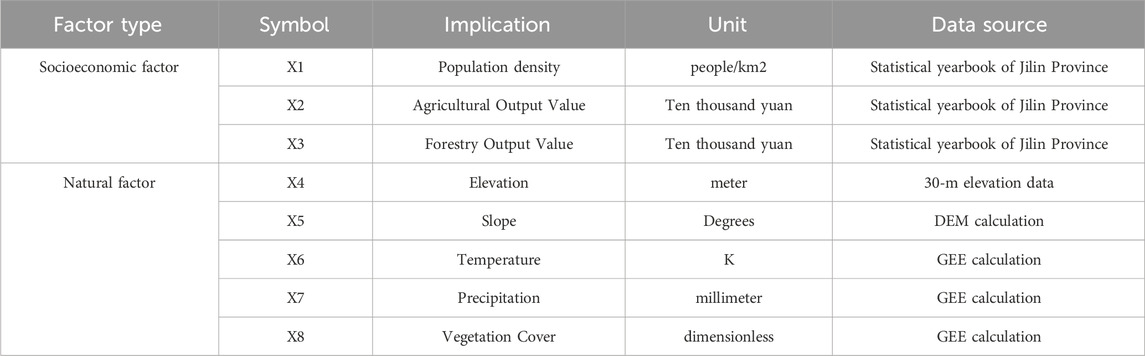
Table 7. The eight influencing factors.
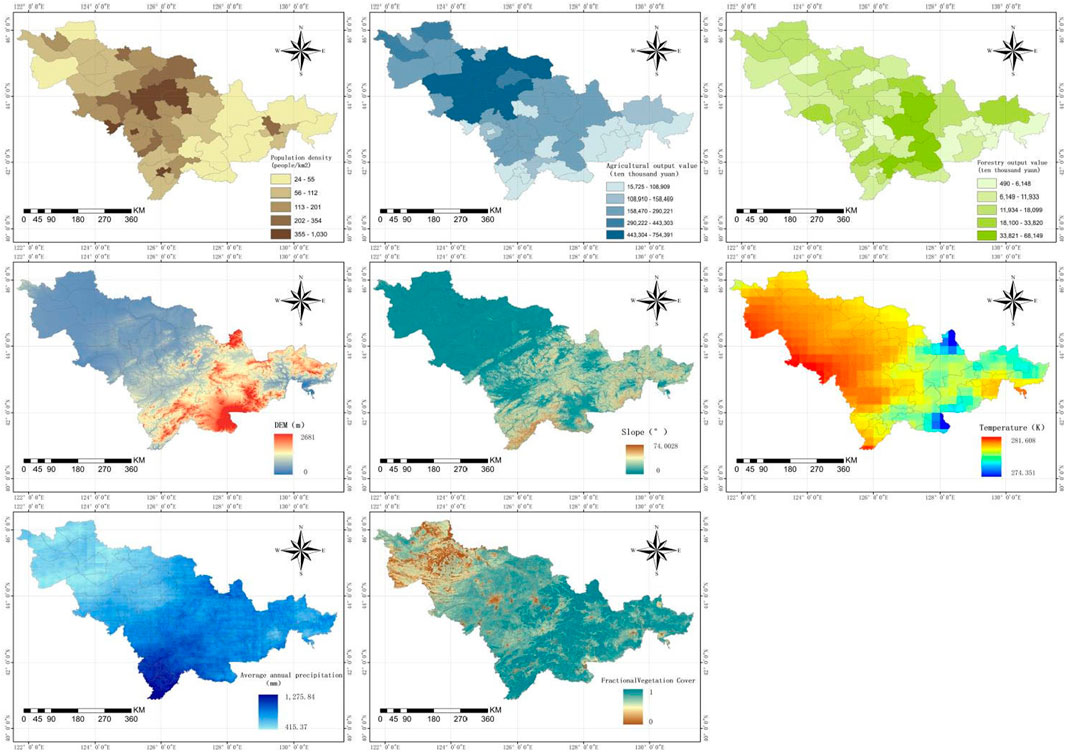
Figure 12. Spatial distribution plots of the eight driving factors in 2020.
Table 8 showed the results of the dominant factor analysis of the geographic detector. In terms of the magnitude of the q-values associated with the selected influencing factors, the ranking is as follows: vegetation coverage > precipitation > elevation > slope > temperature > forestry output value > agricultural output value > population density. These rankings were determined based on the q-values associated with the selected influencing factors, with vegetation coverage having the highest contribution (67.9%). It emerged as the dominant factor affecting the spatiotemporal variation of RSEI in Jilin Province. This indicates that the extent and area of vegetation coverage have a significant impact on the RSEI index in the study area. Precipitation ranked as the second most influential factor (24.3%), highlighting its close relationship with ecological environment quality and its considerable influence on the spatial variation of RSEI. It is worth noting that natural factors had a greater impact on the RSEI in the study area compared to socio-economic factors.
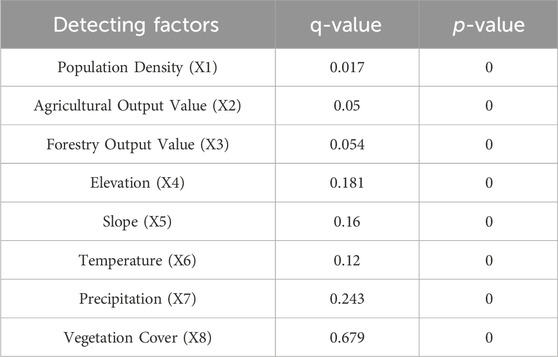
Table 8. q-Values of Driving Factors and Significance Test.
The results of the interaction detection for the eight influencing factors (Figure 13) reveal that the interaction strength between any two factors is greater than that of any single factor. Throughout the entire study area, the interaction between vegetation coverage and temperature, as well as between vegetation coverage and precipitation, exerts the strongest influence on the spatial variation of RSEI in the research area, with q-values of 0.685. This indicates that these interactions account for approximately 68.5% of the spatial variation in ecological environmental quality in Jilin Province. Among all factors, these interactions have the most substantial explanatory power for the spatial variation in ecological environmental quality. In terms of interaction types, interactions such as population density ∩ agriculture, population density ∩ forestry, population density ∩ elevation, population density ∩ slope, population density ∩ temperature, population density ∩ precipitation and agriculture ∩ forestry exhibit non-linear enhanced interactions, while the others demonstrate linear enhanced interactions.
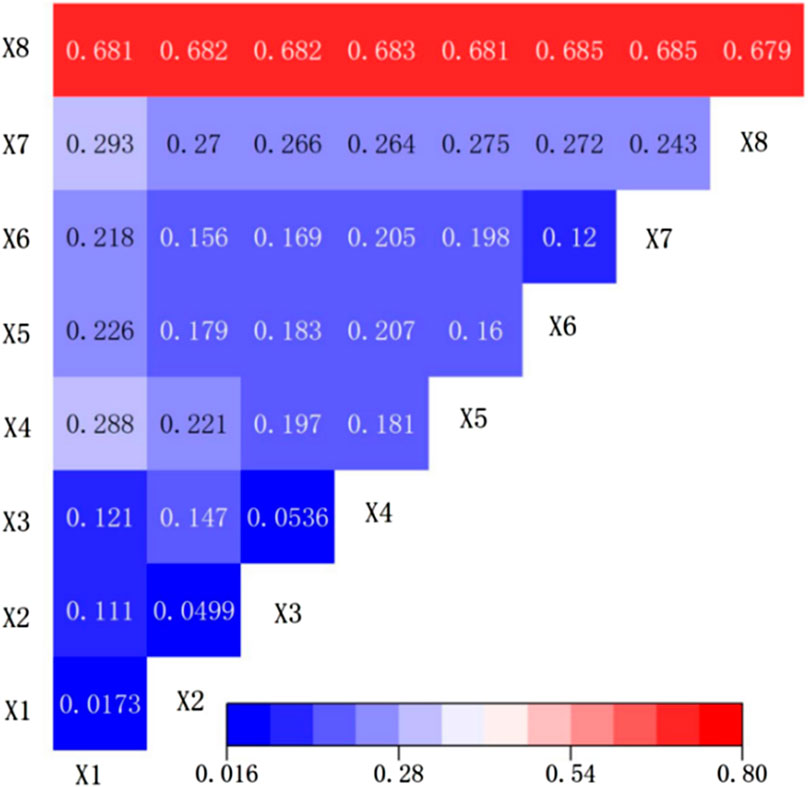
Figure 13. Interaction detection results.
To assess the ecological environmental quality under different land cover types, this study leveraged the advantages of cloud computing through the GEE platform. Six datasets, including water bodies, farmland, forests, urban areas, saline-alkali land, and bare land, were configured in GEE. Approximately 130 points were selected for each dataset as the basis for classification, with an 80%–20% split for training and testing datasets, respectively. We utilized a supervised classification approach, employing the Random Forest algorithm, to categorize land types in Jilin Province into six classes. The overall classification accuracy was 0.8875, with a Kappa coefficient of 0.8646 (Figure 14).

Figure 14. Results of land use type classification in Jilin Province.
The average RSEI values for different vegetation types are as follows: water bodies 0.6721, farmland 0.7507, forests 0.8996, urban areas 0.2185, saline-alkali land 0.5143, and bare land 0.5523 (Table 9). Forests have the highest ecological environment quality, followed by farmland, whereas urban areas have the lowest ecological environment quality. Therefore, increasing urban green spaces has become an effective way to improve urban ecological quality, and many cities have made successful efforts in increasing urban green spaces. For instance, Singapore has implemented various innovative methods, including vertical greening, rooftop gardens, park development, and greenway networks, to increase urban green space and provide abundant green areas (Yuen and Hien, 2005; Chew et al., 2019). London has established a green roof policy to encourage rooftop greening (Simpson et al., 2023). Toronto, Canada, has created new urban parks and improved existing green spaces and waterfront areas to increase urban green space (Conway et al., 2020). Berlin, Germany, is renowned for its abundant urban green spaces, with the government committed to preserving and expanding these green areas while also encouraging urban residents to participate in greening projects (Kowarik, 2023). These successful examples from various cities demonstrate that increasing urban green space is feasible and can be achieved through various methods. Cities within Jilin Province can draw inspiration from these practices to expand urban green areas, thereby improving the ecological environmental quality of various cities in Jilin Province and provide residents with an enhanced living environment.
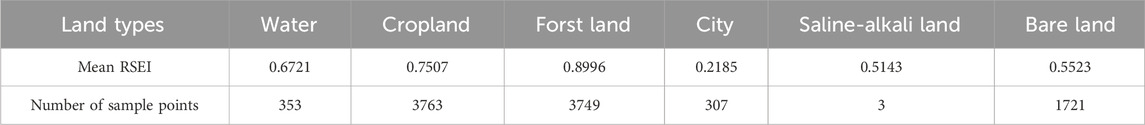
Table 9. RSEI mean values under different land types.
Overall, the RSEI of Jilin Province has gradually improved over the past 30 years. Combined with geographical detector results (Table 8), vegetation is the most important factor affecting the change of RSEI, and in recent years, this region has experienced an increase in precipitation and sufficient sunshine time, providing favorable conditions for vegetation growth and ecological recovery (Che et al., 2021; Ren et al., 2023) found that when studying the NDVI of vegetation in Jilin Province in the past 22 years, NDVI values showed an increasing trend in most areas (Yun et al., 2009). studied the spatio-temporal variation characteristics of vegetation coverage in the Three-North Shelterbelt project area from 2001 to 2007, and found that Jilin Province had the highest increase, reaching 27.37%, which well indicates that the increase of vegetation in Jilin Province in the past 30 years is the main reason for the improvement of RSEI.
Furthermore, this trend is closely linked to regional governance measures. Past development projects and population growth in the area led to significant ecological degradation. However, since the year 2000, a series of major ecological projects, including the “Changbai Mountain Ecological Protection Project (Wang et al., 2016)" “Songhua River Basin Ecological Restoration Project,” “Songnen Plain Land Retirement and Reforestation Project,” “Saline-Alkali Land Transformation and Management Project,” and “Farmland Quality Improvement Project,” have been implemented. The Changbai Mountain Ecological Protection Project has significantly enhanced the region’s ecological stability by protecting rare species and improving habitats. The Songhua River Basin Ecological Restoration Project has notably improved water quality and the health of river ecosystems through enhanced water pollution control and wetland protection. The Songnen Plain Conversion to Forest Project has effectively reduced the overuse of farmland, increased forest cover, and enhanced carbon sequestration. The Saline-Alkaline Land Improvement Project and Farmland Quality Improvement Project have improved soil and agricultural productivity, not only protecting arable land resources but also promoting sustainable agricultural development.These initiatives have facilitated ecological recovery in the region, resulting in improved ecological environmental quality (Zang et al., 2014).
At the spatial scale, the RSEI demonstrates a “west-low, east-high” distribution pattern across Jilin Province. The western regions of Jilin Province have historically faced challenges due to lower precipitation, higher evaporation rates, frequent natural disasters, and significant human-induced environmental degradation. These issues have led to problems such as land salinization, grassland degradation, and soil desertification (Chang et al., 2022; Han et al., 2023). Among them, the land salinization is the most prominent problem, and the saline-alkali land management is an important reason for the obvious improvement in the west of Jilin Province. Government departments have consistently carried out a series of policies, including the construction of water conservancy projects, the improvement of saline-alkali land, the cultivation of saline-alkali tolerant crops and ecological air defense control, which has made the saline-alkali land in western China significantly improved (Gong et al., 2022; Li et al., 2022).
Among the various natural factors analyzed, vegetation cover was found to have a significant impact on ecological environmental quality in Jilin Province (Table 8). Sufficient vegetation cover plays a crucial role in soil stability, reducing erosion and soil loss. It also contributes to clean water sources, reducing the risks of floods and droughts (de la Barrera et al., 2016). Additionally, vegetation provides diverse ecological services such as oxygen generation, carbon sequestration, and habitat for biodiversity. These factors contribute to the best ecological quality in areas with dense vegetation.
Natural factors were found to exert a greater influence on ecological environmental quality than socio-economic factors (Pan et al., 2023). Natural factors such as slope, elevation, temperature, and precipitation play dominant roles in shaping the ecological environment of Jilin Province. These factors determine vegetation types and distribution, influence hydrological cycles, and impact ecosystem diversity. Stability in these natural factors is directly related to the stability of ecosystems. In contrast, socio-economic factors (such as agricultural and forestry production values and per capita GDP) do have an influence on ecological environmental quality but to a lesser extent. This does not diminish the importance of socio-economic factors; unregulated socio-economic activities can disrupt the stability of natural factors. Therefore, it is essential to regulate and manage socio-economic activities to ensure they do not have irreversible negative impacts on the ecological environment (Chen et al., 2021). Considering the interaction between natural and socio-economic factors and formulating appropriate policies and measures will contribute to achieving the sustainable development goals of Jilin Province.
Some scholars had doubted about the RSEI after it was put forward, but the references showed that the index was the most widely used among the many remote sensing ecological indexes, and according to the Figure 4, the results show that the evaluation results of the index are consistent with the reality, so this study directly adopted RSEI for research without evaluating the accuracy of RSEI, which is one of the defects of this study. In addition, some scholars believed that the four indicators that constitute RSEI were not comprehensive during the study, and added a fifth index on the basis of the original index. For example, Dong et al. (2023) introduced the landscape diversity index (LDI) and reconstructed the Modified Remote Sensing Ecological Index (MRSEI) when studying the ecological environment quality of the artificial oasis in Ningxia section of the Yellow River. Li Y. M. et al. (2024) took the Soil Erosion Indicator (SEI) as the fifth component when studying the ecological quality of karst areas, and created the Modified Remote Sensing Ecological Index (MRSEI). Due to the research area of Jilin Province, Considering that there are many land cover types such as forest, farmland and saline-alkali land in this region, the issue of whether RSEI is incomplete is not considered, which is the second defect of this study. To sum up, the selection of RSEI indicators and the accuracy of RSEI evaluation will be mainly considered in the follow-up research.
Based on Landsat data and the GEE platform, this study calculated the RSEI of Jilin Province from 1990 to 2020, revealing spatiotemporal characteristics of ecological environmental quality. Subsequently, the Geo-detector model was employed to investigate and determine the factors influencing ecological environmental quality. The main conclusions of this research are as follows.
(1) The effect of the RSEI evaluation is effective and consistent with the actual situation, the average RSEI values in Jilin Province from 1990 to 2020 ranged between 0.655 and 0.753, indicating generally good ecological environmental quality. Spatially, ecological environmental quality gradually decreases from east to west, with the eastern region showing the best ecological environmental quality, followed by the central region, and the western region exhibiting the lowest quality. Additionally, rural areas have better ecological environmental quality compared to urban areas.
(2) Over the 30-year period from 1990 to 2020, the RSEI values in Jilin Province exhibits an overall improving trend. From 1990 to 2000, there was an initial increase in RSEI followed by a subsequent decrease. However, from 2000 to 2020, spanning two decades, the average RSEI values in Jilin Province have shown a consistent upward trend, indicating a gradual enhancement in ecological environmental quality. It is worth noting that in the past 30 years, the ecological environment quality in the west of Jilin, which is mainly characterized by saline-alkali land, has improved significantly.
(3) Ecological environmental quality in Jilin Province is influenced by both socio-economic and natural factors, with vegetation cover identified as the most significant factor affecting ecological environmental quality in the study area. Natural factors were found to have a more substantial impact compared to socio-economic factors. The interactive detection results reveal that the interaction strength between any two influencing factors is greater than the effect of a single factor. The interaction between vegetation cover and temperature, as well as vegetation cover and precipitation, has the most significant impact on the spatial variation of RSEI in the study area, with q-values of 0.685.
The raw data supporting the conclusions of this article will be made available by the authors, without undue reservation.
FW: Writing–original draft, Conceptualization, Data curation, Formal Analysis, Investigation, Methodology, Project administration, Resources, Software, Supervision, Validation, Visualization, Writing–review and editing. YH: Writing–review and editing, Conceptualization, Data curation, Formal Analysis, Funding acquisition, Methodology, Project administration, Resources, Supervision, Validation, Visualization, Writing–original draft. YX: Supervision, Validation, Writing–review and editing. RZ: Writing–review and editing. CQ: Writing–review and editing. PZ: Writing–review and editing. SM: Supervision, Writing–review and editing. LZ: Supervision, Writing–review and editing. ZL: Supervision, Writing–review and editing. JZ: Supervision, Writing–review and editing. FH: Project administration, Writing–review and editing.
The author(s) declare that financial support was received for the research, authorship, and/or publication of this article. This research was supported by the Industrial Technology Research and Development Project of the Development and Reform Commission of Jilin Province (2024C021-3) and the Basic Construction Funds (innovation capacity building) for the budget of Jilin Province in 2023 (2023C030-1).
All authors are grateful to reviewers for their helpful comments. We have ensured that all individuals included in this section consented to the acknowledgement.
Authors RZ, CQ, and PZ were employed by Chang Guang Satellite Technology Company Ltd.
The remaining authors declare that the research was conducted in the absence of any commercial or financial relationships that could be construed as a potential conflict of interest.
All claims expressed in this article are solely those of the authors and do not necessarily represent those of their affiliated organizations, or those of the publisher, the editors and the reviewers. Any product that may be evaluated in this article, or claim that may be made by its manufacturer, is not guaranteed or endorsed by the publisher.
Allan, R. P., Hawkins, E., Bellouin, N., and Collins, B. (2021), IPCC, 2021: summary for Policymakers.
An, M., Xie, P., He, W., Wang, B., Huang, J., and Khanal, R. (2022). Spatiotemporal change of ecologic environment quality and human interaction factors in three gorges ecologic economic corridor, based on RSEI. Ecol. Indic. 141, 109090. doi:10.1016/j.ecolind.2022.109090
Ariken, M., Zhang, F., Liu, K., Fang, C. L., and Kung, H. T. (2020). Coupling coordination analysis of urbanization and eco-environment in Yanqi Basin based on multi-source remote sensing data. Ecol. Indic. 114, 106331. doi:10.1016/j.ecolind.2020.106331
Chang, L., Zhao, Z. B., Jiang, L. X., and Li, Y. F. (2022). Quantifying the ecosystem services of soda saline-alkali grasslands in Western Jilin Province, NE China. Int. J. Environ. Res. Public Health 19 (8), 4760. doi:10.3390/ijerph19084760
Che, X., Li, H., Zhang, C., Guo, D., and Shen, H. (2021). Impacts of climate change on corn yield in Jilin province since 1980s. Res. Soil Water Conservation 28 (2), 230. doi:10.13869/j.cnki.rswc.2021.02.032
Chen, Y., Su, X. Y., and Zhou, Q. (2021). Study on the spatiotemporal evolution and influencing factors of urban resilience in the Yellow River Basin. Int. J. Environ. Res. Public Health 18 (19), 10231. doi:10.3390/ijerph181910231
Chew, M. Y. L., Conejos, S., and Bin Azril, F. H. (2019). Design for maintainability of high-rise vertical green facades. Build. Res. Inf. 47 (4), 453–467. doi:10.1080/09613218.2018.1440716
Conway, T. M., Khan, A., and Esak, N. (2020). An analysis of green infrastructure in municipal policy: divergent meaning and terminology in the Greater Toronto Area. Land Use Policy 99, 104864. doi:10.1016/j.landusepol.2020.104864
Crist, E. P. (1985). A TM tasseled cap equivalent transformation for reflectance factor data. Remote Sens. Environ. 17 (3), 301–306. doi:10.1016/0034-4257(85)90102-6
de la Barrera, F., Rubio, P., and Banzhaf, E. (2016). The value of vegetation cover for ecosystem services in the suburban context. Urban For. Urban Green. 16, 110–122. doi:10.1016/j.ufug.2016.02.003
Dong, C. Y., Qiao, R. R., Yang, Z. C., Luo, L. H., and Chang, X. L. (2023). Eco-environmental quality assessment of the artificial oasis of Ningxia section of the Yellow River with the MRSEI approach. Front. Environ. Sci. 10. doi:10.3389/fenvs.2022.1071631
Estoque, R. C., Murayama, Y., and Myint, S. W. (2017). Effects of landscape composition and pattern on land surface temperature: an urban heat island study in the megacities of Southeast Asia. Sci. Total Environ. 577, 349–359. doi:10.1016/j.scitotenv.2016.10.195
Feng, D., Fu, M., Sun, Y., Bao, W., Zhang, M., Zhang, Y., et al. (2021). How large-scale anthropogenic activities influence vegetation cover change in China? A review. Forests 12 (3), 320. doi:10.3390/f12030320
Firozjaei, M. K., Kiavarz, M., Homaee, M., Arsanjani, J. J., and Alavipanah, S. K. (2021). A novel method to quantify urban surface ecological poorness zone: a case study of several European cities. Sci. Total Environ. 757, 143755. doi:10.1016/j.scitotenv.2020.143755
Gómez, I., Caselles, V., Estrela, M. J., Sánchez, J. M., and Rubio, E. (2018). Simulation of surface energy fluxes and meteorological variables using the Regional Atmospheric Modeling System (RAMS): evaluating the impact of land-atmosphere coupling on short-term forecasts. Agric. For. Meteorology 249, 319–334. doi:10.1016/j.agrformet.2017.10.027
Gong, E. J., Shi, F., Wang, Z., Hu, Q., Zhang, J., and Hai, H. (2022). Evaluating environmental quality and its driving force in Northeastern China using the remote sensing ecological index. Sustainability 14 (23), 16304. doi:10.3390/su142316304
Han, Y., Ge, H., Xu, Y., Zhuang, L., Wang, F., Gu, Q., et al. (2023). Estimating soil salinity using multiple spectral indexes and machine learning algorithm in Songnen Plain, China. IEEE J. Sel. Top. Appl. Earth Observations Remote Sens. 16, 7041–7050. doi:10.1109/JSTARS.2023.3274579
Hou, G., Zhang, H., Wang, Y., and Zhang, Z. (2010). Application of harmonic analysis of time series to extracting the cropland resource in Northeast China. J. Nat. Resour. 25 (9), 1607–1617.
Huang, S. D., Li, Y. J., Hu, H. W., Xue, P. C., and Wang, J. (2024). Assessment of optimal seasonal selection for RSEI construction: a case study of ecological environment quality assessment in the Beijing-Tianjin-Hebei region from 2001 to 2020. Geocarto Int. 39 (1). doi:10.1080/10106049.2024.2311224
Jia, H. W., Yan, C. Z., and Xing, X. G. (2021). Evaluation of eco-environmental quality in qaidam basin based on the ecological index (MRSEI) and GEE. Remote Sens. 13 (22), 4543. doi:10.3390/rs13224543
Kowarik, I. (2023). Urban biodiversity, ecosystems and the city. Insights from 50 years of the Berlin School of urban ecology. Landsc. Urban Plan. 240, 104877. doi:10.1016/j.landurbplan.2023.104877
Li, J., Pei, Y., Zhao, S., Xiao, R., Sang, X., and Zhang, C. (2020a). A review of remote sensing for environmental monitoring in China. Remote Sens. 12 (7), 1130. doi:10.3390/rs12071130
Li, N., Wang, Y., Zhang, F., Zhu, H., and Li, L. (2024a). Spatial and temporal dynamic changes and influencing factors of ecological environmental quality in Chaohu Lake basin based on GEE. Pol. J. Environ. Stud. 33 (1), 239–251. doi:10.15244/pjoes/171669
Li, X. J., Li, Y., Wang, B., Sun, Y., Cui, G., and Liang, Z. (2022). Analysis of spatial-temporal variation of the saline-sodic soil in the west of Jilin Province from 1989 to 2019 and influencing factors. Catena 217, 106492. doi:10.1016/j.catena.2022.106492
Li, X. W., Yu, X., Hou, X., Liu, Y., Li, H., Zhou, Y., et al. (2020b). Valuation of wetland ecosystem services in national nature reserves in China's coastal zones. Sustainability 12 (8), 3131. doi:10.3390/su12083131
Li, Y. M., Li, Y. T., Yang, X., Feng, X. J., and Lv, S. B. (2024b). Evaluation and driving force analysis of ecological quality in Central Yunnan Urban Agglomeration. Ecol. Indic. 158, 111598. doi:10.1016/j.ecolind.2024.111598
Liu, H. M., Fang, C., Zhang, X., Wang, Z., Bao, C., and Li, F. (2017). The effect of natural and anthropogenic factors on haze pollution in Chinese cities: a spatial econometrics approach. J. Clean. Prod. 165, 323–333. doi:10.1016/j.jclepro.2017.07.127
Liu, Y., Lin, Y., Liu, W., Zhou, J., and Wang, J. (2024). Remote sensing perspective in exploring the spatiotemporal variation characteristics and post-disaster recovery of ecological environment quality, a case study of the 2010 Ms7. 1 Yushu earthquake. Geomatics, Nat. Hazards Risk 15 (1), 2314578. doi:10.1080/19475705.2024.2314578
Liu, Y., Lin, Y., Wang, F., Xu, N., and Zhou, J. (2023). Post-earthquake recovery and its driving forces of ecological environment quality using remote sensing and GIScience, a case study of 2015 Ms8. 1 Nepal earthquake. Geomatics, Nat. Hazards Risk 14 (1), 2279496. doi:10.1080/19475705.2023.2279496
Pan, H. H., Wang, J., Du, Z., Wu, Z., Zhang, H., and Ma, K. (2023). Spatiotemporal evolution of ecosystem services and its potential drivers in coalfields of Shanxi Province, China. Ecol. Indic. 148, 110109. doi:10.1016/j.ecolind.2023.110109
Peng, X. F., Zhang, S., Peng, P., Chen, A., Li, Y., Wang, J., et al. (2023). Unraveling the ecological tapestry: a comprehensive assessment of changtang nature reserve's ecological and environmental using RSEI and GEE. Land 12 (8), 1581. doi:10.3390/land12081581
Qian, B. X., Ye, H., Huang, W., Xie, Q., Pan, Y., Xing, N., et al. (2022). A sentinel-2-based triangular vegetation index for chlorophyll content estimation. Agric. For. Meteorology 322, 109000. doi:10.1016/j.agrformet.2022.109000
Ren, Y. T., Zhang, F., Zhao, C. L., and Cheng, Z. Q. (2023). Attribution of climate change and human activities to vegetation NDVI in Jilin Province, China during 1998-2020. Ecol. Indic. 153, 110415. doi:10.1016/j.ecolind.2023.110415
Rouse, J. W., Haas, R. H., Schell, J. A., and Deering, D. W. (1974). Monitoring vegetation systems in the great plains with ERTS. NASA Spec. Publ. 351 (1), 309.
Shan, W., Jin, X., Ren, J., Wang, Y., Xu, Z., Fan, Y., et al. (2019). Ecological environment quality assessment based on remote sensing data for land consolidation. J. Clean. Prod. 239, 118126. doi:10.1016/j.jclepro.2019.118126
Shen, X. J., Liu, Y., Liu, B., Zhang, J., Wang, L., Lu, X., et al. (2022). Effect of shrub encroachment on land surface temperature in semi-arid areas of temperate regions of the Northern Hemisphere. Agric. For. Meteorology 320, 108943. doi:10.1016/j.agrformet.2022.108943
Shuqing, M. A., and Qi, W. (2010). Connotation,Evaluation Indices,Methods and safeguard measures for regional grain security. Resour. Sci. 32 (1), 35–41.
Simpson, C. H., Brousse, O., Mohajeri, N., Davies, M., and Heaviside, C. (2023). An open-source automatic survey of green roofs in London using segmentation of aerial imagery. Earth Syst. Sci. Data 15 (4), 1521–1541. doi:10.5194/essd-15-1521-2023
Sobrino, J. A., Jiménez-Muñoz, J. C., and Paolini, L. (2004). Land surface temperature retrieval from LANDSAT TM 5. Remote Sens. Environ. 90 (4), 434–440. doi:10.1016/j.rse.2004.02.003
Wang, J., and Xu, C. (2017). Geodetector: principle and prospective. Acta Geogr. Sin. 72 (1), 116–134. doi:10.11821/dlxb201701010
Wang, S., Zhang, X., Zhu, T., Yang, W., and Zhao, J. (2016). Assessment of ecological environment quality in the Changbai Mountain Nature Reserve based on remote sensing technology. Prog. Geogr. 35 (10), 1269–1278. doi:10.18306/dlkxjz.2016.10.010
Wang, Z. Y., Tang, L., Qiu, Q., Chen, H., Wu, T., and Shao, G. (2018). Assessment of regional ecosystem health-A case study of the golden triangle of Southern Fujian province, China. Int. J. Environ. Res. Public Health 15 (4), 802. doi:10.3390/ijerph15040802
Wu, W., Wang, X., Liu, D., and Su, H. (2022). Rural Architectural planning and landscape optimization design under the background of ecological environment protection. J. Environ. Public Health 2022, 1–11. doi:10.1155/2022/5901718
Xu, H. (2013a). A remote sensing index for assessment of regional ecological changes. China Environ. Sci. 33 (5), 889–897.
Xu, H. (2013b). A remote sensing urban ecological index and its application. Acta Ecol. Sin. 33 (24), 7853–7862. doi:10.5846/stxb201208301223
Xu, H. Q. (2006). Modification of normalised difference water index (NDWI) to enhance open water features in remotely sensed imagery. Int. J. Remote Sens. 27 (14), 3025–3033. doi:10.1080/01431160600589179
Yang, Y. J., and Li, H. Y. (2023). Spatiotemporal dynamic decoupling states of eco-environmental quality and land-use carbon emissions: a case study of Qingdao City, China. Ecol. Inf. 75, 101992. doi:10.1016/j.ecoinf.2023.101992
Yu, Y. H., Wang, J. L., Liu, G. J., and Cheng, F. (2019). Forest Leaf area index inversion based on Landsat OLI data in the Shangri-La city. J. Indian Soc. Remote Sens. 47 (6), 967–976. doi:10.1007/s12524-019-00950-6
Yuan, B., Fu, L., Zou, Y., Zhang, S., Chen, X., Li, F., et al. (2021). Spatiotemporal change detection of ecological quality and the associated affecting factors in Dongting Lake Basin, based on RSEI. J. Clean. Prod. 302, 126995. doi:10.1016/j.jclepro.2021.126995
Yuen, B., and Hien, W. N. (2005). Resident perceptions and expectations of rooftop gardens in Singapore. Landsc. Urban Plan. 73 (4), 263–276. doi:10.1016/j.landurbplan.2004.08.001
Yun, W. U., Yuan, Z., Bing-fang, W. U., Xiao-song, L. I., and Wen-bo, W. U. (2009). Retrieval and analysis of vegetation cover in the Three-North Regions of China based on MODIS data. Chin. J. Ecol. 28 (9), 1712–1718. doi:10.13292/j.1000-4890.2009.0338
Zang, Z., Zheng, D.-F., Sun, C.-Z., and Zhang, Y. (2014). Evaluation of wetland ecological benefit and restoration in the natural reserves of western Jilin Province, China. J. Appl. Ecol. 25 (5), 1447–1454. doi:10.13287/j.1001-9332.2014.0007
Zhang, M. M., Kafy, A. A., Ren, B., Zhang, Y., Tan, S., and Li, J. (2022a). Application of the optimal parameter geographic detector model in the identification of influencing factors of ecological quality in Guangzhou, China. Land 11 (8), 1303. doi:10.3390/land11081303
Zhang, T. T., Lyu, X., Zou, Y., Liu, J., Jiang, M., Xu, C., et al. (2022b). Value assessment of wetland ecosystem services in the Da Hinggan mountains, China. Chin. Geogr. Sci. 32 (2), 302–311. doi:10.1007/s11769-022-1268-2
Zhou, W., and He, B. (2014). Eco-environmental quality assessment of Ruoergai county in Sichuan province based on multi-sources remote sensing data. J. Geo-Information Sci. 16 (2), 314–319. doi:10.3724/SP.J.1047.2014.00314
Zhu, W., Wang, S., Luo, P., Zha, X., Cao, Z., Lyu, J., et al. (2022). A quantitative analysis of the influence of temperature change on the extreme precipitation. Atmosphere 13 (4), 612. doi:10.3390/atmos13040612
Keywords: remote sensing ecologic index, google earth engine, geo-detector, trend analysis, Jilin Province
Citation: Wang F, Han Y, Xu Y, Zhu R, Qu C, Zhang P, Martin S, Zhuang L, Liu Z, Zhang J and Huang F (2024) Spatial-temporal variation and influencing factors of ecological environment quality in Jilin Province (China). Front. Environ. Sci. 12:1446313. doi: 10.3389/fenvs.2024.1446313
Received: 09 June 2024; Accepted: 11 July 2024;
Published: 13 September 2024.
Edited by:
Yong Q. Tian, Central Michigan University, United StatesReviewed by:
Jie Wang, Anhui University, ChinaCopyright © 2024 Wang, Han, Xu, Zhu, Qu, Zhang, Martin, Zhuang, Liu, Zhang and Huang. This is an open-access article distributed under the terms of the Creative Commons Attribution License (CC BY). The use, distribution or reproduction in other forums is permitted, provided the original author(s) and the copyright owner(s) are credited and that the original publication in this journal is cited, in accordance with accepted academic practice. No use, distribution or reproduction is permitted which does not comply with these terms.
*Correspondence: Yang Han, aGFueTAyNUBuZW51LmVkdS5jbg==; Fang Huang, aHVhbmdmODM1QG5lbnUuZWR1LmNu
†These authors have contributed equally to this work and share first authorship
Disclaimer: All claims expressed in this article are solely those of the authors and do not necessarily represent those of their affiliated organizations, or those of the publisher, the editors and the reviewers. Any product that may be evaluated in this article or claim that may be made by its manufacturer is not guaranteed or endorsed by the publisher.
Research integrity at Frontiers
Learn more about the work of our research integrity team to safeguard the quality of each article we publish.