 Asma A. Al-huqail
 Zubairul Islam
 Hanan F. Al-Harbi
95% of researchers rate our articles as excellent or good
Learn more about the work of our research integrity team to safeguard the quality of each article we publish.
Find out more
ORIGINAL RESEARCH article
Front. Environ. Sci. , 23 July 2024
Sec. Environmental Informatics and Remote Sensing
Volume 12 - 2024 | https://doi.org/10.3389/fenvs.2024.1439425
Mangrove ecosystems are vital to arid environments like Saudi Arabia, offering crucial ecological services and enhancing biodiversity. This study investigates the spatial distribution and temporal dynamics of mangrove coverage in the Al Wajh lagoon area, crucial for crafting effective conservation and management strategies. Employing high-resolution Landsat and Sentinel imagery, the Normalized Difference Vegetation Index (NDVI) and Land Surface Temperature (LST) were analysed across 35 mangrove clusters. By 2023, mangroves covered approximately 24.5 km2. Kendall Tau-b Correlation Coefficients confirmed a significant positive trend. The study further explored the relationship between NDVI and surface temperature, revealing an inverse correlation with slope values ranging from −4.03 to −44.1, suggesting that increased mangrove coverage significantly contributes to local cooling, thereby underscoring the climate regulation benefits of mangrove conservation. This positive change in NDVI post-2020 is directly attributable to the conservation efforts embedded within the Red Sea Project, Vision 2030, development phases, demonstrating the critical role of designated conservation zones in mitigating the environmental impacts of large-scale development projects. The findings underscore the need for targeted policies to protect and expand mangrove habitats as part of broader environmental sustainability goals in the region.
Mangroves are woody plants found at the land-sea interface in tropical and subtropical regions, thriving in high salinity, extreme tidal conditions, strong winds, elevated temperatures, and oxygen-poor, muddy soils (K. Kathiresan and Bingham, 2001). Mangrove forests hold significant ecological and socio-economic benefits for humans (Bennett and Reynolds, 1993). In recent years, the afforestation and reforestation of mangroves has become increasingly important as a measure to mitigate the effects of climate change (Bastin et al., 2019; Macreadie et al., 2021).—Globally, mangroves are disappearing at a startling rate of 2 percent annually, based on the most trustworthy estimates (Pendleton et al., 2012), the IPCC has issued a concerning prediction, stating that if the current rate of loss persists, approximately 30%–40% of the coastal environment and 100% of mangrove forested areas may disappear in the next 100 years (Mackay, 2008; Macintosh et al., 2002). A significant change in land use and cover that significantly affected the sustainability of mangrove vegetation in the Red Sea (Arshad et al., 2020). According to Dadson et al. (2016) the vulnerability of coastal communities to various potential hazards, such as shoreline erosion, coastal inundation, and coastal resource degradation, is on the rise globally.
Mangrove forests are found along the coastlines of Arabia, representing one of the most environmentally challenging areas within their global range (Friis and Burt, 2020). Mangrove forests, often fragmented, populate numerous tidal regions along the coastlines of the Red Sea and the Arabian Gulf, located south of the 26° north latitude (Friis and Killilea, 2023). They are part of the Rhizophoraceae family, and Avicennia marina is the predominant species along the Red Sea coast of Saudi Arabia, although Rhizophora mucronata also appears in patches (Kumar et al., 2010).
Due to the logistical challenges of conducting fieldwork in these forested wetlands, satellite-based remote sensing has become the most common method for classifying mangrove forests (Valderrama-Landeros et al., 2017). In researching mangrove ecosystems, a variety of remote sensing technologies are utilized to collect and analyse data (Kuenzer et al., 2011). In Situ Measurements provide ground-truth data directly from the mangroves, essential for validating remote analyses (Yue et al., 2007. Laboratory Measurements use tools like field spectrometers to analyse on-site samples. Aerial Photography and Digital Imagery, such as CIR videography, facilitate detailed mangrove mapping and health assessments. High-resolution satellites like QuickBird and IKONOS deliver precise images for mapping mangrove distribution (Wang et al., 2004). Medium-resolution imagery from platforms like ASTER and Landsat monitors broad changes over time (Akumu et al., 2010). Hyperspectral sensors such as AISA+ and AVIRIS capture extensive wavelength ranges, crucial for detailed species and health studies (Jyoti et al., 2021).
The USGS dataset from 2000, which has been widely used to monitor mangrove distribution, is now significantly outdated, especially considering the dynamic nature of mangrove ecosystems (Li et al., 2019). Since the year 2000, there have been considerable advancements in remote sensing technologies and methodologies, particularly with the NDVI. Previous research has highlighted mangrove distribution in the Red Sea area (Blanco-Sacristán et al., 2022), but detailed studies linking mangrove changes to surface temperature are scarce.
So, this study aims to advance the understanding of mangrove ecosystem dynamics and their climatic interactions in the northern Al-Wajh Lagoon, Saudi Arabia, through the specific objectives. First, to accurately estimate the extent of mangrove coverage around the islands of northern Wajh Bank in the year 2023. Second, to conduct a time series analysis of NDVI from 1984 to 2023, providing insights into the vegetation dynamics over nearly 4 decades. Third, to investigate the impact of changes in mangrove coverage on local land surface temperature (LST) from 2013 to 2023.
These objectives are structured to provide comprehensive insights into the ecological changes occurring within the mangrove forests of the Al-Wajh Lagoon, thereby contributing valuable data to global efforts in mangrove conservation and climate change mitigation.
Al-Wajh lagoon’s Protected Areas is situated in Red Sea side of Saudi Arabia, with coordinates ranging from approximately 24° 14′N −25° 53′N and 36° 29′E −37° 42′E, this is 3,857.6 km2 reserve (Figure 1). This specific delineation encompasses a significant marine area off the coast, characterized by its ecological importance and unique environmental conditions that support a diverse range of marine life, including significant benthic communities (UNEP-WCMC and IUCN, 2024). Al-Wajh lagoon is characterized as a relatively enclosed marine environment, resulting in limited water exchange between its interior and the surrounding sea; consequently, the waters in this Area are typically turbid. It is Sea Surface Temperature (SST) ranges from 24°C to 32°C, with the lowest temperatures around January and the highest around September (OSTIA, 2016). An SST Anomaly of approximately 1.5°C was recorded in 2023, reflecting a deviation from the daily average SST during the years 1981–2011. Ocean wave current movement ranges from 0.07 m/s to 5 m/s (Dohan and Lagerloef, 2024). The Significant Wave Height, which is roughly equal to the mean wave height, is around 0.08 m (Centers, 2019). The region is classified within Bleaching Alert Levels 2 to 4. Alert Level 2 indicates a risk of reef-wide bleaching with mortality of heat-sensitive corals. Alert Level 3 signifies the risk of multi-species mortality, while Alert Level 4 indicates the risk of severe, multi-species mortality (greater than 50% of corals) (Manzello, 2022).
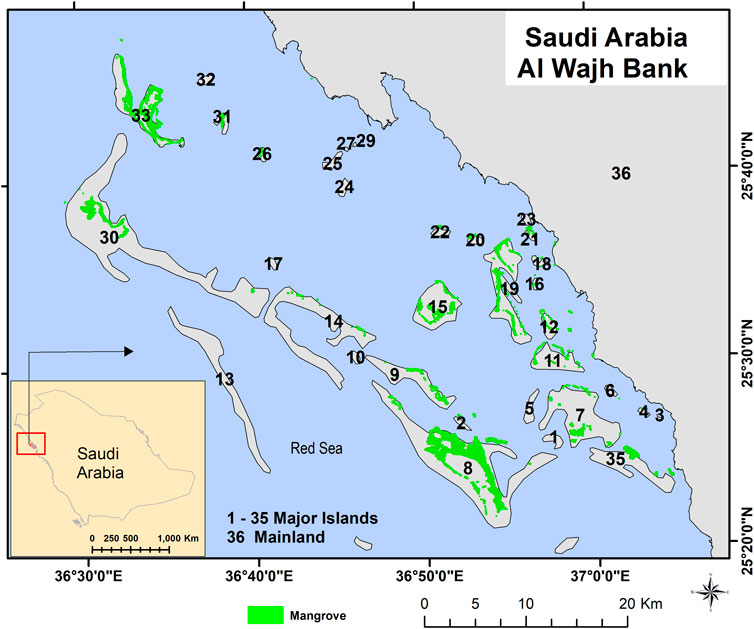
Figure 1. Study area.
The Al Wajh lagoon, a key component of The Red Sea Project (TRSP), is a significant study area due to its pristine environment encompassing 2,081 km2 and including 92 islands with globally important habitats such as coral reefs, seagrass, and mangroves (Chalastani et al., 2020). As TRSP aims to become a sustainable luxury tourism destination while achieving a net-positive impact on biodiversity, understanding the trends and dynamics of mangroves and their influence on surface temperature is crucial for optimizing conservation efforts and ensuring the successful balance of development and environmental preservation in this unique and valuable region.
In this study area, authors employed occurrence data and nearest neighbour analysis to delineate clusters of mangroves in Al Wajh Lagoon. Given the gregarious nature of mangrove species, which often proliferate in colonies or clusters, the methodology aimed to identify spatial groupings that reflect this ecological characteristic. Mangrove occurrences were analysed across various platforms surrounding the islands within the lagoon. This approach facilitated the identification of discrete clusters based on spatial proximity and density of mangrove occurrences.
The analysis revealed a total of 35 distinct mangrove clusters distributed across the island platforms. Additionally, a significant cluster was identified along the coastal interface where the mainland of Saudi Arabia meets the ocean. This particular cluster is notable for its strategic ecological position, potentially serving as a critical habitat linkage between terrestrial and marine ecosystems. The distribution and structure of these clusters underscore the complex spatial dynamics of mangrove ecosystems in Al Wajh Lagoon, providing insights into their ecological organization and potential areas for conservation focus.
The research commenced by establishing the Google Earth Engine environment as the foundational platform for data analysis. We meticulously selected the study area and defined the analysis period. Data from the Landsat and Sentinel series was collected based on cloud cover (less than 10%) and additional parameters like Sun elevation, Sun azimuth, and sensor viewing angles to ensure the data quality and consistency for analysis.
The data processing steps included masking out clouds, water bodies, and saturated pixels to refine the vegetation signals. Central to this analysis were the calculations of the NDVI and LST from the processed satellite imagery. LST was extracted from the thermal infrared bands of the Landsat imagery, beginning with the conversion of digital numbers (DN) into spectral radiance, followed by transformation into brightness temperature using the calibration constants from the Landsat data. An emissivity correction, based on the NDVI, was then applied to adjust for different land surface emissivities, facilitating precise LST measurements across various land cover types.
These processed datasets were imported into R Studio for further analysis. Here, we conducted regression and trend analyses to examine the relationships between NDVI and LST, enabling a detailed and accurate assessment of long-term vegetation and climate interactions within the study area, as illustrated in Figure 2.
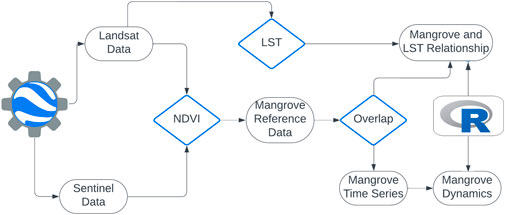
Figure 2. Work flow chart.
To estimate the distribution of NDVI, satellite images from Landsat 5 TM, 7 ETM+, and 8 OLI were utilized for the years 1984–2023 (Landsat Collections in Earth Engine, 2024). Additionally, Sentinel-2 data was examined to complement and validate the study (Sentinel Collections in Earth Engine, 2024). Furthermore, the Global Mangrove Distribution Vector (GMW) from 2010, a baseline global distribution map of mangroves produced by Aberystwyth University in collaboration with Solo Earth Observation (soloEO), was also utilized to provide geospatial information about mangrove extent and changes, enriching the study’s data layers (UNEP-WCMC Dataset).
Remote sensing technologies using Google Earth Engine (GEE) platform was used to analyse the NDVI, which is instrumental in estimating mangrove coverage. To address the common challenges posed by cloud cover and cloud shadows, the “QA_PIXEL” band was used for the systematic identification and exclusion of cloud-contaminated pixels, ensuring that NDVI computations are based on clear and accurate spectral information. This meticulous approach enables to maintain the integrity of NDVI analysis, providing reliable estimates of mangrove coverage across the study areas.
Validation of the NDVI data involved the correlation of the NDVI values from the Landsat series with those from Sentinel-2. By leveraging the temporal overlap and spectral similarity between the sensors on the two-satellite series. The resulting high correlation coefficient (r = 0.825) indicated a strong linear relationship, affirming the accuracy of the NDVI data from the Landsat series. Additionally, field data from systematic ground truthing exercises supplemented the satellite-derived NDVI readings, providing a dependable foundation for further analyses of vegetation dynamics.
First, brightness temperature was calculated from the thermal band data (Ermida et al., 2020). The raw digital number (DN) values are first converted to top-of-atmosphere (TOA) radiance and then to brightness temperature using the following Eq. 1.
where:
ML and AL are the multiplicative and additive rescaling factors from the metadata.
K1 and K2 are calibration constants also obtained from the metadata.
DN is the digital number of the thermal band.
Tb is the brightness temperature in Kelvin.
Thereafter, LST was calculated using the brightness temperature and emissivity (Sekertekin and Bonafoni, 2020) using the following Eq. 2:
where:
Tb is the brightness temperature in Kelvin.
λ is the wavelength of emitted radiance (which depends on the thermal band used).
ρ is a constant.
ϵ is the surface emissivity.
The data was validated through comparative analyses with field measurements to ensure the reliability of findings. The findings revealed a strong correlation (r2 = 0.88, p < 0.01). The analysis also identified a root mean square error (RMSE) of 2.6 between the datasets. It was observed that the Landsat-derived values were consistently lower than those from in-situ measurements.
Kendall’s Tau-b Correlation Coefficient was used to measure the strength and direction of variables. It is a non-parametric statistic, which makes it useful for understanding trends in time series data where the variables may not follow a normal distribution (Arndt et al., 1999), Eq. 3.
Where.
nc = number of concordant pairs
nd = number of discordant pairs
n0 = n(n − 1)/2
n1 = ∑ti(ti − 1)/2 (for ties in the first quantity)
n2 = ∑uj(uj − 1)/2 (for ties in the second quantity)
n = total number of observations
Linear regression analysis was performed to quantify the relationship between the NDVI and LST across different mangrove clusters for the period 2013 to 2023. The NDVI serves as a proxy for mangrove density, and its variation is hypothesized to influence local surface temperatures. Each regression model was fitted for individual clusters to assess the impact of increased mangrove coverage on the cooling of land surfaces.
The general form of the linear regression model used in the analysis is expressed by Eq. 4:
where:
LST represents the land surface temperature.
NDVI is the normalized difference vegetation index.
β0 (the intercept) indicates the estimated LST when NDVI is zero, reflecting the baseline surface temperature without vegetation.
β1 (the slope) measures the change in LST per unit change in NDVI, where a negative slope indicates a cooling effect as mangrove density increases.
ϵ is the error term.
The NDVI-based analysis in this study, indicating a mangrove area of approximately 24.5 km2 in 2023, shows good consistency with the findings of Bindajam et al. (2023), who reported a mangrove cover of 27.6 km2 in 2022 using high-resolution multispectral images and advanced machine learning algorithms. Figure 3 shows Landsat vs Sentinel NDVI during 2023, the r2 0.825 demonstrates that 82.5% of the variance in Sentinel NDVI is explained by Landsat NDVI, implying a strong linear correlation. The result highlights the general consistency between Landsat and Sentinel NDVI data, providing a basis for comparative studies and suggesting that Landsat NDVI can serve as a reliable source of information. The strong R-squared value of 0.825 in my research aligns well with the findings of Zhang et al. (2018), who reported even higher r2 > 0.89 for OLS linear regressions of MSI and OLI data.
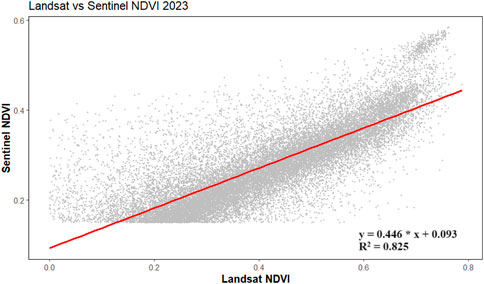
Figure 3. Landsat vs. Sentinel, 2023.
Figure 4 shows the NDVI median values for the 2023 ranged significantly across the clusters, with cluster 30 exhibiting the highest median NDVI of 0.3335 and cluster six the lowest at 0.1512. Variability in NDVI, indicated by the standard deviation, also varied broadly, from as low as 0.1014 in cluster 21 to a high of 0.2627 in cluster 2, suggesting differential stability in vegetation characteristics within these clusters. Furthermore, the spatial extent covered by each cluster was considerably diverse, ranging from 900 square meters in cluster six to over 11 million square meters in cluster 8, highlighting the extensive variability in area coverage and potential ecological diversity observed in this study.
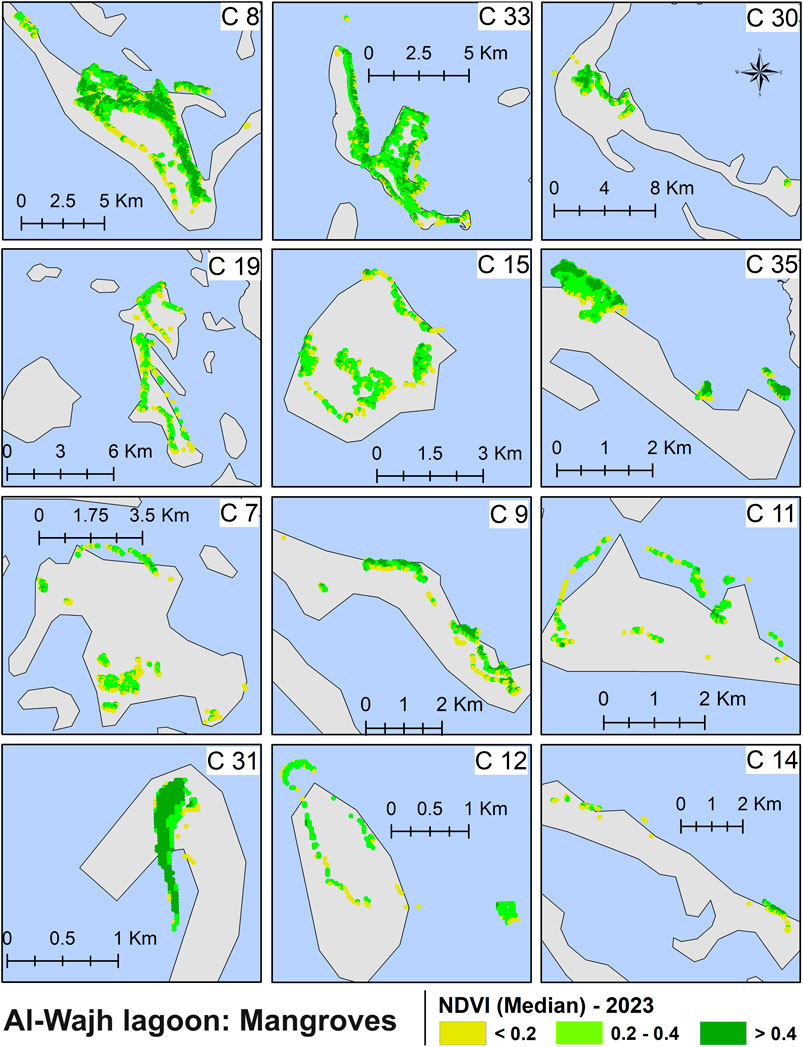
Figure 4. NDVI, 2023.
Figure 5 shows data for 35 distinct clusters, with the Kendall Tau-b values representing the strength and direction of trends in mangrove coverage over time. Positive values indicate an increasing trend in mangrove coverage, while negative values suggest a decrease. The box plot highlights significant variability across the clusters, with some clusters showing strong positive trends (e.g., clusters 1, 8, 9, 15, and 26) and others displaying more neutral (e.g., clusters 12 and 19).
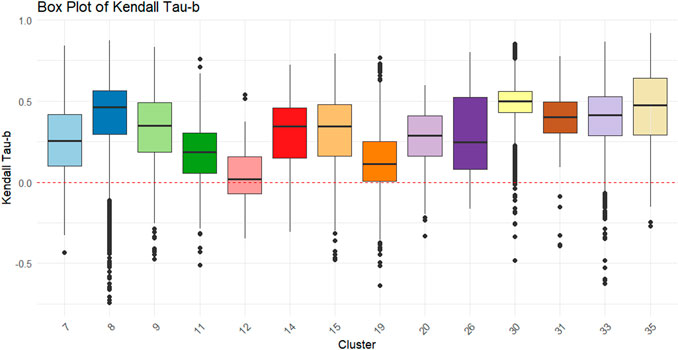
Figure 5. NDVI change from 1984 to 2023.
Several studies support an increase in mangrove area. According to Bindajam et al. (2023), the mangrove cover expanded two times in Al Wajh Lagoon. Almahasheer et al. (2016a) found that there has been a minor increase, rather than a decline, in mangrove stands in the Red Sea. They observed mangroves covering roughly 69 km2 along the African coast and 51 km2 along the shore of the Arabian Peninsula. The mangrove area increased by approximately 0.29 percent annually between 1972 and 2013. Despite the general decline of mangrove areas in most tropical regions over the past 40 years, forests bordering the Red Sea have reportedly increased by 12% as per Almahasheer et al. (2016a).
Figure 6 displays the map of each cluster, illustrating the range of values across different clusters and highlighting significant variability in NDVI trends among the mangrove communities. Values below zero indicate a decline in NDVI, suggesting potential mangrove loss, while values above zero signify an increase in NDVI, indicating growth or recovery of mangrove vegetation. Overall, there is an increasing trend in the mangroves in Al Wajh Lagoon. For instance, Cluster 8 shows a substantial increase in mangrove vegetation, which could be attributed to successful conservation efforts. Despite this, the minimum value of −0.74 indicates a decline in mangrove health, albeit in a very small boundary area. The highest values, such as 0.92 in Cluster 35, demonstrate a robust increase in mangrove vegetation, likely due to effective conservation strategies, favorable environmental factors, or natural regeneration processes.
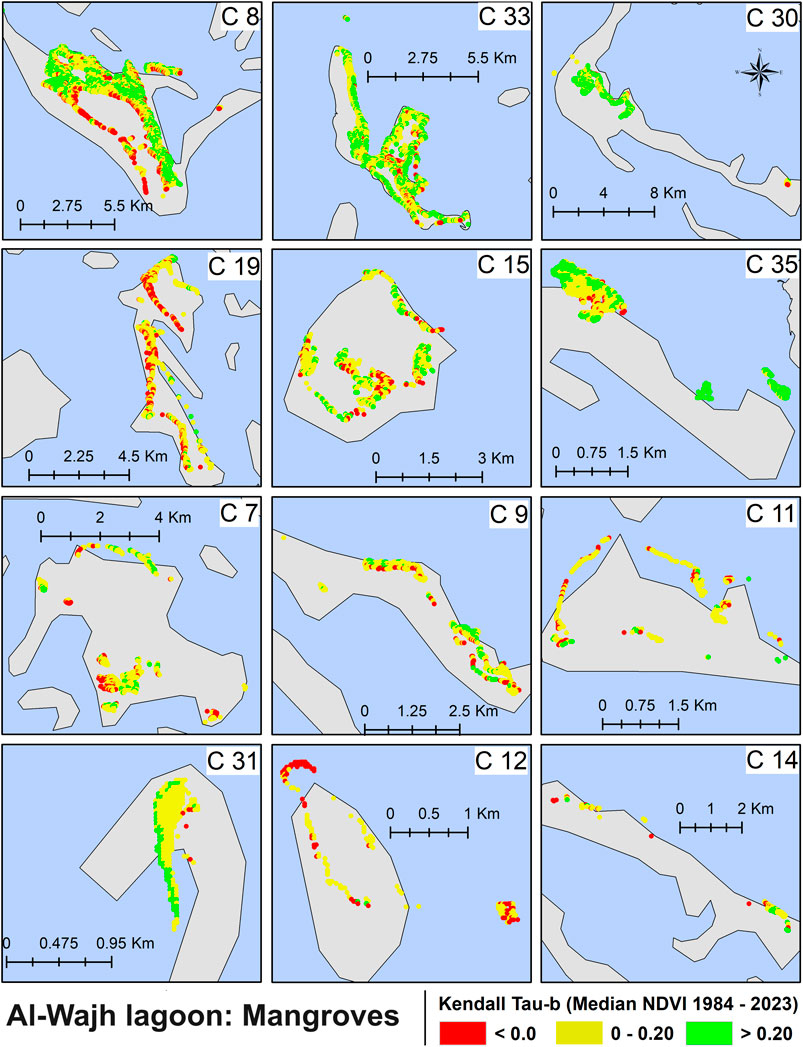
Figure 6. NDVI cofficent of correlation.
The linear regression results given in Table 1, reveal a consistent negative slope, indicating that increases in NDVI (mangrove density) correlate with decreases in LST. The slope values vary considerably among clusters, ranging from −4.03 in Cluster 14 to −44.1 in Cluster 30, suggesting that the cooling effect of mangroves is more pronounced in some regions. The intercept values, representing estimated LST when NDVI is zero, also vary widely from 29.8°C in Cluster 14°C–49.3°C in Cluster 30, reflecting baseline temperature differences across clusters.
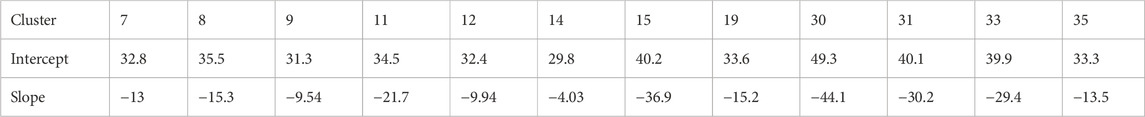
Table 1. NDVI vs. LST—2013–2023.
The findings, demonstrating a significant cooling effect of increased mangrove density on local LST, align with the work of Chen et al. (2016), which underscores the complex role of mangroves in climate regulation. While Chen et al. (2016) highlighted the considerable CO2 sequestration capabilities of mangrove plants, which mitigate atmospheric warming, the results further emphasize this cooling effect through observed negative correlations between NDVI and LST across various clusters. These complementary insights reinforce the critical role of mangroves in both sequestering CO2 and reducing local temperatures, underscoring their importance in climate change mitigation strategies.
Figure 7 shows the figure representing the NDVI and LST from 2013 to 2023. In Cluster 8, the regression analysis identified a substantial cooling trend, particularly between 2020 and 2022, when the NDVI surged from 0.31 to 0.37, significantly lowering temperatures. Cluster 8 is positioned at the intersection of top conservation and development zones. So, this trend can be attributed to enhanced vegetation density within the top conservation area adjacent to development activities, promoting ecological stability. The strategic placement of this cluster demonstrates the effectiveness of incorporating conservation buffers around development zones, ensuring the maintenance and recovery of critical mangrove ecosystems. The same is with Cluster 33, positioned at the intersection of top conservation and development zones. The regression model illustrates significant cooling alongside rising NDVI levels, particularly between 2021 and 2022, where NDVI increased from 0.26 to 0.29 and temperatures fell from 31.46°C to 31.17°C. This trend is strongly reflected by the steep negative slope of −29.4, indicating a substantial temperature decrease of 29.4°C for each unit increase in NDVI, starting from a high intercept of 39.9°C when NDVI is zero.
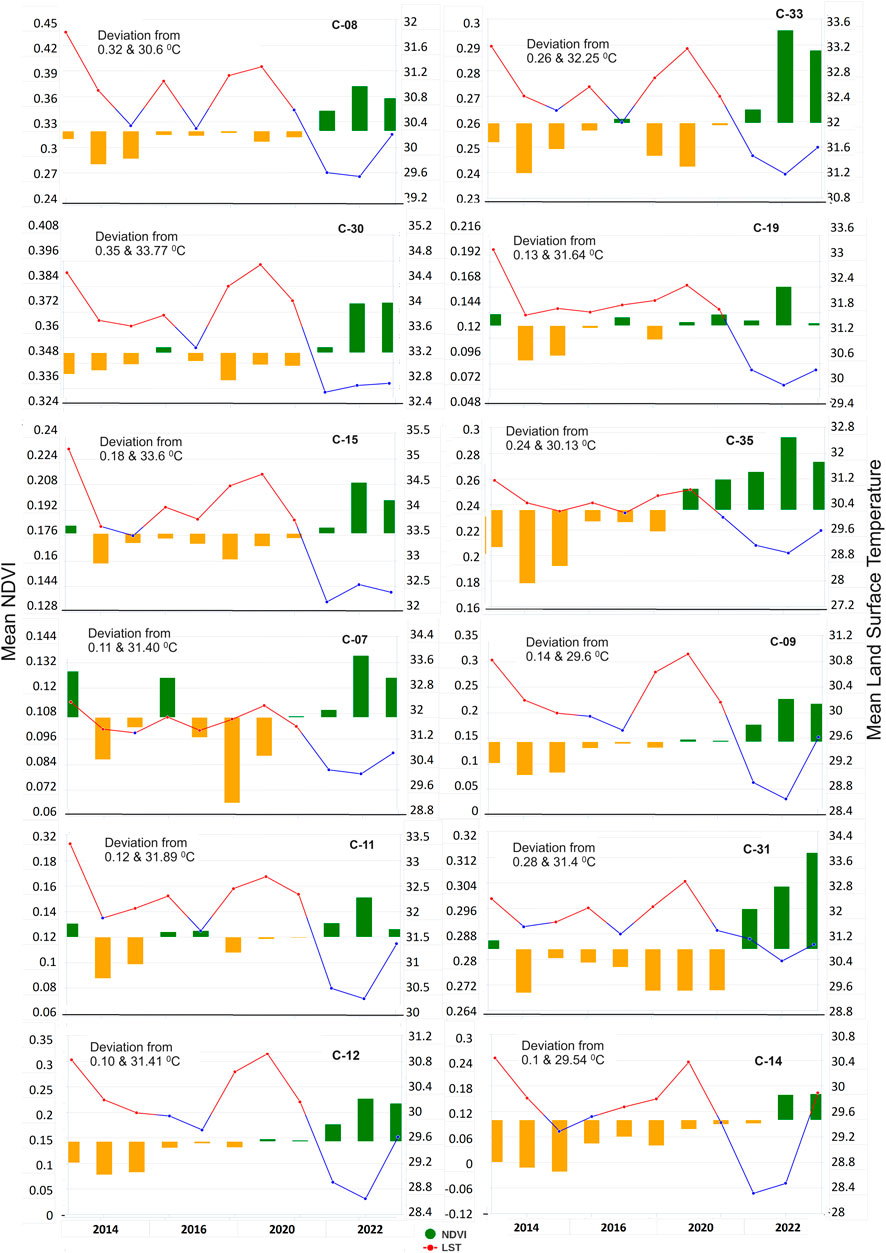
Figure 7. NDVI vs. LST.
In Cluster 30, the regression model reveals the strongest cooling effect per unit increase in NDVI among all clusters analyzed, with a steep negative slope of −44.1. This dramatic cooling trend is highlighted from 2021 to 2023, where NDVI increased notably from 0.35 to 0.37, yet temperatures slightly increased from 32.74°C to 32.87°C. Despite this slight increase, the overall trend from the high intercept of 49.3°C suggests that a small NDVI increase results in significant temperature decreases. This emphasizes the profound impact of dense mangrove coverage on moderating local temperatures in Cluster 30. In Cluster 19, regression analysis illustrates a pronounced negative slope of −15.2, suggesting that increases in NDVI are closely associated with decreases in surface temperature. The most significant cooling trend occurred from 2020 to 2022, where NDVI rose from 0.14 to 0.16, and temperatures dropped notably from 31.87°C to 30.09°C.
In Cluster 15, the analysis indicates a substantial negative slope of −36.9, illustrating a strong correlation where increases in NDVI lead to significant decreases in LST. The steepest decline in temperature occurred between 2020 and 2021, where NDVI rose from 0.17 to 0.18 and temperature dropped sharply from 33.78°C to 32.19°C. In Cluster 35, the regression results depict a consistent negative slope of −13.5, suggesting a moderate decrease in surface temperatures in response to increases in NDVI. Over the decade, the most significant temperature decline was observed from 2021 to 2022, when NDVI increased from 0.26 to 0.29, leading to a temperature decrease from 29.12°C to 28.87°C. In Cluster 7, the regression analysis demonstrates a negative slope of −13, indicating a decrease in surface temperatures as NDVI increases. The regression model suggests a consistent cooling effect with the most notable reduction in temperature occurring between 2021 and 2022, where NDVI increased from 0.11 to 0.13, resulting in a temperature drop.
The regression analysis across various clusters distinctly demonstrates the influence of increased mangrove density (NDVI) on reducing surface temperatures. Notably, Cluster 30 stands out with the steepest negative slope of −44.1, showing the most significant temperature reduction per unit increase in NDVI, followed by Cluster 15 with a slope of −36.9. These clusters exemplify the potent climatic impact of healthy, dense mangrove cover. On the other end, Cluster 14 has the least steep slope (−4.03), indicating a much milder cooling effect. Overall, the findings underline the critical role of mangroves in local climate regulation, with varying degrees of influence across different geographical areas. This variability emphasizes the necessity for tailored conservation strategies, taking into account the specific environmental conditions and mangrove health within each cluster to optimize their ecological benefits, particularly in mitigating temperature extremes. These results underscore the significant role of mangrove coverage in moderating local climate conditions, with variations likely influenced by environmental factors specific to each cluster.
The Red Sea Project (TRSP), part of Saudi Arabia’s Vision 2030 initiative, aims to develop the region into a luxury tourism destination while emphasizing sustainability and conservation. The project, launched in 2017, has already begun to welcome visitors as of 2023, with its first phase expected to complete in 2024 and full realization by 2030 (Chalastani et al., 2020). This ambitious development coincides with notable environmental observations, particularly in the Al Wajh lagoon area, as reflected in the increasing NDVI values from 2020, observed in various clusters. Clusters like 30, 15, and 33, located within or adjacent to high and top conservation zones, exhibit significant increases in NDVI alongside cooling trends in LST. This suggests that despite the developmental pressures, conservation efforts might be enhancing vegetative cover, contributing to local climate regulation. These findings underscore the critical role of designated conservation areas in mitigating the ecological impacts of large-scale developments such as TRSP. By maintaining or increasing mangrove density and other vegetation, these zones not only support biodiversity but also provide essential ecosystem services, including climate moderation.
This study explored the multi-temporal NDVI data derived from Landsat and Sentinel satellites through Google Earth Engine to map and monitor mangrove ecosystems in the study area. The utilization of the Overlap Algorithm enabled a precise evaluation of NDVI values, which provided insights into the conditions and trends of mangrove coverage over time. The validation of classified NDVI data further reinforced the reliability of findings, showcasing an overall increase in NDVI across the study area. The spatiotemporal dynamics of the mangrove forests were rigorously assessed using the Mann-Kendall significance test, which confirmed a general increase in mangrove coverage. However, this growth was juxtaposed against a decline in the total area covered by mangroves over a 5-year period, particularly within transition and buffer zones. These results underscore the complexity of mangrove ecosystem dynamics and highlight areas requiring further conservation efforts. Moreover, the study thoroughly examined the impact of NDVI changes on LST. Linear regression analysis across various clusters demonstrated a consistent negative relationship between NDVI increases (indicative of greater mangrove density) and LST decreases. The variation in slope values among different clusters, ranging from −4.03 in Cluster 14 to −44.1 in Cluster 30, highlights that the cooling effect of mangroves can be more pronounced in certain areas. The intercept values, which represent the estimated LST when NDVI is zero, varied significantly from 29.8°C in Cluster 14°C–49.3°C in Cluster 30, indicating baseline temperature differences across the study area. These findings emphasize the critical role of mangrove coverage in moderating local climate conditions, potentially influenced by geographical and environmental factors specific to each cluster. This balance is particularly pertinent in the context of tourism development, where environmental changes must be carefully managed to ensure sustainability. Overall, the research contributes valuable data that can inform policy and management decisions aimed at enhancing the conservation and sustainable use of mangrove ecosystems, thereby supporting both biodiversity and local communities dependent on these critical habitats
Publicly available datasets were analyzed in this study. This data can be found here: https://code.earthengine.google.com/bf2347e581ce22d91e02e088a9735e29.
AA-h: Conceptualization, Funding acquisition, Methodology, Supervision, Writing–original draft, Writing–review and editing. ZI: Data curation, Formal Analysis, Methodology, Software, Writing–original draft. HA-H: Conceptualization, Funding acquisition, Investigation, Resources, Writing–review and editing.
The author(s) declare financial support was received for the research, authorship, and/or publication of this article. This research was funded by the Deanship of Scientific Research, King Saud University, through Vice Deanship of Scientific Research Chairs: Chair of Climate Change, Environmental Development and Vegetation Cover.
The authors are grateful to the Deanship of Scientific Research, King Saud University for funding through Vice Deanship of Scientific Research Chairs: Chair of Climate Change, Environmental Development and Vegetation Cover.
The authors declare that the research was conducted in the absence of any commercial or financial relationships that could be construed as a potential conflict of interest.
All claims expressed in this article are solely those of the authors and do not necessarily represent those of their affiliated organizations, or those of the publisher, the editors and the reviewers. Any product that may be evaluated in this article, or claim that may be made by its manufacturer, is not guaranteed or endorsed by the publisher.
DN, Digital Number (raw satellite data); ETM +, Enhanced Thematic Mapper Plus (for Landsat 7); FVC, Fractional Vegetation Cover; GEE, Google Earth Engine; LST, Land Surface Temperature; NDVI, Normalized Difference Vegetation Index; NIR, Near-Infrared; RED, Red Band (Spectral Band); OLI, Operational Land Imager (for Landsat 8 and 9); QA_PIXEL, Quality Assurance Pixel (used for cloud and shadow detection); TM, Thematic Mapper (for Landsat 5); USGS, United States Geological Survey.
Akumu, C. E., Pathirana, S., Baban, S. M., and Bucher, D. J. (2010). Monitoring coastal wetland communities in north-eastern NSW using ASTER and Landsat satellite data. Wetlands Ecology and Management 18 (3), 357–365. doi:10.1007/s11273-010-9176-0
Almahasheer, H., Aljowair, A., Duarte, C. M., and Irigoien, X. (2016a). Decadal stability of Red Sea mangroves. Estuar. Coast Shelf Sci. 169, 164–172. doi:10.1016/j.ecss.2015.11.027
Arndt, S., Turvey, C., and Andreasen, N. C. (1999). Correlating and predicting psychiatric symptom ratings: Spearman r versus Kendalls tau correlation. J. Psychiatric Res. 33 (2), 97–104. doi:10.1016/s0022-3956(98)90046-2
Arshad, M., Eid, E. M., and Hasan, M. (2020). Mangrove health along the hyper-arid southern Red Sea coast of Saudi Arabia. Environ. Monit. Assess. 192 (3), 189. . doi:10.1007/s10661-020-8140-6
Bennett, E. L., and Reynolds, C. J. (1993). The value of a mangrove area in Sarawak. Biodivers. Conservation 2 (4), 359–375. doi:10.1007/bf00114040
Bindajam, A. A., Mallick, J., Talukdar, S., Shohan, A. A. A., and Alshayeb, M. J. (2023). Assessment of long-term mangrove distribution using optimised machine learning algorithms and landscape pattern analysis. Environ. Sci. Pollut. Res. 30 (29), 73753–73779. . doi:10.1007/s11356-023-27395-2
Blanco-Sacristán, J., Johansen, K., Duarte, C. M., Daffonchio, D., Hoteit, I., and McCabe, M. F. (2022). Mangrove distribution and afforestation potential in the Red Sea. Sci. Total Environ. 843, 157098. doi:10.1016/j.scitotenv.2022.157098
Chalastani, V. I., Panos, M., Al-Suwailem, A. M., Hale, J. A., Vijayan, A. P., Pagano, J., et al. (2020). Reconciling tourism development and conservation Outcomes through marine spatial Planning for a Saudi Giga-project in the Red Sea (the Red Sea project, vision 2030). Front. Mar. Sci. 7. doi:10.3389/fmars.2020.00168
Centers, N. (2019). WAVEWATCH III Model Description. Noaa.gov. Available at: https://polar.ncep.noaa.gov/waves/wavewatch/.
Chen, G., Chen, B., Yu, D., Tam, N. F. Y., Ye, Y., and Chen, S. (2016). Soil greenhouse gas emissions reduce the contribution of mangrove plants to the atmospheric cooling effect. Environ. Res. Lett. 11 (12), 124019. doi:10.1088/1748-9326/11/12/124019
Dadson, I. Y., Owusu, A. B., and Osman, A. (2016). Analysis of shoreline change along Cape coast-Sekondi coast, Ghana. Geogr. J. 3, 1–9. doi:10.1155/2016/1868936
Dohan, K., and Lagerloef, G. (2024). OSCAR. Earth and Space Research. Available at: https://www.esr.org/research/oscar/.
Friis, G., and Burt, J. A. (2020). Evolution of mangrove research in an extreme environment: Historical trends and future opportunities in Arabia. Ocean Coast. Manag. 195, 105288. doi:10.1016/j.ocecoaman.2020.105288
Friis, G., and Killilea, M. E. (2023). Mangrove ecosystems of the United Arab Emirates, 217–240. doi:10.1007/978-3-031-37397-8_7
Jyoti, P. H., Samanta, S., Nilima, R. C., Misra, A., Giri, S., Niloy, P., et al. (2021). Mangrove classification using airborne hyperspectral AVIRIS-NG and comparing with other spaceborne hyperspectral and multispectral data. Egypt. J. Remote Sens. Space Sciences/the Egypt. J. Remote Sens. Space Sci. 24 (2), 273–281. doi:10.1016/j.ejrs.2020.10.002
Kathiresan, K., and Bingham, B. L. (2001). Biology of mangroves and mangrove Ecosystems. Adv. Mar. Biol., 81–251. doi:10.1016/s0065-2881(01)40003-4
Kuenzer, C., Bluemel, A., Gebhardt, S., Tuan, Vo Q., and Dech, S. (2011). Remote sensing of mangrove ecosystems: a review. Remote Sens. 3 (5), 878–928. doi:10.3390/rs3050878
Kumar, A., Khan, M. A., and Muqtadir, A. (2010). Distribution of mangroves along the Red Sea coast of the Arabian Peninsula: Part-I: the northern coast of western Saudi Arabia. Earth Sci. India 3.
Landsat Collections in Earth Engine (2024). Google for Developers. Available at: https://developers.google.com/earth-engine/datasets/catalog/landsat.
Li, W., Hesham, E.-A., Qurban, M. A., Li, J., ManiKandan, K. P., and Piechota, T. (2019). Using multi-indices approach to quantify mangrove changes over the Western Arabian Gulf along Saudi Arabia coast. Ecol. Indic. 102, 734–745. doi:10.1016/j.ecolind.2019.03.047
Macintosh, D. J., Ashton, E. C., and Havanon, S. (2002). Mangrove Rehabilitation and Intertidal biodiversity: a study in the Ranong mangrove ecosystem, Thailand. Estuar. Coast. Shelf Sci. 55 (3), 331–345. doi:10.1006/ecss.2001.0896
Mackay, A. (2008). Climate change 2007: impacts, adaptation and vulnerability. Contribution of Working Group II to the fourth assessment report of the Intergovernmental Panel on Climate Change. J. Environ. Qual. 37 (6), 2407. . doi:10.2134/jeq2008.0015br
Manzello, D. (2022). NOAA Coral Reef Watch. Noaa.gov. Available at: https://coralreefwatch.noaa.gov/about_us.php.
OSTIA (2016). Metoffice.gov.uk. Available at: https://ghrsst-pp.metoffice.gov.uk/ostia-website/index.html.
Pendleton, L., Donato, D. C., Murray, B. C., Crooks, S., Jenkins, W. A., Sifleet, S., et al. (2012). Estimating global “blue carbon” emissions from conversion and degradation of vegetated coastal ecosystems.
Sentinel Collections in Earth Engine (2024). Google for Developers. Available at: https://developers.google.com/earth-engine/datasets/catalog/sentinel.
UNEP-WCMC and IUCN (2017). Protected Planet: The World Database on Protected Areas (WDPA) and World Database on Other Effective Area-based Conservation Measures (WD-OECM), Cambridge, UK: UNEP-WCMC and IUCN. Available at: www.protectedplanet.net.
Valderrama-Landeros, F.F., Kovacs, J. M., and Flores-Verdugo, F. (2017). An assessment of commonly employed satellite-based remote sensors for mapping mangrove species in Mexico using an NDVI-based classification scheme. Environ. Monit. Assess. 190 (1), 23. doi:10.1007/s10661-017-6399-z
Wang, L., Sousa, W. P., Gong, P., and Biging, G. S. (2004). Comparison of IKONOS and QuickBird images for mapping mangrove species on the Caribbean coast of Panama. Remote Sens. Environ. 91 (3-4), 432–440. doi:10.1016/j.rse.2004.04.005
Yue, W., Xu, J., Tan, W., and Xu, L. (2007). The relationship between land surface temperature and NDVI with remote sensing: application to Shanghai Landsat 7 ETM+ data. Int. J. Remote Sens. 28 (15), 3205–3226. doi:10.1080/01431160500306906
Keywords: NDVI, LST, trend analysis, Kendall’s Tau-b, mangroves
Citation: Al-huqail AA, Islam Z and Al-Harbi HF (2024) Mangroves trend and their impact on surface temperature in Al-Wajh Lagoon: a study aligned with Saudi Arabia's vision 2030. Front. Environ. Sci. 12:1439425. doi: 10.3389/fenvs.2024.1439425
Received: 27 May 2024; Accepted: 01 July 2024;
Published: 23 July 2024.
Edited by:
Sawaid Abbas, University of the Punjab, PakistanReviewed by:
Ravi Kumar Gangwar, Indian Veterinary Research Institute (IVRI), IndiaCopyright © 2024 Al-huqail, Islam and Al-Harbi. This is an open-access article distributed under the terms of the Creative Commons Attribution License (CC BY). The use, distribution or reproduction in other forums is permitted, provided the original author(s) and the copyright owner(s) are credited and that the original publication in this journal is cited, in accordance with accepted academic practice. No use, distribution or reproduction is permitted which does not comply with these terms.
*Correspondence: Asma A. Al-huqail, YWFsaHVxYWlsQGtzdS5lZHUuc2E=; Zubairul Islam, enViYWlydWxAZ21haWwuY29t
Disclaimer: All claims expressed in this article are solely those of the authors and do not necessarily represent those of their affiliated organizations, or those of the publisher, the editors and the reviewers. Any product that may be evaluated in this article or claim that may be made by its manufacturer is not guaranteed or endorsed by the publisher.
Research integrity at Frontiers
Learn more about the work of our research integrity team to safeguard the quality of each article we publish.