 Yitong Wang
 Yongke Yuan
 Xiao Qian
 Yuanying Chi
- School of Economics and Management, Beijing University of Technology, Beijing, China
Introduction: The development of the digital economy has a profound impact on industrial economics. The paper conducted an analysis of how China's digital economy and its structural indicators impact carbon emission intensity. The structural indicators comprise three dimensions: digital manufacturing industries, digital service industries, and industrial digitalization.
Method: This study drew on industrial organization theory and established economic models for empirical test. The paper adopted the measurement framework from the U.S. Bureau of Economic Analysis (BEA) to assess digital economy development through the economic value-added of digital industries. The analysis utilized Input-Output Tables (including extended tables) from 30 Chinese provinces. For empirical modeling, fixed-effects models and Spatial Durbin Models (SDM) were systematically employed.
Results and discussion: The empirical results show that: 1) at the national level, the development of China’s digital economy industries has a suppressive effect on carbon emission intensity; 2) in terms of spatial effects, the development of digital economy has significant carbon spillover effects, but digital industrialization and industrial digitization present different spatial effect results; 3) from the analysis of regional heterogeneity, in the northeast, central and western regions, the direction of influence of digital industrialization and industrial digitalization on carbon emission intensity is consistent; in the eastern region, the development of digital industrial service sector and industrial digitalization has a suppressive effect on carbon emission intensity, while digital industrial manufacturing sector presents a pro-increasing effect; 4) Non-linear relationship analysis shows that the development of the digital industrial manufacturing sector has a “promoting and then inhibiting” effect on carbon emission intensity. Overall, the impact of digital industry development on carbon intensity exhibits a “promoting increase, then suppressing, then promoting increase” trend. In conclusion, the findings suggest that China’s digital economy industry has entered the low-carbon development stage.
1 Introduction
With the rapid development and integration of digital technologies such as 5G, cloud computing, and artificial intelligence into the industrial economy, the growth of the digital economy industry has become a key force driving economic growth and transforming the global competitive landscape. The booming development of the digital economy also presents new opportunities for China to achieve its goals of peaking carbon emissions and achieving carbon neutrality. As a new production factor, data has the characteristics of being clean and low-carbon. According to data released by the National Development and Reform Commission, in 2020, every ton of standard coal consumed can directly contribute 11,000 yuan in output value to data centers, drive 888,000 yuan in value-added for digital industrialization, and indirectly generate a digital market worth 3.605 million yuan through the transformation of various industries. Data centers, accounting for about 2% of China’s total electricity consumption, support a digital economy that accounts for approximately 36.2% of the national GDP, making a significant contribution to achieving the “dual carbon” goals in the era of the digital economy. The “Overall Layout Plan for Building a Digital China” proposes that building a digital China is a crucial engine for promoting China’s unique modernization in the digital age. Only by deeply integrating digital technologies with traditional industries and unleashing the driving force of digitization and intelligence can we truly promote industrial digitalization and low-carbon development, accelerate the realization of digital carbon neutrality, and advance comprehensive green transformation of economic and social development.
The research literature exploring the influence of the digital economy industry on carbon emissions intensity encompasses three distinct viewpoints:
First, some scholars posit that the development of the digital economy industry fosters an increase in carbon emissions intensity. The digital industry itself lacks inherent low-carbon attributes, particularly concerning the high energy consumption involved in establishing digital infrastructure (Zimin and Chanjuan, 2016). Furthermore, the rapid advancement of Information and Communications Technology (ICT) stimulates higher electricity consumption (Salahuddin and Alam, 2015), leading to substantial increments in carbon emissions (Sadorsky, 2012), displaying an exponential growth trend (Anders et al., 2015; Zhou et al., 2019).
Second, in contrast, some scholars argue that the digital economy can inhibit carbon emissions and carbon intensity (Zhang et al., 2023b; Yang et al., 2023) and, to some extent, enhance carbon emission efficiency (Han and Jiang, 2022; Ge et al., 2022; Lyu K. et al., 2023), contributing to the development of a low-carbon economy (Wang et al., 2022). Empirical research shows that the digital economy mainly suppresses carbon emissions through the optimization of industrial structure and the improvement of energy efficiency (Chen et al., 2022; Lyu Y. et al., 2023; Yi et al., 2022; Zhou et al., 2022; Dong et al., 2022). The development of the digital economy stimulates business innovation, thereby restraining carbon emissions (Chen, 2023). Moreover, the evolution of the digital economy industry transforms traditional business models. Reducing investments in physical establishments due to the emergence of online platforms. Consequently, this reduction in fossil energy consumption for infrastructure promotes the greening of energy consumption structures (Horner et al., 2016). The persistent cross-industry technological spillovers contribute to carbon reduction, thereby empowering green development through digital technology (Lei et al., 2023).
Third, there is a viewpoint that the impact of the digital economy industry’s development on carbon emissions is uncertain. The effects of the digital economy on carbon emissions depend on specific economic and environmental contexts (Zhang J. et al., 2022). The impact of the digital economy on carbon emissions exhibits significant heterogeneity in different regions of China (Zhao et al., 2023; Zhang et al., 2022b; Wang et al., 2023). The regional carbon emissions are affected by economic spillover effects, competition effects, and demonstration effects, showing significant spatial agglomeration in neighboring regions (Shao et al., 2022). On the other hand, some studies suggest that due to the network effects of the digital economy, the relationship between digital economy development and carbon emissions may exhibit nonlinear characteristics (Li et al., 2021; Yang et al., 2023). Based on empirical evidence from Chinese data, the impact of the digital economy on carbon emissions follows an inverted U-shaped relationship (Li and Wang, 2022; Lei et al., 2023; Wang et al., 2023).
In comparison to previous research literature, this article may contribute in the following ways:
First, research perspective: The study adopts a comprehensive approach by analyzing the impact of digital economy industry development on carbon emission intensity from both the aspects of digital industrialization and industrial digitalization. It utilizes structured variables related to the digital economy industry to specifically analyze. Second, theoretical analysis: Based on the industrial organization theory in industrial economics, the article explores the differences in market structures and industrial behaviors between digital industrialization and industrial digitalization. Third, measurement method: The research methodology draws inspiration from the United States Bureau of Economic Analysis (BEA) calculation methods. It can objectively measure the scale of digital economy development and its contribution to the overall economy. Forth, multidimensional analysis: The article delves into the impact from various dimensions, including direct effects, spatial effects, regional heterogeneity, and non-linear relationships. This study deepens the understanding of the relationship between China’s digital economy industry and low-carbon development, providing theoretical guidance for achieving both carbon peaking and carbon neutrality while promoting high-quality economic development in China.
2 Structural analysis of the digital economy industry and theoretical assumptions
2.1 The theory of industrial organization in the context of the digital economy
In the study of fair competition in markets, traditional industrial organization theory has evolved into three major schools of thought. Firstly, the Harvard School is centered around the “Structure-Conduct-Performance” (SCP) analytical framework. It emphasizes the identification of monopolistic enterprises by assessing industry concentration and argues that their pursuit of monopoly profits is detrimental to efficient allocation of market resources and the enhancement of social welfare. In contrast, the Chicago School challenges the views of the Harvard School. It argues that firm size expansion cannot simply be equated with an increase in monopoly power. The Chicago School believes that firm size expansion and increased concentration may be driven by technological innovation or economies of scale, rather than solely for acquiring monopoly profits. Consequently, the Chicago School advocates for using contestable market theory as an alternative to the SCP paradigm and argues for establishing more reasonable criteria in determining monopoly. This approach aims to avoid a blanket application of antitrust policies against large firms. The third school of thought is the New Industrial Organization (NIO) theory. Building upon previous research, NIO theory delves deeper into the relationship between firm size and transaction costs. It points out that the level of transaction costs is influenced by the uncertainty and complexity of transaction activities, which often stem from the behavior of traders. Consequently, NIO theory emphasizes the in-depth study of the behavioral attributes of traders. Furthermore, NIO theory advocates examining organizational structures and principal-agent problems from within the firm, and believes that advancements in digital technology provide robust support for these endeavors. For instance, the utilization of blockchain technology to prevent data falsification and the interconnection of data to reduce information asymmetry are highlighted as key areas for improvement.
Based on the industrial cycle theory represented by Li et al. (2021) put forward a driving mechanism for the industrial life cycle under digital economy circumstances, concentrating on the analysis of firm entry and exit (entry barriers), scale, technology, and changes in consumer demand. As shown in Figure 1, the key characteristics can be generalized into four main aspects: Firstly, there is a rapid expansion in industrial agglomeration and scale. This is because digital infrastructure reduces market entry barriers. Under the influence of network externalities, the agglomeration and scale of digital economy industries can expand significantly in a short period. Secondly, an open and collaborative competitive relationship is formed among industrial organizations. This promotes frequent industrial integration and cross-sectoral development. Thirdly, the pace of industrial transformation cycles accelerates, with faster iterations. Fourthly, industrial organizations tend to evolve towards modularity, adopting flexible organizational structures to adapt to the iterative changes in industrial cycles.
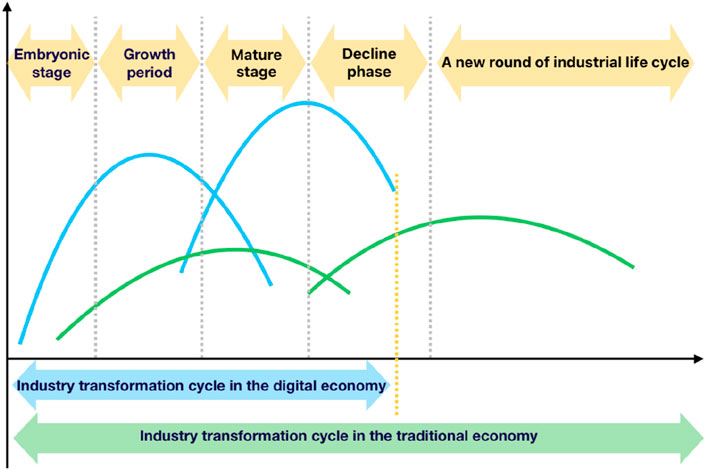
Figure 1. Stage path of industrial organization change in digital economy.
The development of the digital economy has remolded the macroeconomic operational mechanisms, and the emergence of the internet industry has brought challenges to industrial economics. The internet industry shows relatively low entry barriers, characteristic of perfect competition, yet high market concentration also exhibits features of oligopoly. Furthermore, platform enterprises have natural monopoly characteristics such as economies of scale, economies of scope, and sunk costs. These giant enterprises, including internet platform companies that nearly monopolize niche markets, are under intense antitrust pressure, yet they have not been compelled by the government to be broken up to change market structures. How do we understand the organizational forms of platform enterprises and comprehend monopoly and competition within the platform economy? Have they truly excluded fair competition and formed monopolies? Achieving equality among enterprises remains a goal pursued by industrial organization theory, and industrial organization policies in the digital economy must carefully handle the relationship between antitrust and innovation. Preventing unnecessary suppression of innovation by antitrust measures requires discriminating analysis of market behavior and performance in the digital sector.
2.2 Theoretical analysis and research hypotheses
With the development of the digital economy, an increasing number of scholars have started to focus on the relationship between the digital economy and carbon emissions. This is mainly manifested in the impact of digital technology, internet development, and the digital economy on carbon emissions. The rapid development of digital technology and its industries has led to an increase in electricity consumption, thereby driving up carbon emissions. However, some scholars have a different opinion, arguing that the development of digital technology is beneficial to reducing greenhouse gas emissions, thereby improving environmental quality. For instance, increasing internet penetration and investing in information and communication technology infrastructure can significantly reduce carbon emissions.
According to the “Statistical Classification of the Digital Economy and its Core Industries (2021)” and relevant literature, the digital economy encompasses two categories: the industrialization of digitization and the digitization of industries. These two components exhibit disparate industrial structures. For instance, the industrialization of digitization is predominantly represented by major telecommunications conglomerates in China, thereby exhibiting a high degree of concentration and distinct oligopolistic characteristics. Conversely, the digitization of industries involves numerous sectors with limited interconnections, resulting in lower industry concentration and exhibiting the characteristics of perfect competition. The organization of the digital industry in China is characterized by complexity. It encompasses elements of absolute monopoly in certain industries, where some entities control essential facilities, as well as oligopolistic competition with a few dominant players. Additionally, there is a large number of small and micro enterprises that can be considered to exhibit characteristics of perfect competition. In the digitalized part of the industry, monopolistic tendencies are more pronounced, while competition plays a significant role in industrial digitalization. Even within the realm of monopolies, the digital industry showcases a variety of organizational structures. Traditional monopolies, such as China Unicom, coexist with new forms of monopolistic organizations, such as platform-based entities.
Taking carbon emissions as an example, as shown in Figure 2. In regions with lower per capita GDP, the market economy is not yet sufficiently developed, and the price mechanism under perfect competition is not well-established. Consequently, efficiency in such areas is evidently lower than that under monopolistic conditions. Therefore, digitization of industries in these regions may increase carbon emissions, while digital industries themselves have the potential to reduce carbon emissions. On the other hand, considering the development of digital economy technologies. At this stage, digital economic technologies are in their early phase, requiring significant resource allocation for research and development. And integration with industries has yet to be realized. Thus both digital industrialization and industry digitization may contribute to increased carbon emissions.
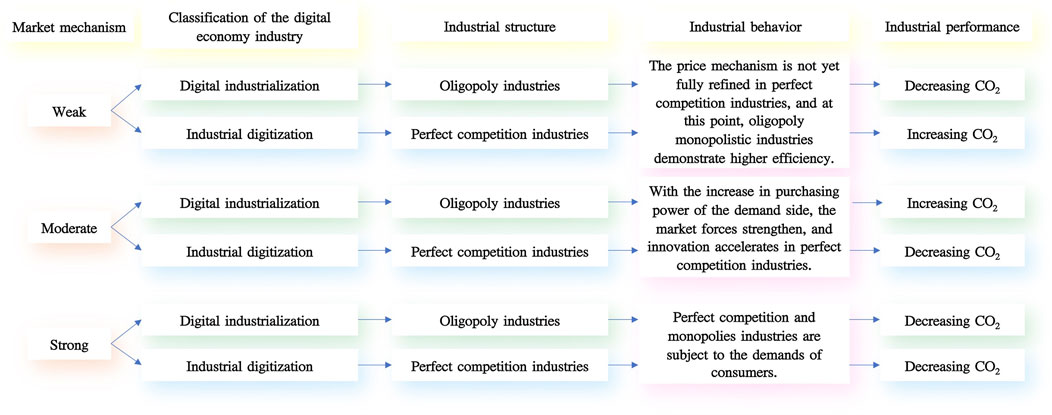
Figure 2. In the case of carbon emissions “Structure-Conduct-Performance” analytical framework.
As per capita GDP increases, the purchasing power of demand-side increases, leading to an enhanced role in the market. Under complete competition industry innovation accelerates, whereas monopolistic industry innovation slows down. In this scenario, digitization of industries in the region may reduce carbon emissions, but digital industries may increase carbon emissions. Additionally, due to limited progress in digital economy technology development, and the early stage of integration between digital economic technologies and various industries, industry digitization in the region may increase carbon emissions. With further improvement in per capita GDP and increased purchasing power of demand-side, both complete competition and monopolistic industries are constrained by demand. Consequently, digitization of industries and digital industries will decrease carbon emissions. Furthermore, the extensive implementation of data empowerment within industries promotes quality improvement and efficiency enhancement, as well as further refinement of industry division and collaboration, leading the region to enter a low-carbon development stage. From a policy perspective based on this theory, local governments should initially assess the measurement of per capita GDP in their regions to establish the conditions of the two distinct industries. Subsequently, different industrial policies should be implemented to achieve a win-win situation for economic growth and carbon reduction. For the digitization of industries, as it pertains to monopolistic industries, administrative and judicial measures are necessary to promote industry development. As for industry digitization, which falls under perfect competition, further market improvements should be pursued to leverage the invisible hand. Based on the aforementioned analysis, the first hypothesis of this paper is proposed.
Hypothesis 1. The development of digitization and digitalization in the digital economy industry has varying effects on carbon emission intensity. While the development of the digital economy industry has both promoting and inhibiting effects on carbon emission intensity, overall, its impact is positive.
The Kuznets Curve (EKC) theory demonstrates an inverted U-shaped relationship between environmental pollution and economic development. It suggests that environmental pollution initially increases with economic development until reaching the inflection point of the inverted U-shaped curve. Subsequently, environmental pollution decreases as further economic development occurs. In the actual process of development, during the early stages of digital economy industry development, substantial resources are invested in constructing the digital economy infrastructure, including the manufacturing of electronic equipment, power distribution equipment, and the establishment of large data centers. These activities intensify energy consumption and result in significant carbon dioxide emissions. However, as the digital economy progresses to a certain stage of development and the infrastructure construction becomes more comprehensive, advancements in digital technology significantly enhance production efficiency and optimize production methods. As a result, carbon emission intensity decreases with the development of the digital economy industry. Based on this analysis, the second hypothesis of this paper is proposed.
Hypothesis 2. With the advancement of economic development, the impact of digital economy industry development on carbon emission intensity follows the pattern of the EKC, exhibiting non-linear characteristics.
China possesses vast territorial expanse, and there are significant differences in environmental resource endowments and economic development backgrounds among different regions. Additionally, the development of the digital economy industry in each region exhibits distinct characteristics and varying degrees of advancement. For instance, the eastern region benefits from abundant human resources and hosts a large number of highly skilled technology professionals. It leads the development trends of digital technologies such as the Internet, 5G, and big data in China. The western region boasts abundant natural resources and a sparse population, making it suitable for the construction of large-scale data processing centers and other digital economy infrastructure. Taking into account the characteristics of both regions, China has implemented the “East Numerical, West Computational” project to achieve coordinated and balanced development of the national digital economy. Therefore, this paper divides China into four major economic regions: Northeast, East, Central, and Western regions. Analyzing the impact of the digital economy industry on carbon emission intensity in different regions.
Considering the spatial effects between regions, on one hand, digital elements themselves possess characteristics of high integration, strong penetration, and rapid dissemination. They facilitate the free flow of production factors between regions, optimize the production factor structure in neighboring regions, and achieve synergistic regional economic development, thereby reducing carbon emission intensity. In the consumer goods market, ICT technologies not only reduce the prices of products and services but also guide neighboring markets to reduce demand for energy-consuming products through price transmission mechanisms. On the other hand, digital technologies enhance information exchange between enterprises, improve the efficiency of the industrial chain, and drive regional industrial upgrades. However, high-polluting and energy-intensive enterprises may relocate to neighboring regions, resulting in carbon leakage effects. Based on this, the third hypothesis is proposed.
Hypothesis 3. The impact of the digital economy industry on carbon emission intensity exhibits heterogeneity across different regions. The development of the digital economy industry has a restraining effect on carbon emission intensity in the local region and spatial spillover effects on carbon emission intensity in neighboring regions.
3 Empirical analysis of the impact of digital economy industry development and its structured indicators on carbon emission intensity
3.1 Variable selection
3.1.1 Dependent variable
The dependent variable is carbon intensity (CI), denoting CO2 emissions in relation to the unit of GDP. Carbon emission intensity is a measurement indicator of carbon emission levels proposed from an efficiency perspective. The explained variable in this paper refers to the research conducted by Xie (2022) and Yi et al. (2022). There are various methods for carbon emission accounting, and three primary methods are used for accounting carbon emissions based on territorial boundaries: the emission factor method, the material balance method, and the actual measurement method. The emission factor method has a wide range of applications and high authority. It has developed relatively mature accounting formulas and databases. The most representative is the “National Greenhouse Gas Inventories Guidelines” developed by the Intergovernmental Panel on Climate Change (IPCC). It also enjoys high international recognition. Thus, we employ the sectoral emissions accounting methodology of the Intergovernmental Panel on Climate Change (IPCC) to calculate carbon emissions data for 30 provinces and municipalities in China from 2012 to 2017.
Figure 3 presents the spatial distribution characteristics of carbon intensity in China for the years 2012 and 2017. An analysis of Figure 3 reveals a distinctive “west high, east low” pattern in China’s carbon intensity landscape. This suggests a discernible nexus between carbon intensity and the trajectory of regional scientific and technological advancement. Regions marked by robust economic and technological progress, exemplified by locales such as Beijing and Guangdong, tend to exhibit a relatively moderated carbon emissions intensity. The comparative analysis between 2012 and 2017 further highlights the substantial escalation of carbon intensity in the northeastern region, particularly within Shanxi province. This trend accentuates the interconnectedness of carbon intensity with the energy consumption and industrial structure of a region.
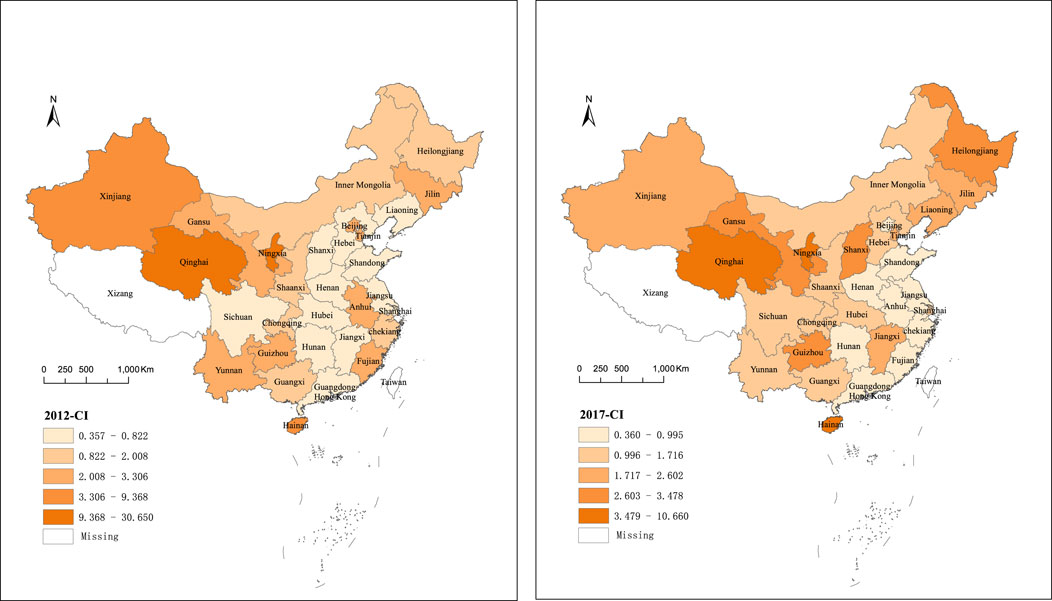
Figure 3. Spatial distribution of China’s carbon emissions intensity in 2012 and 2017.
3.1.2 Key explanatory variables
The key explanatory variables of this paper encompass three structured factors concerning the developmental of the digital economy: 1) Digital industrial manufacturing sector: Communication equipment, computers, and other electronic devices. 2) Digital industrial services sector: Information transmission, software, and information technology services. 3) Digitalization of industry Development Level (DDL). The first two variables respond to the level of digital industrialization development (IDE), and the third variable signify the level of digital development of industries. Regarding the measurement of digital economy, there are mainly research methods such as added value measurement, compilation of relevant indices, and the construction of satellite accounts. Among these, the construction of satellite accounts for the digital economy can effectively depict the engagement of diverse sectors in the national economy in activities characteristic of the digital economy, enabling a more precise assessment of the magnitude of digital economy development and its contribution to the overall economy. However, due to constraints in statistical data, the compilation of macro-level digital economy satellite accounts remains challenging. Theoretical and practical research on digital economy satellite accounts are currently undergoing continual refinement. The OECD (2018) suggests that the value-added generated by digital economy industries can presently serve as an indicator of digital economy scale, thereby laying the groundwork for future satellite account preparation. Consequently, this paper elects to measure economic value added of the Digital Industrial Manufacturing Sector (Sector 1), Digital Industrial Services Sector (Sector 2), and Industrial Digitalization (DDL) to comprehensively reflect the development stage of the regional digital economy industry.
According to the “Statistical Classification of Digital Economy and Its Core Industries (2021),” this classification determines the industrial scope of digital economy as follows: 01 digital product manufacturing industry, 02 digital product service industry, 03 digital technology application industry, 04 digital factor driving industry and 05 digital efficiency improvement industry 5 categories. The 01-04 categories corresponding to the core industries of the digital economy, that is, the digital industrialization part. These industries serve as the bedrock for digital economy development. The digital industrialization includes digital industry manufacturing sector and digital industry service sector. Within the input-output table, the digital industry comprises two sectors: communication equipment, computers, and other electronic equipment (Sector1), and information transmission, software, and information technology services (Sector2). The 05th category is the industrial digitalization part, which refers to the enhanced output and efficiency resulting from the application of digital technology and data resources to traditional industries, thus representing the integration of digital technology with the real economy.The statistical classification of digital economy and its core industries corresponds to the input-output table industry sector, which is shown in Table 1. Digital industrialization corresponds to the input-output table industry sector “Communication equipment, computers and other electronic devices” and “Information transmission, software and information technology services” The economic value of Industrial digitalization obtained through the application of digital technology in the production of the remaining 40 sectors.
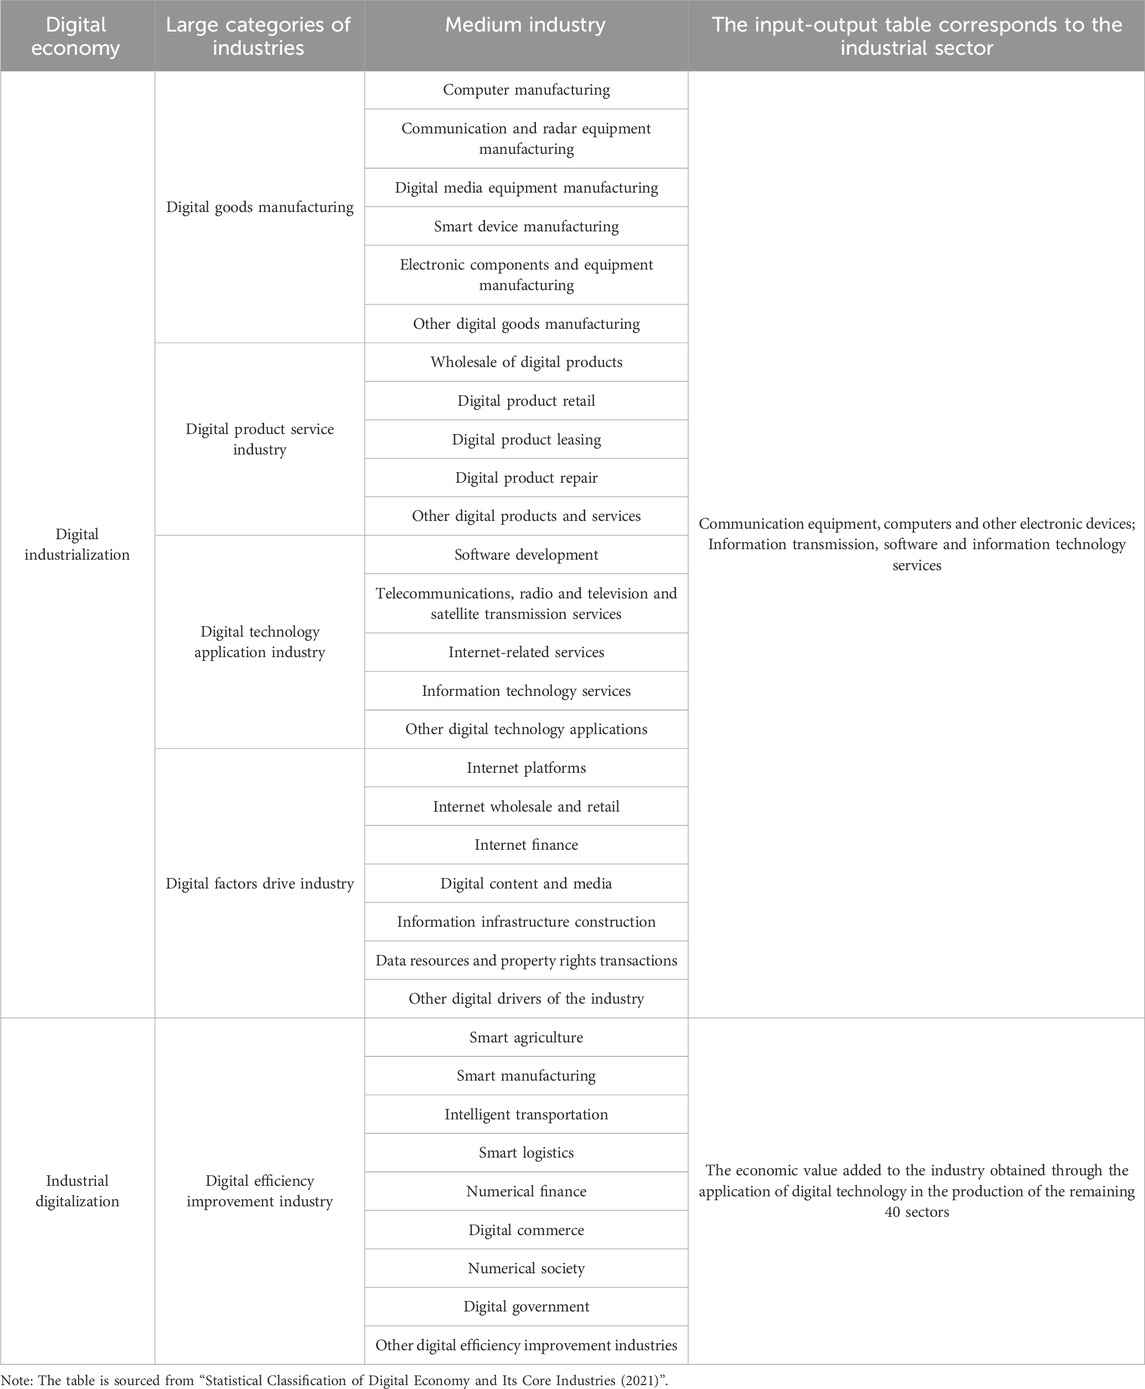
Table 1. Digital economy and its core industries.
Since detailed data regarding industries related to the digital economy is currently unavailable, referring to the measurement method. The measurement of added value in the industrial digital economy necessitates the utilization of coefficient-based tools.
The digital economy adjustment factor is introduced to account for industrial sectors that are only partially classified under the digital economy category. For instance, intelligent railway transportation within the railway transportation sector, digital retail within the retail sector, and Internet insurance within the insurance sector. Therefore, the economic added value of the industrial sector related to the digital economy cannot be directly summed up. The digital economy adjustment coefficient
Industrial value-added rate. The industrial value-added rate
Research by the Bureau of Economic Analysis (BEA) (Barefoot et al., 2018; BEA, 2019) is a representative study of the digital economy calculate using the added value of the digital economy. The Australian Bureau of Statistics (ABS, 2019) also adopts the measurement method employed by BEA to measure the digital economy in their country, indicating the methodological relevance of BEA’s approach. Therefore, referring to the calculation method of BEA, it is assumed that the ratio of intermediate consumption of the digital economy to the total output of the digital economy is equal to the proportion of intermediate consumption and total output of the corresponding industry. The added value of the digital economy of each industrial sector
Equation 4 can be obtained by Equations 2, 3.
From this analysis, it is concluded that the adjustment coefficient of the digital economy is equal to the ratio of the added value of the digital economy in the industrial sector
Since the Input-Output Table is not continuously updated, Due to the lack of continuous updates in the Input-Output Table, this article utilizes the data from the Input-Output Table (including the extended table) of 30 provinces for the years 2012, 2015, and 2017 to calculate the data for 2013, 2014, and 2016. According to the standard of “National Economic Industry Classification” (GB/T 4754-2017), the digitization industry sector primarily consists of two departments. The digital industry manufacturing sector (Sector1), falls under the C-manufacturing industry, which belongs to the secondary industry. And the digital industry service sector (Sector2) falls under the I-information transmission, software, and information technology service industry, which belongs to the tertiary industry. Referring to the research ideas of Yang and Hu (2022), it is assumed that China’s industrial structure coefficients remain unchanged over a relatively short period of time. Based on this, we can calculate the economic value added of the digital economy’s digitization in each province for the years 2013, 2014, and 2016. Industrial digitalization permeates all sectors of the national economy. Therefore, when calculating the added value of the digital economy industry, it is assumed that the ratio of the added value of the industrial digital economy to the total added value of the economy remains constant over a short period of time. Using this assumption, the digital economy added value of each province’s digital economy industry for the years 2013, 2014, and 2016 is calculated.
Figures 4, 5 respectively illustrate the spatial distribution characteristics of industrial digitization and digital industrialization economic value-added in China for the years 2012 and 2017. The development of industrial digitalization mirrors the development of digital industrialization, with the eastern regions taking a prominent lead, the central regions displaying emerging trends, and both the eastern and western regions generally lagging in development.
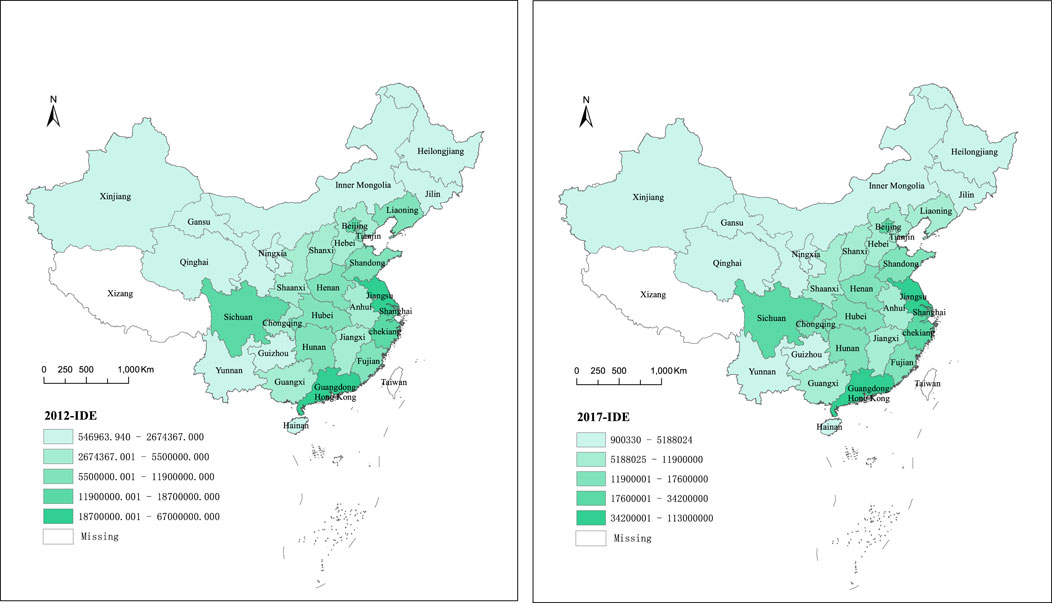
Figure 4. Spatial distribution of China’s development level of industrial digitalization in 2012 and 2017.
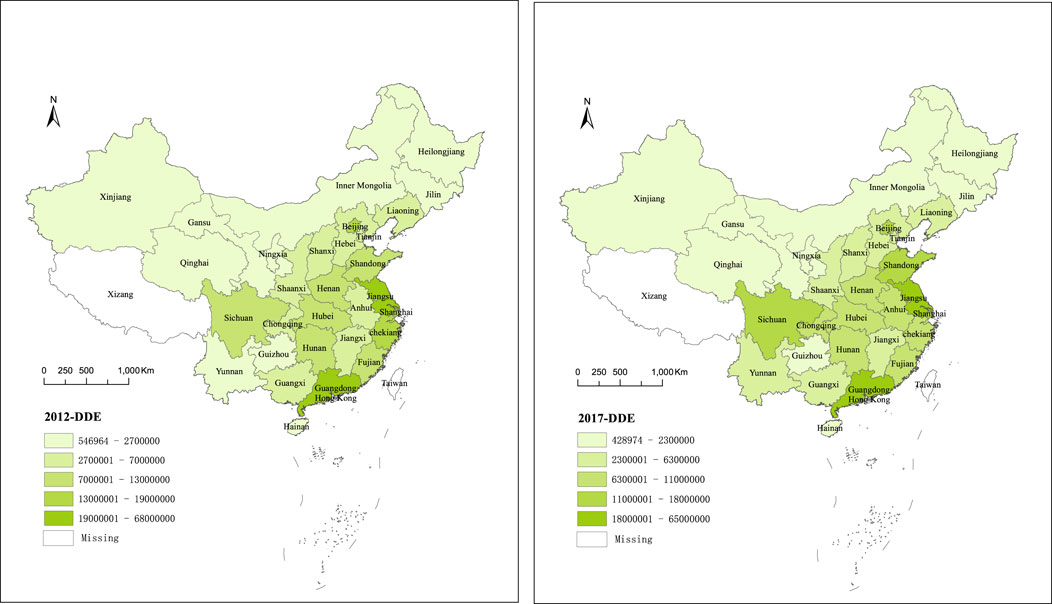
Figure 5. Spatial distribution of China’s development level of digital industrialization in 2012 and 2017.
3.1.3 Control variables
According to previous studies (Xie, 2022) and theoretical analysis, this paper selects the following control variables: 1) Economic development status
3.2 Data sources
The sample data in this paper is the China provincial panel data, including 30 provinces (excluding Hong Kong, Macao, Taiwan and Tibet), covering the period from 2012 to 2017. The dependent variable data were obtained from the China Carbon Emission Accounting Database (CEADs). The key explanatory variables are calculated based on the data from the Input-Output Table (including the extended table) of 30 provinces for the years 2012, 2015, and 2017. The specific calculation method has been explained in the previous text. As for the control variables, they mainly originate from statistics released by the National Bureau of Statistics. The investment amount dedicated to industrial pollution control is obtained from “China Environment Statistical Yearbook”.
The descriptive statistics of the main variables in this paper are shown in Table 2.
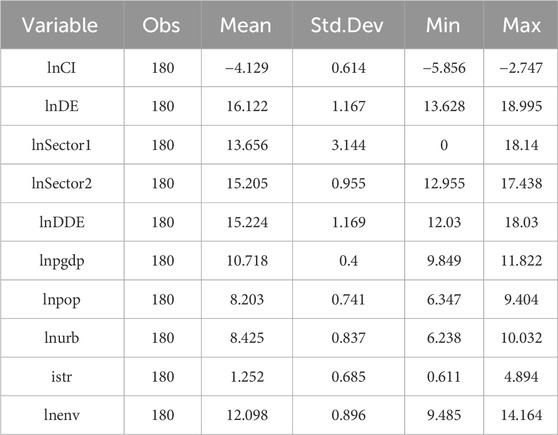
Table 2. Descriptive statistics.
3.3 Baseline regression model testing
According to the above theoretical assumptions, the following econometric model is constructed for empirical analysis:
The variables are transformed into logarithms to address potential heteroscedasticity. In the model, the subscripts “i” and “t” represent the province and year, respectively.
In order to determine the optimal form of the model, several tests were conducted. Firstly, an F-test was performed, and the results strongly rejected the null hypothesis, indicating the presence of individual effects. This led to the application of the Least squares dummy variable (LSDV) method, which demonstrated that the fixed-effect model outperformed the mixed regression model. Secondly, the LM test was conducted to examine individual random effects, and the results indicated that the random effects model performed better than the mixed regression model. Finally, the Hausman test was conducted to validate the results, confirming that the fixed-effect model was preferable to the random-effects model. Considering the vast territory of China and the significant variations in natural resource endowment, climate environment, and economic development among different provinces, as well as the recent focus on global climate and environmental issues, China has implemented a series of green and low-carbon policies to reduce carbon emissions. Therefore, we adopt the dual fixed-effect model, incorporating fixed province and time effects, as the baseline regression model. The test results of the baseline regression model, constructed based on Equations 5–8, are presented in Table 3.
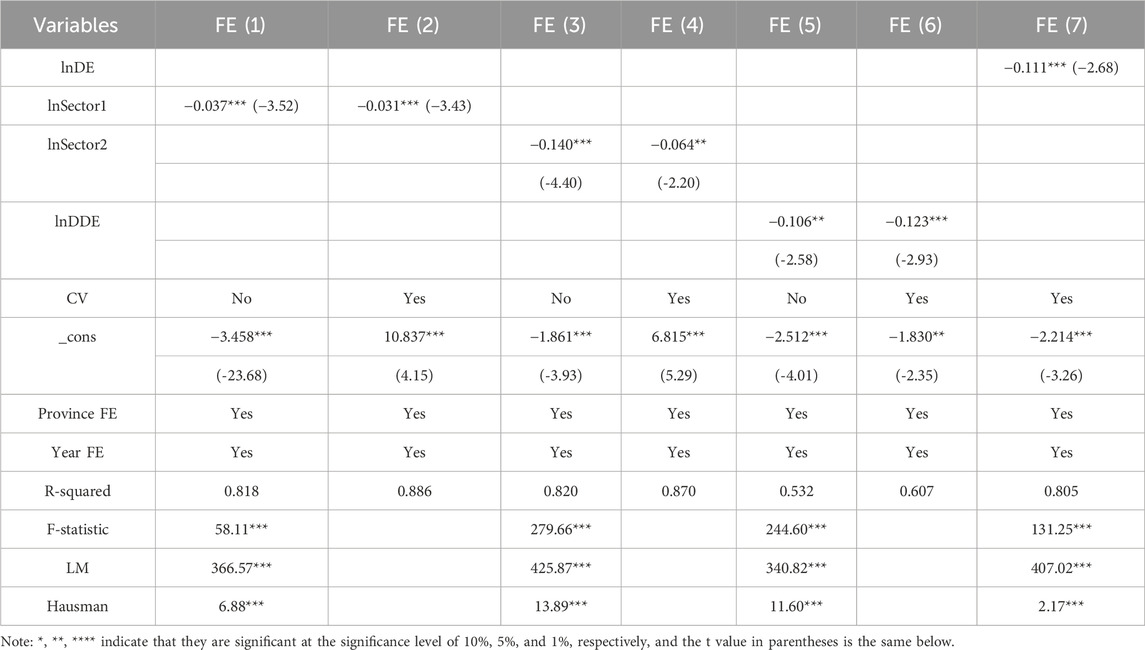
Table 3. Test results of benchmark regression model.
From the perspective of digital industrialization development, model FE (1), FE (2), FE (3) and FE (4) demonstrate that the development of provincial digital industrialization in China plays a role in curbing carbon intensity and supports the transition to a green and low-carbon economic structure. Regarding the impact of industrial digitalization on carbon intensity, model FE (5) and model FE (6) suggest that the development of industrial digitalization also promotes a decrease in carbon emission intensity. Specifically, every 1% increase in the economic value added of industrial digitalization leads to approximately a 0.123% reduction in carbon intensity. Model FE (7) indicates that, overall, the development of China’s digital economy and industry can help mitigate carbon emission intensity. The baseline regression results based on the sample data from 30 provinces in China demonstrate that both digital industrialization and industrial digitalization contribute to the suppression of regional carbon emission intensity to a certain extent.
3.4 Robustness test
3.4.1 Replace the explanatory variable
CO2 emissions primarily result from the combustion of different fossil fuels. Therefore, the explanatory variables will be replaced with carbon emission data calculated using the carbon emission factor method proposed by the United Nations Intergovernmental Panel on Climate Change (IPCC). The calculation is shown in Equation 9:
In this context,

Table 4. Carbon emission coefficients of seven fossil energy sources.
After replacing the dependent variable and re-estimating the results, the core explanatory variable coefficients show the same positive or negative sign as in the baseline regression model. Additionally, the significance level remains consistent. These findings indicate that the baseline regression model, estimated using carbon emission indicators from the China Carbon Accounting Database (CEADs) for each province, is robust. The results also demonstrate that the development of digital industrialization and industrial digitalization in the national sample data has a significant inhibitory effect on carbon emissions.
3.4.2 Metering method substitution
In order to avoid the autoregression problem of perturbation terms in the panel data model, this paper replaces the original measurement method and uses the first-order lagged model for GMM estimation and analysis, and the robustness results show that the coefficients of the core explanatory variables of GMM are significant, and the positive and negative signs are consistent with the benchmark regression results, indicating that the research results in this paper are reliable.
To address the issue of autoregression in the perturbation terms of the panel data model, this study adopts a modified approach by employing the first-order lagged model for GMM estimation and analysis. The robustness results confirm the significance of the coefficients of the core explanatory variables in the GMM estimation. Furthermore, the positive and negative signs of these coefficients align with the findings from the benchmark regression analysis. This consistency in the results validates the reliability of the research findings presented in this paper.
3.5 Nonlinear relationship analysis
To examine the nonlinear relationship, the study introduces multiple terms of the core explanatory variable in the nonlinear relationship test. In this paper, the nonlinear relationship between the three structured variables of the development of the digital economy industry and the carbon emission intensity is examined. Model N (1) includes the quadratic term of the variable lnSector1. Model N (2) incorporates the quadratic term of the variable lnSector2. Lastly, model N (3) includes both the cubic and quadratic terms of the variable lnDDE.
The test results in Table 5 indicate that the added quadratic coefficients are significant. Both model N (1) and model N (2) have negative quadratic coefficients, while the primary square terms have positive coefficients. These findings suggest a potential “inverted U-shaped” relationship between the development of the digital industry manufacturing sector and the development of the digital industry service sector with carbon intensity. Additionally, a three-dimensional relationship may exist between the level of industrial digital development and carbon intensity. To avoid false positives in the nonlinear relationship test, the method proposed is employed. This involves comparing the extreme points of the model with the actual observation points and determining whether the sample value interval encompasses the model extreme points to verify the nonlinear relationship between the variables.
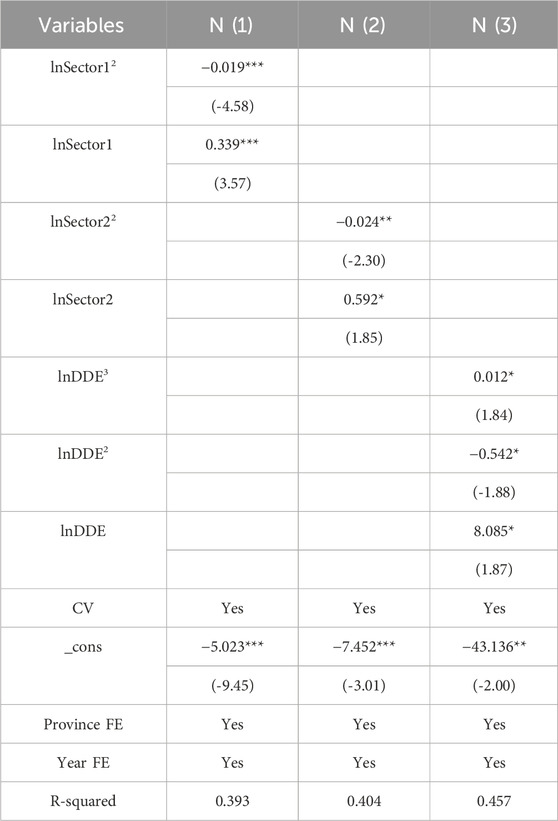
Table 5. Results of nonlinear relationship test.
In the digital industrialization part, the extreme value point of the fitting model for the relationship between the development of the digital industry manufacturing sector and carbon intensity is
In accordance with the analysis of the Environmental Kuznets Curve (EKC) theory, during the early stages of economic development, the increase in economic added value of the digital industry manufacturing sector promotes a rise in regional carbon emission intensity. However, as technological advancements occur and a fixed threshold is crossed, further increases in the economic added value of the digital industry manufacturing sector begin to restrain carbon emissions. Overall, the development of the digital industry manufacturing sector exhibits a “first promote, then inhibit” effect on carbon emission intensity. The relationship between the digital industry service sector and carbon intensity aligns with the functional relationship characteristics on the right side of the EKC inflection point, indicating that China’s digital industry service sector has entered a stage of carbon emission reduction during the sample period.
In the industrial digitalization part, the extreme points of the fitting model are
Comparing the results with the benchmark model regression, it is observed that the impact of digital industrialization on carbon emission intensity is greater than the impact of industrial digitalization. Ultimately, the development of the digital economy industry demonstrates a significant inhibitory effect on carbon emissions.
4 The impact of interregional digital economy industry development and its structured indicators on carbon emission intensity
4.1 Spatial effects analysis
Considering the spatial correlation between provinces, a spatial econometric model is constructed to investigate the relationship between the development of the digital economy industry and regional carbon emission intensity. Two spatial weight matrices, namely, W1 and W2, are created for this purpose. The W1 matrix is a 0–1 spatial adjacency matrix where adjacent provinces are assigned a value of 1, while nonadjacent provinces are assigned a value of 0. The W2 matrix is a spatial geo-economic distance nested weight matrix. The formula for W2 is shown in Equation 10, where the element in W0 is the reciprocal of the straight-line distance between the two provincial capitals. Yi represents the average GDP of province i in a given year, and Y represents the average annual GDP of all provinces in the country. n represents the total number of provinces (n = 30).
First, the Z-value test and the global Moran’s I index are used to test the spatial autocorrelation of carbon intensity. The global Moran’s I index is calculated as shown in Equation 8,
To examine the spatial autocorrelation of carbon intensity, the Z-value test and the global Moran’s I index are employed. The global Moran’s I index is calculated as shown in Equation 11.
Table 6 presents the calculation results of the global Moran’s I index using the two weight matrices. The results indicate the presence of spatial effects in carbon intensity, demonstrating a significant positive spatial correlation in carbon emission intensity.
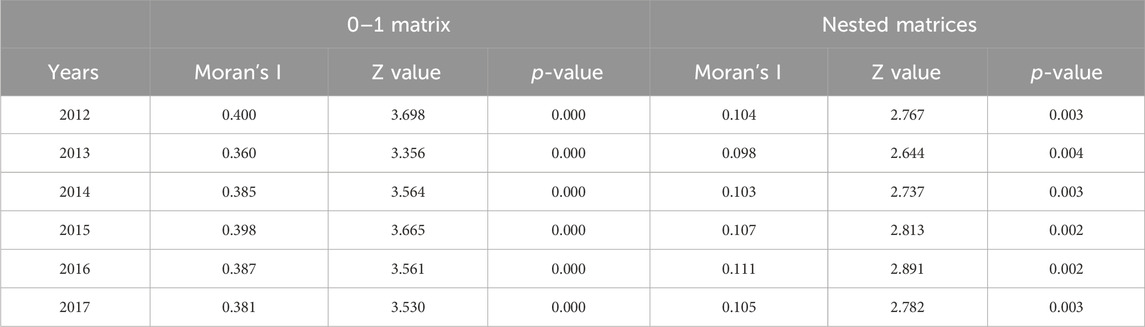
Table 6. Global Moran’s I index calculation results under two weight matrices.
The optimal spatial econometric model is selected based on the LM test, LR test, and Wald test. The Hausman test is then conducted to determine whether to include the fixed-effect model. After considering the results of these tests, this paper adopts the spatial Durbin model (SDM) with a fixed time effect. The specific form of the model is as follows:
Equations 13–16 represent the spatial effect analysis of the impact of digital economy industry development and its structural indicators on carbon emission intensity. In these equations,
Based on the spatial effect test results presented in Table 7, 8, the following conclusions can be drawn: First, the direct impact of the development of digital industrialization and industrial digitalization on regional carbon intensity is consistent with the direct impact of the overall development of the digital economy industry on regional carbon intensity. Both have inhibitory effects. Additionally, the digital industry service sector shows the strongest inhibitory effect on carbon intensity. This can be attributed to the high technical level required by the digital service sector, which improves production efficiency and reduces carbon emissions per unit of output. Second, the impact of the development of digital industrialization and industry digitization in neighboring provinces on the carbon emission intensity of a specific province exhibits variations. However, overall, the development of the digital economy industry in neighboring provinces increases the carbon emission intensity of the province. The spatial test results show that a significant spillover effect of the development of the digital economy on carbon emission intensity. The indirect effect of the development of the digital industry service sector in neighboring provinces on carbon intensity is not robust, but the digital industry manufacturing sector and industrial digital development have significant indirect effects on carbon emission intensity. Consequently, the development of the digital economy industry in neighboring provinces ultimately increases the carbon emission intensity of the province. Third, due to the inconsistent effects of the three structural variables of the digital economy industry on carbon emission intensity, the overall impact of the development of the digital economy industry on carbon intensity is not robust. The overall effect of industrial digitalization on carbon intensity requires further analysis. The carbon spillover effect of digital economic industry digital development in neighboring provinces has a more pronounced impact on the carbon emission intensity of the province, making it difficult to observe a significant reduction in carbon emissions solely attributed to industrial digitalization within the province. This suggests that there is potential for further integration of digital technology with various industries in China to achieve greater carbon emission reduction.
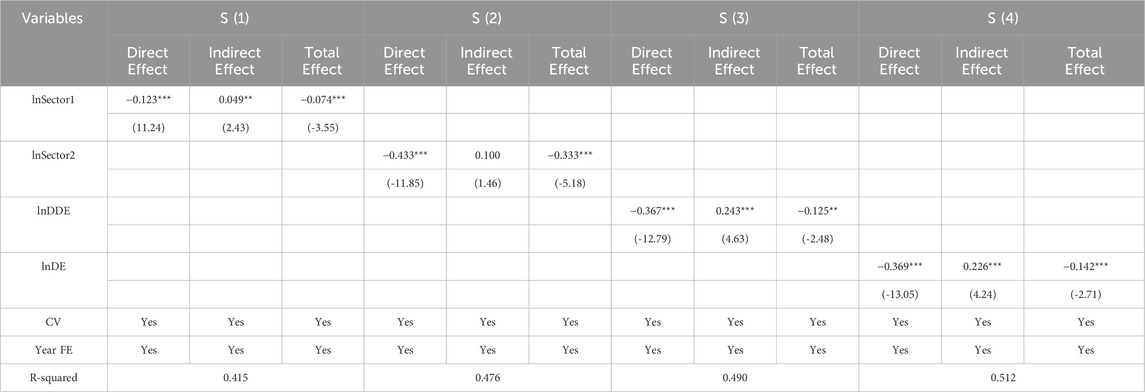
Table 7. Spatial effect test results under 0–1 spatial adjacency matrix.
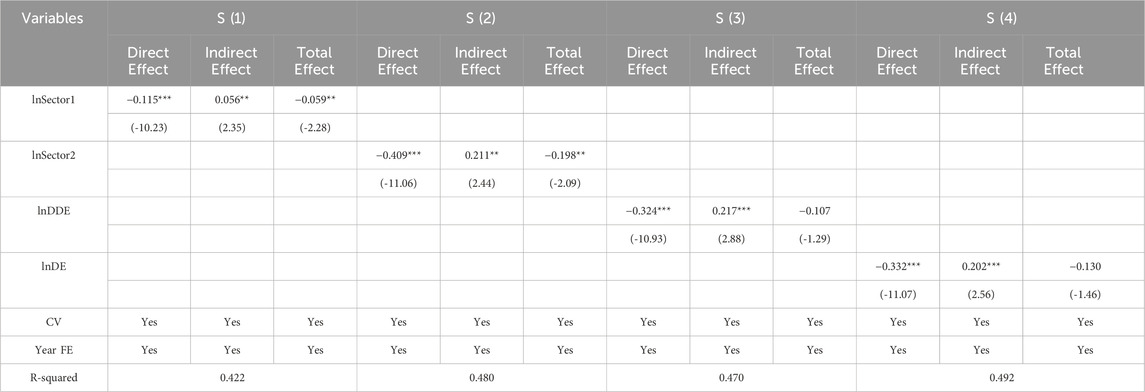
Table 8. Spatial effect test results under weights matrix nested for spatial geographic economic distances.
4.2 Analysis of heterogeneity in the northeast, east, central and western regions
China has a vast land area, and there are great differences in natural resource endowment, climate environment, economic development and other aspects between regions, so China is divided into four major economic regions - northeast, east, central and western regions. Based on the benchmark regression model, the heterogeneity analysis of the four regions of China was carried out, and the impact of the development of digital economy industries on carbon emission intensity in different regions was analyzed according to the economic and environmental characteristics of different regions. Table 9 displays the model estimation outcomes for the northeastern and eastern regions, while Table 10 presents the model estimation results for the central and western regions.
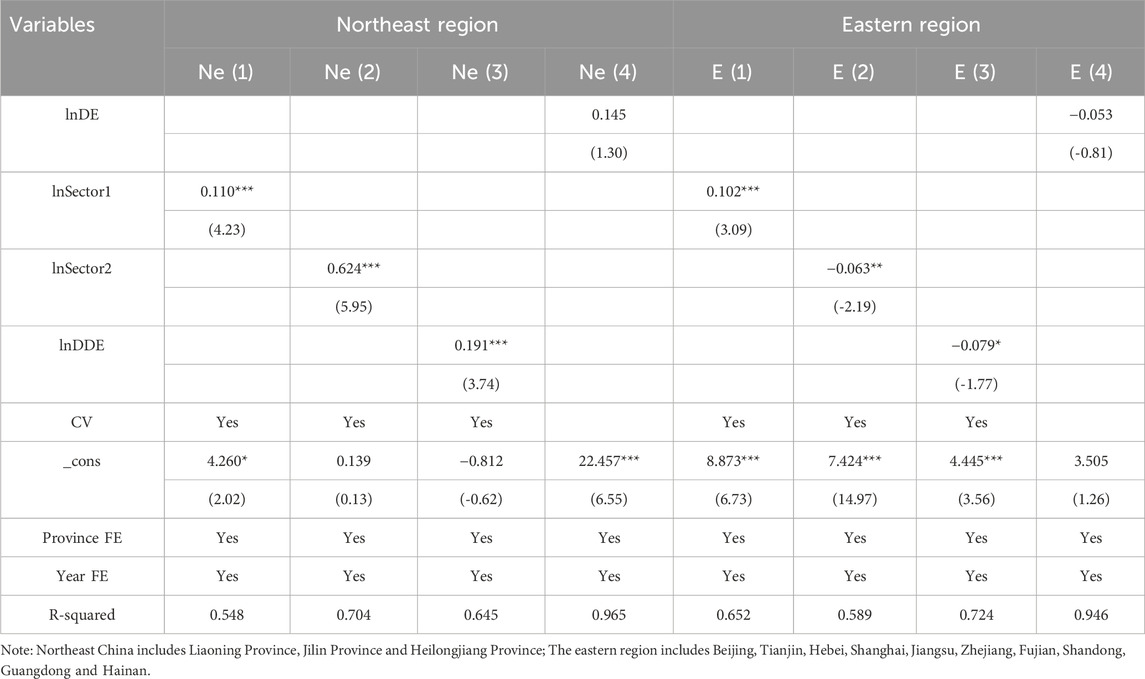
Table 9. Model estimation results in the northeast and eastern regions.

Table 10. Model estimation results in the central and western regions.
For the northeast region, digital industrialization and industrial digitalization both affect the regional carbon emission intensity at a significant level of 1%, and both play a promoting role. Compared with economically developed regions such as the east, the economic and technological development of the northeast region is relatively backward, the infrastructure construction of the digital economy is relatively lagging behind, and relevant policy support needs to be improved, which is still in the early stage of the development of the digital economy. At this stage, the integration of digital technology and various industries is limited, and the infrastructure of the digital economy itself consumes a lot of energy, so the development of digital industrialization and industrial digitalization in the digital economy in Northeast China has increased the intensity of regional carbon emissions. Compared with the progress of industrial digitalization in the northeast region, the development of digital industrialization has promoted the improvement of carbon emission intensity. The reason for this phenomenon is that the digital products produced by the digital industrialization sector, such as communication equipment, computers, software, etc., require a lot of manpower and material resources in the production process, which will significantly increase carbon emissions, while industrial digitalization is mainly through digital technology to empower other industries to increase sector output, so the promotion of carbon emission intensity is relatively small.
For the eastern region, the estimated results of models E (1) and E (2) show that the impact of digital economy and digital industrialization on carbon emission intensity is opposite. The eastern region includes many provinces with developed digital economy, and in the 2023 “Government Work Report,” it was pointed out that Beijing accelerated the construction of a global digital economy benchmark city, adding more than 10,000 5G base stations. Promote the research and development of 6G technology and actively deploy the Internet 3.0 and other new tracks; Shanghai implements the Smart Factory Pilot Action and strives to build an internationally competitive digital industry cluster; Zhejiang Province vigorously promotes digital industrialization and industrial digitalization, and strives to increase the added value of core industries of the digital economy by 10%. The rapid development of the digital economy industry in the eastern region, the construction of digital industry infrastructure is essential, and many digital products are also produced, these production activities need to consume a lot of energy, thereby increasing regional carbon emissions, so with the increase of economic added value of the digital industry manufacturing sector, carbon emission intensity increases. However, compared with the digital industry manufacturing sector, the digital industry service sector can empower upstream and downstream industries, improve the technology and knowledge of upstream and downstream industries, thereby improving the production efficiency of the industry and reducing carbon emission intensity (Yi et al., 2022). The digitalization of digital economy industry decreases the regional carbon emission intensity at a significant level of 10%. With the help of digital technologies such as artificial intelligence, big data, and Internet 5G, traditional industrial sectors have obtained the optimal product production plan through a large number of data collection and analysis, which has greatly reduced the carbon emissions per unit of production.
For the central region, the development of digital economy, digital industrialization and industrial digitalization both affect the regional carbon emission intensity at a significant level of 1%, and both have inhibitory effects. Compared with the elastic coefficient of the impact of digital economy development on carbon intensity in other regions, it can be found that the elasticity coefficient of the central region is relatively large, mainly because there are more traditional high-energy-consuming heavy industries in the central region, and there is more space for carbon reduction. In recent years, the development of the digital economy in the central region has continuously broken new records, and the added value of the core industries of the digital economy in Hubei Province exceeded 400 billion yuan in 2023; Hunan Province’s digital economy has grown by more than 15%, accounting for more than 33% of its GDP; The scale of digital economy in Jiangxi Province accounts for more than 45% of the regional GDP, which effectively drives the development of the digital economy in the surrounding areas.
For the western region, the development of digital industrialization and industrial digitalization of the digital economy inhibits the intensity of regional carbon emissions, and the impact coefficient is significantly below the significance level of 1%. The western region generally has a relatively backward economy and digital economy development, of which Sichuan Province and Chongqing Municipality play a significant leading and radiating role, in 2023, Chongqing will build a “50 million” digital industry development system, Sichuan Province will promote the construction of major digital infrastructure projects such as computing power dispatching centers. Develop a national-level Tianfu data center cluster. However, Guizhou Province uses its economic development positioning and development characteristics to promote the high-quality development of the digital economy. Guizhou Province has a small economy, but in recent years, it has achieved industrial transformation with the big data industry as the starting point, and the growth rate of digital economy ranks among the forefront of the country (Zhang J. et al., 2022). The implementation of China’s “East Data and West Calculation” project not only makes efficient use of regional resources, but also effectively stimulates the economic and digital industry development of the western region, promotes the large-scale development of the digital economy industry in the western region, and promotes the carbon emission reduction effect in the western region.
The model estimation results of the four regions in China show that there is significant heterogeneity in the impact of China’s digital economy industrial development on carbon emission intensity. Different regions are at different stages of economic development and the regional economic and industrial structure is different, which is the main reason for the heterogeneous impact.
5 Conclusion and policy implications
The digital economy is currently in a stage of rapid growth and has extensively permeated into various economic fields, profoundly altering the development impetus and mode of the world economy. How to leverage this new development impetus of the digital economy to assist in achieving the “dual carbon” goals is an important research subject. Based on the data from the Input-Output Tables (and extended tables) of 30 provinces (excluding Hong Kong, Macao, Taiwan, and Tibet) in 2012, 2015, and 2017, this paper measures the development scale of the digital economy using the value-added of digital economic industries, referencing the measurement methods of the Bureau of Economic Analysis (BEA). The econometric models of this paper are the fixed effects model and the spatial Durbin model. The empirical results show that the impact of China’s digital economy industry on carbon emission intensity should be analyzed from a structural perspective, specifically, the impact of digital industrialization and industrial digitalization on carbon emission intensity should be analyzed separately. Overall, China’s digital economy industry has entered the stage of low-carbon development, but the development of digital economy in the four regions of China presents different characteristics. Through empirical tests conducted from four perspectives, the results show that: First, the baseline regression model testing indicates that the overall development of China’s digital economy industry has a restraining effect on carbon emission intensity. After structural decomposition of digital economy industry, it is found that both digital industrialization and industrial digitalization exhibit inhibitory effects on carbon emission intensity. Second, Spatial analysis reveals that the development of the digital economy industry has significant carbon spillover effects. It may increase carbon emission intensity in neighboring regions while reducing it within the region. After structural decomposition, digital industrialization demonstrates a significant inhibitory effect on carbon intensity. However, further analysis is required to understand the total effect of industrial digitalization development on carbon intensity. Third, regional heterogeneity analysis indicates that in Northeast China, both digital industrialization and industrial digitalization promote an increase in carbon emission intensity. In the eastern region, the development of the digital industry service sector and industrial digitalization have a restraining effect on carbon emission intensity, while the digital industry manufacturing sector has a promoting effect. In the central and western regions, both digital industrialization and industrial digitalization inhibit carbon emission intensity. Forth, over the full-sample study period, the development of the digital industry manufacturing sector exhibits a “promoting and then suppressing” effect on carbon emission intensity. On the other hand, the relationship between the digital industry service sector and carbon intensity has surpassed the peak of the Environmental Kuznets Curve (EKC) and entered the stage of low-carbon development. The impact of industrial digital development on carbon intensity demonstrates the pattern of “promoting growth, suppressing, and then promoting growth.”
There is still room for improvement in this paper, primarily due to data availability. The evaluation index system for the development level of the digital economy is not comprehensive enough, leading to an inaccurate final measurement result. In future research, we can enhance the measurement of industrial digitization and digital governance and establish a more comprehensive indicator system for the level of digital economic development. Additionally, with newly released data, we can further extend the time span of panel data for more in-depth research.
Based on the above conclusions, this paper proposes the following suggestions: Firstly, it is important to fully utilize the technological capabilities of the digital economy industry in both upstream and downstream industries. This will help improve operational efficiency within the industrial chain while also promoting digital industrialization. The government should support the digital transformation of upstream manufacturing industries, enhance production efficiency and operation management across various sectors such as construction and transportation, and reduce carbon emissions from traditional high-emission manufacturing sectors. Downstream enterprises should be encouraged to embrace digital technology for online operations, reduce investments in physical stores, decrease reliance on heavy industries like steel and cement, and optimize energy consumption structures. Secondly, there is a need to strengthen the integration of digital technology across different industries within the national economy in order to promote industrial digitalization. According to the “China Industrial Digitalization Report 2020,” emphasis should be placed on efficiently utilizing data element resources for industrial digitalization development. Enterprises can explore new opportunities by building a digital economy ecosystem that integrates online and offline operations based on customer needs through data elements. This ecosystem relies on data resources connected by digital technology groups supported by platforms. The government must create a conducive policy environment for industrial digital transformation while implementing targeted measures to address challenges such as limited transformation capabilities among Chinese enterprises, high transformation costs, and shortage of digital talents. Thirdly, the development of regional digital economy industries should be tailored to the specific characteristics of energy, economy, and environment in each region. Each region will pursue a unique path based on its own resource endowments, effectively harnessing the economies of scale and synergies within the industry. The flow of data will drive technological advancements, capital investment, and talent acquisition. All regions should continue to advance initiatives such as “counting in the East and counting in the West,” while also bolstering infrastructure development including 5G networks and data centers in the western region. It is imperative to enhance overall computing power supply and coordination between regions, establishing a unified system for data center computing facilities and network expansion.
Data availability statement
The datasets presented in this study can be found in online repositories. The names of the repository/repositories and accession number(s) can be found below: https://www.stats.gov.cn/sj/ndsj/.
Author contributions
YW: Data curation, Formal Analysis, Visualization, Writing–original draft, Writing–review and editing. YY: Conceptualization, Methodology, Supervision, Writing–review and editing. XQ: Data curation, Formal Analysis, Writing–review and editing. YC: Funding acquisition, Supervision, Validation, Writing–review and editing.
Funding
The author(s) declare that financial support was received for the research, authorship, and/or publication of this article. This work was supported by the Project of National Natural Science Foundation of China (72140001).
Conflict of interest
The authors declare that the research was conducted in the absence of any commercial or financial relationships that could be construed as a potential conflict of interest.
Publisher’s note
All claims expressed in this article are solely those of the authors and do not necessarily represent those of their affiliated organizations, or those of the publisher, the editors and the reviewers. Any product that may be evaluated in this article, or claim that may be made by its manufacturer, is not guaranteed or endorsed by the publisher.
References
ABS (2019). Measuring digital activities in the Australian economy [EB/OL]. Available at: https://www.abs.gov.au/websitedbs/D3310114.nsf/home/ABS+Chief+Economist+-+Full+Paper+of+Measuring+Digital+Activities+in+the+Australian+Economy.
Anders, A., and Tomas, E. (2015). On global electricity usage of communication technology: trends to 2030. Challenges 6 (1), 117–157. doi:10.3390/challe6010117
Barefoot, K., Curtis, D., Jolliff, W. A., Nicholson, J. R., and Omohundro, R. (2018) Defining and measuring the digital economy, 15. Washington, DC: US Department of Commerce Bureau of Economic Analysis, 210.
BEA (2019). Measuring the digital economy: an update incorporating data from the 2018 comprehensive update of the industry economic accounts [EB/OL].
Chen, S., Ding, D., Shi, G., and Chen, G. (2022). Digital economy, industrial structure, and carbon emissions: an empirical study based on a provincial panel data set from China. Chin. J. Popul. Resour. Environ. 20 (4), 316–323. doi:10.1016/j.cjpre.2022.11.002
Chen, W. (2023). Digital economy development, corporate social responsibility and low-carbon innovation. Corp. Soc. Responsib. Environ. Manag. 30, 1664–1679. doi:10.1002/csr.2443
Dong, F., Hu, M., Gao, Y., Liu, Y., Zhu, J., and Pan, Y. (2022). How does digital economy affect carbon emissions? Evidence from global 60 countries. Sci. Total Environ. 852, 158401. doi:10.1016/j.scitotenv.2022.158401
Ge, W., Xu, Y., Liu, G., Shen, B., Su, X., Liu, L., et al. (2022). Exploring the impact of the digital economy on carbon emission efficiency under factor misallocation constraints: new insights from China. Front. Environ. Sci. 10, 953070. doi:10.3389/fenvs.2022.953070
Han, J., and Jiang, T. (2022). Does the development of the digital economy improve carbon emission efficiency? Front. Ecol. Evol. 10, 1031722. doi:10.3389/fevo.2022.1031722
Horner, N. C., Shehabi, A., and Azevedo, I. L. (2016). Known unknowns: indirect energy effects of information and communication technology. Environ. Res. Lett. 11 (10), 103001. doi:10.1088/1748-9326/11/10/103001
Lei, X., Ma, Y., Ke, J., and Zhang, C. (2023) The non-linear impact of the digital economy on carbon emissions based on a mediated effects model[J]. Sustainability, 15(9), 7438. doi:10.3390/su15097438
Li, Y., Yang, X., Ran, Q., Wu, H., Irfan, M., and Ahmad, M. (2021). Energy structure, digital economy, and carbon emissions: evidence from China. Environ. Sci. Pollut. Res. 28 (45), 64606–64629. doi:10.1007/S11356-021-15304-4
Li, Z., and Wang, J. (2022). The dynamic impact of digital economy on carbon emission reduction: evidence city-level empirical data in China. J. Clean. Prod. 351, 131570. doi:10.1016/j.jclepro.2022.131570
Lyu, K., Yang, S., Zheng, K., and Zhang, Y. (2023a). How does the digital economy affect carbon emission efficiency? Evidence from energy consumption and industrial value chain. Energies 16 (2), 761. doi:10.3390/en16020761
Lyu, Y., Zhang, L., and Wang, D. (2023b). Does digital economy development reduce carbon emission intensity? Front. Ecol. Evol. 11, 1176388. doi:10.3389/fevo.2023.1176388
OECD (2018). A proposed framework for digital supply-use tables [EB/OL]. Available at: http://www.oecd.org/officialdocuments/publicdisplaydocumentpdf/?cote=SDD/CSSP/WPNA(2018)3&DocLanguage=En.
Sadorsky, P. (2012). Information communication technology and electricity consumption in emerging economies. Energy Policy 48 (SEP), 130–136. Available at: doi:10.1016/j.enpol.2012.04.064
Salahuddin, M., and Alam, K. (2015). Internet usage, electricity consumption and economic growth in Australia: a time series evidence. Telematics Inf. 32 (4), 862–878. doi:10.1016/j.tele.2015.04.011
Shao, S., Fan, M., and Yang, L. (2022). Economic restructing, green technical progress, and low-carbon transition development in China: an empirical investigation based on the overall technology frontier and spatial spillover effect. J. Manag. World (02), 46-69+4–10. (in Chinese). doi:10.19744/j.cnki.11-1235/f.2022.0031
Wang, L., Chen, L., and Li, Y. (2022). Digital economy and urban low-carbon sustainable development: the role of innovation factor mobility in China. Environ. Sci. Pollut. Res. 29 (32), 48539–48557. doi:10.1007/s11356-022-19182-2
Wang, Q., Li, C., and Li, R. (2023). Could the digital economy increase renewable energy and reduce carbon emissions? Empirical research on EKC in 67 countries. Environ. Sci. Pollut. Res. 30 (31), 77150–77164. doi:10.1007/s11356-023-27806-4
Xie, Y. (2022). The effect and mechanism of digital economy on regional carbon emission intensity. Contemp. Econ. Management44 (02), 68–78. (in Chinese). doi:10.13253/j.cnki.ddjjgl.2022.02.008
Yang, D., and Hu, Y. (2022). An empirical analysis of the impact of digitalization on industrial carbon emission intensity. Urban Environ. Stud. 4, 17. (in Chinese).
Yang, G., Xiang, X., Deng, F., and Wang, F. (2023) Towards high-quality development: how does digital economy impact low-carbon inclusive development: mechanism and path[J]. Environ. Sci. Pollut. Res., 30(14), 41700–41725. doi:10.1007/s11356-023-25185-4
Yi, M., Liu, Y., Sheng, M. S., and Wen, L. (2022). Effects of digital economy on carbon emission reduction: new evidence from China. Energy Policy 171, 113271. doi:10.1016/j.enpol.2022.113271
Zhang, J., Lyu, Y., Li, Y., and Geng, Y. (2022a). Digital economy: an innovation driving factor for low-carbon development. Environ. Impact Assess. Rev. 96, 106821. doi:10.1016/j.eiar.2022.106821
Zhang, L., Jiang, L., and Zhang, F. (2023b). CCUS technology, digital economy, and carbon emission efficiency: evidence from China’s provincial panel data. Environ. Sci. Pollut. Res. 30, 86395–86411. doi:10.1007/s11356-023-28312-3
Zhao, X., Jiang, M., and Zhou, Y. (2023). The impact of the digital economy on carbon emission intensity: evidence from China. Front. Environ. Sci. 11, 1119246. doi:10.3389/fenvs.2023.1119246
Zhou, X., Zhou, D., Wang, Q., and Su, B. (2019). How information and communication technology drives carbon emissions: a sector-level analysis for China. Energy Econ. 81 (JUN.), 380–392. doi:10.1016/j.eneco.2019.04.014
Zhou, X., Zhou, D., Zhao, Z., and Wang, Q. (2022). A framework to analyze carbon impacts of digital economy: the case of China. Sustain. Prod. Consum. 31, 357–369. doi:10.1016/j.spc.2022.03.002
Keywords: digital economy, digital economy industry, carbon intensity, industrial organization theory, low-carbon development, input-output
Citation: Wang Y, Yuan Y, Qian X and Chi Y (2024) The impact of China’s digital economy industry development and its structural indicators on carbon emission intensity. Front. Environ. Sci. 12:1438927. doi: 10.3389/fenvs.2024.1438927
Received: 27 May 2024; Accepted: 13 August 2024;
Published: 27 August 2024.
Edited by:
Zhisong Chen, Nanjing Normal University, ChinaReviewed by:
Anlu Zhang, Huazhong Agricultural University, ChinaKashif Iqbal, Shanghai Dianji University, China
Copyright © 2024 Wang, Yuan, Qian and Chi. This is an open-access article distributed under the terms of the Creative Commons Attribution License (CC BY). The use, distribution or reproduction in other forums is permitted, provided the original author(s) and the copyright owner(s) are credited and that the original publication in this journal is cited, in accordance with accepted academic practice. No use, distribution or reproduction is permitted which does not comply with these terms.
*Correspondence: Yongke Yuan, eXlrQGJqdXQuZWR1LmNu