 Seyed Mahmood Hamze-Ziabari
 Mahdi Jafari
 Hendrik Huwald
 Michael Lehning
- 1Laboratory of Cryospheric Sciences, School of Architecture, Civil and Environmental Engineering, École Polytechnique Fédérale de Lausanne (EPFL), Lausanne, Switzerland
- 2WSL Institute for Snow and Avalanche Research SLF, Davos, Switzerland
Over the past two decades, the joint manifestation of global warming and rapid urbanization has significantly increased the occurrence of heatwaves and the formation of urban heat islands in temperate cities. Consequently, this synergy has amplified the frequency and duration of periods with tropical nights (TNs) in these urban areas. While the occurrences of such extreme events demonstrate irregular and nonlinear annual patterns, they consistently manifest a discernible rising decadal trend in local or regional climatic data. In urban regions situated amidst hilly or mountainous landscapes, changing wind directions—often associated with uphill or downhill thermal flows—profoundly impact the spread and dispersion of heat-related pollution, creating unique natural ventilation patterns. Using the Lausanne/Pully urban area in Switzerland as examples of hilly and lakeshore temperate cities, this study explores the influence of wind patterns and natural urban ventilation on the nonlinearity of recorded climatic data within an urban environment. This study integrates a mesoscale numerical weather prediction model (COSMO-1), a microscale Computational Fluid Dynamics (CFD) model, field observations, variational mode decomposition technique, and statistical analysis to investigate how wind speed and direction critically influence the nonlinearity of recorded long-term trends of extreme events, specifically focusing on the frequency and duration of TNs in lakeshore and hilly cities. The results strongly indicate a direct correlation between the frequency of TNs and the occurrence of specific moderate wind patterns. These wind patterns are exclusively captured by the microscale CFD model, unlike the mesoscale model, which neglects both urban morphology and complex hilly terrains. The impact of temporal and spatial variability of the wind field on long-term observations at fixed measurement stations suggests that caution should be exercised when relying on limited spatial measurement points to monitor and quantify long-term urban climate trends, particularly in cities located in complex terrains.
1 Introduction
The synergistic interplay between urban climate dynamics and global warming has resulted in a rise in both the frequency and duration of heatwaves (HWs) and the prevalence of urban heat islands (UHIs) and tropical nights (TNs) in major metropolitan areas (Palme and Salvati, 2021). A TN is commonly defined as a night during which the minimum temperature exceeds a predetermined critical threshold (Alexander et al., 2006). The consequences of TNs and UHIs are far-reaching, triggering several adverse effects such as heightened energy demands for cooling, reduced air quality, and an increased vulnerability to heat-related illnesses and mortality (Buguet, 2007; Akbari and Kolokotsa, 2016; Obradovich et al., 2017; Minor et al., 2022; Rippstein et al., 2023; Acosta et al., 2024). The adverse effects are more pronounced during nighttime as UHIs form, creating a significant temperature difference between urban and rural environments (Scherer et al., 2013; Ragettli et al., 2017).
Among various microclimate conditions, wind speed and direction are widely recognized as key factors in mitigating the UHI and TN effects (Meng et al., 2022; Tian et al., 2023; Li et al., 2024). Wind directly interacts with various structural components such as building roofs, facades, and other surfaces, and regulates the dynamics of heat and pollution transfer (Mei et al., 2017; Guo et al., 2018; Xie et al., 2022). The wind field plays a crucial role in influencing air infiltration by directly impacting both forced and natural convections, which are triggered by temperature differences (Nikkho et al., 2017). The mechanical turbulence induced by wind primarily facilitates the efficient exchange of heat, substances, and energy, thereby mitigating the UHI effects commonly observed in urban environments (Yang et al., 2021; Du et al., 2024). Previous studies have shown that once the wind speed surpasses a critical threshold, it holds the potential to mitigate the UHI and TN effects (e.g., Alonso et al., 2003; Guo et al., 2018).
However, the intricate geometries and morphology of high-density urban landscapes often cause aerodynamic blockages, which disrupt the airflow and alter the distribution of wind pressure and speed across building surfaces (He Y. et al., 2022). This disruption leads to a reduction in natural ventilation, posing a challenge for passive cooling mechanisms and increasing the demand for cooling loads in buildings during the summer months (Van Moeseke et al., 2005). In the atmospheric boundary layer, wind speed typically demonstrates specific vertical patterns. Usually, wind speed increases with increasing height, and the rate of change in wind speed tends to diminish (Jung et al., 2016). However, the spatial heterogeneity of surface roughness and friction, resulting from buildings of varying heights in areas with diverse built-environment densities, significantly alters the vertical distribution of wind speeds (Wang et al., 2020). Consequently, above the urban canopy layer, wind speed tends to increase, while remaining relatively constant near the ground (He W. et al., 2022; Li et al., 2024). It is therefore crucial to consider the diverse mitigating effects of the wind field on the UHIs and TNs, given that these effects exhibit variations both horizontally and vertically in urban settings.
Previous studies have predominantly focused on simulating urban climate at the neighborhood scale or street canopy scale, often situated in simple or flat terrains (e.g., Feddersen et al., 2003; Rotach et al., 2005; Soebiyan et al., 2017; Wang et al., 2018; Juan et al., 2021; Back et al., 2023; Xi et al., 2024). However, the existing body of knowledge may not adequately reflect the complexities inherent to urban landscapes situated in diverse natural terrains, such as lakeshore and hilly areas, which are commonly found worldwide. In particular, the influence of elevation changes, lakeshore features, and the dynamic interplay between natural and built environments in hilly and lakeshore cities introduces unique challenges in understanding the intricate patterns of wind flow in such cities (Lun et al., 2003; He Y. et al., 2022; Du et al., 2024). Depending on wind direction, wind flow can be highly variable, leading to different natural ventilation effects induced by the wind field (Guo et al., 2018). In general, the intricate aerodynamic interactions among airflow, complex terrain and urban morphology generate significant spatial and vertical variability in wind velocity and direction within the urban canopy (Feddersen et al., 2003; Rotach et al., 2005; Wang et al., 2020).
Investigating such spatial and vertical heterogeneity is crucial for a more comprehensive understanding of urban climatology and for developing effective strategies for sustainable urban planning, design, and redesign (Tian et al., 2019; Liu et al., 2024). The assessment of wind field in urban environments primarily depends on field measurements, wind tunnel tests, and numerical simulations (Johnson and Hunter, 1998; Feddersen et al., 2003; Rotach et al., 2005; Gao et al., 2012). Although field measurements and wind tunnel tests offer higher accuracy, their implementation is time-consuming and logistically and financially demanding (Guo et al., 2018). The numerical models used to simulate wind fields in urban areas usually fall into two categories (Barlow, 2014; Potsis et al., 2023): mesoscale models with spatial resolutions ranging from 1 to 103 km (e.g., the Weather Research and Forecasting (WRF) model and mesoscale atmospheric models (MAMs)) and microscale models with spatial resolutions ranging from a few meters to a few hundred meters (e.g., Krayenhoff and Voogt, 2007; Mirzaei and Haghighat, 2010). Microscale CFD models are favored for high-resolution simulations within urban environments, providing detailed insights into flow patterns influenced by urban morphology but computationally expensive (Vieira Zezzo et al., 2023). Integrating mesoscale and microscale model outcomes is crucial for understanding meteorological trends in urban climates, ranging from daily variations to decadal patterns. However, this integration is currently lacking, impeding a comprehensive understanding of urban wind dynamics necessary for informing sustainable urban planning and resilient landscape design (Liu et al., 2024).
On the other hand, monitoring air quality and meteorological parameters in urban areas primarily relies on a few fixed measurement stations, often limited in both temporal and spatial coverage. Time series of meteorological parameters recorded in these stations commonly reveal nonlinear and nonstationary trends (Khaliq et al., 2006; Zou et al., 2021), further complicating the comprehension of interrelations among various meteorological factors and the occurrence of extreme events such as UHIs or TNs. Fully grasping these interactions and extracting daily, seasonal, annual, and interannual trends from recorded data requires employing robust time series analysis techniques. Furthermore, integrating realistic high-resolution 3D numerical modeling that incorporates urban morphology and complex topography is crucial. Additionally, to enhance effective urban planning aimed at mitigating climate-driven risks in urban environments, further investigations into the uncertainties associated with mesoscale or global multi-model projections—particularly those arising from neglecting urban morphology—are imperative (Sanches et al., 2023).
To the best of the authors’ knowledge, prior research has predominantly focused on the potential impact of localized wind flows during extreme meteorological events such as UHIs or heatwaves (e.g., Lun et al., 2003; Juan et al., 2021; He W. et al., 2022; Back et al., 2023; Xi et al., 2024; Du et al., 2024). Nevertheless, the integrated effects of complex topographical features, such as hilly terrains, medium-sized inland water bodies, and detailed city-scale urban configurations, on the uncertainty and nonlinearity of long-term field measurements remain largely unexplored. This gap is significant because these elements can profoundly impact predictive modelling and data interpretation, potentially leading to the underestimation or overestimation of both the severity and frequency of extreme weather events in urban environments. This study aims to address the complexities associated with uncertainty and non-linearity inherent in the long-term trends of meteorological parameters, with a specific focus on an extreme event–TNs observed in lakeshore and mountainous cities like Lausanne/Pully, Switzerland. The primary objective is to investigate the influence of wind fields on these trends, elucidating how spatial heterogeneity in the wind field, shaped by both urban morphology and intricate hilly terrain, significantly impacts climatic data. To delve further into these dynamics, a microscale model developed in OpenFOAM in conjunction with a mesoscale NWP (COSMO-1) model is used to explore the spatial heterogeneity of urban wind field by taking into account both city-scale urban morphology and hilly terrains. By leveraging the simplicity and robustness of Variational Mode Decomposition (VMD), a non-recursive and adaptive time series analysis (Dragomiretskiy and Zosso, 2013), the historical meteorological parameters recorded in an urban area are decomposed into the interannual and annual trends. Then, the crucial role of the wind field, especially wind direction, in the nonlinearity of historical data recorded at a fixed station is examined through the utilization of VMD and microscale CFD results. Additionally, the microscale CFD model is used to unravel the physical sources of uncertainty in the NWP model for forecasting extreme events, such as TNs, in hilly urban environments.
2 Materials and methods
2.1 Study area
Lausanne (N46.5°, E6.6°), situated on the northern shore of Lake Geneva, holds the distinction of being the largest city in the canton of Vaud, Switzerland. With a population of 138,000 residents in 2016, Lausanne is at the center of an agglomeration comprising twenty-five municipalities, including 291,000 residents (Marini et al., 2019). The city faces challenges in terms of available land for new constructions and adheres to strict regulations aimed at preserving existing buildings. In contrast, the neighboring municipalities present more opportunities for new construction due to the availability of land (Marini et al., 2019). Lausanne is located on the southern escarpment of the Swiss plateau, characterized by an elevation change of approximately 500 m between the lakeshore at Ouchy and its northern periphery adjoining Le Mont-sur-Lausanne and Épalinges. It roughly covers an area of 41.8 km2. Due to its surrounding topography, two strong, dominant winds, namely the Bise (coming from the northeast) and the Vent (coming from the southwest) pass over the city area (Figure 1). These dominant winds contribute to the city’s distinctive weather patterns and add a nuanced layer to its environmental characteristics.
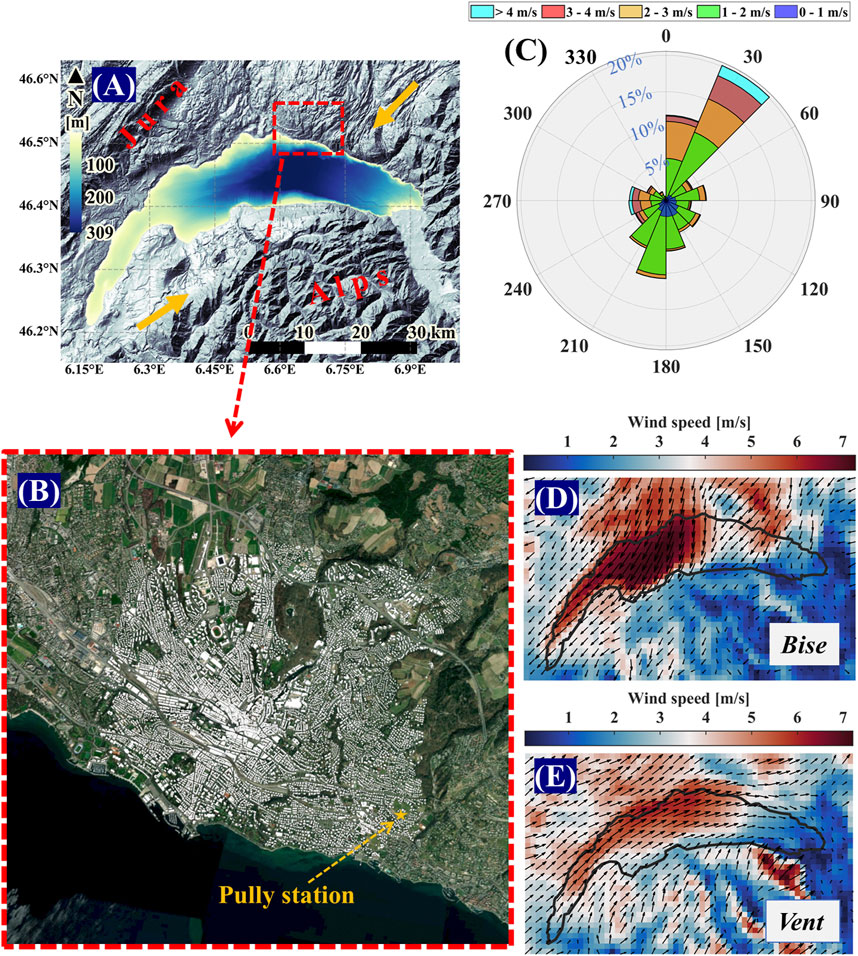
Figure 1. (A) Lake Geneva and surrounding topography, adapted from a public domain satellite image (NASA World Wind, last accessed 1 January 2024) and bathymetry data from SwissTopo (last accessed 1 January 2024). The thick orange arrows indicate the direction of the two strong dominant winds, called the Bise (coming from the northeast) and the Vent (coming from the southwest). (B) Urban morphology of the study area, including Lausanne and Pully. The yellow star shows the location of the Pully meteorological station. (C) The wind rose of field observation recorded at Pully station for the year 2022. (D) Averaged wind speed and direction at 10-m height above the ground simulated by COSMO-1 during a typical Bise event in summertime. (E) Averaged wind speed and direction at 10-m height above the ground simulated by COSMO-1 during a typical Vent event in summertime.
2.2 Numerical weather prediction model (COSMO-1)
Mesoscale Numerical Weather Prediction (NWP) models, characterized by resolutions around O (1 km), serve as crucial tools for assessing wind and heat patterns in urban areas and complex terrains (Kruyt et al., 2018). The Consortium for Small-Scale Modeling (COSMO) encompasses a non-hydrostatic family of mesoscale NWP models, widely adopted by global research institutes and meteorological services. The horizontal resolution of COSMO-1 is 0.01°, which corresponds to 1.11 km in the north-south (N-S) direction and ranging from 0.74 to 0.78 km in the east-west (E-W) direction. Vertically, the COSMO-1 model integrates 80 levels structured utilizing Smooth Level Vertical (SLEVE) terrain-following coordinates. The SLEVE scheme plays a crucial role in the model’s functionality by facilitating a more rapid decay of smaller terrain features compared to larger ones. This design choice significantly minimizes computational errors, ensuring a smoother transition to the upper levels, which maintain homogeneity within the model’s vertical structure (Schär et al., 2002). Such advancements not only enhance computational efficiency but also optimize accuracy in depicting complex features (Leuenberger et al., 2010). This study employs the outputs of COSMO-1 for the year 2022 to scrutinize its performance within the studied area (Figure 1).
2.3 Microscale CFD model
In this study, wind flow simulations at the building scale with a spatial resolution of less than 10 m were conducted using OpenFOAM V8. The simpleFoam solver is employed to solve the steady-state Reynolds-Averaged Navier-Stokes (RANS) equations governing incompressible turbulent flows. Utilizing the finite volume method (FVM), this solver uses the SIMPLE (Semi-Implicit Method for Pressure-Linked Equations) algorithm to solve the governing equations. To efficiently simulate airflow in urban areas with varying wind speeds and directions without creating a new mesh for each wind direction, Kastner and Dogan (2020) recommended using a cylindrical computational domain (Figure 2A, B). The preprocessing tasks, including the assignment of boundary conditions, were automated using Eddy3D, an open-source Grasshopper plugin. The mesh was created using blockMesh for the base mesh, while snappyHexMesh was used to align the background mesh with complex building geometries, resulting in a highly detailed mixed polyhedral mesh. Figure 2A illustrates the cylindrical domains created in Grasshopper, adhering to best practice guidelines. The cylindrical domain comprises approximately 37 million computational cells.
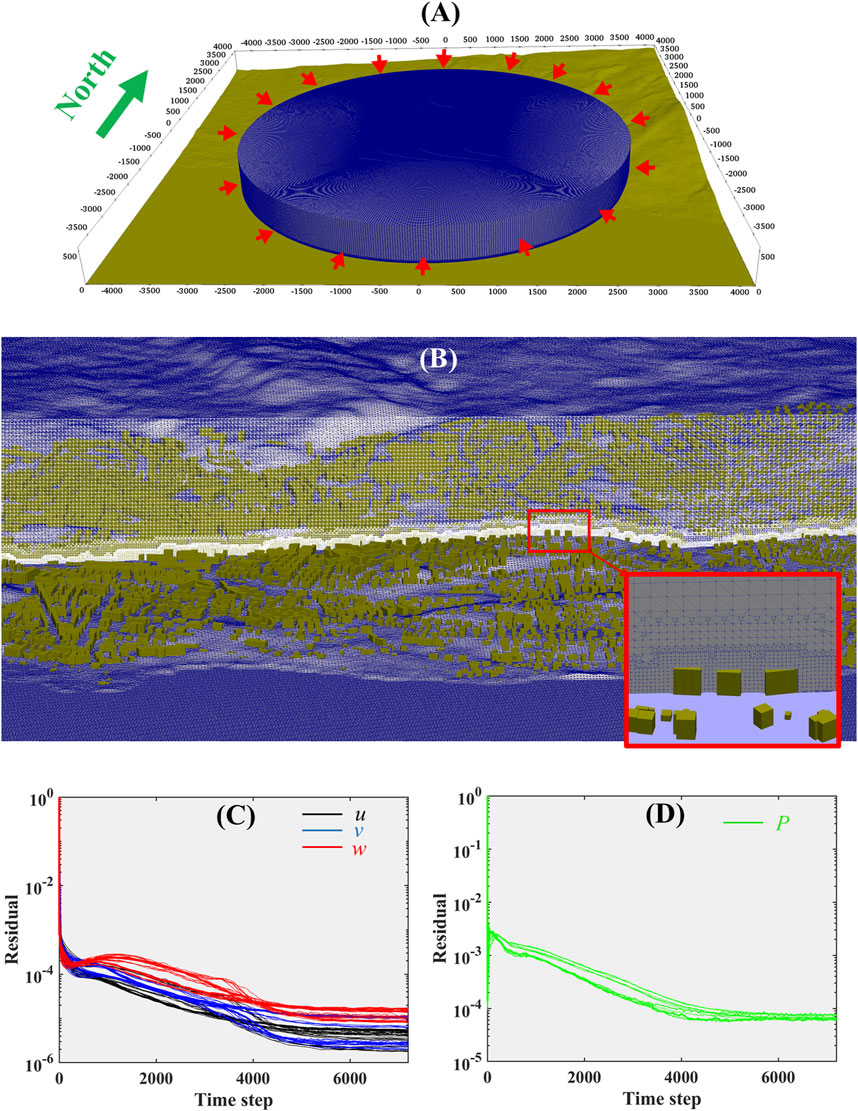
Figure 2. (A) The computational domain of the studied area (B) illustration of the mesh refinement around buildings and topography. The convergence criteria for numerical results including (C) the velocity field (i.e., u, v, w) and (D) pressure.
The inlet of the domain was configured to follow an atmospheric boundary layer (ABL) profile for wind velocity (u), turbulent kinetic energy (k), and specific dissipation rate (ω). A fixed pressure condition was applied at the outlet, while other variables were maintained under zero-gradient conditions. The ground and building walls were assigned identical boundary conditions: a no-slip condition for wind velocity, zero-gradient for pressure, and wall functions for k and ω. Turbulent viscosity (νt) was determined using the nutUSpaldingWallFunction, recognized for its effective wall modeling (Kastner and Dogan, 2020). Symmetric boundary conditions were imposed on the top face for all variables. The kinematic viscosity (ν) was set at 1.5 × 10⁻⁵. The turbulence inlet parameters were computed using Equations 1, 2 as:
where,
where
All computational simulations were performed using the steady-state simpleFoam solver in OpenFOAM, integrated with the Shear Stress Transport (SST) k−ω RANS turbulence model. The pressure-velocity coupling was managed through the SIMPLE algorithm with three non-orthogonal corrector loops. This study focuses primarily on wind events with speeds greater than 1.8 m/s, allowing for the exclusion of buoyancy effects (Boulard et al., 1996; Tecle et al., 2013; Mei and Yuan, 2022). Convergence was considered achieved when residuals dropped to O (10–4) for pressure (p) and O (10–5) for all other fields. Each simulation was run until these convergence criteria were met, as depicted in Figures 2C, D. The relaxation factors were set to 0.5 for pressure (p), and 0.3 for velocity (u), turbulent kinetic energy (k), and specific dissipation rate (ω). Other parameters, including discretization schemes, were selected based on best practice guidelines (Franke, 2006). Further validation of the microscale CFD model against field observations is detailed in Supplementary Text S1 and Supplementary Figure S1.
2.4 Variational mode decomposition (VMD)
Time series of meteorological parameters recorded in field stations commonly reveal nonlinear and nonstationary trends (Khaliq et al., 2006; Zou et al., 2021), further complicating the comprehension of interrelations among various meteorological factors and the occurrence of extreme events such as UHIs and TNs. Therefore, it is imperative to employ a robust time series analysis for examining daily, seasonal, annual, and interannual trends in the collected data (Sanches et al., 2023). Various signal and time series processing techniques have been developed to decompose the hidden sub-signals in the original historical time series utilizing data preprocessing techniques (Feng et al., 2020). Variational Mode Decomposition (VMD) is one of the most innovative non-recursive and adaptive methods for extracting nonlinear trends and harmonics from complex data signals (Dragomiretskiy and Zosso, 2013). The effectiveness of VMD in capturing nonlinear trends in time series has been validated across various research fields, including atmospheric science (Ali et al., 2018; Gan et al., 2021; Meng et al., 2023; Lu et al., 2024). VMD is adept at concurrently breaking down input time series into distinct stationary and narrow-band sequences known as intrinsic mode functions (IMFs) (Dragomiretskiy and Zosso, 2013). The combination of all IMFs along with a residual constitutes the original signal. The sparsity of each mode is directly linked to its bandwidth in the frequency domain, and the data predominantly concentrated around the central frequency. Further details of the VMD method can be found in Supplementary Text S2.
2.5 Urban surface transport index (USTI)
The accumulation, transport, and eventual elimination of heat and air pollution strongly depend on wind patterns within urban areas. Wind plays a crucial role in naturally mitigating these effects during HWs, TNs and UHIs. Having a reference index in urban settings to depict the origin of heat and pollution, whether local or external, is essential (Xie et al., 2022). Earlier investigations in synoptic and climate research have depended on the consistency of near-surface winds under different conditions within a particular geographic area to assess the ability of wind in transporting air pollution or heat (Berkovic, 2016; Luo et al., 2023). Recently, a new parameter known as Urban Surface Transport Index (USTI) has been introduced to quantify the ability of wind in transporting passive and active tracers by considering the spatial variability of wind field (Xie et al., 2022). USTI measures the consistency and steadiness of local wind direction within a city and is computed as follows:
where
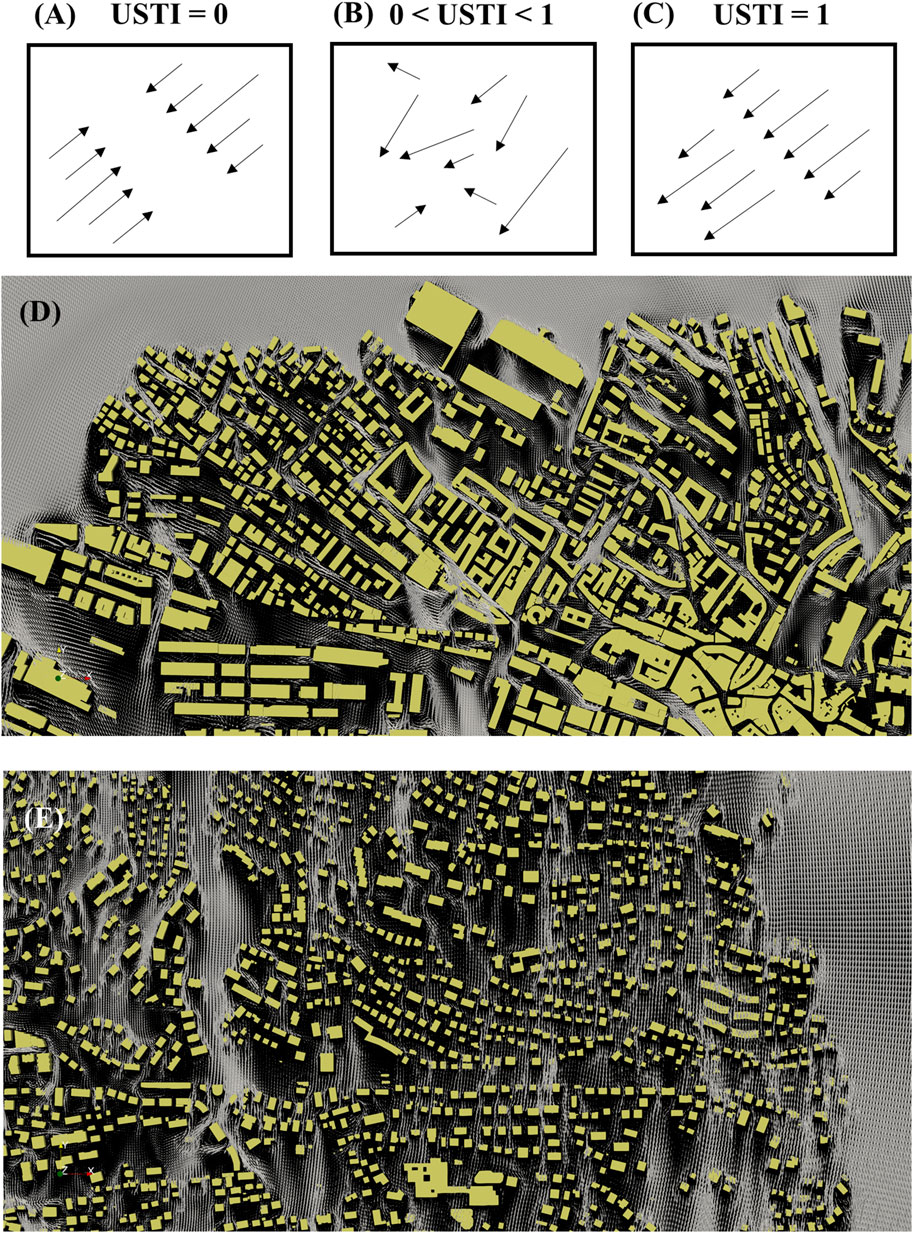
Figure 3. (A–C) A schematic representation delineating various ranges of the Urban Surface Transport Index (USTI), (D) The simulated horizontal wind direction within the densely built environments of Lausanne, and (E) The simulated horizontal wind direction in the suburban area of Pully.
A coherent and organized near-surface wind pattern across a city offers greater advantages for the transportation of heat or air pollutants from upwind to downwind compared to a disorganized one. The spatial diversity in building sizes and densities also plays an important role in determining USTI values. For instance, as illustrated in Figure 3D, the presence of tall and compacted buildings in urban areas, such as in Lausanne, significantly influences wind speed and direction, leading to a more erratic pattern and consequently a lower USTI value. Conversely, wind directions are less affected by smaller buildings with lower density, characteristic of residential areas in the Pully region (Figure 3E). Consequently, a higher USTI value is expected in Pully compared to Lausanne due to this lower impact of building structures on local wind direction. This study employs the USTI to assess natural ventilation in both urban and monotonous or hilly areas under various dominant wind directions. It aims to establish a potential correlation between the USTI during different wind events and the observed occurrences of TNs at the Pully station (see Figure 1B for location). Note that the results from the microscale CFD model are used to assess the USTI values under varying wind speeds and directions.
3 Results
3.1 The link between long-term trends in recorded meteorological data
Anthropogenic activities and climate change lead to increasing nonlinearity and non-stationarity in meteorological data, introducing significant uncertainty in assessing recorded parameters at urban meteorological stations (Sanches et al., 2023), as well as in low-resolution Numerical Weather Prediction (NWP) models. The Pully meteorological station (refer to Figure 1 for its location), situated in the suburbs of Lausanne, is frequently used to analyze air quality and local extreme weather events in the residential site of Lausanne. The meteorological parameters recorded at this station can be influenced by urban morphology and complex hilly terrains. This study examines the impact of wind fields on the meteorological and air quality parameters within urban settings, especially in contexts involving hilly or mountainous terrain. The intricate wind patterns resulting from the interplay between urban morphology and hilly terrain remain largely unexplored in terms of their effect on long-term recorded data. Here, we delve into the significance and influence of the wind field on the long-term trends of various meteorological parameters, with a focus on daytime and nighttime air temperatures.
To achieve this, the first step involves decomposing long-term (annual and interannual) trends, seasonal patterns, monthly fluctuations, daily variations, and residual elements in the recorded data (Gan et al., 2021). The robustness of the VMD technique has been confirmed in decomposing the original time series into distinct modal components and addressing the non-stationarity observed in various random and irregular time series (e.g., Ali et al., 2018; Meng et al., 2023; Lu et al., 2024). To address the non-stationarity observed in the random and irregular meteorological parameters recorded at the Pully station, the VMD technique was utilized due to its robust decomposition capabilities (Meng et al., 2023). This technique effectively decomposes the original time series into distinct modal components (Ali et al., 2018; Lu et al., 2024). The time series data for global radiation, as well as diurnal and nocturnal measurements of air temperature, air pressure, wind speed and direction, and precipitation were decomposed into different modes characterized by various central frequencies. For instance, Figure 4A illustrates the decomposition of the daily average of air temperature measured at a height of 2 m above the ground using the VMD technique over the last 20 years. All time series are consistently decomposed into 5 IMFs and a residual as shown in Figure 4A. Figure 4B illustrates the Fourier spectrum maps of the original time series and modes 1–5 derived from VMD, indicating a comparison of energy distribution across varying frequencies (Gan et al., 2021).
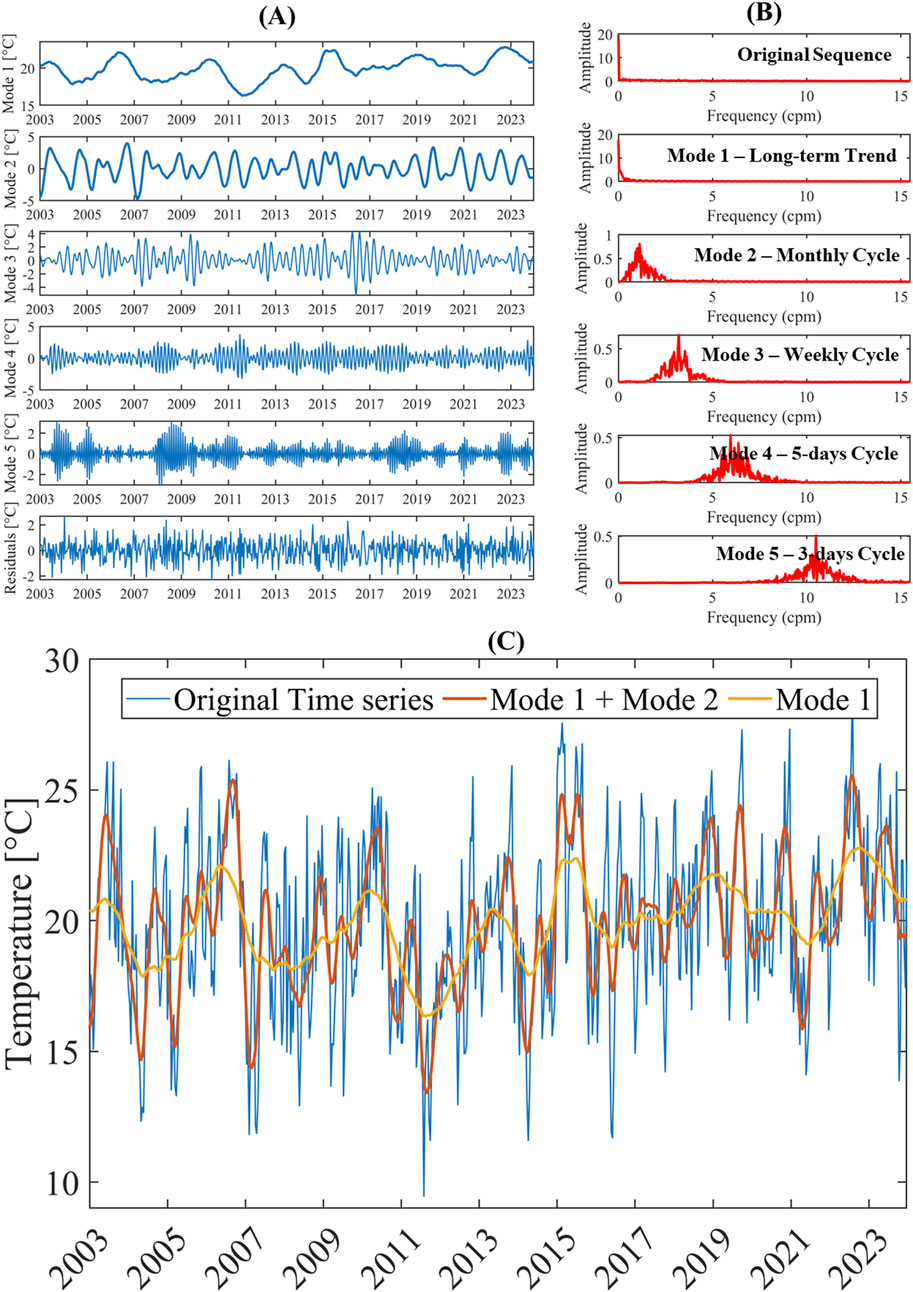
Figure 4. Daily air temperature time series for June recorded at Pully station with corresponding VMD analysis. (A) VMD modes arranged from low to high frequency. (B) Spectral analyses of each decomposed frequency component. (C) Comparative analysis between the original time series and the extracted long-term trend modes. “cpm” denotes cycles per month.
As illustrated in Figure 4B, modes 1 and 2 signify the long-term trend and intra-seasonal oscillations, respectively, while modes 3–5 represent signals with cycles of less than 30 days. Each mode exhibits distinctive power spectra, as depicted in Figure 4B. This indicates the successful decomposition of the original signal into various modes characterized by distinct frequencies using the VMD technique (Feng et al., 2020; Gan et al., 2021). Figure 4C demonstrates that VMD modes corresponding to long-term trends effectively capture the long-term variations in air temperature recorded at Pully station in June. Applying a similar methodology, we extract the long-term trends of diverse meteorological parameters—including global radiation, wind speed and direction, precipitation, and air temperature for both day and night—over the last two decades using the VMD technique. The resulting long-term trends for all recorded parameters are illustrated in Figure 5 for summer months, i.e., June, July and August. Examining the correlation between long-term trends of meteorological parameters can unveil the significance of complex wind patterns caused by urban and terrain features on variables such as air temperature, which is greatly influenced by changing urban climate.
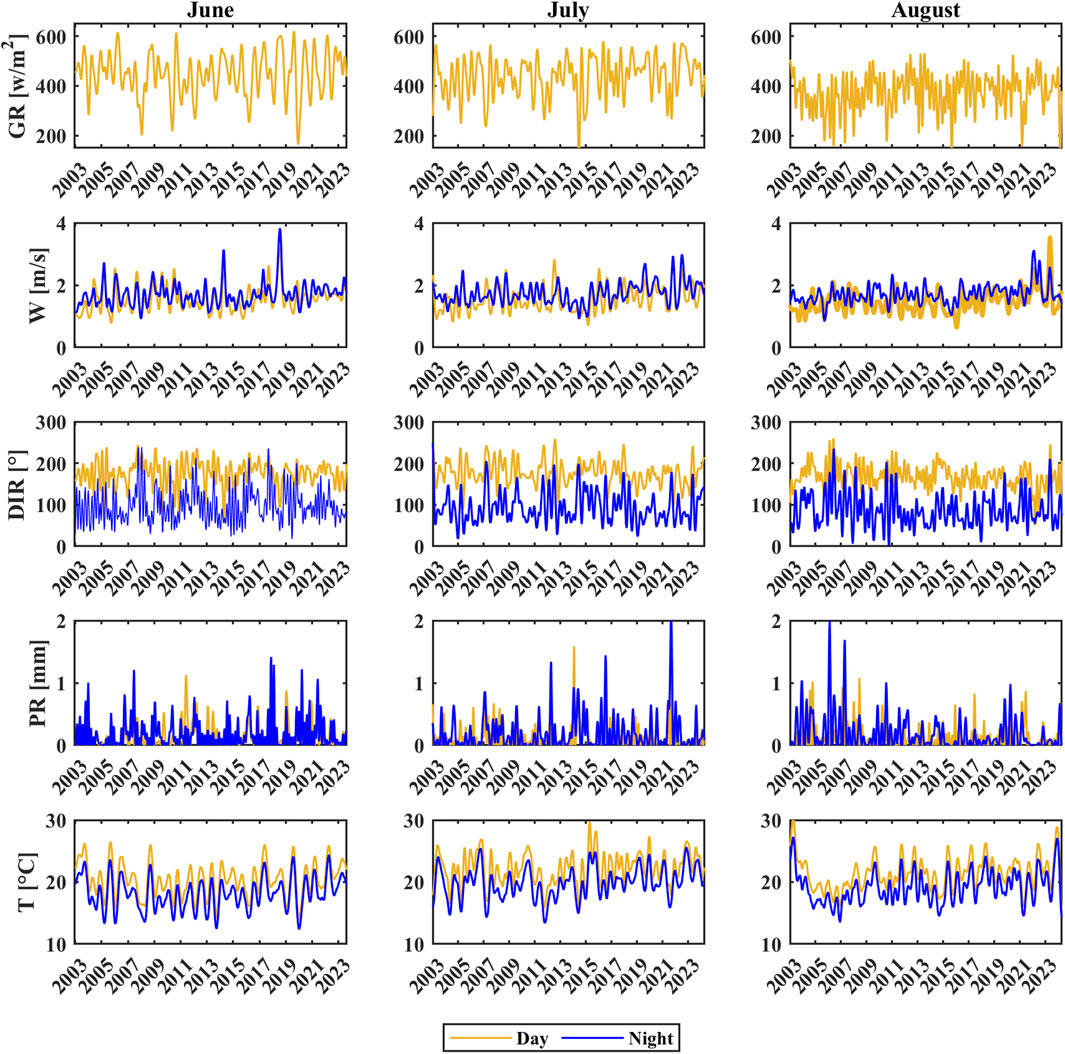
Figure 5. Long-term (annual and interannual) trends in meteorological parameters at Pully station: Day and night analysis for summer months using VMD. Parameters include global radiation (GR), wind speed (W), wind direction (DIR), precipitation (PR), and air temperature (T).
To better understand the relationship between long-term fluctuations in day and night air temperatures and various meteorological variables, statistical correlations are computed among long-term trends extracted using VMD. These correlations are evaluated using the Pearson correlation coefficient, denoted as R, and the corresponding p-values. The heatmaps of R and p-values for averaged diurnal and nocturnal meteorological parameters for different months in summer are given in Figure 6. As anticipated, the diurnal and nocturnal temperatures exhibit a strong positive correlation, given the pattern of warm days being followed by warm nights and vice versa. This correlation becomes particularly pronounced in urban environments due to formation of UHIs (Burgstall et al., 2021; Panda et al., 2024). This is primarily attributed to the greater heat retention capacity of urban materials and infrastructures, the confinement of long-wave radiation within urban environments, lower albedo surfaces, reduced evapotranspiration, and decreased air ventilation in densely populated urban areas compared to rural and vegetated sites (Fischer et al., 2012; Roth, 2012).
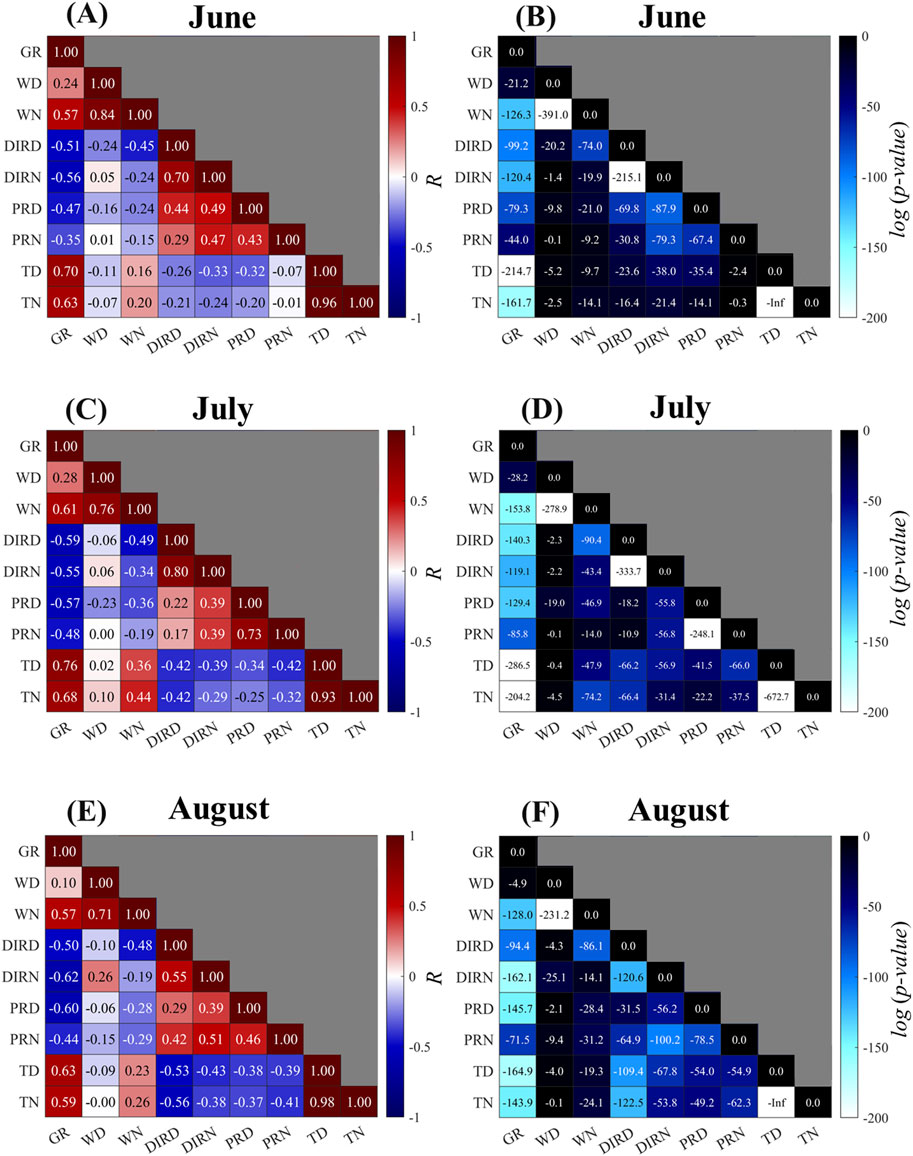
Figure 6. Heatmap representation of (A, C, E) correlation coefficient (R) and (B, D, F) p-values during summer months between different meteorological parameters, including global radiation (GR), wind direction during day (DIRD) and night (DIRN), wind speed during day (WD) and night (WN), precipitation during day (PRD) and night (PRN), and air temperature at 2-m height above ground during day (TD) and night (TN).
There is a statistically strong positive correlation (0.6–0.7) between global radiation and air temperature. Higher absorption of solar radiation transfers more energy to Earth’s surface and atmosphere, thereby increasing the temperature of land, air, and water. In urban areas, this effect can be further amplified by factors such as infrastructure, buildings, and human activities, leading to localized variations in temperature patterns (Palme and Salvati, 2021). There are also negative correlations between the long-term trend of precipitation and air temperature during day and night. The daily average R values, representing the correlation between diurnal and nocturnal air temperature and precipitation, are −0.15, −0.33, and −0.39 for June, July, and August, respectively. As depicted in Figure 6, there are also correlations among various meteorological parameters, given their potential to directly or indirectly influence each other.
The correlation coefficients between diurnal and nocturnal air temperature and wind speed are nearly 0.05, 0.23, and 0.10 for June, July, and August, respectively. The correlation between wind speed and air temperature is statistically significant primarily during nighttime, as indicated by low p-value (
The prevailing wind direction at Pully station generally ranges from 0–90° (Bise) to 180–270° (Vent) representing the dominant wind patterns in this region (see Figure 1C). A negative correlation between long-term trends of air temperature and wind direction suggests that air temperature decreases with an increase in the azimuth angle of the wind direction, which indicates a transition from Bise to Vent. In the subsequent sections, we investigate how these changes in wind direction within a hilly city may contribute to the nonlinear patterns observed in air temperature, as well as to the occurrence of extreme events such as tropical nights (TNs) recorded at Pully meteorological station.
3.2 Impact of urban and topographical factors on wind spatial variability: mesoscale versus microscale modeling
In this section, COSMO-1, a widely used Numerical Weather Prediction (NWP) model, and a microscale model developed in OpenFOAM for Lausanne and Pully are used to study the spatial variability of wind field induced by urban landscape and hilly terrain for different dominant wind directions. This investigation can shed light on the influence of wind direction on natural ventilation of hilly and lakeshore cities, facilitating the understanding of the observed correlation between wind directions and the long-term trends of air temperature discussed in the previous section. Previous studies have shown that COSMO-1 effectively captures mesoscale air circulation and wind patterns in Switzerland (e.g., Kruyt et al., 2018; Miralles et al., 2022). However, COSMO-1 fails to account for two critical factors in urban climate: urban morphology and intricate hilly terrain at resolutions below 0.01°. Therefore, alongside COSMO-1, it is crucial to utilize a microscale model to integrate these effects into the analysis of dominant wind patterns within the city. The wind rose illustrating the recorded wind field at the Pully station for the year 2022 is presented in Figure 1C. According to this figure, there are two dominant wind directions: the northeast wind, referred to as Bise, and the southwest wind, known as Vent. In the following sections, the spatial variability of wind field for various dominant wind directions are investigated by comparing the outcomes of COSMO-1 and microscale models.
3.2.1 The Bise
A typical Bise event (3 days averaged) simulated by COSMO-1 and the microscale model is shown in Figure 7. For a Bise event, Lausanne and Pully are both located in the lee of the hilly terrain. The turbulent boundary layer over hilly terrain is intricately shaped by key factors including the slope, local surroundings, and upstream roughness conditions (Raderschall et al., 2008; Cao et al., 2012; Elgendi et al., 2023). The terrain-induced complexities can result in topographic speed-up, secondary flow, turbulence intermittency, flow separation, and reattachment in hilly cities (Sun and Zheng, 2023; Duetsch-Patel et al., 2023). Depending on the surface roughness induced by built and natural canopies, hill slope, hill shape and wind speed, a recirculation bubble in the leeward side of Bise event can occur as shown in Figure 7B, thereby both cities are shielded from Bise event. This shielding effect can lead to minimal natural ventilation in case of Bise events.
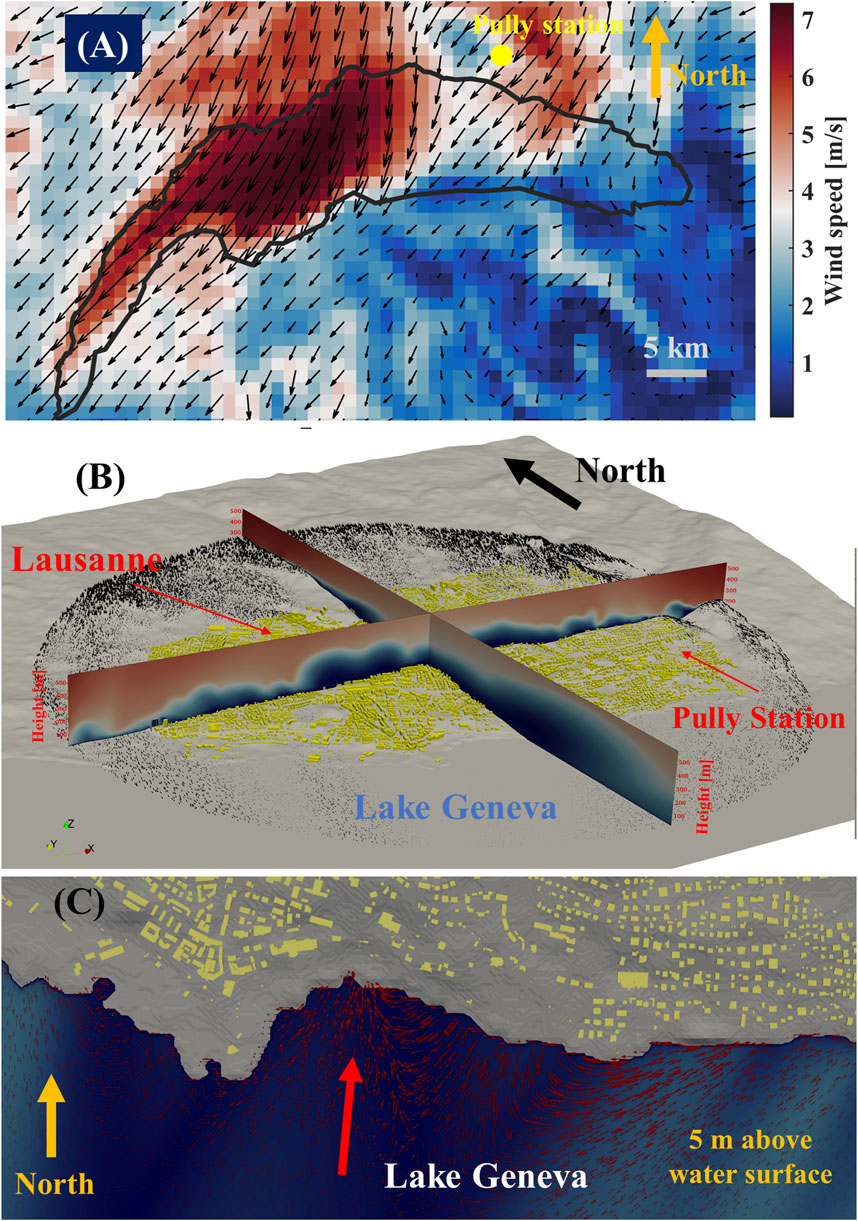
Figure 7. (A) Simulating a typical Bise event over the study area with COSMO-1. (B) 3D visualization of the urban boundary layer and velocity field resulting from the interplay between urban morphology and hilly terrains during an average Bise event using a high-resolution CFD model. (C) Illustration of the returning wind flow at a 5-m height above the water surface in Lake Geneva. The red arrow in panel C indicates the general direction of wind speed. Note that the colorbar is consistent across panels (A–C)
On the other hand, a recirculation flow formed downstream of the hill may create a slow-returning flow field, potentially introducing humidity and colder air from a nearby lake or sea into the city (Guo et al., 2023). As depicted in Figure 7C, the returning flow is generally inconsequential and may marginally penetrate the city according to the microscale model. It is noteworthy that, apart from the topographical impact on sheltering urban areas during the Bise, buildings can also exert a significant influence on the thickness of the turbulent boundary layer. As shown in Figure 7B, the boundary layer thickness extends to a greater height in Lausanne, where more densely packed and taller buildings are situated, whereas it is considerably less in Pully, characterized by shorter and less densely populated structures. The COSMO-1 takes into account the significant blocking effects of terrain, as illustrated in Figure 7A, but at a coarse resolution, necessarily smoothing the terrain. This means that the dissipating effects caused by built environments and microscale terrains (Figure 7B) are not accurately represented by this coarse model.
3.2.2 The Vent and northwest wind
A comparison between COSMO-1 and the microscale model for forecasting the wind field at a 10-m height above the terrain in Lausanne and Pully is illustrated in Figures 8A, B. The simulated wind fields generated by the two models in the urban area exhibit significant differences. Specifically, during the Vent event depicted in Figure 8A, COSMO-1 forecasts extend the wind field into urban areas encompassing both Pully and Lausanne. It is clear that COSMO-1, which does not resolve the impact of urban morphology, overlooks the aerodynamic obstruction resulting from complex building geometries. This highlights the importance of integrating urban morphology into coarse models like COSMO-1, as neglecting this factor can result in a significant overestimation of wind fields in urban areas. Furthermore, the biases observed may be exacerbated by the terrain smoothing inherent in the COSMO resolution and gridding choices (see above). Figure 8C illustrates that during a Vent event, the internal urban boundary layer can extend approximately 150 m above the ground in the downwind direction, emphasizing the significant hindering effects from buildings in the Pully area.
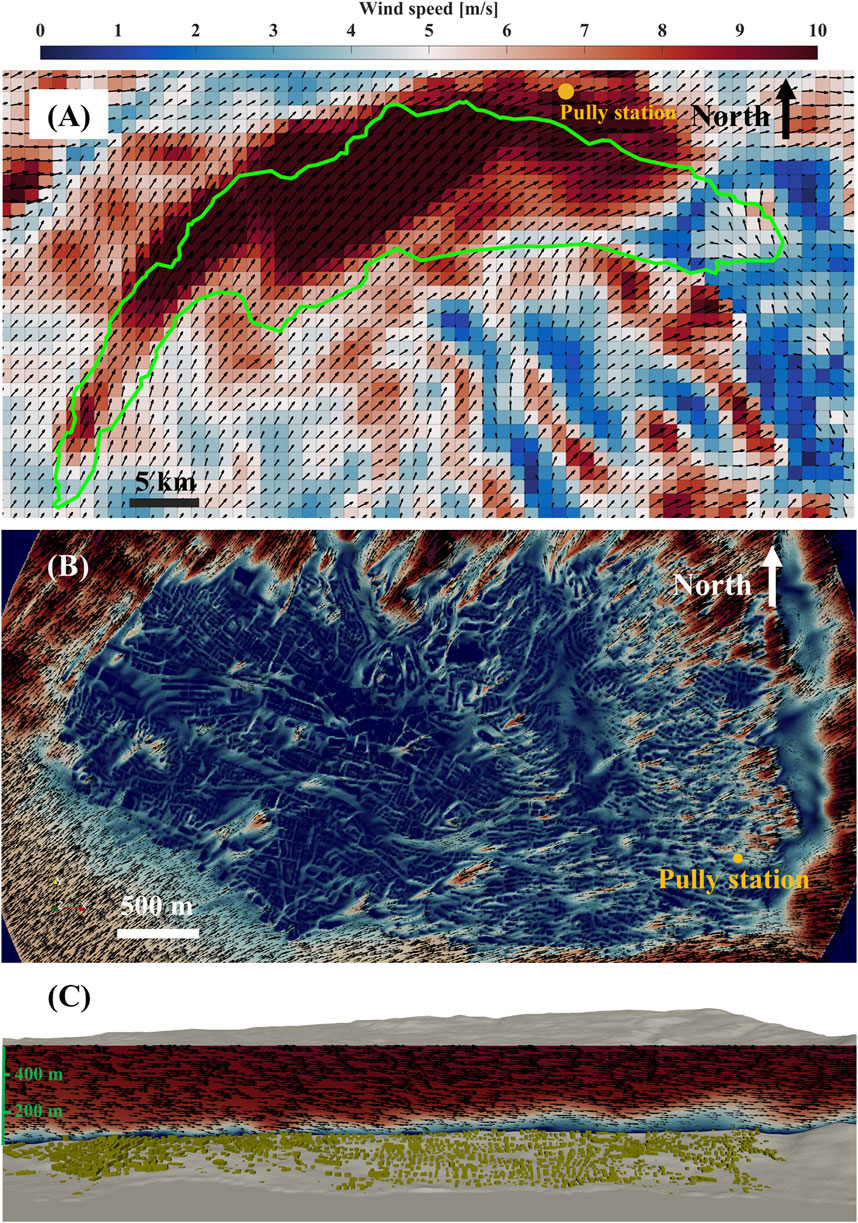
Figure 8. (A) Modeling a typical high-speed Vent event over the study area using COSMO-1. (B) Modeling the aerodynamic blockage caused by urban areas and terrains during a high-speed Vent event using the microscale CFD model. (C) Cross-section of wind velocity during a Vent event passing the Pully meteorological station, illustrating the development of the urban boundary layer downstream of the Vent. The yellow circle marks the position of Pully station.
The less frequent NW wind direction as shown in Figure 9A is nearly similar to a Vent event. There are significant differences between the results of COSMO-1 and the microscale model as shown in Figures 9A, B. Although both Lausanne and Pully are located downstream of the NW wind field and can be shielded from it because of the development of the urban boundary layer, the CFD model reveals three significant wind channels influenced by the intricate interplay of upstream wind patterns, topography, and urban morphology (Figure 9B–D). All these wind channels can potentially affect the measurements at Pully station. The current version of COSMO-1 fails to capture these wind channels, mainly resulting from channeling and Venturi effects (Huang et al., 2022). This limitation can also cause COSMO-1 to underestimate wind speed in areas affected by channeling effects.
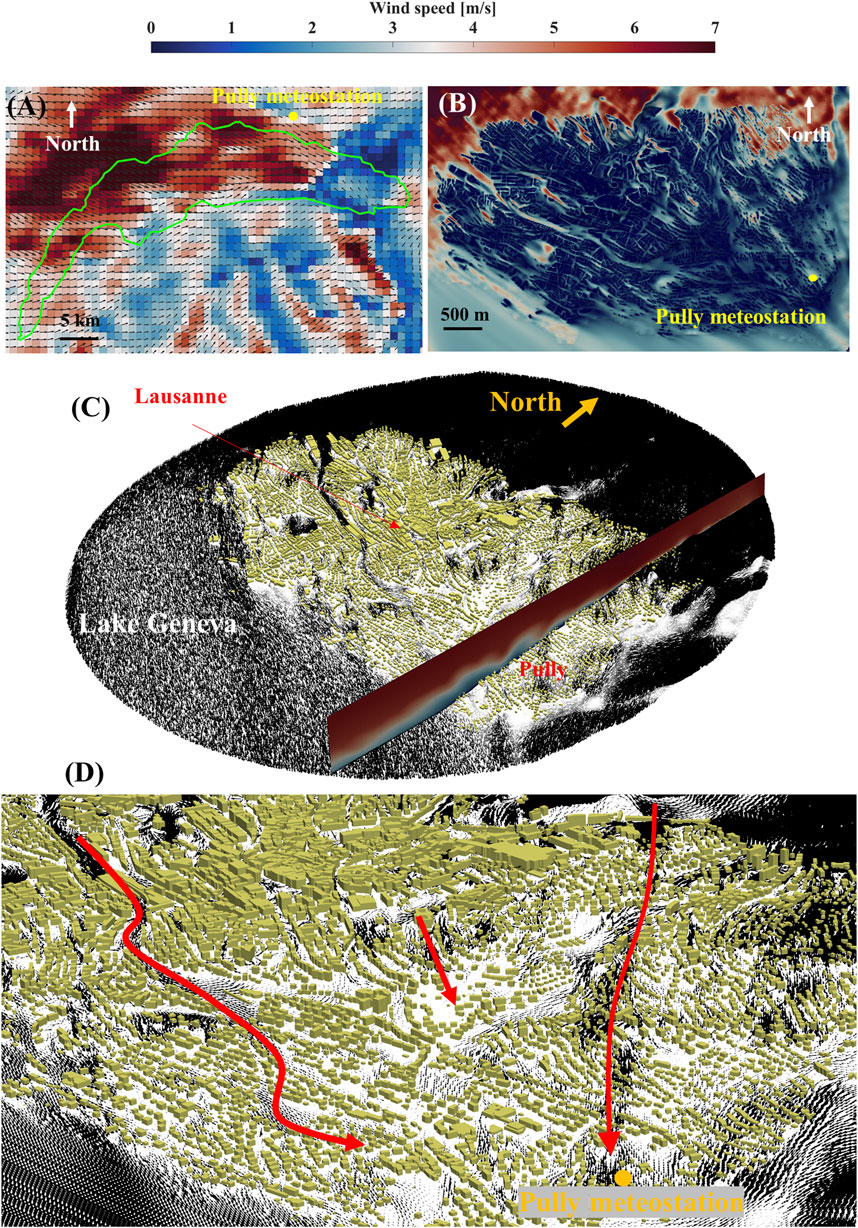
Figure 9. (A) Simulation results of a typical moderate northwest (NW) wind event in the study area using COSMO-1. (B) High-resolution CFD results depicting the wind field at 10 m above ground in Lausanne and Pully. (C) Detailed wind field with a resolution of O (1 m) in the urban areas. (D) Visualization of the channeling pathways formed by NW wind due to the funneling effect.
While COSMO-1 provides valuable insights into mesoscale wind patterns, its limitations necessitate caution and the use of supplementary microscale modeling for accurate wind field assessments in urban areas. Comparing microscale models with COSMO-1 reveals that urban morphology and hilly terrain interactions can cause significant spatial variability in wind fields, depending on wind direction. VMD analysis shows a strong correlation between recorded wind direction data and other meteorological variables, particularly air temperature at the Pully station. As shown in Figures 7–9, Pully station is either downstream or upstream of dominant wind events, and its measurements can be influenced by air conditions in these areas. These effects need to be quantified using air quality indexes.
3.3 Urban surface transport index (USTI) in hilly urban areas
Quantifying the influence of surface winds on air quality necessitates a comprehensive analysis, including factors such as prevailing wind direction, wind speed, and urban surface transport index, USTI (Xie et al., 2022). Prevailing winds play an important role in redistributing heat within a city, either introducing or removing heat depending on their intensity and consistency (Fan et al., 2008). Organized and sustained prevailing winds possess the capability to disperse and carry heat away from urban areas to surrounding areas, thereby mitigating the effect of UHIs or TNs. However, contingent on wind speed and direction, wind may transport heat or pollutants from warmer or polluted upwind regions, potentially reducing air quality in downwind areas (Xie et al., 2019). To evaluate the stability and effectiveness of the wind field in transporting heat between Lausanne and Pully, indicators such as USTI and wind speed can be taken into account. These metrics serve to evaluate the efficient exchange of heat under varying wind directions.
The outputs from the high-resolution CFD model, considering different wind directions and speeds at various heights (2 m–pedestrian level, 5 m, 7.5 m, and 10 m), are utilized to compute the USTI and the distribution of wind velocity within urban areas. The USTI is calculated for approximately 106 computational cells at each height level using Equation 5, which incorporates both zonal and meridional wind speeds. Figure 10A illustrates the USTI variation for different wind directions at various heights above the ground. At the pedestrian level, the USTI is notably low for the wind directions less than 90°, which are indicative of Bise events. As discussed in the previous section, the intricate interplay of topography and urban morphology during Bise events leads to significant wind sheltering and the formation of recirculation wind patterns in both Lausanne and Pully (see Figure 7). These conditions contribute to the emergence of more unpredictable and chaotic wind patterns at the pedestrian level, thereby reducing the transport efficiency of wind in the prevailing direction.
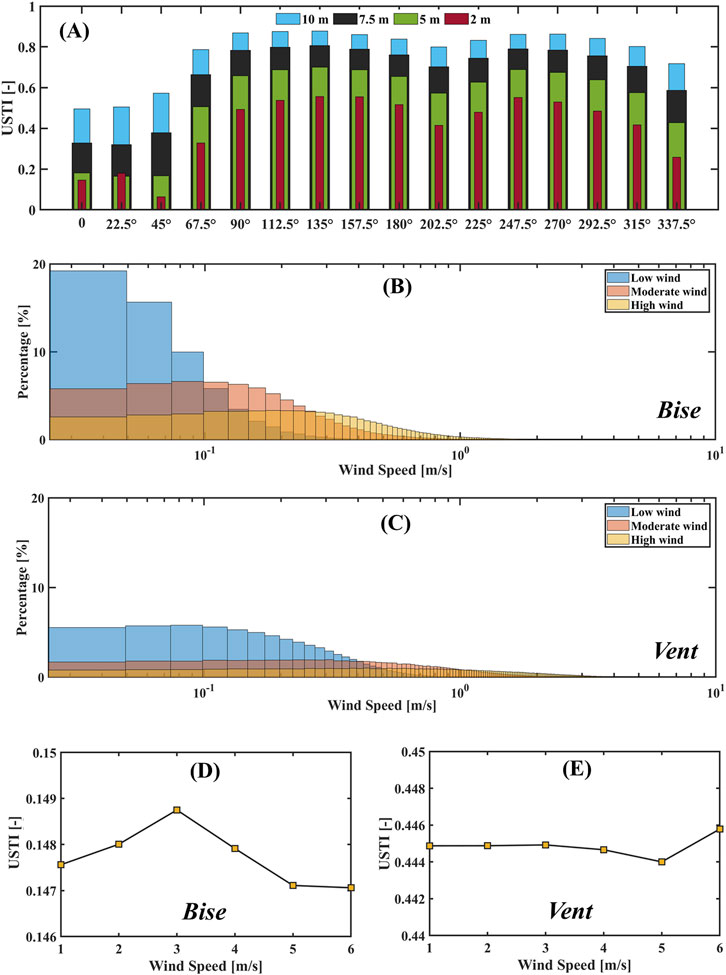
Figure 10. (A) The variation of the average Urban Surface Transport Index (USTI) at various heights above the ground during different moderate and strong wind directions within the urban area. (B) The wind speed distribution at a height of 2 m above the ground during different Bise events. (C) The wind speed distribution at a height of 2 m above the ground in the urban area during different Vent events. (D) The USTI variation at a 2-m height above the ground for different Bise events within the urban area. (E) The variation of USTI at a 2-m height above the ground in the urban area for different Vent events.
Furthermore, Figure 10B illustrates the distribution of wind speeds as a percentage at the pedestrian level across various Bise wind speed categories, encompassing low (1–2 m/s), moderate (2–4 m/s), and high (>4 m/s) wind speeds. During a Bise event, wind speeds at pedestrian level struggle to exceed 1 m/s across all wind categories, primarily due to the sheltering effect of the hills. As wind speed increases, the distribution of wind speeds flattens, resulting in a decrease in the proportion of urban areas experiencing very low wind speeds and stagnation (<0.1 m/s), dropping from approximately 45%–7.5%. Despite the significant reduction in stagnation areas within the city due to increasing wind speed, low USTI values during low to high Bise events indicate turbulent and disorganized wind patterns at the pedestrian level. Consequently, during Bise events, there is an expected decrease in the efficiency of transporting passive and active tracers from upwind to downwind locations. As a result, measurements at Pully, situated downwind of a Bise, are likely to be less influenced by the wind field.
Conversely, USTI values for wind directions exceeding 90° are significantly higher, roughly three times greater than those computed for Bise events (Figure 10A). Given that the Vent events (wind direction 180°–270°) rank as the second most prevalent wind direction in the studied area, the ventilation and transport efficacy facilitated by Vent become more substantial than during Bise events. Distribution of wind speed at pedestrian levels for low to high Vent events are shown in Figure 10C. Stagnation areas during Vent events are significantly less prevalent than in Bise events. At low wind speeds, the percentage of stagnation zones in urban areas is approximately 17%, roughly a third of the stagnation areas simulated during low Bise events. As wind speed increases, the distribution of wind speed becomes almost uniform, with stagnation zones in urban areas decreasing to around 2.5% during strong Vent events.
Both wind speed and USTI values are notably high during Vent events for both moderate and high winds, creating ideal conditions for the efficient transport of passive and active tracers from upwind (Lausanne) to downwind (Pully) during Vent events. A moderate northwest wind field, similar to Vent conditions with high USTI values, also holds the potential to convey heat from Lausanne (upwind) to Pully (downwind). USTI values exhibit less sensitivity to wind speed in urban areas (Figures 10D, E), primarily influenced by the complex interaction of urban forms and terrain features. Moreover, the increase in USTI values with height primarily arises from the reduction in the effect of terrain and buildings on wind direction and speed as elevation increases. These findings strongly suggest that the dispersion of heat/pollution by the wind field can result in significant spatial variability, contingent upon temporal changes in wind direction within a hilly city.
4 Discussion
The factors driving recent European heatwaves, especially the variations among these events, remain poorly understood (Liu et al., 2020). Recent investigations have delineated the complex drivers of these heatwaves, highlighting the significant role of atmospheric circulation anomalies coupled with soil moisture-temperature feedback mechanisms (e.g., Rebetez et al., 2009; Horton et al., 2016; Lhotka et al., 2018; Liu et al., 2020). These studies identify the interaction between omega blocking patterns and adjacent cyclonic systems, which disrupt established weather patterns across Northern Europe. In Switzerland, such disruptions manifest as high-pressure conditions and a south to southwesterly airflow that funnels warm, dry air towards the Alpine region, intensifying local heat conditions. These conditions are exacerbated by clear skies that amplify solar radiation and reduce heat dissipation, creating an environment conducive to heatwave development (Beniston and Diaz, 2004). Soil moisture also plays a crucial role; strong feedback loops accelerate soil desiccation, reducing evaporative cooling and increasing the sensible heat flux into the atmosphere (Seneviratne et al., 2006; Fischer et al., 2007). This is supported by evidence indicating that deficits in soil moisture significantly contribute to temperature anomalies during heatwave periods in Western Europe (Miralles et al., 2014; Stéfanon et al., 2014). Furthermore, diurnal heat advection and nocturnal heat retention deepen the atmospheric boundary layer, promoting heat accumulation and further soil drying. This underscores the intricate interplay between atmospheric conditions and terrestrial feedbacks in shaping the frequency and severity of heatwaves across Europe. In this study, we aimed to elucidate the impact of wind speed and direction on heat advection and retention during extreme weather events in a city situated on complex terrain.
Understanding the interplay between topography, urban morphology, and the wind field in the context of long-term air quality or temperature monitoring in hilly cities can shed light on the challenges associated with pollutant dispersion and natural ventilation of urban areas. This understanding serves as a foundation for developing alternative strategies for urban monitoring, planning, and design tailored to the unique characteristics of such cities (Tian et al., 2019; Liu et al., 2024). The variability of USTI between different wind directions, along with findings from the microscale model, suggests that the spatial dispersion of pollution and heat by wind can exhibit considerable variability. This variability is mainly contingent upon the temporal fluctuations in wind direction within a hilly urban environment. Varied wind patterns can produce distinct natural ventilation dynamics across different city zones. These differences not only shape temperature distribution but also affect air quality and comfort levels within specific sectors of the urban environment (Feddersen et al., 2003; Rotach et al., 2005; Xie et al., 2022).
Consequently, the interpretation and even more so prediction of air quality and meteorological parameters in hilly urban environments becomes a challenging task, potentially influenced by changes in the annual frequency of wind directions and speeds. For example, Pully station, located in the suburban area of Lausanne city on hilly terrain, has been monitoring long-term trends of various meteorological parameters since 1959. Consequently, the measurements are susceptible to being influenced by spatial variability in natural ventilation due to varying wind speeds and directions. The long-term trends of meteorological variables derived from the VMD technique also indicated a notable association between wind direction and air temperature, potentially resulting in nonlinear trends observed in the data recorded at the Pully station. The common coarse Numerical Weather Prediction (NWP) models often neglect to consider the influence of intricate topography and urban morphology. This potentially results in biased forecasts of urban climate if no adequate downscaling scheme is in place. The following sections delve into the impact of wind patterns on both NWP models and field measurements, elucidating how these factors can lead to the observation of nonlinear patterns during extreme events such as TNs in a city with hilly topography.
4.1 Mesoscale model uncertainty in hilly urban areas
COSMO-1 is a widely used NWP model, applied either directly for assessing local climate conditions or for projecting outcomes within specific local regions using diverse downscaling techniques (e.g., Kruyt et al., 2018; Miralles et al., 2022). A significant application of COSMO models involves the evaluation and prediction of short-term or long-term wind patterns, especially within complex terrains or urban areas in Switzerland (Dujardin and Lehning, 2022). This section focuses on comparing predictions of COSMO-1 against the field observation of wind field at the Pully station throughout the entire year of 2022. The aim is to comprehend the impact of complex topography and urban morphology on the biased predictions of the wind field by COSMO-1.
Figure 11A presents the comparisons between the hourly wind speeds simulated by COSMO-1 and the field observations at 10 m above the ground at Pully station, focusing on different wind directions. For the year 2022, the Root Mean Square Error (RMSE) and bias stand at 2.73 m/s and 0.94 m/s, respectively. Notably, Figure 11A illustrates considerable discrepancies between the observed and modeled wind speeds, particularly evident during high winds, with a general trend of the model overestimating wind speeds (i.e., a positive bias). COSMO-1 significantly overestimates southwest winds (Vent) compared to other wind directions. While the model also tends to overestimate northeast winds (Bise) as well, its performance in modeling Vent events is comparatively poorer. Furthermore, COSMO-1 consistently underestimates moderate northwest (NW) winds, which occur less frequently than Bise and Vent.
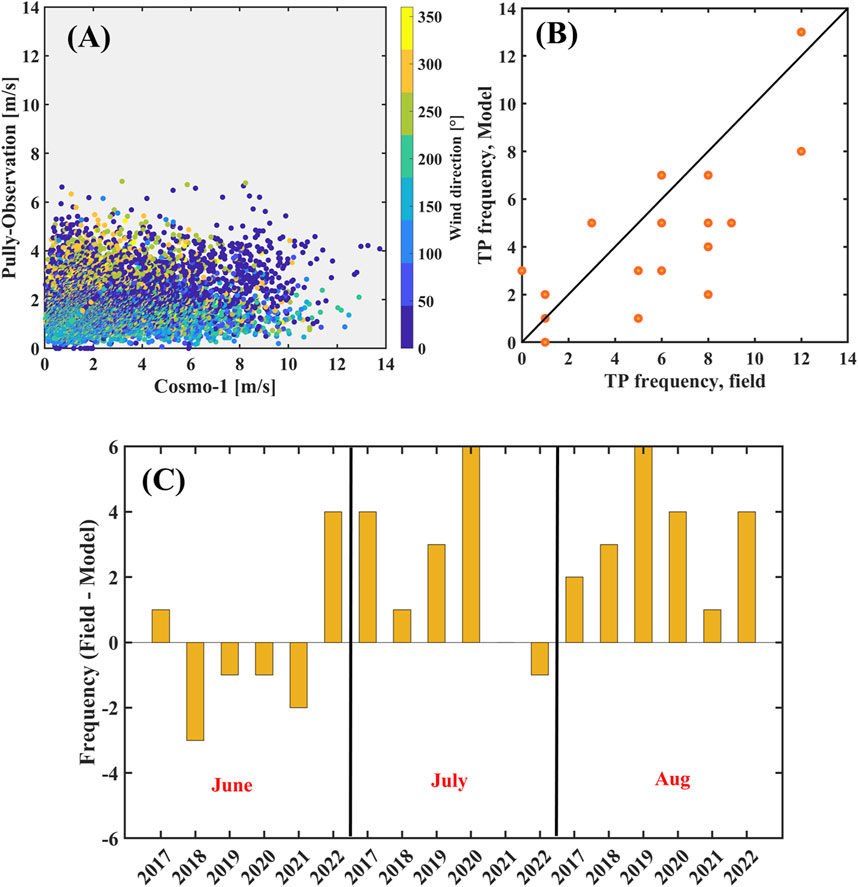
Figure 11. (A) Comparisons between the measured hourly average wind speed and the modeled hourly wind speed by COSMO-1 for the year 2022. (B) The scatter plot illustrating the comparison between the number of TNs modeled by COSMO-1 and the observed TNs at the Pully station during the summer months from 2017 to 2022. (C) Discrepancies in the number of TNs modeled by COSMO-1 compared to observed TNs for the months of June, July, and August.
The wind rose shown in Figure 1C displays the wind patterns for the year 2022, indicating that Bise and Vent winds prevail in Pully. This indicates a tendency of COSMO-1 to significantly overestimate the intensity of these dominant wind events in the urban areas, potentially resulting in an overestimation of natural ventilation provided by moderate or high winds during summertime. Generally, mesoscale models such as COSMO-1 fail to adequately resolve the wind fields induced by urban morphology and complex topography in hilly cities like Lausanne and Pully. Utilizing microclimate models with higher resolutions (O (1–10 m)) specifically designed for urban environments and complex terrains can be a vital tool in uncovering and addressing the systematic errors present in mesoscale models like COSMO-1. For instance, during NW events, the overestimation of wind speeds at Pully station may be attributed to the limitations of the COSMO-1 model in accurately capturing the funneling effects that occur when airflow accelerates through constrained urban areas like streets or valleys in hilly urban environments (refer to Figure 9). Consequently, wind speeds at the Pully station might surpass those in other urban locales, owing to the amplifying effect of nearby buildings and streets.
In general, the COSMO-1 overestimates the natural ventilation provided by the wind field for Vent and NW events. Therefore, it is anticipated that these models will encounter difficulties in accurately predicting extreme events such as Tropical Nights (TNs), which are contingent upon wind speed, in such environments. In Switzerland, TNs occur when the minimum nocturnal temperature exceeds 20°C (Fischer et al., 2022; Rippstein et al., 2023). For instance, Figure 11B presents a comparative analysis of the number of TNs predicted by the COSMO-1 model against those observed at Pully station from 2017 to 2022. Generally, COSMO-1 tends to underestimate the frequency of TNs at Pully station, with this underestimation becoming particularly marked during the peak summer months of July and August, as depicted in Figure 11C. The subsequent section delves into examining the relationship between various wind directions and the frequency of TNs, with the objective of identifying potential factors that contribute to the underestimations observed in the COSMO-1 model.
4.2 Nonlinear response of annual TN frequency to wind direction
The frequency of TNs recorded at Pully station during summer months over the past two decades is shown in Figure 12A. The linear model fitted to the observed TNs demonstrates an annual increase of 0.45 TN per year throughout the 2000s. However, the R2 between this linear trend and the original data stands notably low at 0.16, suggesting a substantially nonlinear trend for these extreme weather events. It is noteworthy to mention that there is a significant difference between the minimum and maximum number of TNs, totaling 29 occurrences, over the studied period. Generally, the occurrence of TNs is more pronounced in July and August compared to June, with varying maximum occurrences observed between these 2 months. However, this trend can be annually quite variable, reflecting fluctuations influenced by a variety of factors. In this study, we focused primarily on the effects of wind fields, urban morphology and topography. However, shifts in the maximum and minimum numbers of TNs between different summer months in Lausanne can be attributed to several additional factors. Meteorologically, varying weather systems and air masses distinctly affect monthly temperatures, with some months experiencing more high-pressure systems that typically lead to warmer nights. The gradual transition of seasons from spring to summer to autumn, coupled with the progressive warming of Lake Geneva and its adjacent land, introduces further variability. These shifts are further complicated by broad climatic phenomena such as El Niño or La Niña, which globally influence weather patterns and, consequently, impact local seasonal conditions in Switzerland. Generally, such trends recorded in urban residential areas situated within a temperate region can be both surprising and concerning.
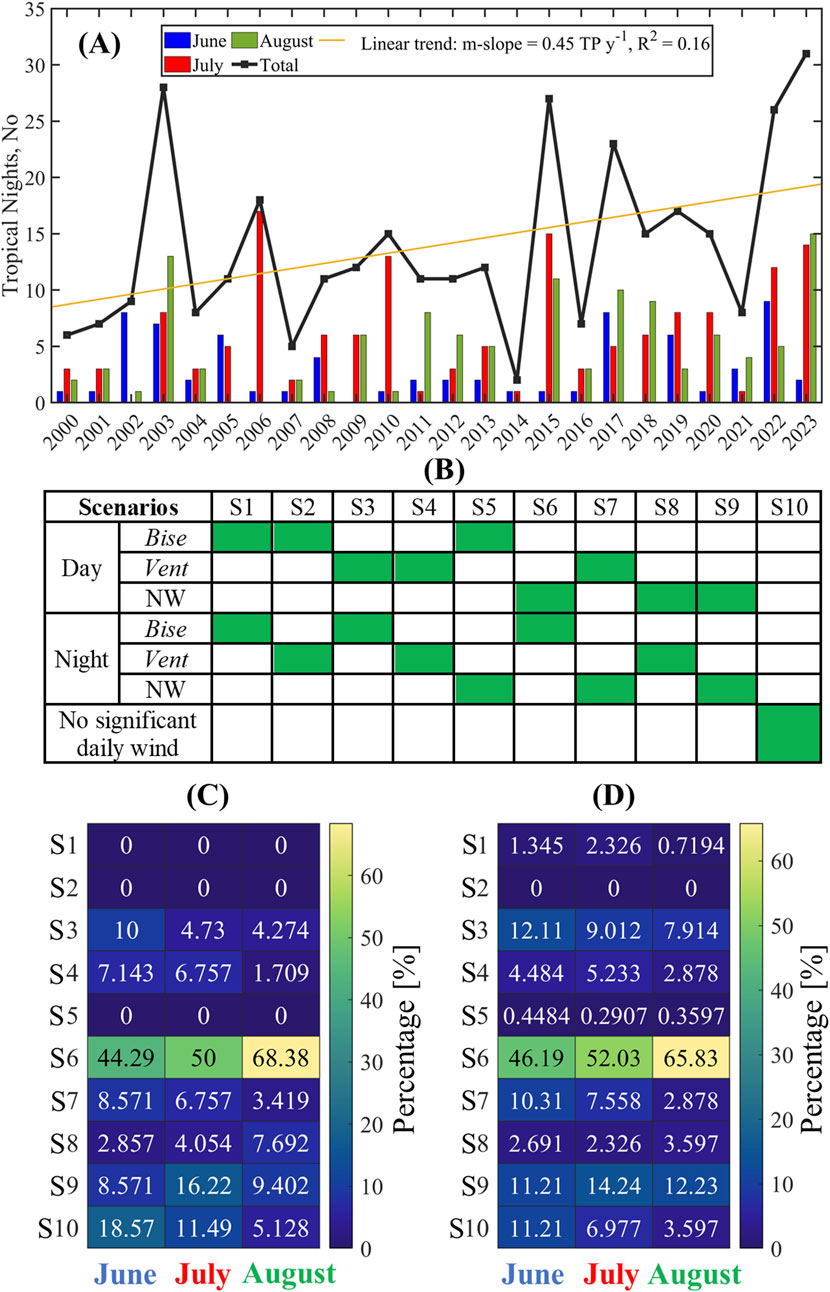
Figure 12. (A) Historical variations in the frequency of tropical nights (TNs) recorded at Pully station across various summer months: June, July, and August. (B) Various scenarios considered for diurnal and nocturnal variations of wind direction. (C) Percentage of TNs recorded at Pully station corresponding to different wind direction scenarios. (D) Percentage of hot nights with a minimum temperature average of 20°C recorded at Pully station for different wind direction scenarios.
To further assess the trends and their significance identified, the non-parametric Seasonal Mann-Kendall test is utilized to analyze the monthly data (Hirsch et al., 1982; Mahmood et al., 2019). This test excels in detecting monotonic trends, whether increasing or decreasing, over time without necessitating a specific data distribution, thereby offering robustness in trend analysis. Specifically, the analysis focused on the frequency of TPs recorded from 2000 to 2023. The test statistic (Tau) was determined to be 0.33, indicating a clear positive trend. This trend was found to be statistically significant with a p-value of 0.025, which is below the standard significance threshold of 0.05. The low p-value provides strong evidence that the observed positive trend is not attributable to random variations. Due to its non-parametric nature, the Mann-Kendall test demonstrates resilience against non-normal data distributions and outliers, further strengthening the evidence for an upward trend over the analyzed period. Additionally, the Shapiro-Wilk test was employed to evaluate the normality of the dataset for the same timeframe (Shapiro and Wilk, 1965). This test returned a statistic of 0.91 with a p-value of 0.052 for the original data, and a statistic of 0.93 with a p-value of 0.10 for the residuals from the linear regression analysis. Since both p-values exceed the 0.05 threshold, the null hypothesis that the data follows a normal distribution cannot be rejected. This outcome suggests that both the original dataset and the regression residuals reasonably approximate a normal distribution. The confirmation of normality by the Shapiro-Wilk test supports the application of parametric methods for further analyses.
The VMD analysis has demonstrated that the nocturnal air temperature at Pully exhibits a significant dependency on wind direction. Additionally, the evaluation of the USTI parameter has revealed that the correlation between air quality in Lausanne and Pully is subject to considerable variability. This variability is influenced by the differing heat transport capacities associated with various wind directions. To clarify the impact of the wind field on the natural ventilation of Lausanne and Pully and the frequency of TNs, ten different wind scenarios based on moderate and strong diurnal and nocturnal averages of prevailing wind speed (>1.8 m/s) with various dominant directions, as illustrated in Figure 12B, are considered. The synchronization of TN occurrences with the different wind scenarios is then scrutinized. The concurrent incidence of TN and various wind scenarios, expressed as a percentage, is depicted in Figure 12C, D for various summer months spanning the last two decades. Note that the wind scenarios with average speeds exceeding 1.8 m/s are categorized as moderate or strong wind events and the buoyancy effects can be neglected for such winds (Boulard et al., 1996; Tecle et al., 2013). As shown, the occurrence of TNs is more frequent during scenarios akin to S6, characterized by a moderate or strong NW wind field during the day and a NE (Bise) wind during the night.
The NW wind pattern is critical for heat transport from Lausanne, a warmer dense urban area, to Pully, a cooler suburban region, predominantly due to funneling effects influenced by urban features (as illustrated in Figures 8, 9). The NW winds delineate three primary wind channels facilitating the exchange of urban climatic influences between Lausanne and Pully. The urban landscape of Lausanne, characterized by high-density construction and tall buildings, facilitates the accumulation of heat during heatwave conditions. In scenario S6, moderate NW winds during the day facilitate the transfer of accumulated heat from Lausanne to the Pully station amid a heatwave, potentially impacting the recorded air temperature at Pully station. Nonetheless, with wind speeds below 3.5 m/s across all cases, complete dispersion and transport of heat from urban areas remain elusive, impeding complete ventilation in both cities. Furthermore, the predominance of the Bise wind during the night in scenario S6 implies restricted ventilation, attributed to the obstructive influence of upstream terrain (refer to Figure 7). This could potentially lead to the entrainment of transported heat from Lausanne to Pully during nighttime.
In scenario S10, which is characterized by the absence of significant wind events (i.e., wind speeds < 1.8 m/s) during both daytime and nighttime at the Pully station, the occurrence of tropical nights (TNs) is negligible compared to scenario S6. This observation highlights the critical role of spatial variability induced by the wind field in long-term analyses of extreme events within a hilly urban environment. Such analyses are particularly challenging when relying solely on a limited number of fixed meteorological stations. A primary concern is establishing whether a systematic correlation exists between extreme events and specific wind patterns.
For a better illustration, the time series analysis of TNs and the occurrence of S6 wind scenario for different summer months over the past two decades is given in Supplementary Figure S2. There is a strong correlation between these two time series across different months, with correlation coefficients (R values) of 0.58, 0.67, and 0.69 for June, July, and August, respectively. The corresponding p-values, calculated as 0.005, 0.0007, and 0.0004 for June, July, and August, indicate the statistical significance of the correlation between the frequency of TNs and the occurrence of S6 for each month. Interestingly, this correlation is observed to be as strong as that with the global radiation parameter. The scatter plots depicting the relationship between the frequency of TNs and S6, along with the fitted linear regression lines, are presented in Supplementary Figure S2 for various months. The slope of the regression lines is 0.87, 0.93, and 1.23 TNs per the frequency of S6 scenario for June, July, and August, respectively. This suggests that the irregular occurrence of the S6 wind pattern annually can significantly influence the frequency of TNs recorded at the Pully station, thus contributing to the observed nonlinear trends in TN frequencies at the station over the past 20 years. In summary, these findings highlight the critical necessity of integrating resilience techniques that account for the influence of microscale wind fields in urban environments situated over complex terrains during extreme event analyses. This consideration is essential for informing effective strategies to enhance urban resilience against environmental threats.
Effective urban planning to address climate-driven risks relies on accurate climate projections tailored to urban environments (Zhao et al., 2021). However, these projections are currently scarce due to the widespread absence of urban morphology in global-scale Earth system models (Zou et al., 2023). A combination of climate modeling and data-driven methods is commonly utilized to generate global multi-model projections of urban climates (Zhao et al., 2021). For example, empirical-statistical downscaling methods like quantile mapping have been employed to produce multi-model climate projections of intense urban heat (e.g., Burgstall et al., 2021; He Y. et al., 2022). Since existing meteorological stations are primarily located in suburban or rural areas, climate model simulations are first bias-corrected to long-term measurements at rural or suburban stations and then spatially transferred to the respective urban target sites (Rajczak et al., 2016). However, as demonstrated in the present study, both long-term field observations in the suburban areas of hilly cities and mesoscale climate simulations can systematically result in underestimation/overestimation of extreme events in both urban and rural areas depending on prevailing wind directions. Utilizing such downscaling methods, which heavily rely on data recorded at rural sites, may introduce significant uncertainty in future urban climate projections in hilly urban environments, necessitating the adoption of new projection methodologies for such cities.
5 Summary and conclusion
The influence of localized wind flows on extreme weather phenomena, including urban heat islands (UHIs), has been extensively explored. Yet, there remains a substantial gap in our understanding of how complex topographical features—such as hilly terrains, medium-sized inland water bodies, and intricate urban layouts—impact the uncertainty and nonlinearity inherent in long-term meteorological datasets. These factors are crucial as they can profoundly influence predictive modeling and the interpretation of climatic data, potentially leading to inaccuracies in estimating the severity and frequency of extreme weather conditions in urban areas. This study addresses these complexities by examining the impacts of wind fields on long-term meteorological trends, specifically tropical nights (TNs) in regions like Lausanne/Pully, Switzerland, characterized by both lakeshore and mountainous landscapes. A comprehensive analysis was conducted by integrating the numerical results from both a mesoscale model (COSMO-1) and a high-resolution CFD model implemented in OpenFOAM V8.1, along with field observations and statistical analyses. The integrated approach was applied to investigate the impact of wind patterns on the nonlinearity observed in long-term trends of meteorological variables, collected from typical lakeshore and hilly cities. Upon comparison with field observations, it was noted that COSMO-1 consistently either overestimated or underestimated wind speeds in the urban areas. Notably, the overestimation of wind field was more pronounced during specific wind patterns, which are a combination of the large-scale flow modified by local topography and thermal effects. Delving deeper into the investigation, the validated high-resolution microscale CFD model was used to illustrate the intricate roles played by the complex terrains and the urban morphology in shaping various wind patterns in the studied area. This detailed examination not only provided insights into the sources contributing to the overestimation/underestimation of wind speed by COSMO-1 but also offered a clear understanding of how local topography and urban features interact to impact other meteorological parameters recorded at a fixed station located in a suburban region (Pully).
The variational mode decomposition (VMD) method was used to extract the interannual, annual and seasonal trends of different meteorological parameters recorded at Pully station, then the statistical correlations among the extracted trends were scrutinized. The results interestingly suggested a significant negative correlation between long-term trends of air temperature and wind direction during day and night at Pully station while the effect of wind speed was insignificant. The microscale CFD results indicated that the natural ventilation of cities situated in hilly and lakeshore regions could vary significantly depending on the prevailing wind direction. In our case study, when downhill (Bise) winds dominate, the city’s natural ventilation was impeded mainly due to topographic sheltering effects. The urban surface transport index (USTI) was also used to quantify the effective transport and dispersion of pollution and heat from the urban to suburban or rural environments for different dominant wind directions. The results indicated that the USTI values for Vent and northwest winds are almost three times larger than that of Bise (northeast). Consequently, the natural ventilation provided by the wind in transport of heat-related pollution could be quite variable depending on the annual change in the frequency of dominant wind directions in such hilly cities. This reveals the critical influences of wind direction, topography and urban morphology on natural ventilation in hilly and lakeshore cities, enhancing our understanding of the observed correlations between wind patterns and long-term air temperature trends.
Extreme heat-related events, exemplified by TNs at the Pully station, situated in suburban areas within a temperate region, exhibited a surprising non-linear increase based on long-term field measurements. An analysis of annual data on TNs at Pully revealed a discernible correlation with monthly changes in wind patterns during summer days and nights. Although the fitted linear regression model suggested a 0.45 annual increase in TNs during the 2000s, the low correlation coefficient between the linear fitted model and the recorded data indicated a substantial non-linear trend. The statistical analysis pointed out that the occurrence of TNs at Pully was more frequent during specific wind patterns, especially when urban heat advection by a moderate or strong northwest wind field during the day transported heat from dense urban areas to more rural areas. This process was exacerbated during the night due to minimal natural ventilation caused by the Bise event. As a consequence, this interaction was identified as a potential contributor to the irregular annual upsurge in TNs recorded at Pully station.
Furthermore, it was demonstrated that the use of the mesoscale model, which inadequately resolved urban morphology and complex terrain, resulted in an underestimation of TN occurrences in urban areas. The mesoscale model tended to overestimate the natural ventilation provided by the wind in urban areas, systematically resulting in an underestimation of extreme events such as TNs. The global, regional, and mesoscale models currently used to estimate present and future urban climates and energy systems feature coarse resolutions. This limitation hinders their ability to capture the complex interactions among various urban components and intricate terrains. Future urban climatic scenarios predominantly utilize downscaling techniques that rely on bias-correction methods based on recorded field data, such as those from the Pully station. However, the physical processes occurring in hilly urban environments can influence the long-term records of meteorological parameters at these stations, introducing nonlinearity into the climatic data. This nonlinearity, in turn, adds further uncertainty to the downscaling techniques that depend on such recorded data for model correction and refinement. Therefore, this study highlights the necessity of combining mesoscale and microscale models with observational data to accurately capture wind dynamics in urban settings. This integrated approach provides a nuanced understanding of simulating long-term meteorological conditions, particularly in areas with complex topography and urban landscapes.
Data availability statement
The raw data supporting the conclusions of this article will be made available by the authors, without undue reservation.
Author contributions
SH-Z: Conceptualization, Data curation, Formal Analysis, Investigation, Methodology, Software, Validation, Visualization, Writing–original draft. MJ: Writing–review and editing. HH: Writing–review and editing. ML: Funding acquisition, Project administration, Resources, Supervision, Writing–review and editing.
Funding
The author(s) declare that financial support was received for the research, authorship, and/or publication of this article. All authors are part of the UrbanTwin and/or SPEED2ZERO Joint Initiative which received support from the ETH-Board under the Joint Initiatives scheme.
Acknowledgments
This research was supported by the UrbanTwin and Speed2zero projects. We gratefully acknowledge the Federal Office of Meteorology and Climatology in Switzerland (MeteoSwiss) for providing the meteorological data essential to this study.
Conflict of interest
The authors declare that the research was conducted in the absence of any commercial or financial relationships that could be construed as a potential conflict of interest.
Publisher’s note
All claims expressed in this article are solely those of the authors and do not necessarily represent those of their affiliated organizations, or those of the publisher, the editors and the reviewers. Any product that may be evaluated in this article, or claim that may be made by its manufacturer, is not guaranteed or endorsed by the publisher.
Supplementary material
The Supplementary Material for this article can be found online at: https://www.frontiersin.org/articles/10.3389/fenvs.2024.1438917/full#supplementary-material
References
Acosta, M. P., Vahdatikhaki, F., Santos, J., Jarro, S. P., and Dorée, A. G. (2024). Data-driven analysis of Urban Heat Island phenomenon based on street typology. Sustain. Cities Soc. 101, 105170. doi:10.1016/j.scs.2023.105170
Akbari, H., and Kolokotsa, D. (2016). Three decades of urban heat islands and mitigation technologies research. Energy Build. 133, 834–842. doi:10.1016/j.enbuild.2016.09.067
Alexander, L. V., Zhang, X., Peterson, T. C., Caesar, J., Gleason, B., Klein Tank, A. M. G., et al. (2006). Global observed changes in daily climate extremes of temperature and precipitation. J. Geophys. Res. Atmos. 111 (D5). doi:10.1029/2005jd006290
Ali, M., Khan, A., and Rehman, N. U. (2018). Hybrid multiscale wind speed forecasting based on variational mode decomposition. Int. Trans. Electr. Energy Syst. 28 (1), e2466. doi:10.1002/etep.2466
Alonso, M. S., Labajo, J. L., and Fidalgo, M. R. (2003). Characteristics of the urban heat island in the city of Salamanca, Spain. Atmósfera 16 (3), 137–148.
Back, Y., Kumar, P., Bach, P. M., Rauch, W., and Kleidorfer, M. (2023). Integrating CFD-GIS modelling to refine urban heat and thermal comfort assessment. Sci. Total Environ. 858, 159729. doi:10.1016/j.scitotenv.2022.159729
Barlow, J. F. (2014). Progress in observing and modelling the urban boundary layer. Urban Clim. 10, 216–240. doi:10.1016/j.uclim.2014.03.011
Beniston, M., and Diaz, H. F. (2004). The 2003 heat wave as an example of summers in a greenhouse climate? Observations and climate model simulations for Basel, Switzerland. Glob. Planet. change 44 (1-4), 73–81. doi:10.1016/j.gloplacha.2004.06.006
Berkovic, S. (2016). Synoptic classes as a predictor of hourly surface wind regimes: the case of the central and southern Israeli coastal plains. J. Appl. Meteorology Climatol. 55 (7), 1533–1547. doi:10.1175/jamc-d-16-0093.1
Boulard, T., Meneses, J. F., Mermier, M., and Papadakis, G. (1996). The mechanisms involved in the natural ventilation of greenhouses. Agric. For. meteorology 79 (1-2), 61–77. doi:10.1016/0168-1923(95)02266-x
Buguet, A. (2007). Sleep under extreme environments: effects of heat and cold exposure, altitude, hyperbaric pressure and microgravity in space. J. neurological Sci. 262 (1-2), 145–152. doi:10.1016/j.jns.2007.06.040
Burgstall, A., Kotlarski, S., Casanueva, A., Hertig, E., Fischer, E., and Knutti, R. (2021). Urban multi-model climate projections of intense heat in Switzerland. Clim. Serv. 22, 100228. doi:10.1016/j.cliser.2021.100228
Cao, S., Wang, T., Ge, Y., and Tamura, Y. (2012). Numerical study on turbulent boundary layers over two-dimensional hills—effects of surface roughness and slope. J. wind Eng. industrial aerodynamics 104, 342–349. doi:10.1016/j.jweia.2012.02.022
Dragomiretskiy, K., and Zosso, D. (2013). Variational mode decomposition. IEEE Trans. signal Process. 62 (3), 531–544. doi:10.1109/tsp.2013.2288675
Du, R., Liu, C. H., Li, X., and Lin, C. Y. (2024). Interaction among local flows, UHI, coastal winds, and complex terrain: effect on urban-scale temperature and building energy consumption during heatwaves. Energy Build. 303, 113763. doi:10.1016/j.enbuild.2023.113763
Duetsch-Patel, J. E., Gargiulo, A., Borgoltz, A., Devenport, W. J., and Lowe, K. T. (2023). Structural aspects of the attached turbulent boundary layer flow over a hill. Exp. Fluids 64 (2), 38. doi:10.1007/s00348-023-03580-4
Dujardin, J., and Lehning, M. (2022). Wind-Topo: downscaling near-surface wind fields to high-resolution topography in highly complex terrain with deep learning. Q. J. R. Meteorological Soc. 148 (744), 1368–1388. doi:10.1002/qj.4265
Elgendi, M., AlMallahi, M., Abdelkhalig, A., and Selim, M. Y. (2023). A review of wind turbines in complex terrain. Int. J. Thermofluids 17, 100289. doi:10.1016/j.ijft.2023.100289
Fan, S., Wang, B., Tesche, M., Engelmann, R., Althausen, A., Liu, J., et al. (2008). Meteorological conditions and structures of atmospheric boundary layer in October 2004 over Pearl River Delta area. Atmos. Environ. 42 (25), 6174–6186. doi:10.1016/j.atmosenv.2008.01.067
Feddersen, B., Leitl, B., Rotach, M. W., and Schatzmann, M. (2003). “Wind tunnel investigation of the spatial variability of turbulence characteristics in the urban area of Basel City, Switzerland,” in Proceedings PHYSMOD2003, Prato, Italy, 3-5 September 2003, 3–5.
Feng, Z. K., Niu, W. J., Tang, Z. Y., Jiang, Z. Q., Xu, Y., Liu, Y., et al. (2020). Monthly runoff time series prediction by variational mode decomposition and support vector machine based on quantum-behaved particle swarm optimization. J. Hydrology 583, 124627. doi:10.1016/j.jhydrol.2020.124627
Fischer, A. M., Strassmann, K. M., Croci-Maspoli, M., Hama, A. M., Knutti, R., Kotlarski, S., et al. (2022). Climate scenarios for Switzerland CH2018–approach and implications. Clim. Serv. 26, 100288. doi:10.1016/j.cliser.2022.100288
Fischer, E. M., Oleson, K. W., and Lawrence, D. M. (2012). Contrasting urban and rural heat stress responses to climate change. Geophys. Res. Lett. 39 (3). doi:10.1029/2011gl050576
Fischer, E. M., Seneviratne, S. I., Lüthi, D., and Schär, C. (2007). Contribution of land-atmosphere coupling to recent European summer heat waves. Geophys. Res. Lett. 34 (6), L06707. doi:10.1029/2006gl029068
Franke, J. (2006). “Recommendations of the COST action C14 on the use of CFD in predicting pedestrian wind environment,” in The fourth international symposium on computational wind engineering (Yokohama, Japan: Citeseer), 529–532.
Gan, M., Pan, H., Chen, Y., and Pan, S. (2021). Application of the variational mode decomposition (VMD) method to river tides. Estuar. Coast. Shelf Sci. 261, 107570. doi:10.1016/j.ecss.2021.107570
Gao, Y., Yao, R., Li, B., Turkbeyler, E., Luo, Q., and Short, A. (2012). Field studies on the effect of built forms on urban wind environments. Renew. Energy 46, 148–154. doi:10.1016/j.renene.2012.03.005
Guo, F., Zhang, H., Fan, Y., Zhu, P., Wang, S., Lu, X., et al. (2018). Detection and evaluation of a ventilation path in a mountainous city for a sea breeze: the case of Dalian. Build. Environ. 145, 177–195. doi:10.1016/j.buildenv.2018.09.010
Guo, F., Zhao, J., Zhang, H., Dong, J., Zhu, P., and Lau, S. S. Y. (2023). Effects of urban form on sea cooling capacity under the heatwave. Sustain. Cities Soc. 88, 104271. doi:10.1016/j.scs.2022.104271
He, W., Zhang, L., and Yuan, C. (2022b). Future air temperature projection in high-density tropical cities based on global climate change and urbanization–a study in Singapore. Urban Clim. 42, 101115. doi:10.1016/j.uclim.2022.101115
He, Y., Yuan, C., Ren, C., and Ng, E. (2022a). Urban ventilation assessment with improved vertical wind profile in high-density cities–Comparisons between LiDAR and conventional methods. J. Wind Eng. Industrial Aerodynamics 228, 105116. doi:10.1016/j.jweia.2022.105116
Hirsch, R. M., Slack, J. R., and Smith, R. A. (1982). Techniques of trend analysis for monthly water quality data. Water Resour. Res. 18 (1), 107–121. doi:10.1029/wr018i001p00107
Horton, R. M., Mankin, J. S., Lesk, C., Coffel, E., and Raymond, C. (2016). A review of recent advances in research on extreme heat events. Curr. Clim. Change Rep. 2, 242–259. doi:10.1007/s40641-016-0042-x
Huang, J., Chen, Y., Jones, P., and Hao, T. (2022). Heat stress and outdoor activities in open spaces of public housing estates in Hong Kong: a perspective of the elderly community. Indoor Built Environ. 31 (6), 1447–1463. doi:10.1177/1420326x20950448
Johnson, G. T., and Hunter, L. J. (1998). Urban wind flows: wind tunnel and numerical simulations—a preliminary comparison. Environ. Model. and Softw. 13 (3-4), 279–286. doi:10.1016/s1364-8152(98)00028-0
Juan, Y. H., Wen, C. Y., Chen, W. Y., and Yang, A. S. (2021). Numerical assessments of wind power potential and installation arrangements in realistic highly urbanized areas. Renew. Sustain. Energy Rev. 135, 110165. doi:10.1016/j.rser.2020.110165
Jung, M., Park, M., Lee, H. S., and Kim, H. (2016). Weather-delay simulation model based on vertical weather profile for high-rise building construction. J. Constr. Eng. Manag. 142 (6), 04016007. doi:10.1061/(asce)co.1943-7862.0001109
Kastner, P., and Dogan, T. (2020). A cylindrical meshing methodology for annual urban computational fluid dynamics simulations. J. Build. Perform. Simul. 13 (1), 59–68. doi:10.1080/19401493.2019.1692906
Khaliq, M. N., Ouarda, T. B., Ondo, J. C., Gachon, P., and Bobée, B. (2006). Frequency analysis of a sequence of dependent and/or non-stationary hydro-meteorological observations: a review. J. hydrology 329 (3-4), 534–552. doi:10.1016/j.jhydrol.2006.03.004
Krayenhoff, E. S., and Voogt, J. A. (2007). A microscale three-dimensional urban energy balance model for studying surface temperatures. Boundary-Layer Meteorol. 123, 433–461. doi:10.1007/s10546-006-9153-6
Kruyt, B., Dujardin, J., and Lehning, M. (2018). Improvement of wind power assessment in complex terrain: the case of COSMO-1 in the Swiss Alps. Front. Energy Res. 6, 102. doi:10.3389/fenrg.2018.00102
Leuenberger, D., Koller, M., Fuhrer, O., and Schär, C. (2010). A generalization of the SLEVE vertical coordinate. Mon. Weather Rev. 138 (9), 3683–3689. doi:10.1175/2010mwr3307.1
Lhotka, O., Kyselý, J., and Plavcová, E. (2018). Evaluation of major heat waves’ mechanisms in EURO-CORDEX RCMs over Central Europe. Clim. Dyn. 50, 4249–4262. doi:10.1007/s00382-017-3873-9
Li, Q., Chen, J., and Luo, X. (2024). Estimating omnidirectional urban vertical wind speed with direction-dependent building morphologies. Energy Build. 303, 113749. doi:10.1016/j.enbuild.2023.113749
Liu, X., He, B., Guo, L., Huang, L., and Chen, D. (2020). Similarities and differences in the mechanisms causing the European summer heatwaves in 2003, 2010, and 2018. Earth's Future 8 (4), e2019EF001386. doi:10.1029/2019ef001386
Liu, Y. S., Yigitcanlar, T., Guaralda, M., Degirmenci, K., and Liu, A. (2024). Spatial modelling of urban wind characteristics: review of contributions to sustainable urban development. Buildings 14 (3), 737. doi:10.3390/buildings14030737
Lu, Z., Tao, R., Xiao, R., and Li, P. (2024). Forecasting the hydropower unit vibration based on adaptive variational mode decomposition and neural network. Appl. Soft Comput. 150, 111040. doi:10.1016/j.asoc.2023.111040
Lun, Y. F., Mochida, A., Murakami, S., Yoshino, H., and Shirasawa, T. (2003). Numerical simulation of flow over topographic features by revised k–ε models. J. Wind Eng. Industrial Aerodynamics 91 (1-2), 231–245. doi:10.1016/s0167-6105(02)00348-3
Luo, F., Yang, Y., Zong, L., and Bi, X. (2023). The interactions between urban heat island and heat waves amplify urban warming in Guangzhou, China: roles of urban ventilation and local climate zones. Front. Environ. Sci. 11, 1084473. doi:10.3389/fenvs.2023.1084473
Mahmood, R., Jia, S., and Zhu, W. (2019). Analysis of climate variability, trends, and prediction in the most active parts of the Lake Chad basin, Africa. Sci. Rep. 9 (1), 6317. doi:10.1038/s41598-019-42811-9
Marini, M., Chokani, N., and Abhari, R. S. (2019). Immigration and future housing needs in Switzerland: agent-based modelling of agglomeration Lausanne. Comput. Environ. Urban Syst. 78, 101400. doi:10.1016/j.compenvurbsys.2019.101400
Mei, S. J., Hu, J. T., Liu, D., Zhao, F. Y., Li, Y., Wang, Y., et al. (2017). Wind driven natural ventilation in the idealized building block arrays with multiple urban morphologies and unique package building density. Energy Build. 155, 324–338. doi:10.1016/j.enbuild.2017.09.019
Mei, S. J., and Yuan, C. (2022). Urban buoyancy-driven air flow and modelling method: a critical review. Build. Environ. 210, 108708. doi:10.1016/j.buildenv.2021.108708
Meng, A., Xie, Z., Luo, J., Zeng, Y., Xu, X., Li, Y., et al. (2023). An adaptive variational mode decomposition for wind power prediction using convolutional block attention deep learning network. Energy 282, 128945. doi:10.1016/j.energy.2023.128945
Meng, M. R., Xi, C., Feng, Z., and Cao, S. J. (2022). Environmental co-benefits of urban design to mitigate urban heat island and PM2. 5 pollution: considering prevailing wind’s effects. Indoor Built Environ. 31 (7), 1787–1805. doi:10.1177/1420326x221076815
Minor, K., Bjerre-Nielsen, A., Jonasdottir, S. S., Lehmann, S., and Obradovich, N. (2022). Rising temperatures erode human sleep globally. One Earth 5 (5), 534–549. doi:10.1016/j.oneear.2022.04.008
Miralles, D. G., Teuling, A. J., Van Heerwaarden, C. C., and Vilà-Guerau de Arellano, J. (2014). Mega-heatwave temperatures due to combined soil desiccation and atmospheric heat accumulation. Nat. Geosci. 7 (5), 345–349. doi:10.1038/ngeo2141
Miralles, O., Steinfeld, D., Martius, O., and Davison, A. C. (2022). Downscaling of historical wind fields over Switzerland using generative adversarial networks. Artif. Intell. Earth Syst. 1 (4), e220018. doi:10.1175/aies-d-22-0018.1
Mirzaei, P. A., and Haghighat, F. (2010). Approaches to study urban heat island–abilities and limitations. Build. Environ. 45 (10), 2192–2201. doi:10.1016/j.buildenv.2010.04.001
Nikkho, S. K., Heidarinejad, M., Liu, J., and Srebric, J. (2017). Quantifying the impact of urban wind sheltering on the building energy consumption. Appl. Therm. Eng. 116, 850–865. doi:10.1016/j.applthermaleng.2017.01.044
Obradovich, N., Migliorini, R., Mednick, S. C., and Fowler, J. H. (2017). Nighttime temperature and human sleep loss in a changing climate. Sci. Adv. 3 (5), e1601555. doi:10.1126/sciadv.1601555
Palme, M., and Salvati, A. (2021). Urban microclimate modelling for comfort and energy studies. Springer Nature.
Panda, J., Mukherjee, A., Choudhury, A., and Biswas, S. (2024). “Urban heat: UHI and heat stress threat to megacities,” in Climate crisis: adaptive approaches and sustainability (Switzerland: Springer Nature), 425–445.
Potsis, T., Tominaga, Y., and Stathopoulos, T. (2023). Computational wind engineering: 30 years of research progress in building structures and environment. J. Wind Eng. Industrial Aerodynamics 234, 105346. doi:10.1016/j.jweia.2023.105346
Raderschall, N., Lehning, M., and Schär, C. (2008). Fine-scale modeling of the boundary layer wind field over steep topography. Water Resour. Res. 44 (9). doi:10.1029/2007WR006544
Ragettli, M. S., Vicedo-Cabrera, A. M., Schindler, C., and Röösli, M. (2017). Exploring the association between heat and mortality in Switzerland between 1995 and 2013. Environ. Res. 158, 703–709. doi:10.1016/j.envres.2017.07.021
Rajczak, J., Kotlarski, S., Salzmann, N., and Schaer, C. (2016). Robust climate scenarios for sites with sparse observations: a two-step bias correction approach. Int. J. Climatol. 36 (3), 1226–1243. doi:10.1002/joc.4417
Rebetez, M., Dupont, O., and Giroud, M. (2009). An analysis of the July 2006 heatwave extent in Europe compared to the record year of 2003. Theor. Appl. Climatol. 95, 1–7. doi:10.1007/s00704-007-0370-9
Rippstein, V., de Schrijver, E., Eckert, S., and Vicedo-Cabrera, A. M. (2023). Trends in tropical nights and their effects on mortality in Switzerland across 50 years. PLoS Clim. 2 (4), e0000162. doi:10.1371/journal.pclm.0000162
Rotach, M. W., Vogt, R., Bernhofer, C., Batchvarova, E., Christen, A., Clappier, A., et al. (2005). BUBBLE–an urban boundary layer meteorology project. Theor. Appl. Climatol. 81, 231–261. doi:10.1007/s00704-004-0117-9
Roth, M. (2012). “Urban heat islands,” in Handbook of environmental fluid dynamics, volume two (United States: CRC Press), 162–181.
Sanches, F. H., Martins, F. R., Conti, W. R., and Christofoletti, R. A. (2023). The increase in intensity and frequency of surface air temperature extremes throughout the western South Atlantic coast. Sci. Rep. 13 (1), 6293. doi:10.1038/s41598-023-32722-1
Schär, C., Leuenberger, D., Fuhrer, O., Lüthi, D., and Girard, C. (2002). A new terrain-following vertical coordinate formulation for atmospheric prediction models. Mon. Weather Rev. 130 (10), 2459–2480. doi:10.1175/1520-0493(2002)130<2459:antfvc>2.0.co;2
Scherer, D., Fehrenbach, U., Lakes, T., Lauf, S., Meier, F., and Schuster, C. (2013). Quantification of heat-stress related mortality hazard, vulnerability and risk in Berlin, Germany. DIE ERDE–Journal Geogr. Soc. Berlin 144 (3-4), 238–259. doi:10.12854/erde-144-17
Seneviratne, S. I., Lüthi, D., Litschi, M., and Schär, C. (2006). Land–atmosphere coupling and climate change in Europe. Nature 443 (7108), 205–209. doi:10.1038/nature05095
Shapiro, S. S., and Wilk, M. B. (1965). An analysis of variance test for normality (complete samples). Biometrika 52 (3-4), 591–611. doi:10.2307/2333709
Soebiyan, V., Saragih, J. B., and Tedja, M. (2017). Study on high-rise building using wind energy at humid tropical climate. Chem. Eng. Trans. 56, 241–246. doi:10.3303/CET1756041
Stéfanon, M., Drobinski, P., D’Andrea, F., Lebeaupin-Brossier, C., and Bastin, S. (2014). Soil moisture-temperature feedbacks at meso-scale during summer heat waves over Western Europe. Clim. Dyn. 42, 1309–1324. doi:10.1007/s00382-013-1794-9
Sun, Y., and Zheng, S. (2023). Large eddy simulation of atmospheric boundary flow over two two-dimensional hills. Phys. Fluids 35 (6). doi:10.1063/5.0154416
Tecle, A., Bitsuamlak, G. T., and Jiru, T. E. (2013). Wind-driven natural ventilation in a low-rise building: a Boundary Layer Wind Tunnel study. Build. Environ. 59, 275–289. doi:10.1016/j.buildenv.2012.08.026
Tian, W., Yang, Y., Wang, L., Zong, L., Zhang, Y., and Liu, D. (2023). Role of local climate zones and urban ventilation in canopy urban heat island–heatwave interaction in Nanjing megacity, China. Urban Clim. 49, 101474. doi:10.1016/j.uclim.2023.101474
Tian, Y., Yao, X., and Chen, L. (2019). Analysis of spatial and seasonal distributions of air pollutants by incorporating urban morphological characteristics. Comput. Environ. Urban Syst. 75, 35–48. doi:10.1016/j.compenvurbsys.2019.01.003
Van Moeseke, G., Gratia, E., Reiter, S., and De Herde, A. (2005). Wind pressure distribution influence on natural ventilation for different incidences and environment densities. Energy Build. 37 (8), 878–889. doi:10.1016/j.enbuild.2004.11.009
Vieira Zezzo, L., Pereira Coltri, P., and Dubreuil, V. (2023). Microscale models and urban heat island studies: a systematic review. Environ. Monit. Assess. 195 (11), 1284. doi:10.1007/s10661-023-11906-2
Wallace, J. M., and Hobbs, P. V. (2006). Atmospheric science: an introductory survey volume 92. Netherlands: Elsevier.
Wang, J. W., Yang, H. J., and Kim, J. J. (2020). Wind speed estimation in urban areas based on the relationships between background wind speeds and morphological parameters. J. Wind Eng. Industrial Aerodynamics 205, 104324. doi:10.1016/j.jweia.2020.104324
Wang, Q., Wang, J., Hou, Y., Yuan, R., Luo, K., and Fan, J. (2018). Micrositing of roof mounting wind turbine in urban environment: CFD simulations and lidar measurements. Renew. Energy 115, 1118–1133. doi:10.1016/j.renene.2017.09.045
Xi, C., Ren, C., Haghighat, F., and Cao, S. J. (2024). Improving the urban wind flow prediction efficiency of target area by considering its surrounding buildings impact. Energy Build. 303, 113815. doi:10.1016/j.enbuild.2023.113815
Xie, J., Liao, Z., Fang, X., Xu, X., Wang, Y., Zhang, Y., et al. (2019). The characteristics of hourly wind field and its impacts on air quality in the Pearl River Delta region during 2013–2017. Atmos. Res. 227, 112–124. doi:10.1016/j.atmosres.2019.04.023
Xie, J., Sun, T., Liu, C., Li, L., Xu, X., Miao, S., et al. (2022). Quantitative evaluation of impacts of the steadiness and duration of urban surface wind patterns on air quality. Sci. Total Environ. 850, 157957. doi:10.1016/j.scitotenv.2022.157957
Yang, J., Wang, Y., Xue, B., Li, Y., Xiao, X., Xia, J. C., et al. (2021). Contribution of urban ventilation to the thermal environment and urban energy demand: different climate background perspectives. Sci. Total Environ. 795, 148791. doi:10.1016/j.scitotenv.2021.148791
Zhao, L., Oleson, K., Bou-Zeid, E., Krayenhoff, E. S., Bray, A., Zhu, Q., et al. (2021). Global multi-model projections of local urban climates. Nat. Clim. Change 11 (2), 152–157. doi:10.1038/s41558-020-00958-8
Zou, J., Lu, H., Shu, C., Ji, L., Gaur, A., and Wang, L. L. (2023). Multiscale numerical assessment of urban overheating under climate projections: a review. Urban Clim. 49, 101551. doi:10.1016/j.uclim.2023.101551
Keywords: urban climate, urban boundary layer, CFD, microscale modeling, hilly city, lakeshore city, nonlinearity
Citation: Hamze-Ziabari SM, Jafari M, Huwald H and Lehning M (2024) Quantifying urban climate response to large-scale forcing modified by local boundary layer effects. Front. Environ. Sci. 12:1438917. doi: 10.3389/fenvs.2024.1438917
Received: 27 May 2024; Accepted: 27 August 2024;
Published: 10 September 2024.
Edited by:
Bushra Khalid, Chinese Academy of Sciences (CAS), ChinaReviewed by:
Debashis Nath, Sun Yat-sen University, Zhuhai Campus, ChinaZizhen Dong, Yunnan University, China
Pengke Shen, China Meteorological Administration, China
Copyright © 2024 Hamze-Ziabari, Jafari, Huwald and Lehning. This is an open-access article distributed under the terms of the Creative Commons Attribution License (CC BY). The use, distribution or reproduction in other forums is permitted, provided the original author(s) and the copyright owner(s) are credited and that the original publication in this journal is cited, in accordance with accepted academic practice. No use, distribution or reproduction is permitted which does not comply with these terms.
*Correspondence: Seyed Mahmood Hamze-Ziabari, bWFobW9vZC56aWFiYXJpQGVwZmwuY2g=