 Shichao Chen1,2*†
 Xue Chen
 Hejun Zuo
 Min Yan
 Xiaole Li
- 1College of Desert Control Science and Engineering, Inner Mongolia Agricultural University, Hohhot, Inner Mongolia, China
- 2Key Laboratory of Aeolian Sand Physics and Sand Control Engineering in Inner Mongolia, Hohhot, Inner Mongolia, China
- 3Northwest Institute of Eco-Environment and Resources, Chinese Academy of Sciences, Lanzhou, Gansu, China
- 4University of Chinese Academy of Sciences, Beijing, China
Aeolian sandy soil and loess soil of the Mu Us Sandy Land are used as the research material in this study to investigate the effect of soil compounding on the improvement of aeolian sandy soil and to provide a feasible approach for sand prevention and sand control. In particular, loess soils were compounded at 0%, 20%, 40%, 60%, 80%, and 100% by volume percentage of the compounded soils. The improvement benefits of compounded soils on their textural properties, water-holding capacity, and fertilizer-retention capacity at different blending ratios were evaluated. The results showed that following the compounding of aeolian sandy and loess soils, with the increase of the loess proportion, the texture type of the compounded soil transforms from sandy soil to loamy sandy soil to sandy loam to loamy soil to powdery loam. Moreover, granular gradation was observed, the bulk density gradually decreased, the capillary porosity gradually increased, and the performance of water- and fertilizer-holding properties gradually increased and strengthened. The spatial variability of compounded soil bulk density, capillary porosity, and the water-holding and fertilizer-retention properties was almost entirely controlled by the proportion of loess soil. A theoretical basis is provided in this study for aeolian sandy soil improvement in the Mu Us Sandy Land that can be extended to similar areas, providing a feasible sand management approach.
1 Introduction
Located in the arid–semi-arid transition zone in northwestern China, the Mu Us Sandy Land (He et al., 2020) has complex human–land relations (Li et al., 2018), with an extensive distribution of aeolian sandy soil and loess soils (Han J. et al., 2012). Land desertification and soil erosion are considered the “two evils” that seriously constrain the sustainable development of the region (Han J. C. et al., 2012). The sand control in this area mainly focuses on vegetation, engineering, and chemical measures, such as vegetation restoration, planting sand-control forests, setting up sand barriers, and the use of chemical sand-fixing agents (Villagra et al., 2009; Yang, 2015; Li et al., 2018; Ding, 2021). However, with the progress of sand-control technology, there is more of a demand for the development and management of aeolian sandy soil (June 2011). Research on the improvement of aeolian sandy soil has recently increased, with numerous improvement methods and improvement substrates being proposed (e.g., fly ash, desulfurization gypsum, other industrial by-products, various types of sludge, rotting mud, rhizobium, and other microbial amendments, green manure, polyacrylamide, and water-retention agents) (Chen et al., 2019; Simranjeet et al., 2020; Mulualem et al., 2021; Skrylnyk et al., 2021; Wang et al., 2021; Gao et al., 2022; Suo et al., 2022; Xerdiman et al., 2022; Bai et al., 2023; Li et al., 2023; Bai et al., 2024). However, many of the proposed approaches are associated with problems such as the incomplete amelioration effect or negative impacts (Chen et al., 2019).
Scholars have reported that the contents of soil particles and agglomerates have a direct effect on the erodibility of wind erosion (Skidmore and Powers, 1982) and that aeolian sandy soil is more susceptible to erosion due to the lack of the formation of inter-grain adhesion between powder and clay particles (Leys et al., 1996). Therefore, controlling the wind erosion of the soil and improving aeolian sandy soil are the most direct methods for increasing the amount of powder and clay particles and promoting the formation of agglomerates and other ineradicable components of organic matter in aeolian sandy soil. The aeolian sandy soil in the Mu Us Sandy Land is characterized by large particles, a coarse mechanical composition, loose structure, poor organic matter content, and the leakage of water and fertilizer (He et al., 2022; Zhang et al., 2024). Loessial soil has a dense structure and fine particles, with a high degree of cementation and poor aeration and permeability (Dong, 2016; Guo et al., 2023). Due to the complementary physical properties of aeolian sandy soil and loess soil for soil compounding, related research mainly focuses on improving the powder and clay content and water and fertilizer retention, providing theoretical approaches for soil modification. Based on this, the aeolian sandy soil in Mu Us Sandy Land is selected in this study as the research object to investigate the improvement of aeolian sandy soil and loessial soil. The aeolian sandy soil and loessial soil are compounded at different ratios to reveal the role of soil compounding in soil improvement. The aim of this study was to determine the improvement effect of different soil ratios on aeolian sandy soil. The results provide useful guidance for reclamation areas, sandy area agriculture, and forestry production. This work also has practical significance for the sandy areas in increasing land productivity and the income of individuals, as well as improving the effectiveness of ecological and economic constructions.
2 Materials and methods
2.1 Study area
The study area is located in the southeast of Ordos Plateau, Mu Us Sandy Land (37°30′–39°20′N, 107°20′–111°30′E), with a temperate continental monsoon climate. The study area is rich in sunshine resources, with annual sunshine of 2,800–3,000 h, total radiation of more than 608 kJ/cm2, and a frost-free period of 113–156 days. The average annual temperature is 6°C–9°C, and the annual precipitation is 250–400 mm, with a large annual variability. Most rainfall is concentrated in July–September and is typically heavy. The annual evapotranspiration is 2,200–2,600 mm. The winter season is affected by the Siberian Cold Air Corps of Mongolia, and the northwest monsoon prevails, with a dry and cold climate. In summer, the study area is affected by the warm air mass of India and Myanmar, forming the southeast monsoon. The average annual wind speed is 3.5 m/s, and the maximum wind speed is 25 m/s. The study area is a typical sandy and windy area with widespread sandy and aeolian sandy soil. The sample site is located in Nalin Taohe Town, Yijinholo Banner, Ordos City. The terrain is relatively flat, and the majority of the 0–200 cm soil layer is sandy and aeolian sandy soil with a coarse mechanical composition. The underlying loess is exposed on individual pieces of land and is thus suitable for research on soil improvement by compounding loessial and aeolian sandy soils.
2.2 Experimental design
The aeolian sandy and loessial soils were dried naturally, ground to a diameter of 0.5 cm or more, and sieved, and impurities were removed. The soils were fully mixed using loessial soil at the compounded soil volume percentages of 0%, 20%, 40%, 60%, 80%, and 100%.
2.2.1 Soil column filling
Referring to previous research (Paramasivam and Alva, 1997), the test soils at different compound ratios were loaded into the soil column containers, and the dry soil was weighed. The soil layer was oversprayed with distilled water once at each 5 cm soil layer. A layer of fiberglass mesh was temporarily laid on the surface layer during spraying. The amount of sprayed water was consistent in all soil columns. The soil columns were loaded sequentially until a height of 50 cm was reached. Each proportion of the compounded soil was filled into 60 soil columns, resulting in 360 filled columns. The soil columns were then divided into the control and fertilizer groups, and sequentially placed in the prefabricated greenhouse steel frame overhanging at the bottom. The columns were oversprayed once every 3 days with distilled water to ensure natural settlement. When the soil column settles to a height of less than 50 cm, continue to fill the corresponding proportion of compounded soil at any time and weigh the filled soil. The soil column settlement was essentially stable after 15 occurrences of water spraying, and sprinkling was terminated. After leaving the soil columns to rest for 20 days, nitrogen fertilizer (CO(NH2)2) in a powdered form was applied to the top layer of the soil column in the fertilizer group at a nitrogen-to-compounded soil (dry soil) mass ratio of 1.5 g/kg.
2.2.2 Soil column leaching
Following fertilizer application, overspraying was continued using sprinkles and distilled water every 3 days for a total of four sprinkles. After the soil column settled and was sprinkled with water, it was left to stand for 48 h. When the water in the soil column was stable and no water seeped out from the bottom, the control group was weighed. At the end of 20 days of standing, the control group was weighed again and recorded. The difference between the two weights was the amount of water lost by evaporation during the 20 days. Based on this, the maximum amount of water loss was determined. To ensure that each drench is overdosed, 300 mL of distilled water was added to the maximum water loss as the amount of water to be drenched in each drench.
2.2.3 Sampling
After the end of the last drenching, the soil column was left to stand for 48 h until the moisture in the soil column was stable and no moisture seeped out from the bottom. The bottom cover of the soil column was then opened and sampled every 10 cm with a ring knife. This was repeated three times for each compounded soil proportion. Sampling was performed every 3 days for 27 days, resulting in the sampling of 360 soil columns. The samples were used to test the nitrogen content, the water content of the blended soil, the bulk density, and the capillary porosity.
2.3 Sample determination
The samples were analyzed with reference to the Methods for the Determination of Physical Properties of Soils (Physical Research Laboratory, 1978) and the soil and agricultural chemistry analysis (Bao, 2000). The mechanical composition of the compounded soils was determined using a laser particle sizer (Mastersizer 3000, Malvern Panalytical, United Kingdom). The volumetric weight and moisture content were estimated using the ring-knife and oven-drying methods, respectively.
2.3.1 Water content of compounded soil
To determine the soil water content, the sample was placed in an aluminum box with a balance weight to obtain the total weight of the soil sample and the aluminum box before drying. Following this, the aluminum box was dried at a constant temperature and weighed to obtain the total weight of the soil sample and the aluminum box after drying. The water content of the soil, W, expressed as a percentage by weight (%), was then calculated as follows:
where W1 is the dry weight of the aluminum box, W2 is the weight of the aluminum box and fresh soil before drying, and W3 is the weight of the aluminum box and dry soil sample after drying.
2.3.2 Bulk density of compounded soil
To calculate the bulk weight, the ring knife was filled with soil samples and directly baked at a constant temperature in an oven at 105°C ± 2°C to a constant weight. The ring knife and soil were then weighed.
2.3.3 Capillary porosity of compounded soils
For the soil capillary porosity, the ring knife was immersed in water for 24 h and weighed to a constant mass. The saturated ring-knife samples were placed in an aluminum box, separated by a filter paper, dried for 12 h to a constant mass, and then weighed. The capillary porosity was calculated as
2.4 Data processing and analysis
Geostatistical methods are considered the most effective approaches to study the spatial heterogeneity of soil properties. The semi-variance function is a basic geostatistical tool that describes the spatial variability structure of soil properties (Qi et al., 2010; Dong et al., 2010) and is calculated as
where γ(h) is the semi-variogram, h is the distance between two samples, N(h) is the logarithm of all pairs of observations spaced by h, Z(xi) denotes the observations at xi, and Z(xi + h) denotes the observations at xi + h (Li et al., 2010).
In general, the value of the semi-variance function increases with segmentation distance h until it reaches an approximately stable constant (C + C0) at a certain spacing (variable range). The value of the semi-variance function is the nugget value (C0) when h = 0. Semi-variance functions can take the form of spherical, Gaussian, exponential, and linear models (Wei et al., 2017).
Excel 2019 (Microsoft Corp.) was used to organize the data and perform descriptive statistics. The Kolmogorov–Smirnov normal distribution test was performed with SPSS19.0 (IBM, SPSS Inc.) on the compounded soil data. Pearson correlation analysis was employed for the correlation analysis of the water-holding and fertilizer conservation indexes of the compounded soil. Significant differences were evaluated between the water-holding and fertilizer conservation indexes using analysis of variance (ANOVA). GS+ 9.0 was used to construct the optimal semi-variance function model and determine the trait parameters of the compounded soil. Kriging spatial interpolation was used to create the spatial distribution maps of the relevant compounded soil properties in terms of water retention and fertility preservation using Surfer 11.0. Graphs were plotted using Origin 2022 (OriginLab Corporation).
3 Results
3.1 Compounded soil machinery composition
Soils were classified according to the American System of Soil Classification: sand (0.05–2 mm), silt (0.002–0.05 mm), and clay (<0.002 mm). Figure 1 reveals that the wind–sand soil is mainly dominated by sand particles, accounting for 92.38% of the total, whereas powder and clay particles jointly account for just 7.62%. The soil texture is sandy. The loess soil is mainly dominated by powder particles, accounting for 58.17%. The sand and clay contents account for 26.02% and 15.81%, respectively, and the soil texture is a powdery loam. There is a large difference in the grain-level contents between the wind–sand soil and the loess soil, with the content much lower in the latter than in the former. Moreover, the powder and clay contents are much higher in the loess than in the wind–sand soil. After compounding the loess and wind–sand soil, with the increase of the loess proportion, the sand content in the compounded soil gradually decreased, and the content of clay and powder gradually increased. The compounded soil exhibited certain structural properties, with soil texture types including sandy soil, loamy sandy soil, sandy loam, loamy soil, and powdery loam. The different proportions of the compounded soil altered the wind–sand soil properties to improve the over-coarseness of the mechanical composition and the undesirable texture traits.
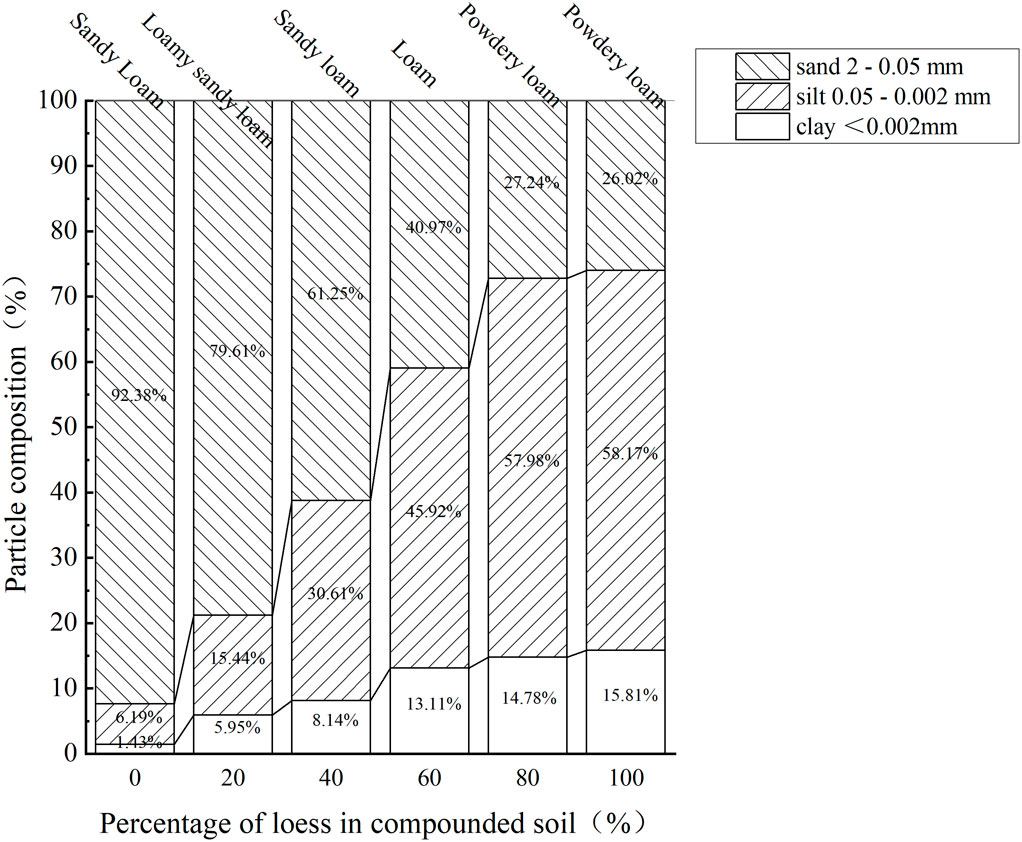
Figure 1. Mechanical composition and texture of compounded soils.
3.2 Compounded soil bulk density and capillary porosity
3.2.1 Characteristics and determinants of the spatial distribution curves of bulk density and the capillary porosity of compounded soil
Table 1 reports the Kolmogorov–Smirnov normality test on the observed bulk density and capillary porosity data at the 0–50 cm soil layer of the compounded soil. The thresholds were greater than 0.60, indicating that data are normally distributed and can be used for further data analysis. Descriptive statistical analysis of the compounded soil bulk density and capillary porosity determined the coefficients of variation of the two parameters to be weak (3.35% and 0.75%, respectively). The skewness of the bulk density and capillary porosity was less than 0, revealing that data were negatively skewed to the left side of the distribution. The positive kurtosis of bulk density indicates that there are more extreme values on both sides of the measured data, and the frequency distribution kurtosis is very flat. The negative kurtosis of capillary porosity indicates that there are less extreme values on both sides of the measured data, and the frequency distribution kurtosis is also very flat.
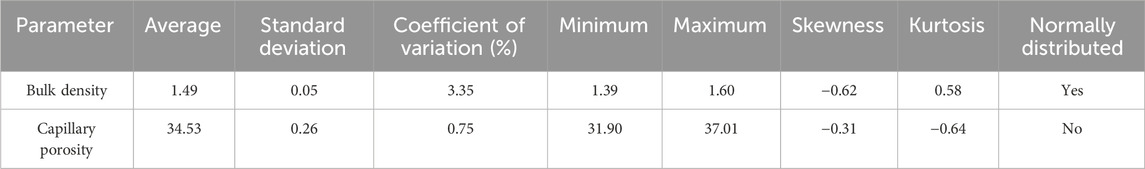
Table 1. Descriptive statistical analysis of bulk density and capillary porosity in mixed soils.
The spatial variability functions of compounded soil bulk density and capillary porosity (Table 2) reveal that the semi-variance best-fit function models of bulk density and capillary porosity were all Gaussian theoretical models. In particular, the coefficients of determination were above 0.6, the abutment values were low, the nugget values were high, and the structural ratios were 99.90% and 94.50%, respectively (>75%). Moreover, the spatial variability was low due to random factors and a strong spatial autocorrelation was present, suggesting that the differences in compounded soil bulk density and capillary porosity were almost entirely controlled by structural factors (loess ratio).
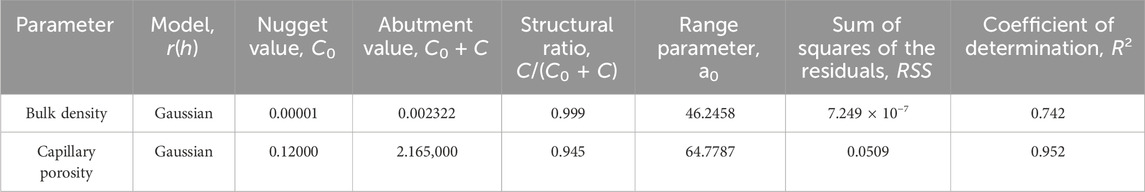
Table 2. Semi-variance function analysis of bulk density and capillary porosity in mixed soils.
3.2.2 Characterization of the spatial and temporal variability characteristics and determinants of the spatial distribution curves for bulk density and capillary porosity in compounded soil
To visually reflect the spatial distribution trends of bulk density and capillary porosity in different layers (between 0 and 50 cm) of compounded soil, the change pattern of the two parameters with the allotment proportion was plotted as a two-dimensional map based on the semi-variance function and kriging difference method (Figure 2).
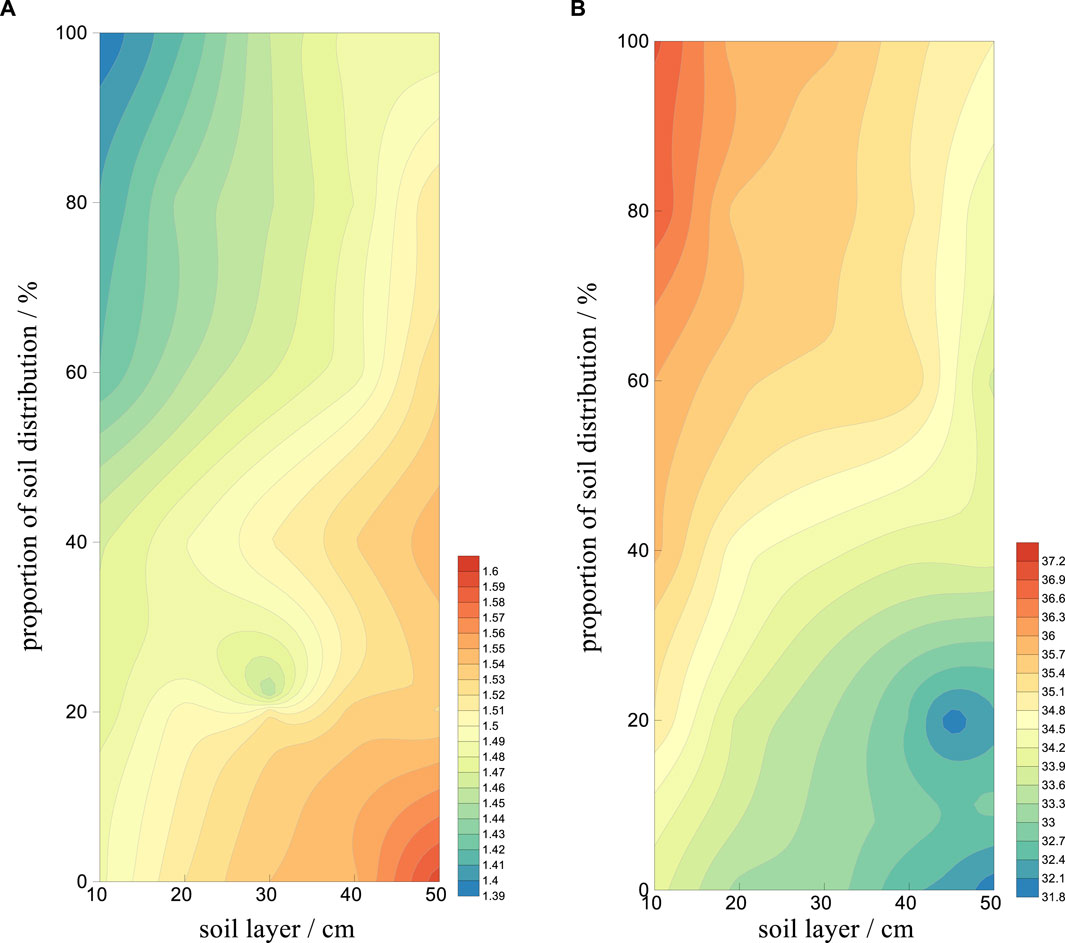
Figure 2. Spatial interpolation of bulk density and capillary porosity in mixed soils. (A) Bulk density. (B) Capillary porosity.
The maximum compounded soil bulk density appears in the lower-right corner of the graph in Figure 2A, and the values decrease in a circular band from the lower-right corner to the upper-left corner. This indicates that the compounded soil capacity gradually increases with the soil depth and decreases as the loess ratio increases. The opposite is observed for the capillary porosity (Figure 2B), with the maximum appearing in the upper-left corner of the graph and decreasing in a circular band from the upper-left corner to the lower-right corner. This indicates that the capillary porosity of the compounded soil decreases gradually with the deepening of the soil layer and increases gradually with the loess ratio. The observed trends in the spatial distribution of the compounded soil bulk density and capillary porosity can be explained by several factors. For example, the particle composition and texture of the same soil, capillary porosity, and bulk density are negatively correlated: the larger the bulk density, the denser the soil, and the smaller the porosity; in contrast, the smaller the bulk density, the larger the porosity. This can result in opposite spatial distribution trends for the two parameters. Moreover, due to the gravity of the upper soil, the deeper the soil layer, the upper soil to the lower layer of the gravity compaction of the soil, the stronger the role of the lower soil, the denser the lower soil, the larger the bulk density, and the smaller the porosity. In contrast, the shallower the soil layer, the smaller the bulk density, and the larger the porosity. Adding loess to the sandy soil improves the soil granular gradation and the soil colloid content. The appropriate granular gradation and colloid content help the soil to form an effective pore and capillary structure such that the soil texture tends to be negligible. Note that although the soil bulk density is negatively correlated with the porosity, the capillary porosity is not directly correlated with the capacity in many cases, such as wind–sand soils, despite the greater amount of pores. However, due to the poor particle grading and loose structure, the effective capillary pore space is minimal. Textures with clayey soil, a dense structure, and predominantly small pores also have less effective capillary pores. In general, the capillary porosity of loamy soil is positively correlated with the total soil porosity, and the larger the total porosity, the larger the capillary porosity. The degree of undulation at the edge of the ring zone in Figures 2A, B reflects the heterogeneity in the spatial distribution of the soil bulkiness and capillary porosity. The more intense the undulation, the stronger the spatial variation of bulkiness and capillary porosity, and the more heterogeneous the distribution. The shallower the soil layer and the larger the proportion of loess, the larger the spatial variation of bulk density and capillary porosity. In addition, the deeper the soil layer and the smaller the proportion of loess, the larger the spatial variation of bulk density and capillary porosity. Therefore, choosing the appropriate proportion of soil mixing is conducive to the formation of a moderately loose and tight soil mixing tillage layer with uniform texture.
3.3 Water-holding properties of compounded soils
3.3.1 Characteristics and determinants of spatial curves of the water content of compounded soils
The Kolmogorov–Smirnov normality test was performed on the observed water content of different soil layers from 0 to 50 cm of the compounded soil (Table 3). The significance of all values was greater than 0.05, and the spatial variables of the five soil layers conformed to the normal distribution. Thus, the data could be used for the next step of data analysis. The coefficients of variation of soil water contents in each soil layer were 49.95%, 39.51%, 32.52%, 39.01%, and 25.01%, respectively, reaching the intensity variant. The coefficients of variation decreased with the soil layer depth, and all skewness values exceeded 0. This indicates that the measured data were skewed to the right side of the distribution. Moreover, the soil water content curves in all soil layers were highly positively skewed, except for the 40–50 cm layer. The greatest deviation was observed in the 10–20 cm soil layer. Except for the 10–20 cm soil layer, the kurtosis was negative, indicating that there were fewer extreme data points on both sides of the measured data, and the peaks of the frequency distributions were extremely flat.
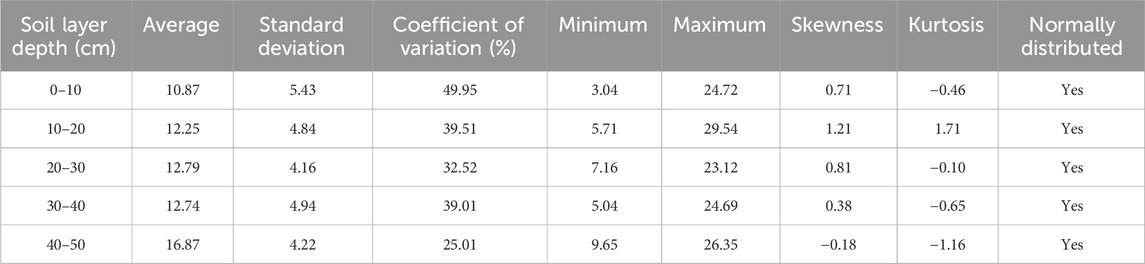
Table 3. Descriptive statistical analysis of water content in mixed soil.
Table 4 reports the spatial and temporal variability functions of water content in different soil layers of the compounded soil. The semi-variance optimal function models of the water content in the different soil layers were all linear theoretical models, with coefficients of determination exceeding 0.4. The water content of the 0–10 cm layer had the highest abutment value (52.35%), and the spatial variability induced by the stochastic factor was the largest. The structural ratios of the water content ranged within 90% ± 1.55% for all layers (>75%). The spatial variation caused by random factors was small, and strong spatial autocorrelation was observed. This indicates that the difference in the water content between different soil layers is almost completely controlled by structural factors (loess ratio).
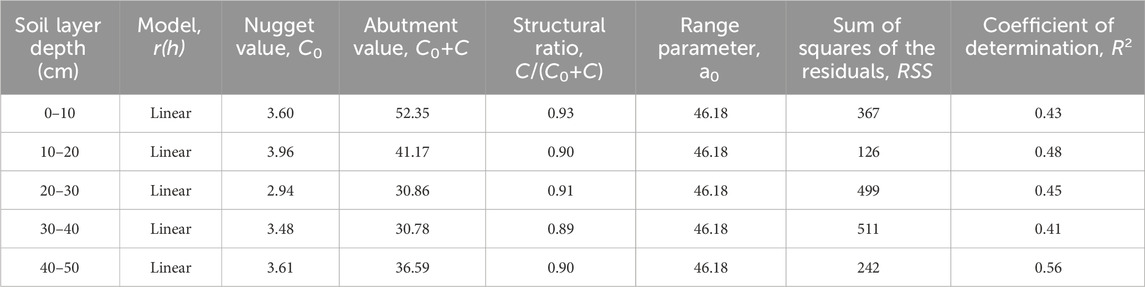
Table 4. Semi-variance function analysis of water content in mixed soil.
3.3.2 Spatiotemporal characteristics of water content in compounded soils
Figure 3 depicts the change trend of the soil water content with time and the proportion of soil allotment in each soil layer (0–50 cm) as a two-dimensional map based on the semi-variance function and kriging difference method.
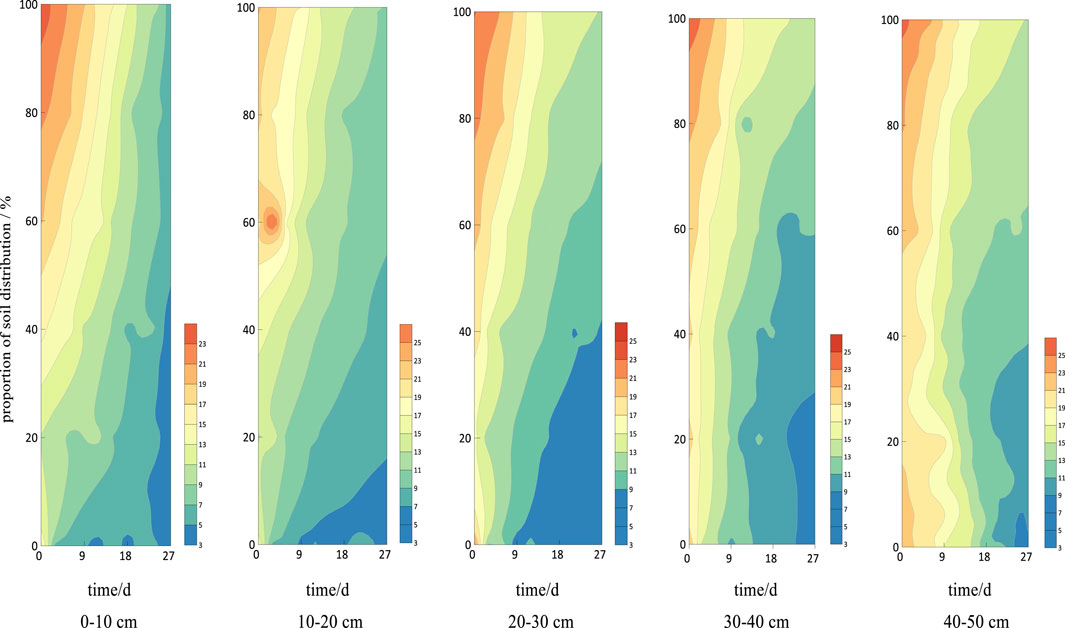
Figure 3. Spatiotemporal interpolation of water content in mixed soils.
The water content generally follows the same spatial and temporal distribution trend in the different soil layers. The maximum value appears in the upper-left corner and decreases from the upper-left corner to the lower right in the form of a circular band. For the same soil preparation proportion, the water content gradually decreases with time and gradually increases with the depth of the soil layer. At a constant time point, the water content gradually increases with the loess proportion and soil layer depth. At a constant soil layer, the water content gradually increases with the loess proportion and gradually decreases with time. This trend in the soil moisture content shows that the soil moisture loss caused by evaporation increases with time. However, as the loess proportion increases, the soil moisture loss caused by evaporation gradually becomes smaller. The soil moisture loss caused by evaporation also gradually becomes smaller as the soil depth increases. Therefore, compounding different proportions of loess with aeolian sandy soil improved the water-holding and water-retention properties of the soil to different degrees. In addition, the water content of different blended soil ratios at the beginning of the evaporation test (day 0) indicated the total water storage capacity (maximum field water-holding capacity) at different ratios. The larger the water content, the greater the total and the magnitude of the soil water-storage capacity, reflecting the strength of the soil’s water-holding properties. Figure 3 shows that as the loess proportion of the compounded soil increases, the water content, total water-storage capacity, and water-holding performance are all enhanced.
The greater water-holding and water-retaining performance of the compounded soil following the compounding of loess and aeolian sandy soil can be explained by several factors. First, with the gradual increase of the loess proportion, the content of fine-grained powder and clay particles in the compounded soil gradually increases, and thus, the total specific surface area of soil particles gradually increases. This gradually improves the defects of aeolian sandy soil (coarse particle composition and small specific surface), which enhances the total soil particles’ holding performance. Second, the gradual increase of the loess proportion enhances the colloid content in the compounded soil and the mutual adhesion between soil particles, and gradually improves the poor inter-particle adhesion and loose structure of the aeolian sandy soil. Thus, the soil absorption and holding properties are enhanced. Third, by adding a suitable proportion of loess into the aeolian sandy soil, the new compounded soil particle gradation tends to be negligible. Agglomerate structures are easily formed, increasing the effective pore space and improving the ineffective pore defects of aeolian sandy soil. This enhances the soil absorption and holding properties. However, if the loess proportion is too high, due to the high clay and colloid content, the degree of inter-particle cementation is also too high. This may result in the formation of a dense compounded soil structure compared with the aeolian sandy soil. This bottleneck can be improved to a certain extent for the soil water-holding properties, yet the porosity is reduced. This weakens the soil permeability, which is detrimental to the growth and development of plants. Moreover, more soil moisture is absorbed and cemented in the soil, which cannot easily be absorbed and utilized by plants, or too much water cannot seep down and be retained on the soil surface for a long time, causing flooding hazards to plants. Therefore, despite the sub-optimal water-holding capacity, an appropriate proportion of loess and aeolian sandy soil for compounded soil is conducive to the formation of a suitable effective pore and capillary structure. This can allow the soil to maintain good permeability, which facilitates the soil water, gas, and fertilizer transport and distribution, and promotes plant growth and development.
The degree of undulation at the edge of the ring zone reflects the heterogeneity of the spatial and temporal distribution of the soil moisture content. The more intense the undulation, the greater the heterogeneity of the spatial and temporal changes, and the more inhomogeneous the distribution. As shown in Figure 3, the larger the loess proportion, the more intense the undulation of the ring zone edge, and the more heterogeneous the spatial and temporal distribution of soil moisture. This is because the addition of loess changes the particle composition homogeneity of the aeolian sandy soil. In particular, the larger the loess proportion, the stronger the effect of homogeneity changes in the particle composition of the aeolian sandy soil, which hinders the transport of soil moisture to different degrees.
3.4 Fertilizer-retention properties of compounded soils
3.4.1 Characteristics and determinants of the spatial profile of nitrogen content in compounded soils
Table 5 reports the Kolmogorov–Smirnov normality test for the observed series of nitrogen content in different soil layers (between 0 and 50 cm) of the compounded soil. The significance of all values was greater than 0.05, and the spatial variables of the five soil layers conformed to the normal distribution, allowing for further data analysis. The coefficients of variation of nitrogen content in each soil layer were 16.57%, 12.85%, 12.12%, 6.68%, and 6.25%. Medium and weak variability was observed in the 0–30 cm and 30–50 cm layers, and the coefficients of variation decreased with the soil layer depth. The skewness of the 0–10, 10–20, and 40–50 cm layers all exceeded 0, indicating that the measured data were distributed to the right. The skewness of the 20–40 cm layer was negative and close to 0, indicating that the measured data approached a symmetrical distribution. The kurtosis coefficient was positive, revealing the presence of extreme data on both sides of the measured data, and the kurtosis of the frequency distribution exhibited a sharp–moderate–flat change trend with the soil layer depth.
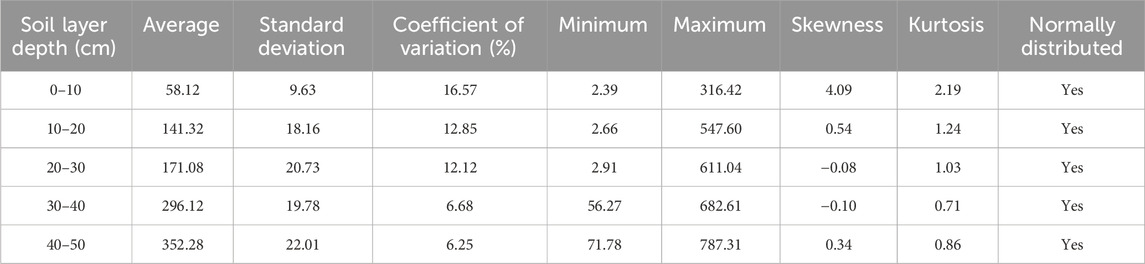
Table 5. Descriptive statistical analysis of nitrogen content in mixed soils.
The spatial and temporal variation functions of nitrogen content in the different soil layers of the compounded soil (Table 6) reveal that the semi-variance optimal function models of the nitrogen content in different soil layers were all Gaussian theoretical models, with coefficients of determination above 0.70. The nitrogen content at the 20–30 cm soil layer exhibited the highest baseline value, and the spatial variability induced by random factors was the largest. The structural ratios of the nitrogen content of the different soil layers were above 0.97, and a strong autocorrelation was present. The spatial variation caused by random factors was limited, and there was a strong spatial autocorrelation, indicating that the differences in nitrogen content between soil layers were almost completely controlled by structural factors (loess ratio).
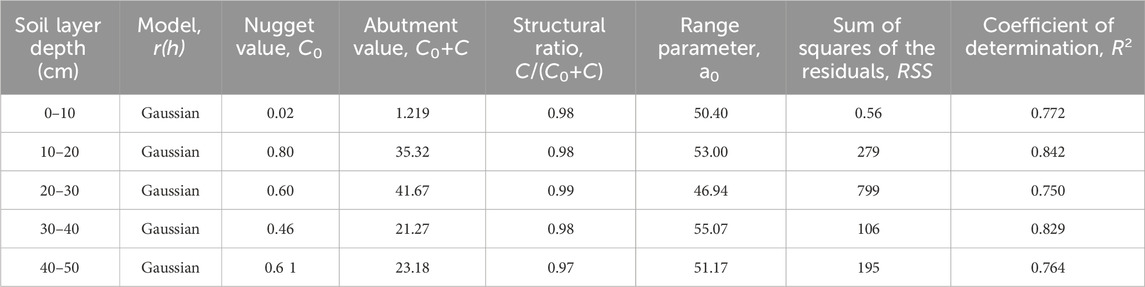
Table 6. Semi-variance function analysis results of nitrogen content in mixed soils.
3.4.2 Characteristics of the spatiotemporal variation of nitrogen content in compounded soils
Figure 4 presents the change trend of nitrogen content in each soil layer (0–50 cm) with time and the soil allotment proportion as a two-dimensional map based on the semi-variance function and kriging difference method.
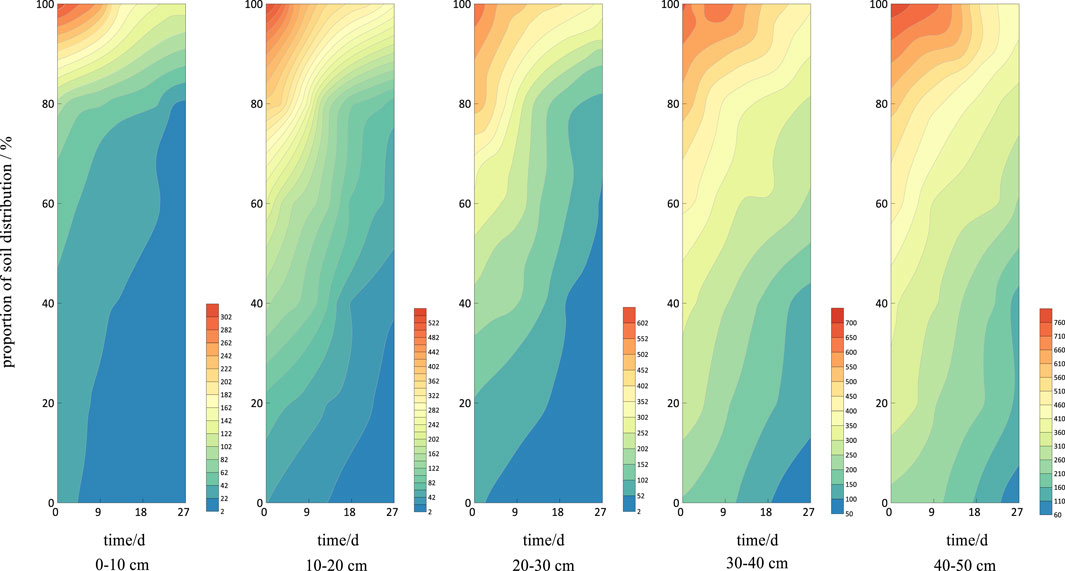
Figure 4. Spatiotemporal interpolation of N content in mixed soils.
Under four times of excessive irrigation and leaching, the spatiotemporal distribution trend of nitrogen content was approximately the same across the different soil layers, with a maximum in the upper-left corner and values decreasing from the upper-left corner to the lower-right corner in the form of a ring-shaped band. The degree of undulation at the edge of the ring band reflects the heterogeneity of the spatial and temporal distribution of quick-acting nitrogen content in the soil. The more intense the undulation, the greater the heterogeneity of spatial and temporal changes, and the more heterogeneous the distribution. Under the same allotment proportion, the nitrogen content gradually decreases with time and the drenching number, and it gradually increases with the soil layer depth. At a constant point in time, the nitrogen content gradually increases with the loess proportion and the soil depth. At the same soil layer depth, the nitrogen content gradually increases with the loess proportion and gradually decreases with time and an increasing drenching number. In the same soil depth, the nitrogen content gradually increases with the increase of the proportion of loess and decreases with time and an increase in leaching. The distribution characteristics of soil nitrogen content under leaching indicate that with the increase in leaching, the overall nitrogen loss is larger, yet with the increase in the loess proportion, the ability of the soil to resist leaching gradually increased, and the amount of nitrogen loss was gradually reduced. Moreover, for deeper soil layers, the effect on the soil by leaching gradually became smaller, and the amount of nitrogen loss was lower. Therefore, the compounding of loess and aeolian sandy soil at different proportions improved the fertilizer-retention performance of the soil to different degrees. This trend in the soil nitrogen content distribution may be attributed to the use of quick-acting nitrogen fertilizers. This type of fertilizer is easily lost by leaching, and its transport in the soil generally follows the same trend as soil moisture transport. In particular, as the leaching increases, more moisture is transported to the deeper soil, and the amount of quick-acting nitrogen transported to the deeper soil gradually increases. However, as the loess proportion in the compounded soil gradually increases, water transport is gradually reduced, the leaching effect gradually weakens, and the retention of quick-acting nitrogen in the compounded soil with a high proportion of loess increases while leaching decreases.
3.5 Correlation analyses of the indicators of compounded soil properties
Figure 5 presents the correlation analysis results of the compounded soil trait indexes. There was a significant correlation among the loess ratio, water content, bulk density, capillary porosity, clay, silt, sand content, and nitrogen content. In particular, the bulk density was negatively correlated with the loess ratio, water content, capillary porosity, clay grain, powder grain, and nitrogen. Moreover, the sand grain was also negatively correlated with the loess ratio, water content, capillary porosity, clay grain, powder grain, and nitrogen content. This indicates that the blending of aeolian sandy soil and loess had a significant effect on the composition of soil particles, bulk density, capillary porosity, and water- and fertilizer-holding properties, resulting in a decrease in the sand content and bulk density and enhancing the powder and clay particle contents, capillary porosity, and water- and fertilizer-holding properties. Although it was significant, the correlation between the nitrogen content of the compounded soil and the contents of sand, powder, and clay particles and the capillary porosity is not as strong as that among other indicators. This is because the soil’s fertilizer-holding capacity is related to not only the transport of soil water and the particle composition but also to the affinity of solutes and soil particles (e.g., the adsorption of soil particles of different sizes and properties, the distribution mechanism of solutes in the soil, the surface of solutes on the soil particles, and the exchange mechanism of various solute ions on the surface of soil particles) (Wang and Zhang, 1997; Bao, 2000). As a consequence, the soil water-holding capacity is enhanced.
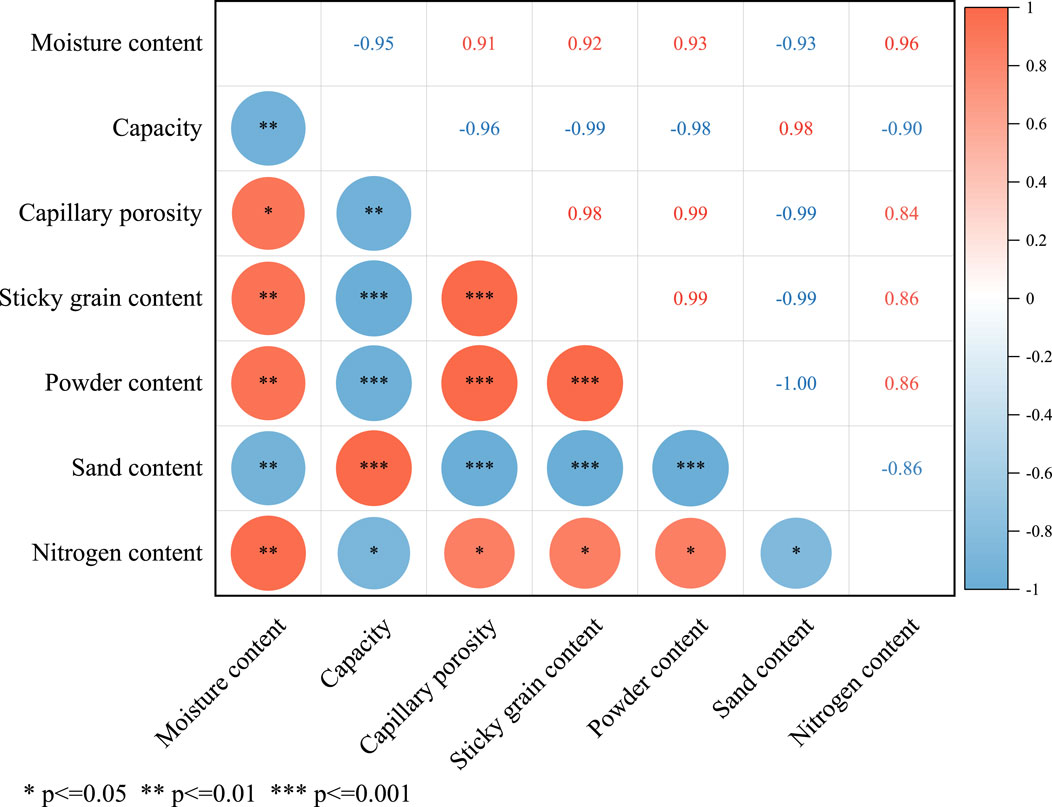
Figure 5. Correlation analysis of character indexes in mixed soils.
4 Discussion
4.1 Effect of soil compounding on the physical properties of aeolian sandy soil
The soil mechanical composition is often used to classify and evaluate the soil texture (Hillel, 1980). In this study, aeolian sandy soil and loess soil were compounded at varying proportions to form compounded soils with textural properties distinct from both soil types. As the loess proportion in the compounded soil increased, the content of clay and powder particles increased significantly, the content of sand particles decreased significantly, and the particle gradation was benign. This changed the particle composition and textural properties of the aeolian sandy soil, and the textural properties of the compounded soil gradually undergo a transformation from sandy soil to loamy sandy soil to sandy loam to loamy sandy loam to powdery loam. This is consistent with the findings of the previous research on the soil textural properties of compounded soils (Li, 2022) and on soil structure improvements via the planting of crops on degraded sandy grasslands (Rentao et al., 2018). The results indicate that the soil granular structure is enhanced and soil texture is effectively improved by adding loessial soil to aeolian sandy soil.
Soil bulk density and capillary porosity are a reflection of soil looseness and tightness, and are closely related to soil physicochemical properties, tillage, etc. They are important indicators of the soil fertility level (Duran-Bautista et al., 2020). This study revealed that the bulk density gradually decreased and the capillary porosity gradually increased with the increase of the loess proportion in the compounded soil. Moreover, the spatial variability of the bulk density and capillary porosity of the compounded soil was almost completely controlled by the loess proportion. However, the variability of the bulk density and the capillary porosity was weaker. This is consistent with the results of the previous research (Glab et al., 2018). Therefore, choosing the appropriate allotment proportion is conducive to the formation of a loosely packed and uniformly textured tillage layer of compounded soil.
4.2 Effect of soil compounding on water-holding and the fertility characteristics of aeolian sandy soil
Many scholars recognize the importance of soil compounding for the improvement of aeolian sandy soil as it helps in the accumulation of soil particles, the retention of water and fertilizers, and ultimately increases crop yields (Jie et al., 2019; Wang et al., 2022). In this study, the retention performance of water and the applied chemical nitrogen fertilizer gradually increased with the loess proportion in the compounded soil. This agrees with the previous work on soil water retention (Shun-Hua et al., 2010). We revealed that the spatial variability of the water-holding and fertilizer-retention properties of the composites was almost completely controlled by the loess ratio, and the water-holding properties reached a high variability. This is consistent with the trend of the water storage capacity of composites investigated by Cheng and Wei (2021) and Li (2022). The fertilizer-retention performance was moderately variable in the 0–30 cm soil layer and weakly variable in the 30–50 cm layer under non-full leaching. This shows that the addition of loess to aeolian sandy soil can make up for the shortcomings of aeolian sandy soil in terms of water and fertilizer leakage. Moreover, the water-holding and fertilizer-retaining properties are significantly improved in the 0–30 cm soil layer.
However, when improving the water- and fertilizer-holding capacity, several factors must be accounted for, such as the appropriate soil permeability and the effectiveness of water, fertilizer, and plant growth regulators for agriculture and forestry under different soil properties. Scholars have reported that a ratio of 1:2 for compounded soil particles is uniform in composition and moderate in distribution, with strong ventilation and permeability. This is in line with the appropriate conditions for crop growth (Guo et al., 2017; Sun and Han, 2018; He et al., 2020). Therefore, it is necessary to further explore the suitable ratio of compounded soil.
5 Conclusion
The experiment results of this study revealed an improvement in the properties of compounded soil at different compounded ratios. Aeolian sandy soils have a loose soil texture with no bonding between single particles and poor soil nutrients. Surface cementation was enhanced by the addition of loess soil, which has a denser structure and better water-holding capacity than aeolian sandy soil. After soil compounding, the textural properties gradually changed from sandy soil to powdery loam, which is more favorable for crop cultivation. There was a gradual decrease in bulk density and a gradual increase in capillary porosity and the retention of water and applied chemical nitrogen fertilizers. The spatial variability of the compounded soil bulk weight, capillary porosity, water-holding properties, and fertilizer-retention properties was almost entirely controlled by the loess proportion. Therefore, soil compounding at certain proportions can better ameliorate aeolian sandy soil.
This study adds to the foundation of research on aeolian sandy soil improvement. In terms of employing compound soil to improve the aeolian sandy soil in the Mu Us Sandy Land, the results provide data for scholars as a theoretical reference, as well as feasible measures for the management of the Mu Us Sandy Land, which can be promoted in similar areas. This study not only increases the area of agricultural land in the sandy area but also promotes the local agricultural economy, which is conducive to the improvement of the local ecological environment and the sustainable development of the agricultural economy.
Data availability statement
The original contributions presented in the study are included in the article/Supplementary Material, further inquiries can be directed to the corresponding authors.
Author contributions
SC: writing–original draft, writing–review and editing, conceptualization, data curation, formal analysis, funding acquisition, investigation, methodology, project administration, resources, software, supervision, validation, and visualization. XC: conceptualization, data curation, formal analysis, methodology, software, validation, visualization, writing–original draft, and writing–review and editing. HZ: project administration, supervision, validation, visualization, and writing–review and editing. MY: formal analysis, investigation, methodology, and writing–review and editing. HW: investigation, methodology, resources, and writing–review and editing. XL: formal analysis, investigation, methodology, and writing–review and editing.
Funding
The author(s) declare that financial support was received for the research, authorship, and/or publication of this article. This research was funded by Research and Demonstration of Key Technologies for Efficient Vegetation Construction in Surface Mining Discharge Sites (2022EEDSKJZDZX012).
Conflict of interest
The authors declare that the research was conducted in the absence of any commercial or financial relationships that could be construed as a potential conflict of interest.
Publisher’s note
All claims expressed in this article are solely those of the authors and do not necessarily represent those of their affiliated organizations, or those of the publisher, the editors, and the reviewers. Any product that may be evaluated in this article, or claim that may be made by its manufacturer, is not guaranteed or endorsed by the publisher.
References
Bai, B., Bai, F., Nie, Q. K., and Jia, X. X. (2023). A high-strength red mud-fly ash geopolymer and the implications of curing temperature. Powder Technol. 416, 118242. doi:10.1016/j.powtec.2023.118242
Bai, B., Chen, J., Bai, F., Nie, Q. K., and Jia, X. X. (2024). Corrosion effect of acid/alkali on cementitious red mud-fly ash materials containing heavy metal residues. Environ. Technol. Innovation 33, 103485. doi:10.1016/j.eti.2023.103485
Chen, L., Li, F., Li, W., Ning, Q., Zhang, C., Zhang, J., et al. (2019). Organic amendment mitigates the negative impacts of mineral fertilization on bacterial communities in Shajiang black soil. Appl. Soil Ecol. 150, 103457. doi:10.1016/j.apsoil.2019.103457
Cheng, J. D. Y., and Wei, J. (2021). Study on soil moisture under different ratios of arsenic sandstone and sand. Intell. Agric. Guide 1 (10), 5.
Dong, J., and Pan, X. (2016). Role and types of compounded soils for soil improvement[J]. Inner Mongolia Forestry (9), 24–25. doi:10.3969/j.issn.1033-8221.2016.09.012
Duran-Bautista, E. H., Muñoz Chilatra, Y., Galindo, J. D., Ortiz, T. A., and Bermúdez, M. F. (2020). Soil physical quality and relationship to changes in termite community in Northwestern Colombian amazon. Front. Ecol. Evol. 8. doi:10.3389/fevo.2020.598134
Gao, X., He, Y., Zhang, T., An, Y., Sun, C., Xu, H., et al. (2022). Alfalfa green manure amendment improved P use efficiency and reduced P losses from paddy fields. Nutrient Cycl. Agroecosyst. 123 (1-2), 35–47. doi:10.1007/s10705-022-10195-4
Głąb, T., Żabiński, A., Sadowska, U., Gondek, K., Kopeć, M., Mierzwa-Hersztek, M., et al. (2018). Effects of co-composted maize, sewage sludge, and biochar mixtures on hydrological and physical qualities of sandy soil. Geoderma 315, 27–35. doi:10.1016/j.geoderma.2017.11.034
Guo, H., Han, J. C., Zhang, Y., Wang, H. Y., Sun, Y. Y., Li, X. C., et al. (2017). Cementation force of compound soil mixed by soft rock and sand: Raman spectrum study. Laser Optoelectron. Prog. 54 (11), 113001. doi:10.3788/LOP54.113001
Guo, Z., Li, J., Zhang, Y., Wang, H., and Li, W. (2023). The soft rock can promote the improvement of aeolian sandy soil in Mu Us Sandy Land, China[J]. Sci. Rep. 13 (1). doi:10.1038/s41598-023-38928-7
Han, J., Liu, Y., and Luo, L. (2012a). Research on the core technology of remixing soil by soft rock and sand in the Maowusu sand land region. China Land Science. doi:10.13708/j.cnki.cn11-2640.2012.08.014
Han, J. C., Xie, J. C., and Zhang, Y. (2012b). Potential role of feldspathic sandstone as a natural water retaining agent in Mu Us Sandy Land, Northwest China. Chin. Geogr. Sci. 22 (5), 550–555. doi:10.1007/s11769-012-0562-9
He, H. H., Zhang, Z. K., Su, R., Dong, Z. G., Zhen, Q., Pang, J. Y., et al. (2020). Amending aeolian sandy soil in the Mu Us Sandy Land of China with Pisha sandstone and increasing phosphorus supply were more effective than increasing water supply for improving plant growth and phosphorus and nitrogen nutrition of lucerne (Medicago sativa). Crop Pasture Sci. 71 (8), 785–793. doi:10.1071/CP20132
He, S. N., Lv, G., Wang, F. B., Zhang, Z., Wang, S., Liu, S., et al. (2022). Relationship between spatial variability of soil nutrients and land use in wind-sand land of northwest Liaoning[J]. Journal of Shenyang Agricultural University. 53 (02), 213–220. doi:10.3969/j.issn.1000-1700.2022.02.010
Jie, C., Jichang, H., Jichang, X., Huanyuan, W., Zenghui, S., Yichun, D., et al. (2019). The long-term performance of composited soil with feldspathic sandstone amendment on sandy soil and its effects on corn yield. Plant, Soil Environ. 65, 395–400. doi:10.17221/282/2019-pse
Jun, L. (2011). Soil amelioration (planning textbook of agricultural and forestry biology for colleges and universities). Zhejiang University Press.
Leys, J., Koen, T., and Mctainsh, G. (1996). The effect of dry aggregation and percentage clay on sediment flux as measured by a portable field wind tunnel. Soil Res. 34 (6), 849–861. doi:10.1071/SR9960849
Li, M. Y., Chen, X. T., Chen, C. Y., Huang, L. G., Chi, H. C., Zhao, N., et al. (2023). The effectiveness of sewage sludge biochar amendment with (i) Boehmeria nivea L. in improving physicochemical properties and rehabilitating microbial communities in mine tailings. J. Environ. Manag. 345, 118552. doi:10.1016/j.jenvman.2023.118552
Li, W. Y. (2022). Effects of arsenic sandstone addition on the characteristics of wind-sand soil and crop suitability. Chang’ an University.
Li, X. H., Yuan, F., Bai, X. Y., Ming-Ming, Z., Cai, J., and Tao-Fa, Z. (2010). Comparison of normalization methods for non-normal distributed soil elements data in typical mining area. Geogr. Geo-Information Sci. 26 (6): 102–105.
Li, X. J., Zhou, R. P., Jiang, H. T., Zhou, D. D., Zhang, X. W., Xie, Y. H., et al. (2018). Quantitative analysis of how different checkerboard sand barrier materials influence soil properties: a study from the eastern edge of the Tengger Desert, China. Environ. Earth Sci. 77 (13), 481. doi:10.1007/s12665-018-7653-6
Li, Y. Y., Li, X. B., Tan, M. H., Wang, X., and Xin, L. J. (2018). The impact of cultivated land spatial shift on food crop production in China, 1990–2010. Land Degrad. Dev. 29 (6), 1652–1659. doi:10.1002/ldr.2929
Mulualem, T., Adgo, E., Meshesha, D. T., Tsunekawa, A., Haregeweyn, N., Tsubo, M., et al. (2021). Examining the impact of polyacrylamide and other soil amendments on soil fertility and crop yield in contrasting Agroecological environments. J. Soil Sci. Plant Nutr. 21 (3), 1817–1830. doi:10.1007/s42729-021-00482-4
Paramasivam, S., and Alva, A. K. (1997). Leaching of nitrogen forms from controlled-release nitrogen fertilizers. Commun. Soil Sci. Plant Analysis 28 (17-18), 1663–1674. doi:10.1080/00103629709369906
Qi, Y. C., Dong, Y. S., Jin, Z., Peng, Q., Xiao, S. S., and Ya-Ting, H. E. (2010). Spatial heterogeneity of soil nutrients and respiration in the Desertified grasslands of Inner Mongolia, China. Pedosphere 20, 655–665. doi:10.1016/S1002-0160(10)60055-0
Rentao, J., Fucheng, L. I., and Songtao, S. (2018). Effects of degradation of alpine grassland on soil aggregates composition and stability in Northwestern Sichuan Province. Res. Soil Water Conservation. doi:10.13869/j.cnki.rswc.2018.04.005
Shun-Hua, X. U., Lan-Min, W., Jun-Jie, S., and Zhi-Jian, W. U. (2010). Study on the influence of water content to subsidence characters of loess. Northwestern Seismological Journal. doi:10.3969/j.issn.1000-0844.2010.01.00
Simranjeet, S., Vijay, K., Daljeet, S. D., Shivika, D., Bhatia, D., Dhiman, J., et al. (2020). A sustainable paradigm of sewage sludge biochar: valorization, opportunities, challenges and future prospects. J. Clean. Prod. 269, 122259. doi:10.1016/j.jclepro.2020.122259
Skidmore, E. L., and Powers, D. H. (1982). Dry soil-aggregate stability: energy-based Index1. Soil Sci. Soc. Am. J. 46 (6), 1274–1279. doi:10.2136/sssaj1982.03615995004600060031x
Skrylnyk, I., Hetmanenko, V., Xiao, Y., and Shi, R. (2021). Sorption ability of soil improvers based on sapropel and biochar to mineral fertilizer nutrients. IOP Conf. Series: Earth Environ. Sci. 792, 012006. doi:10.1088/1755-1315/792/1/012006
Sun, Z., and Han, J. (2018). Effect of soft rock amendment on soil hydraulic parameters and crop performance in Mu Us Sandy Land, China. Field Crops Res. 222, 85–93. doi:10.1016/j.fcr.2018.03.016
Suo, C., Wen, H., Cao, J., Cao, H., and Dong, X. (2022). Performance of a composite soil prepared with red mud and desulfurized gypsum. KSCE J. Civ. Eng. 26 (1), 47–56. doi:10.1007/s12205-021-2054-x
Villagra, P. E., Defossé, G. E., del Valle, H. F., Tabeni, S., Rostagno, M., Cesca, E., et al. (2009). Land use and disturbance effects on the dynamics of natural ecosystems of the Monte Desert: implications for their management. J. Arid Environ. 73 (2), 202–211. doi:10.1016/j.jaridenv.2008.08.002
Wang, H., Tong, W., Liu, J., Han, J., and Liu, S. (2022). Soil wind erosion resistance analysis for soft rock and sand compound soil: a case study for the Mu Us Sandy Land, China. Open Geosci. 14 (1), 824–832. doi:10.1515/geo-2022-0390
Wang, S. B. C. D., and Zhang, Z. T. (1997). Effects of soil particle size on water and fertilizer retention and transport. Agric. Res. Arid Regions 15 (1), 5.
Wang, X., Li, S., Sun, Y., Wang, Y., Wang, C., Zhang, C., et al. (2021). Effect of different fly ash additions on the properties of unsaturated soil in open-pit mine dumps. Arabian J. Geosciences 14 (18), 1–10. doi:10.1007/s12517-021-08313-7
Wei, D., Keli, Z., Zhiqun, G., Kanghua, L., Feng, Z., and Weijun, F. U. (2017). Spatial variation characteristics of carbon density and storage in forest ecosystems in a typical subtropical region. Acta Ecol. Sin. 37 (22). doi:10.5846/stxb201609271947
Xerdiman, D., Zhou, H., Li, S., Sun, H., Xin, K., Sun, D., et al. (2022). Effects of water-retaining agent dosages on slope-protection plants and soil nutrients on rocky slopes. Sustainability 14 (6), 3615. doi:10.3390/su14063615
Yang, S. J. W., Yang, S. J. W., Yang, S. J. W., Yang, S. J. W., Yang, S. J. W., and Yang, S. J. W. (2015). Introduction to comprehensive management technology of Yulin sand area in Mao Wusu sandland. Prot. For. Sci. Technol. 10, 116–117. doi:10.13601/j.issn.1005-5215.2015.10.044
Keywords: desertification, loess soils, aeolian sandy soil, compounding, soil improvement
Citation: Chen S, Chen X, Zuo H, Yan M, Wang H and Li X (2024) Soil compounding promotes the improvement of aeolian sandy soil in the Mu Us Sandy Land. Front. Environ. Sci. 12:1435618. doi: 10.3389/fenvs.2024.1435618
Received: 20 May 2024; Accepted: 11 July 2024;
Published: 02 August 2024.
Edited by:
Krishnaswamy Jayachandran, Florida International University, United StatesCopyright © 2024 Chen, Chen, Zuo, Yan, Wang and Li. This is an open-access article distributed under the terms of the Creative Commons Attribution License (CC BY). The use, distribution or reproduction in other forums is permitted, provided the original author(s) and the copyright owner(s) are credited and that the original publication in this journal is cited, in accordance with accepted academic practice. No use, distribution or reproduction is permitted which does not comply with these terms.
*Correspondence: Shichao Chen, Y2hlbnNoaWNoYW8yMDA1QDEyNi5jb20=
†These authors have contributed equally to this work and share first authorship