 Zhang Qian-Ming
 Li Ji-Xia
- 1School of Management and Economics, Chuxiong Normal University, Chuxiong, China
- 2School of Government, Beijing Normal University, Beijing, China
The Yellow River Basin serves as a vital ecological shield for China, and enhancing the urban ecological efficiency (UEE) is essential for the region’s ecological civilization and high-quality development. This research employs the slacks-based measure-data envelopment analysis (SBM-DEA), which incorporates undesirable outputs, and the Malmquist index to measure the UEE of 65 cities in the Yellow River basin from 2008 to 2017, described its spatio-temporal evolution characteristics, and utilizes its influencing factors using the Bootstrap truncated regression model. The main findings are as follows. ① The UEE in the Yellow River Basin has seen a steady, albeit low, increase from 2008 to 2017, with notable disparities existed in the upper, middle and lower reaches. Low pure technical efficiency is the main factor limiting the improvement of UEE in the Yellow River Basin. ② Cities with higher ecological efficiency in the Yellow River Basin generally exhibit a spatial distribution pattern of “lower reaches > middle reaches > upper reaches,” and it shows that cities with growing UEE are continuously shifting to the middle and lower reaches. ③ Environmental regulation, scientific and educational investment, economic scale, and greening level significantly promote the improvement of UEE in the Yellow River Basin, but population density and industrial structure lead to a decline in UEE. However, this result is heterogeneous between the upper, middle, and lower reaches, such as environmental regulation hindering the growth of UEE in the upper reaches, scientific and educational investment hindering the improvement of UEE in the downstream areas, and industrial structure significantly enhancing UEE in the midstream areas. These findings offer valuable insights for policymakers aiming to address ecological challenges and promote sustainable development within the Yellow River Basin, highlighting the need for targeted strategies that consider regional differences and the unique characteristics of each reach.
1 Introduction
The Yellow River is one of the rivers with the largest sediment content and the most difficult ecological management globally (Zhao et al., 2024). Due to its unique geographical location, not only does the Yellow River Basin hold an extremely important position in China’s overall ecological security system, but the urban agglomeration of the Yellow River basin also stands at the forefront of China’s “Belt and Road” initiative for external openness. However, high-pollution and high-energy-consumption industries, over-exploitation of water resources, local ecological degradation and environmental pollution are intertwined, and the ecological and environmental problems of the watershed have become a bottleneck for the high-quality development of the cities in the Yellow River basin (Wang et al., 2019; Li et al., 2022). To crack the dilemma between economic development and ecological deterioration faced by cities in the Yellow River basin, on 8 October 2021, the Central Government of China issued the “Outline on Ecological Protection, Development of Yellow River Basin,” which aims to provide strategic direction for the advancement of ecological conservation efforts within the basin (Central People’s Government of the People’s Republic of China, 2022). The international community has also paid great attention to this issue. In March 2022, the World Bank also provided a $380 million loan to help China address water shortages and ecosystem degradation in the Yellow River basin (The World Bank, 2022). As a crucial metric for gauging sustainable development, ecological efficiency takes into account both ecological and economic benefits. Precise measurement of urban ecological efficiency (UEE) in the Yellow River basin, coupled with the identification of key influencing factors, is instrumental in informing strategies for the high-quality development of these urban areas under ecological constraints. It also aids in aligning these strategies with China’s broader national development agenda. Yet, the question remains: what is the level of UEE within the Yellow River Basin? What are the distinctive features of its spatiotemporal distribution? Furthermore, what are the key determinants that drive and shape these dynamics?
Ecological efficiency was first conceptualized by Schaltegger and Sturm to quantify the effect of enterprise production operation to the environment (Stefan and Andreas, 1990). Taking into account the externalities of pollution, the World Business Council for Sustainable Development (WBCSD) measures ecological efficiency in a given region from an industrial perspective, i.e., the provision of competitively priced goods and services that satisfy human needs and provide a quality of life while progressively reducing ecological impacts and resource intensity over the entire life cycle to at least the Earth’s estimated carrying capacity (WBCSD, 1995). Subsequently, various research institutions have extended the specific connotation of ecological efficiency from multiple perspectives. Although there is no consensus on the definition of eco-efficiency among various institutions, the core essence is shared: that is, to maximize economic benefits and minimize environmental pollution by improving the efficiency of resource and energy input, thereby satisfying people’s demands for a high-quality life, and ultimately promoting the sustainable development of economic, ecological and social.
As research continues to evolve, scholars’ focus on ecological efficiency has gradually shifted from connotation definition to evaluation, most of the researches has concentrated on the micro-level of enterprises (Suh et al., 2005) and the meso-level of industries (Zhong et al., 2023). It is also of considerable significance to introduce ecological efficiency into regional and urban development evaluation. Currently, the academic community has conducted extensive and fruitful research on the measurement of UEE, which has covered various objects across different levels and applied a multitude of beneficial methods. ① In terms of research objects, current evaluations of UEE encompass various levels such as national (Wursthorn et al., 2011), countries (Wang C.-N. et al., 2020), urban agglomerations (Liu et al., 2024), provinces (Ye et al., 2022), and cities (Moutinho et al., 2020). ② Regarding research methods, ecological efficiency can be measured mainly through Data Envelopment Analysis models (DEA) (Nong et al., 2024), Stochastic Frontier Analysis models (SFA) (Liu et al., 2021b), Ecological Footprint (EF) (Yang and Yang, 2019), Life Cycle Assessment (LCA) (Valente et al., 2019), emergy analysis method (Shang et al., 2024) and Comprehensive Evaluation (CE) (Wang S. et al., 2020). Among them, the DEA model has become the most widely used computational model in academia for measuring ecological efficiency, which preserves the integrity of original data to the greatest extent, requires no functional assumptions for variables, and benefits from continuous model improvements and developments (e.g., SBM-DEA model, DEA-Malmquist index model, Network Data Envelopment Analysis) (Lei et al., 2024).
Furthermore, a broad spectrum of existing literature has delved into the factors influencing UEE, such as the level of economic development, industry structure, urbanization, environmental regulations, fiscal decentralization, population density, innovation capabilities, and investment in environmental governance (Liu et al., 2024; Wang et al., 2024), predominantly utilizing Tobit regression (Tan and Wang, 2021; Lei et al., 2024) and ordinary least squares (OLS) methods (Zhou et al., 2020). A subset of researchers have also employed the difference-in-differences (DID) and the propensity score matching difference-in-differences (PSM-DID) to identify the effects of environmental policies on UEE (Xu and Wang, 2021; Ge et al., 2023), or utilized spatial Durbin models to discuss the spatial spillover effects of factors on UEE (Ma et al., 2022; Zeng et al., 2022).
In summary, existing studies have provided much experience that can be referenced for the conduct of this research, such as the use of the SBM-DEA model to measure UEE. Nevertheless, there are opportunities for further exploration in three aspects: ① Regarding research subjects, while current studies span various scales, most have assessed UEE within the confines of administrative boundaries (Tan and Wang, 2021; Liu et al., 2024). There is a dearth of research on UEE linked by river systems, which may neglect the horizontal interactions within a basin, potentially undermining the strategic value of the findings. ② In terms of research content, scholars typically adopt a static perspective to examine the spatiotemporal characteristics of UEE (Nong et al., 2024), with less focus on its dynamic evolution. Additionally, significant internal disparities exist between the upper, middle, and lower reaches of river basins (Liu et al., 2021a), and there is a scarcity of analysis on these internal differences within the context of river basin segmentation. ③ Concerning the analytical methods for influencing factors on UEE, the Tobit regression model is frequently utilized. However, Simar et al. have shown that the traditional tobit model may introduce bias when estimating the factors affecting efficiency (Simar and Wilson, 2007). In response, this research shifts its focus to the UEE within the Yellow River Basin, employs the SBM-DEA method and the Malmquist model to evaluate UEE from both dynamic and static perspectives. To ensure the unbiasedness of the results, Bootstrap truncated regression model is utilized to identify key determinants of UEE in the Yellow River Basin. Moreover, this research conducts a comparative analysis by dividing the Yellow River Basin into its upper, middle, and lower reaches, aiming to pinpoint the internal discrepancies in UEE and offer more nuanced decision-making support for ecological conservation and the high-quality development of the Yellow River Basin.
2 Research region
The Yellow River, revered as the cradle of Chinese civilization, originates in the northern foothills of the Bayan Har Mountains on the Qinghai-Tibet Plateau. It stretches 5,464 km and spans a basin covering 794,700 km2. The Yellow River Basin, extending across longitudes from 96° to 119°E and latitudes from 32° to 42°N, constitutes a unique and complete ecological region. This area is rich in coal resources but is challenged by a scarcity of water resources, over three-quarters of the basin is moderately to severely ecologically fragile, making it a quintessential example of ecological vulnerability in China (Yellow River Conservancy Commission of MWR, 2023). As a vital ecological safeguard for China, the Yellow River Basin is also a significant area for population activity and economic development. The basin encompasses nine provinces and regions in China (Figure 1), home to 31.85% of China’s total population, yet it contributes only 25% of the country’s GDP; the urbanization rate of its permanent residents stands at 56.9%, which is below the national average of 65.22% (Xinhuanet, 2020; Sun and Shi, 2021; China National Bureau of Statistics, 2023).
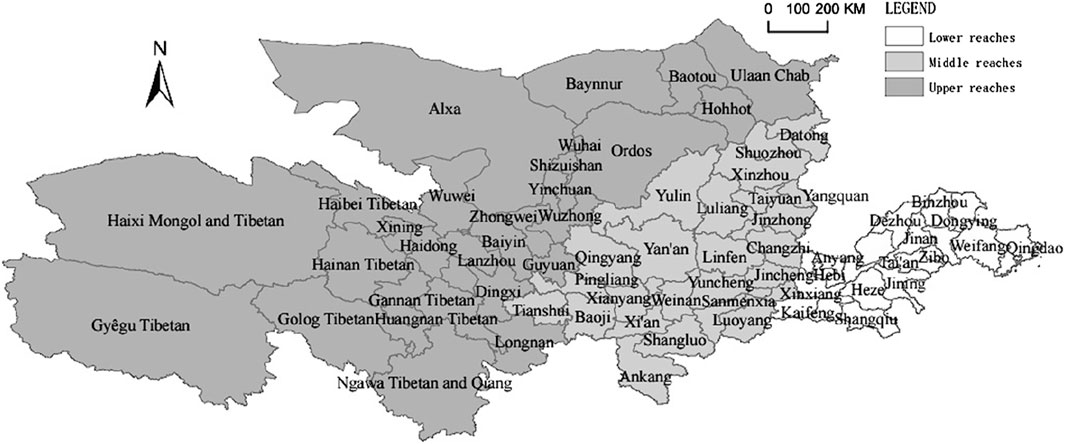
Figure 1. Research region: the Yellow River Basin.
Under immense economic development pressure, cities in the Yellow River Basin have turned their focus to the advantageous industries within the region—energy and heavy chemical industries. The basin is abundant in mineral resources, with raw coal, crude oil, natural gas, thermal power, and hydropower accounting for 74.18%, 18.86%, 35.11%, 36.81%, and 9.27% of the national total production, respectively (Zhang et al., 2022). In the Yellow River Basin, The proportion of resource extraction and processing industries, such as coal mining and washing, oil and natural gas extraction, and non-ferrous metal smelting and rolling, is as high as 36.34%, exceeding the national average by 9.17% (Xinhuanet, 2020). While the proliferation of energy and heavy chemical industries has cemented the economic foundation of the Yellow River Basin, it has also engendered a novel dilemma characterized by exacerbated environmental pollution and intensified ecological fragility (Chen et al., 2020).
A pronounced dichotomy exists between economic development and environmental conservation, further complicated by the scarcity of water resources, which places additional constraints on the high-quality development of the Yellow River Basin. The basin’s water consumption accounts for 20% of the national total, whereas its water resources constitute a mere 2.7% of the country’s overall supply (Sun and Shi, 2021). To satisfy the production and living requirements within the basin, the exploitation and utilization rate of water resources in the Yellow River Basin has alarmingly reached 80%, far exceeding the ecological warning threshold of 40% (State Council of the People’s Republic of China, 2021). Navigating the complex interplay between economic development, environmental protection and resource utilization, has emerged as a formidable challenge for the urban centers within the Yellow River Basin.
3 Materials and methods
3.1 Methodology
This research utilizes an enhanced slacks-based measure data envelopment analysis (SBM-DEA) model, which accounts for non-desired outputs, to quantify the UEE across 65 prefecture-level cities within the Yellow River Basin for the period spanning 2008 to 2017. Subsequently, the Malmquist Index Model is applied to delve into the dynamics of UEE over time. To ascertain the pivotal determinants of UEE, Bootstrap truncated regression analysis is employed, ensuring the robustness and unbiased nature of the findings. Building upon natural division points and in consultation with prior scholarly research (Zhou et al., 2016), this research delineates the Yellow River basin into three distinct regions: the upper, middle, and lower reaches, facilitating a granular regional analysis (Figure 1).
3.1.1 Assessing urban ecological efficiency: SBM-DEA model with undesirable outputs
The intrinsic nature of UEE is encapsulated by the ratio of economic achievements realized during urban development to the actual resources invested, taking into account the negative environmental impacts. Building upon the conceptual framework of UEE and referencing previous research (Long, 2021; Nong et al., 2024), this research constructs an evaluative index system for UEE in the Yellow River Basin, adopting an input-output approach as delineated in Table 1. The input variables include four major elements: labor, capital, resources, energy, and land; whereas the output variables, reflective of ecological efficiency’s essence, consider the data availability and the industrial development characteristics of the basin, with industrial waste emissions serving as the undesirable output and the regional gross domestic product (GDP) as the desired output.
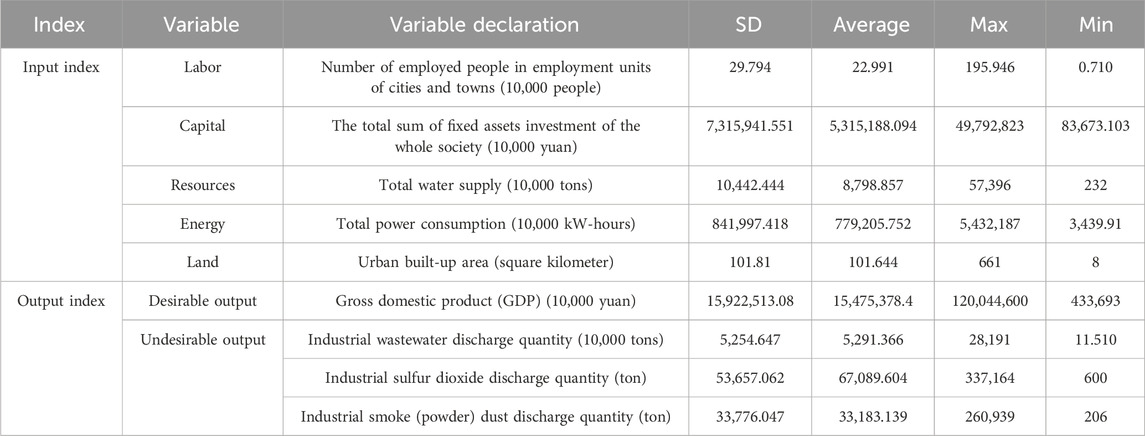
Table 1. Evaluation index system of urban ecological efficiency in the Yellow River basin.
The SBM-DEA model with undesirable outputs, which includes undesirable outputs, integrates slack variables into the objective function of the non-radial and non-Archimedean SBM model. This approach not only avoids the shortcomings of traditional DEA models, which often neglect the slack in input variables, but also effectively tackles the efficiency issues that arise from the inclusion of undesirable outputs (Tone, 2001). Based on the UEE evaluation index system specific to the Yellow River Basin, this research employs the SBM-DEA model with undesirable outputs for the assessment. The general expression is as follows:
In Formula 1, where
3.1.2 Analyzing the dynamic of urban ecological efficiency: Malmquist index model
The Malmquist index model was first proposed by Swedish economist and statistician Malmquist. S in 1953 (Malmquist, 1953). Färe et al. combined it with the DEA theory in 1992 (FjiRE et al., 1992), and the Malmquist index model has been widely used in the field of efficiency evaluation. The Malmquist Index Model offers significant advantages in analyzing the dynamic characteristics of UEE in the Yellow River Basin. It not only effectively handles time series data, accurately capturing the evolution and dynamic characteristics of UEE over time, but also further decomposes the index into two dimensions: efficiency changes (EC) and technological progress (TP). This decomposition is instrumental in assessing the improvement of UEE across consecutive periods and identifying whether technological advancements have provided an impetus for the enhancement of UEE. The expression is as follows:
In Formula 2, the Malmquist index M0 can be decomposed into EC and TP, the formula is as follows:
In Formula 3, when
3.1.3 Exploring the influencing factors of urban ecological efficiency: bootstrap truncated regression model
UEE ranges from 0 to 1 and is considered truncated data. Utilizing OLS regression analysis directly on such data may lead to biassed and inconsistent outcomes. Simar and Wilson have demonstrated that that the classic tobit regression model, which is designed for handling truncated data, is not well-suited for testing the influencing factors of efficiency (Simar and Wilson, 2007). To address this issue, they proposed the bootstrap truncated regression model, which effectively minimizes data uncertainty and statistical noise, thereby circumventing the aforementioned limitations. The expression is as follows:
In Formula 4, where
3.2 Research sample and data sources
Based on the natural watershed boundaries delineated by the Yellow River Conservancy Commission and considering the integrity of regional research units as well as their economic relevance to the Yellow River basin, this research encompasses 74 prefecture-level cities along the Yellow River’s course. By eliminating city samples with incomplete data (9 western autonomous prefectures or league including Aba, Haidong, Haibei, Hainan, Huangnan, Yushu, Haixi, Guoluo and Alxa), 65 prefecture level cities were finally obtained as the research samples. The data of all indicators are from the “China City Statistical Yearbook (2008–2017),” “China Urban Construction Statistical Yearbook (2008–2017),” and statistical yearbooks of relevant provinces and cities from 2009 to 2018. In mitigate the effects of price fluctuations, all monetary data presented throughout this research have been deflated to constant prices using 1978 as the reference base year.
The observation period for this research is delineated from 2008 to 2017, with the selection of this timeframe grounded in two pivotal considerations:
Firstly, the starting point of 2008 is chosen in light of societal context and policy support. On one hand, China achieved significant ecological governance effectiveness in this year, with a notable downward trend in the emissions of sulfur dioxide and chemical oxygen demand for the first time. This shift not only signifies a positive transformation in China’s ecological governance strategy from a reactive to a proactive approach but also reflects the increasingly mature societal backdrop for enhancing UEE. On the other hand, top-down policy design has provided institutional safeguards for the improvement of UEE in the Yellow River basin. In 2006, the “Yellow River Water Allocation Regulations” were officially promulgated and implemented, marking the first administrative regulation specifically formulated and promulgated at the national level for the Yellow River, highlighting the national emphasis on enhancing UEE. In 2008, the Yellow River Conservancy Commission successively promulgated and implemented the “Supervision and Management Measures for Discharge Outlets into the River” and the “Reporting Measures for Major Water Pollution Incidents in the Yellow River,” to which Shandong and Henan provinces within the basin responded by enacting multiple local regulatory documents, offering clearer and more specific operational guidelines for improving the UEE of the Yellow River basin.
Secondly, the endpoint of 2017 is chosen mainly due to considerations regarding the data quality of fixed asset investment—a key input indicator for measuring UEE in this research. In March 2017, the National Bureau of Statistics rolled out the “Notice on the Pilot Reform of the Statistical System and Method for Fixed Asset Investment in 2017,” which altered the statistical method from primarily the image progress method to primarily the financial expenditure method, thereby recalibrating the statistical aperture for fixed asset investment. Given that 40% of the provinces and cities along the Yellow River’s course were part of this pilot initiative. To maintain the consistency of the statistical calibre, the observation period of this research is up to 2017.
4 Results
4.1 Static characteristics of urban ecological efficiency in the Yellow River Basin
4.1.1 Temporal evolution
The UEE in the Yellow River basin from 2008 to 2017 was generally low, average 0.736, yet it demonstrated a consistent upward trend (Figure 2A). Significant regional disparities were observed in the UEE among the downstream, midstream, and upstream reaches, with average annual values of 0.778, 0.738, and 0.692, respectively. Notably, UEE in the lower reaches surpassed that of the upper reaches by 8.6 percentage points. These differences can be largely ascribed to the downstream area’s superior natural conditions and a more robust economic foundation. Moreover, the trends across the three regions varied markedly. While the middle and lower reaches experienced a steady rise in UEE, the western upper reaches witnessed a notable decline starting in 2016, reaching its lowest value of 0.669 in 2017, characterized by substantial volatility. This downturn maybe closely linked to the region’s intensive exploitation of mineral resources and the associated “resource curse” it has endured in recent years.
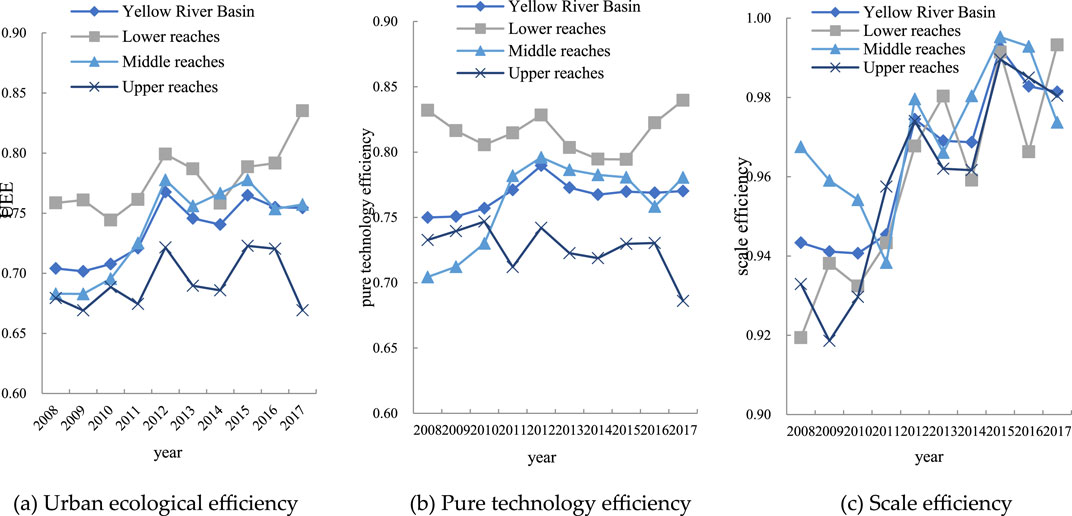
Figure 2. Urban ecological efficiency and its decomposition in the Yellow River basin. (A) Urban ecological efficiency. (B) Pure technology efficiency. (C) Scale efficiency.
Further decomposing the UEE, from 2008 to 2017, the pure technical efficiency of the Yellow River basin (with an average of 0.767) was lower than the scale efficiency (with an average of 0.964), and the pure technical efficiency changes exhibited relatively smoothly (Figure 2B), while the scale efficiency showed a trend of fluctuating upward (Figure 2C). This result reflected that the low ecological pure technical efficiency contributing to the overall low UEE in the Yellow River basin. Specifically: ① Pure technical efficiency. The pure technical efficiency of the UEE across the downstream, midstream, and upstream regions is generally not high, with annual averages of 0.815, 0.761, and 0.726, respectively. There is a significant disparity between regions, with a difference of 0.089 between the lower reaches and the upper reaches, which is associated to the high level of economic development and more advanced technology in the lower reaches. Moreover, the change trends of the three regions differ: the middle and upper reaches show an initial increase followed by a decrease, while the lower reaches has experienced a decrease followed by an increase, reaching 0.840 in 2017. This is largely due to the harsh ecological environment and insufficient R&D capabilities in the middle and upper reaches, where technological advancements are limited. In contrast, after experiencing various “urban diseases,” the lower reaches have both the funds and the capacity to bolster ecological technology support, leading to a marked improvement in environmental technology levels ② Scale efficiency. Over the 10-year period from 2008 to 2017, the scale efficiency of UEE was maintained at a high level above 0.910 and showed a fluctuating upward trend. The average scale efficiency of the lower reaches, the middle reaches, and the upper reaches were 0.959, 0.971, and 0.959. However, it is noteworthy that between 2008 and 2011, the scale efficiency in the middle reaches declined from 0.968 to 0.938, reflecting an apparent lack of economic efficiency in the management and allocation of ecological resources in the middle reaches during this phase.
4.1.2 Spatial distribution
Based on the horizontal comparison, from 2008 to 2017, the Yellow River Basin’s higher-level UEE presented a spatial pattern of “the lower reaches > the middle reaches > the upper reaches (Figure 3). Specifically: ① The UEE in the lower reaches was at the forefront among the three regions. Notably, the UEE of Qingdao, Dongying, Weifang, and five other prefecture-level cities achieved 0.8 or above, reaching a higher level, and their proportion exceeded 42% of the total urban area, with only Laiwu and Hebi having UEE below 0.6. ② The UEE in the middle reaches was generally not high, with significant internal disparities. Among them, Lvliang, Sanmenxia, Xi’an, and five other prefecture-level cities reached a UEE of over 0.800, but their proportion was less than 30% of the total urban area. Datong, Jiyuan, Tongchuan, and Pingliang had a UEE below 0.6, and more than 40% of the cities were between 0.6 and 0.7. ③ The UEE in the upper reaches was generally low. Only 26% of the cities achieved a higher UEE level of 0.8 or above, and more than 30% of the cities in the region had UEE below 0.6. The ranking of UEE in the upper reaches was at the end of the basin, indicating that the construction of urban ecological civilization in these cities has a long way to go.
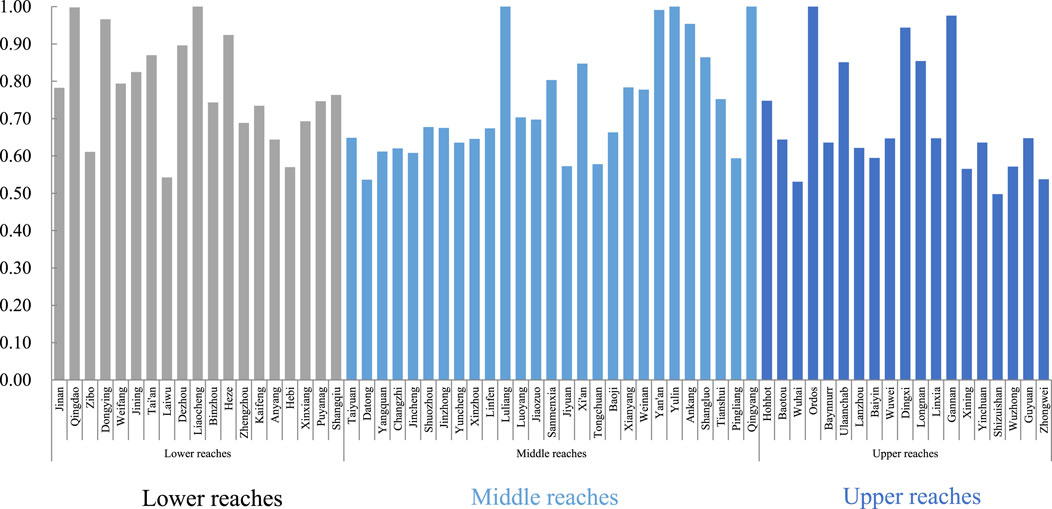
Figure 3. Urban ecological efficiency in the upper middle and lower reaches of the Yellow River Basin.
Based on the principle of equal interval partitioning, this research evenly divides the 10-year observation period with 2-year intervals, ultimately selecting the years 2008, 2011, 2014, and 2017 for analysis. From the perspective of efficiency decomposition, the 65 prefecture-level cities in the Yellow River basin are categorized into three types: double-driver type (where both pure technology efficiency and scale efficiency are greater than 0.9), technology-driver type (where pure technology efficiency is higher than scale efficiency, and at least one of them is less than 0.9) and scale-driver type (where scale efficiency is higher than pure technology efficiency, and at least one of them is less than 0.9). The results are shown in Table 2.
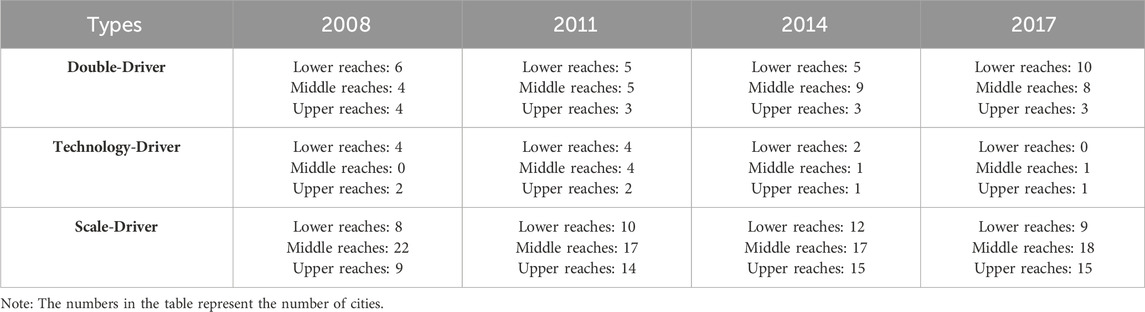
Table 2. Driving distribution types of urban ecological efficiency in the Yellow River basin (2008–2017).
Between 2008 and 2017, the Yellow River Basin experienced an increase in the number of double-driver cities, a decrease in technology-driver cities, and a relatively stable count of scale-driver cities. To elaborate, the count of double-driver cities rose from 14 in 2008 to 21 in 2017, with the lower reaches gaining 4 cities, the middle reaches gaining 3 cities, and the upper reaches gaining 1 city. This correlates with the UEE hierarchy of the Yellow River basin, which is characterized by“the lower reaches > the middle reaches > the upper reaches,” indicating that higher UEE is a synergistic outcome of both pure technical efficiency and scale efficiency. The number of technology-driver cities peaked in 2011 at 10, up from 6 in 2008, but then experienced a decline, with only 2 remaining by the end of the period. This suggests that the low pure technical efficiency of cities is a primary constraint on the overall ecological efficiency within the basin. The number of scale-driver cities showed minimal fluctuation, with the lower reaches has maintained stability, the upper reaches has experienced a progressive increase, and the middle reaches has shown a tendency to decline. Thus, for the middle reaches, the maintenance and enhancement of the current scale efficiency level are particularly crucial for advancing UEE.
4.2 Dynamic characteristics of urban ecological efficiency in the Yellow River Basin
4.2.1 Dynamics temporal evolution
Between 2008 and 2017, the Malmquist Index of UEE in the Yellow River Basin and its upper, middle, and lower reaches showed a fluctuating upward trend, with growth rates of 1.8%, 1.3%, 2.0%, and 2.2% respectively (Figure 4A). During these 10 years of fluctuating growth, 2012 marked the first significant peak, where the Malmquist Index of UEE for cities in the Yellow River Basin and its upper, middle, and lower reaches all shifted from negative to positive growth. The year 2016 was the second peak for the middle and upper reaches, and by 2017, the upper reaches experienced negative growth again, with an increase of −2.4%. However, the lower reaches has maintained continuous growth since 2014, with a growth rate as high as 15.8% in 2017.
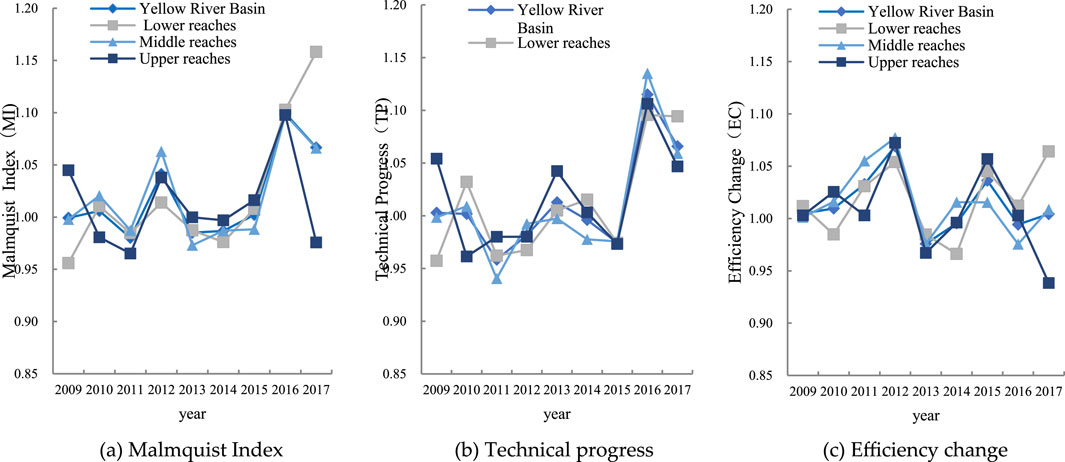
Figure 4. The Malmquist index and its decomposition of urban ecological efficiency in the Yellow River basin. (A) Malmquist Index. (B) Technical progress. (C) Efficiency change.
Upon further decomposition of the Malmquist Index, reveals the following trends for the UEE of the Yellow River Basin from 2008 to 2017: the technological progress (with an average annual growth of 1.2%) was generally lower than the efficiency change (with an average annual growth of 1.4%), but the efficiency change showed a downward trend. Specifically: ① Technical progress. From 2008 to 2017, the ecological efficiency of cities in the Yellow River Basin and its upper, middle, and lower reaches exhibited a fluctuating upward trend in terms of technological progress (Figure 4B). A notable surge in technological progress occurred for all three divisions between 2015 and 2016, followed by a modest retreat in 2017. ② Efficiency changes. The efficiency change component demonstrated a more pronounced pattern of fluctuation (Figure 4C). The years 2012 and 2015 marked two significant peaks. After 2016, with the exception of the upper reaches of the Yellow River, which continued to see negative growth, the overall efficiency of the Yellow River Basin as well as the middle and lower reaches began to recover and have since been in a state of growth.
4.2.2 Dynamic spatial distribution
To further explore the spatial distribution pattern of urban eco-efficiency in the Yellow River Basin and the three subregions, this research combines the natural breakpoint method of ArcGIS and the principle of equal intervals to classify the Malmquist index of urban eco-efficiency into four grades: high-growth (MI ≥ 1.2), medium-growth (1.1 ≤ MI < 1.2), low-growth (1 ≤ MI < 1.1) and negative-growth (MI < 1), ArcGIS 10.2 was used for visual analysis of 2008–2009 and 2016–2017 (Figure 5).
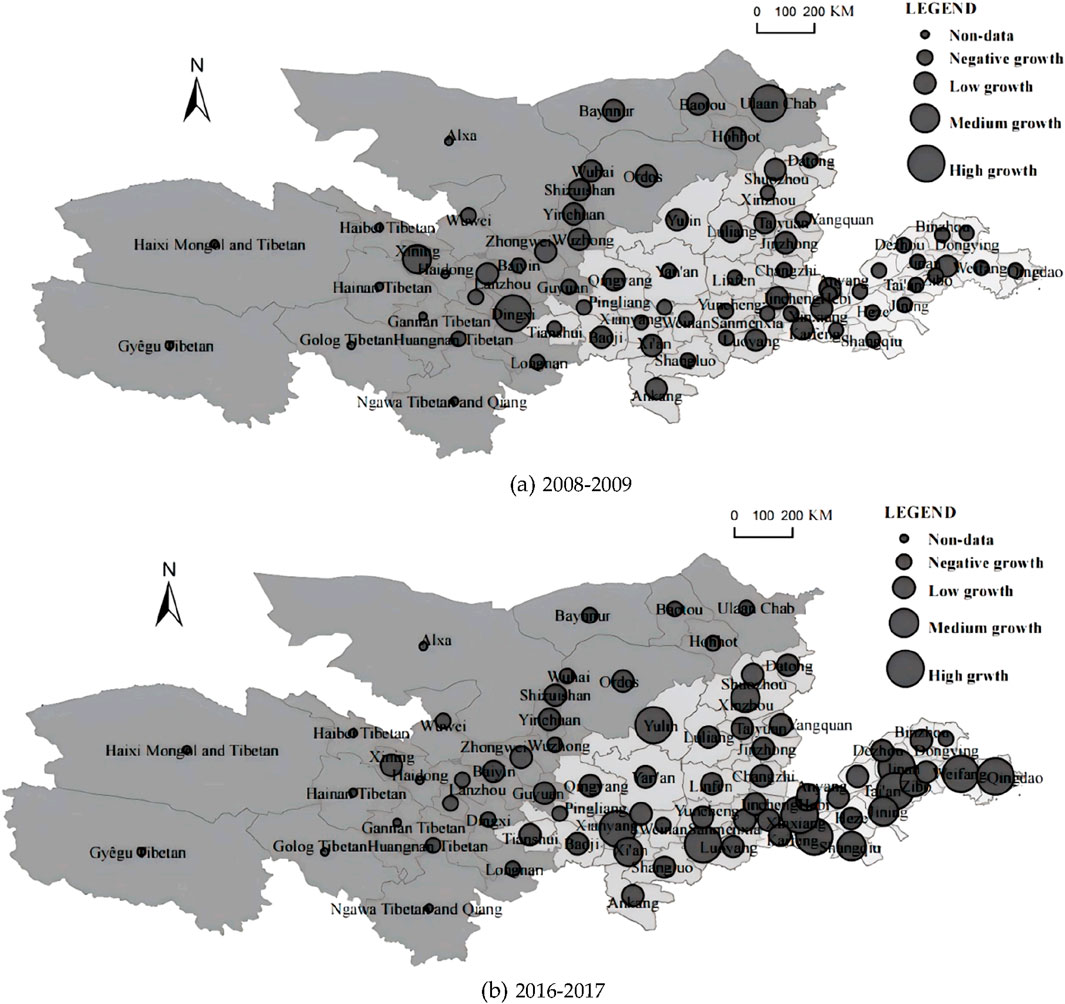
Figure 5. The Malmquist index distribution of urban ecological efficiency in the Yellow River basin. (A) 2008–2009. (B) 2016–2017.
From 2009 to 2017, the Malmquist index of UEE in the Yellow River Basin marked a period of notable escalation, and the cities with UEE growth have been shifting to the middle and lower reaches. Cities classified as high-growth increased in number by 4.5 times, while those with moderate growth saw a fivefold increase; both exhibiting a consistent trend of geographical redistribution from the upper reaches to the middle and lower reaches. The number of low-growth cities increased by 1.48 times, transitioning their spatial concentration from the upper and middle reaches to a dominance in the middle and lower reaches. Concurrently, the share of cities with a negative growth trajectory declined to 38% of the total initial count, with their spatial distribution pivoting from an upper and middle reach focus to a predominance in the lower reach.
Specific to the upper, middle and lower reaches of the Yellow River basin: ① Lower reaches. Approximately 95% of cities experienced an upward trend in UEE. The distribution of cities across the four categories in 2009 was 0, 0, 4, and 15, respectively, shifting to 6, 3, 9, and 1 by 2017. This improvement is closely related to the region’s advantageous geographical location and the enhancement in the quality of economic development. ② Middle reaches. Around 93% of cities saw an increase in UEE. The count of cities in the four brackets in 2009 was 0, 0, 11, and 16, which changed to 3, 2, 20, and 2 by 2017. This positive change is primarily attributed to the recent intensified ecological and environmental governance efforts in the area, including the closure of heavily polluting industries such as chemical and coal mining. ③ Upper reaches. The UEE in the upper reaches exhibited a decline. The distribution of cities across the categories in 2009 was 2, 1, 10, and 6, which shifted to 0, 0, 8, and 11 by 2017. The negative growth in ecological efficiency in the downstream cities increased from 32% of the total urban population in 2009 to 58% in 2017. This setback maybe due to the already fragile environmental base, further strained by energy consumption and resource extraction.
4.3 Analysis of influencing factors on urban ecological efficiency in the Yellow River Basin
To explore the factors influencing the UEE in the Yellow River Basin and its different sub-regions, this research selects six variables to construct a quantitative model for analysis. The regression results are shown in Table 3. Environmental regulation, scientific and educational investment, economic scale, and greening level significantly promote the improvement of UEE in the Yellow River Basin, but population density and industrial structure lead to a decrease in UEE. Specifically for each reaches:
(1) Environmental regulation significantly significantly boosts the UEE in the middle and lower reaches, but hinders the improvement of ecological efficiency in the upper reaches, which is lagging behind economically. The factor coefficients of environmental regulation for downstream, midstream, and upstream areas are 0.0044, 0.0893, and −0.1052, respectively, all of which pass the significance level test at 1%. In the in the middle and lower reaches, environmental policies have driven innovation in pollution-intensive industries, reducing emissions and enhancing ecological efficiency. Conversely, in the upper reaches, outdated environmental technologies and a focus on economic development at the expense of environmental concerns have led to increased pollution and a decrease in UEE.
(2) Population density significantly reduces the UEE in the middle and lower reaches. For every one-unit increase in population density, the UEE in the middle and lower reaches decreases by 0.0001 and 0.0831 units, respectively. This is largely due to the fragile ecological environment and limited carrying capacity of the Yellow River Basin, where population growth increases the consumption of resources and generates waste, exacerbating ecological damage and reducing ecological efficiency. The impact of population density on the UEE in the upper reaches is not significant, possibly because the low population base means growth is not substantial enough to alter ecological efficiency.
(3) Scientific and educational investment significantly lowers UEE in the lower reaches but improves it in the middle reaches. For every one-unit increase in scientific and educational investment, the UEE in the lower reaches decreases by 0.0159 units, while the UEE in the middle reaches increases by 0.1480 units.
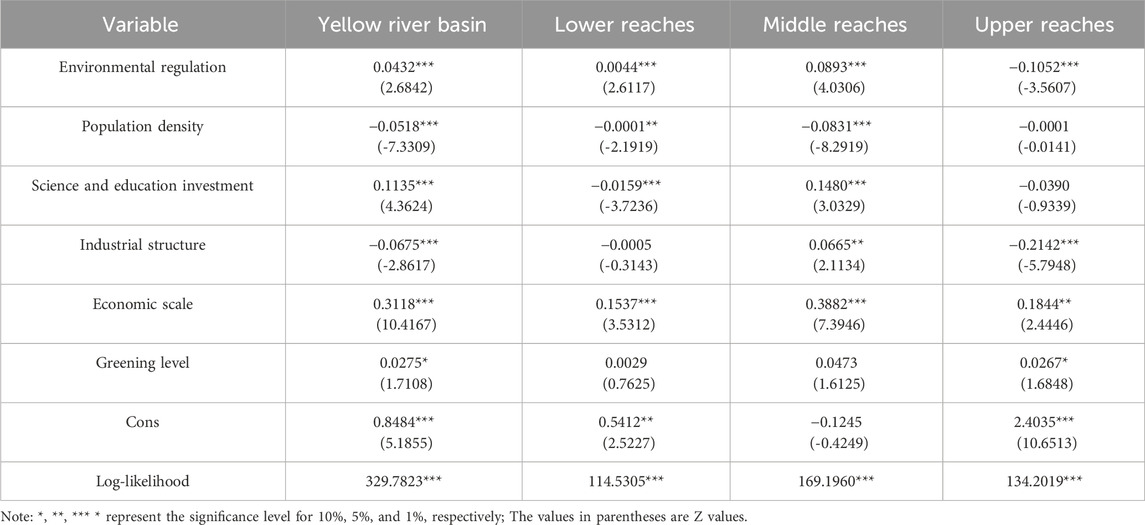
Table 3. Influencing factors on urban ecological efficiency in the Yellow River basin.
The large investment in the lower reaches may not be directly focused on ecological protection or sustainable development technologies and may not be promptly translated into effective environmental measures, resulting in reduced UEE. In contrast, midstream areas may more effectively enhance resource utilization efficiency through such investments, promoting ecological efficiency. The lack of significant impact on upstream UEE may be due to the “pump effect” not being evident, with low investment levels insufficient to drive technological innovation or raise environmental awareness significantly.
(4) The industrial structure significantly enhances UEE in the middle reaches (coefficient of 0.0665) but hinders the UEE in the upper reaches (coefficient of −0.2142). The middle reaches, being a major coal-producing region, benefits from the application of clean technologies and efficient pollution control in its large and advanced secondary industry, boosting the UEE. In contrast, the fragile ecological foundation in the upper reaches suffers from rapid environmental degradation due to industrial development, constraining ecological efficiency. In the lower reaches, the economic development and industrial transformation towards energy-efficient, environmentally friendly, and high-value-added industries may offset the negative impacts of traditional industries on the UEE, making the impact of industrial structure on downstream UEE not significant.
(5) Economic scale significantly improves the UEE of cities in the upper, middle, and lower reaches, with impact coefficients of 0.1844, 0.3882, and 0.5412, respectively. This indicates that urban economic development in the Yellow River Basin complements ecological efficiency, providing ample funding, human resources, and technical support for environmental protection and resource utilization.
(6) Greening level significantly promotes the improvement of UEE in the upper reaches. An increase of one unit in greening level leads to a 0.02167 unit increase in the UEE of the upstream area. The upstream area’s fragile ecology and decreasing vegetation coverage can be mitigated by higher greening levels, which can enhance public environmental awareness and promote UEE. However, in the upstream and midstream areas, the enhancement of greening levels may compete with land resources needed for economic development and may not significantly improve regional environmental awareness, thus not passing the significance test.
5 Conclusion and policy recommendations
5.1 Conclusion
This research employs the SBM-DEA model that incorporates undesirable outputs to measure the UEE of 65 prefecture-level cities in the Yellow River basin from 2008 to 2017. It further characterizes the dynamic evolution of the UEE using the Malmquist index and conducts an in-depth analysis of the influencing factors of UEE with the bootstrap truncated regression model. The main research conclusions are as follows:
(1) The UEE in the Yellow River Basin has seen a steady, albeit low, increase from 2008 to 2017, yet significant disparities existed in the upper, middle and lower reaches. With an average UEE of merely 0.736 during this decade, there is significant room for enhancement in the Yellow River Basin. The Malmquist index indicates an average annual growth rate of 1.8%, suggesting a progressive improvement in the utilization of ecological resources in the majority of cities. However, the disparity in the upper, middle and lower reaches is pronounced, with the lower reaches, exhibiting the highest UEE, surpassing the upper reaches, the lowest, by 8.6 percentage points.
(2) Insufficient pure technical efficiency has impeded the advancement of UEE in the Yellow River Basin from 2008 to 2017. Despite stable fluctuations in pure technical efficiency, the scale efficiency exhibited a fluctuating upward trend, underscoring that the primary cause of the overall low UEE is the lack of progress in pure technical efficiency. The spatial evolution analysis reinforces this view, with a notable decrease in the number of technology-driver cities.
(3) The higher levels of UEE in the Yellow River Basin generally exhibit a spatial pattern of “lower reaches > middle reaches > upper reaches.” Additionally, there is a continuous shift of cities with growing UEE towards the middle and lower reaches. The dynamic UEE Malmquist index classification results also support this conclusion, with over 90% of cities in the downstream and midstream areas experiencing an increase in ecological efficiency, while the upstream areas have seen a decline.
(4) Environmental regulations, investments in science and education, economic scale, and the level of greening significantly boost the UEE in the Yellow River Basin. Yet, population density and industrial structure are found to decrease UEE. These effects, however, are not uniform across the basin’s reaches; for example, environmental regulations impede UEE growth in the upstream areas, and scientific and educational investments have a detrimental effect on UEE in the downstream areas. Conversely, the industrial structure notably enhances UEE in the midstream areas.
5.2 Policy recommendations
To elevate the UEEwithin the Yellow River Basin, aligning with the conclusions drawn from this research and considering the practical state of ecological civilization construction in the region, the following recommendations are proposed:
(1) It is essential to fully acknowledge the current low levels of UEE across the Yellow River Basin and the significant disparities in coordinated development among the upper, middle, and lower reaches. Special attention must be given to the declining trend of UEE in the upstream areas, which, as the “Chinese Water Tower,” have a fragile ecological environment and relatively low economic development levels. Enhancing UEE is vital for the sustainable development of these areas.
(2) There should be a proactive effort to increase technical efficiency to foster conditions conducive to the improvement of UEE in the Yellow River Basin. During this process, particular emphasis should be placed on the technological transformation of scientific and educational investments. The middle reaches should capitalize on the strengths of such investments to enhance resource utilization efficiency. The downstream areas should prioritize the application of scientific and educational investments in ecological protection and sustainable development technologies, swiftly converting them into effective environmental and energy-saving measures. The upstream areas should boost scientific and educational investments to unleash their latent “pump effect.”
(3) The positive influence of environmental regulation, economic growth, and the level of greening on UEE should be harnessed. By diversifying industries and upgrading the industrial structure, the negative impact of industrial composition on UEE can be transformed into a force for development. Concurrently, it is imperative to moderately control population size, guide rational population mobility, manage urban population density, prevent the emergence of “urban diseases,” and mitigate the adverse effects of population density on UEE.
Data availability statement
The raw data supporting the conclusions of this article will be made available by the authors, without undue reservation.
Author contributions
ZQ-M: Conceptualization, Formal Analysis, Investigation, Methodology, Project administration, Supervision, Validation, Writing–original draft, Writing–review and editing. LJ-X: Data curation, Software, Supervision, Validation, Visualization, Writing–original draft, Writing–review and editing.
Funding
The author(s) declare that financial support was received for the research, authorship, and/or publication of this article. Scientific Research Fund Project of Yunnan Provincial Department of Education (2023J1044).
Conflict of interest
The authors declare that the research was conducted in the absence of any commercial or financial relationships that could be construed as a potential conflict of interest.
Publisher’s note
All claims expressed in this article are solely those of the authors and do not necessarily represent those of their affiliated organizations, or those of the publisher, the editors and the reviewers. Any product that may be evaluated in this article, or claim that may be made by its manufacturer, is not guaranteed or endorsed by the publisher.
References
Baosheng, W., Zhaoyin, W., and Changzhi, L. (2004). Yellow River Basin management and current issues. J. Geogr. Sci. 14, 29–37. doi:10.1007/BF02841104
Besné, A. G., Luna, D., Cobos, A., Lameiras, D., Ortiz-Moreno, H., and Güereca, L. P. (2018). A methodological framework of eco-efficiency based on fuzzy logic and Life Cycle Assessment applied to a Mexican SME. Environ. Impact Assess. Rev. 68, 38–48. doi:10.1016/j.eiar.2017.10.008
Cano-Orellana, A., and Delgado-Cabeza, M. (2015). Local ecological footprint using Principal Component Analysis: a case study of localities in Andalusia (Spain). Ecol. Indic. 57, 573–579. doi:10.1016/j.ecolind.2015.03.014
Central People’s Government of the People’s Republic of China (2022). Outline on ecological protection. Dev. Yellow River Basin. Available at: https://www.mee.gov.cn/ywgz/zcghtjdd/ghxx/202206/t20220628_987021.shtml (Accessed August 5, 2024).
Chen, Y., Fu, B., Zhao, Y., Wang, K., Zhao, M. M., Ma, J., et al. (2020). Sustainable development in the Yellow River Basin: issues and strategies. J. Clean. Prod. 263, 121223. doi:10.1016/j.jclepro.2020.121223
China National Bureau of Statistics (2023). The total population decreased slightly and urbanization continued to improve. Available at: https://www.stats.gov.cn/xxgk/jd/sjjd2020/202301/t20230118_1892285.html.
Côté, R., Booth, A., and Louis, B. (2006). Eco-efficiency and SMEs in nova scotia, Canada. J. Clean. Prod. 14, 542–550. doi:10.1016/j.jclepro.2005.07.004
FjiRE, R., Grosskopf, S., Lindgren, B., and Roos, P. (1992). Productivity changes in Swedish pharamacies 1980-1989: a non-parametric malmquist approach. J. Prod. Analysis 3, 85–101. doi:10.1007/bf00158770
Ge, W., Yang, D., Chen, W., and Li, S. (2023). Can setting up a carbon trading mechanism improve urban eco-efficiency? Evidence from China. Sustainability 15, 3014. doi:10.3390/su15043014
Guenster, N., Derwall, J., Bauer, R., and Koedijk, K. (2011). The economic value of corporate eco-efficiency. Eur. Financ. Manag. 17, 679–704. doi:10.1111/j.1468-036x.2009.00532.x
Guo, W., Xi, B., Huang, C., Li, J., Tang, Z., Li, W., et al. (2021). Solid waste management in China: policy and driving factors in 2004–2019. Resour. Conservation Recycl. 173, 105727. doi:10.1016/j.resconrec.2021.105727
Heymann, M. C., Paschoalino, F. F., Caiado, R. G. G., Lima, G. B. A., and Pereira, V. (2021). Evaluating the eco-efficiency of loading transport vehicles: a Brazilian case study. Case Stud. Transp. Policy 9, 1688–1695. doi:10.1016/j.cstp.2021.06.018
Lei, Y., Xiao, Y., Wang, F., Wang, R., and Huang, H. (2024). Investigation on the complex relationship between urbanization and eco-efficiency in urban agglomeration of China: the case study of Chengdu-Chongqing urban agglomeration. Ecol. Indic. 159, 111704. doi:10.1016/j.ecolind.2024.111704
Li, D., Liang, D., Li, T., and Chen, S. (2022). Ecological-economic coordination in the Yellow River basin: spatial and temporal evolution and driving mechanisms. Environ. Dev. Sustain 26, 3819–3848. doi:10.1007/s10668-022-02859-6
Liu, Q., Wang, S., Li, B., and Zhang, W. (2020). Dynamics, differences, influencing factors of eco-efficiency in China: a spatiotemporal perspective analysis. J. Environ. Manag. 264, 110442. doi:10.1016/j.jenvman.2020.110442
Liu, W., Shi, C., and Zhou, Y. (2021a). Trends and attribution of runoff changes in the upper and middle reaches of the Yellow River in China. J. Hydro-environment Res. 37, 57–66. doi:10.1016/j.jher.2021.05.002
Liu, W., Zhan, J., Zhao, F., Wei, X., and Zhang, F. (2021b). Exploring the coupling relationship between urbanization and energy eco-efficiency: a case study of 281 prefecture-level cities in China. Sustain. Cities Soc. 64, 102563. doi:10.1016/j.scs.2020.102563
Liu, X., Zhang, X., Yuan, M., Liu, J., and Zhou, G. (2024). Spatial-temporal differentiation of urban eco-efficiency and its driving factors: a comparison of five major urban agglomerations in China. PLOS ONE 19, e0300419. doi:10.1371/journal.pone.0300419
Long, L. (2021). Eco-efficiency and effectiveness evaluation toward sustainable urban development in China: a super-efficiency SBM–DEA with undesirable outputs. Environ. Dev. Sustain 23, 14982–14997. doi:10.1007/s10668-021-01282-7
Ma, H., Han, Y., Lv, K., Bi, M., and Zhong, Y. (2022). Urban eco-efficiency and its influencing factors in China based on the two-stage super-NEBM model. Systems 10, 217. doi:10.3390/systems10060217
Malmquist, S. (1953). Index numbers and indifference surfaces. Trab. Estad. 4, 209–242. doi:10.1007/BF03006863
Moutinho, V., Madaleno, M., and Macedo, P. (2020). The effect of urban air pollutants in Germany: eco-efficiency analysis through fractional regression models applied after DEA and SFA efficiency predictions. Sustain. Cities Soc. 59, 102204. doi:10.1016/j.scs.2020.102204
Nong, K., Lin, J., and Sun, D. (2024). Spatiotemporal patterns, effects, and the interactive driving mechanisms of urban sustainability based on the eco-efficiency framework: evidence from Chinese prefecture-level cities. Environ. Sustain. Indic. 23, 100391. doi:10.1016/j.indic.2024.100391
Shang, H., Ling, Y., Liu, Y., Li, Z., and Chen, R. (2024). Evaluation of urban eco-efficiency from the perspective of full carbon emission accounting. Clean. Techn Environ. Policy, 1–17. doi:10.1007/s10098-024-02908-w
Simar, L., and Wilson, P. W. (2007). Estimation and inference in two-stage, semi-parametric models of production processes. J. Econ. 136, 31–64. doi:10.1016/j.jeconom.2005.07.009
State Council of the People’s Republic of China (2021). Yellow River basin ecological protection and high-quality development planning. Beijing. Available at: https://www.gov.cn/zhengce/2021-10/08/content_5641438.htm (Accessed August 1, 2024).
Stefan, S., and Andreas, S. (1990). Ökologische Rationalität: Ansatzpunkte zur Ausgestaltung von ökologieorientierten Managementinstrumenten. Unternehm. 44, 273–290.
Suh, S., Lee, K. M., and Ha, S. (2005). Eco-efficiency for pollution prevention in small to medium-sized enterprises: a case from South Korea. J Industrial Ecol. 9, 223–240. doi:10.1162/108819805775247918
Sun, zhiyan, and Shi, shujie (2021). Yellow River governance | Optimizing water resources allocation is the first step for high-quality development of the Yellow River Basin. Surging news. Available at: https://www.thepaper.cn/newsDetail_forward_11745003.
Tan, J., and Wang, R. (2021). Research on evaluation and influencing factors of regional ecological efficiency from the perspective of carbon neutrality. J. Environ. Manag. 294, 113030. doi:10.1016/j.jenvman.2021.113030
The World Bank (2022). New program will reduce water scarcity, protect ecosystems in China’s Yellow River Basin. Available at: https://www.worldbank.org/en/news/press-release/2022/03/31/new-program-will-reduce-water-scarcity-protect-ecosystems-in-china-s-yellow-river-basin.
Tone, K. (2001). A slacks-based measure of efficiency in data envelopment analysis. Eur. J. Operational Res. 13, 498–509. doi:10.1016/s0377-2217(99)00407-5
Valente, A., Iribarren, D., Gálvez-Martos, J.-L., and Dufour, J. (2019). Robust eco-efficiency assessment of hydrogen from biomass gasification as an alternative to conventional hydrogen: a life-cycle study with and without external costs. Sci. Total Environ. 650, 1465–1475. doi:10.1016/j.scitotenv.2018.09.089
Wang, C.-N., Hsu, H.-P., Wang, Y.-H., and Nguyen, T.-T. (2020a). Eco-efficiency assessment for some European countries using slacks-based measure data envelopment analysis. Appl. Sci. 10, 1760. doi:10.3390/app10051760
Wang, H.-J., Zheng, M.-Q., Yin, H.-T., and Chang, C.-P. (2024). Green innovation, industrial structure and urban eco-efficiency in Chinese cities. Econ. Analysis Policy 82, 1011–1024. doi:10.1016/j.eap.2024.04.028
Wang, S., Hua, G., and Yang, L. (2020b). Coordinated development of economic growth and ecological efficiency in Jiangsu, China. Environ. Sci. Pollut. Res. 27, 36664–36676. doi:10.1007/s11356-020-09297-9
Wang, Y., Zhao, W., Wang, S., Feng, X., and Liu, Y. (2019). Yellow River water rebalanced by human regulation. Sci. Rep. 9, 9707. doi:10.1038/s41598-019-46063-5
Wursthorn, S., Poganietz, W.-R., and Schebek, L. (2011). Economic–environmental monitoring indicators for European countries: a disaggregated sector-based approach for monitoring eco-efficiency. Ecol. Econ. 70, 487–496. doi:10.1016/j.ecolecon.2010.09.033
Xinhuanet (2020). Why is the Yellow River rich in nine provinces? Sina Finance. Available at: https://finance.sina.com.cn/roll/2020-09-15/doc-iivhvpwy6865534.shtml (Accessed August 1, 2024).
Xu, S., and Wang, C. (2021). City image and eco-efficiency: evidence from China. Environ. Sci. Pollut. Res. 28, 52459–52474. doi:10.1007/s11356-021-14219-4
Yang, L., and Yang, Y. (2019). Evaluation of eco-efficiency in China from 1978 to 2016: based on a modified ecological footprint model. Sci. Total Environ. 662, 581–590. doi:10.1016/j.scitotenv.2019.01.225
Ye, T., Xiang, X., Ge, X., and Yang, K. (2022). Research on green finance and green development based eco-efficiency and spatial econometric analysis. Sustainability 14, 2825. doi:10.3390/su14052825
Yellow River Conservancy Commission of MWR (2023). Soil and water conservation bulletin inYellow River Basin (2023). Beijing, China: Yellow River Conservancy Commission of MWR. Available at: http://www.yrcc.gov.cn/gzfw/stbcgb/hhlystbcgb/202407/P020240705583444925080.pdf.
Zeng, X., Ma, Y., Ren, J., and He, B. (2022). Analysis of the green development effects of high-speed railways based on eco-efficiency: evidence from multisource remote sensing and statistical data of urban agglomerations in the middle reaches of the yangtze river, China. Int. J. Environ. Res. Public Health 19, 16431. doi:10.3390/ijerph192416431
Zhang, F., Xuan, X., and He, Q. (2022). A water-energy nexus analysis to a sustainable transition path for Ji-shaped bend of the Yellow River, China. Ecol. Inf. 68, 101578. doi:10.1016/j.ecoinf.2022.101578
Zhao, G., Tian, S., Jiang, E., Jing, Y., Chen, R., Wang, X., et al. (2024). Coordination analysis of flood-sediment transportation, eco-environment, and socio-economy coupling in the governance of the Yellow River Basin system. Sci. Rep. 14, 8090. doi:10.1038/s41598-024-58759-4
Zhong, S., Li, A., and Wu, J. (2023). Eco-efficiency of freshwater aquaculture in China: an assessment considering the undesirable output of pollutant emissions. Environ. Dev. Sustain 25, 3555–3576. doi:10.1007/s10668-022-02189-7
Zhou, X., Hao, H., Ye, X., Qin, Y., and Ma, X. (2016). A spatial-temporal analysis of regional economic inequality in the Yellow River Basin. Hum. Geogr. 31, 119–125. doi:10.13959/j.issn.1003-2398.2016.05.018
Keywords: Yellow River Basin, urban ecological efficiency, influencing factors, SBM-DEA model, bootstrap
Citation: Qian-Ming Z and Ji-Xia L (2024) Spatial and temporal changes and influencing factors of urban ecological efficiency in the Yellow River Basin. Front. Environ. Sci. 12:1435331. doi: 10.3389/fenvs.2024.1435331
Received: 20 May 2024; Accepted: 27 August 2024;
Published: 05 September 2024.
Edited by:
Liang Yuan, China Three Gorges University, ChinaReviewed by:
Thomas Ramsey, China Three Gorges University, ChinaPedzisai Kowe, Midlands State University, Zimbabwe
Copyright © 2024 Qian-Ming and Ji-Xia. This is an open-access article distributed under the terms of the Creative Commons Attribution License (CC BY). The use, distribution or reproduction in other forums is permitted, provided the original author(s) and the copyright owner(s) are credited and that the original publication in this journal is cited, in accordance with accepted academic practice. No use, distribution or reproduction is permitted which does not comply with these terms.
*Correspondence: Li Ji-Xia, MjAyMTMxMjYwMDIzQG1haWwuYm51LmVkdS5jbg==