- 1International Tourism Culture College, Guizhou Normal University, Guiyang, China
- 2Economic Institute, Guizhou University of Finance and Economics, Guiyang, China
Improving the supply efficiency of ecological products (EPSE) is of great significance to protect the ecological environment, promote the development of green industry and the sustainable growth of the economy. This paper focuses on constructing an evaluation index system for EPSE and exploring the relationship between the development level of the digital economy (DE) and EPSE in China. To measure the EPSE, the study employs the Undesirable Slacks-Based Measurement (SBM) Model across 30 provinces, cities and districts in China from 2011 to 2022. Furthermore, the research utilizes spatial econometric models, panel threshold effect models, and other methodologies to investigate the impact mechanism and non-linear relationship between DE and EPSE. The research shows that: (1) The overall level of EPSE in the study area is relatively low, with significant development differences observed; (2) The DE has a nota-ble spatial spillover effect on EPSE, with a significantly negative impact in neighboring areas; (3) The development of the DE promotes EPSE through the upgrading of human capital structure, industrial structure, and increases in local government fiscal revenue and corporate operating profits; (4) Heterogeneity analysis shows that the impact of DE on EPSE varies significantly across eastern, central, and western China, with positive effects pronounced in the eastern and western regions; (5) Regression results of the threshold effect indicate a significant single threshold effect on the impact of DE development level on EPSE. Specifically, when the threshold value is less than 0.1232, DE significantly contributes to the improvement of EPSE. This paper contributes new literature evidence and factual references to the understanding of the causal relationship between DE and EPSE. The findings highlight the importance of considering spatial spillover effects, impact mechanisms, and regional heterogeneity in analyzing the relationship between DE and EPSE. The research also suggests that promoting the development of the digital economy could be a viable strategy to enhance EPSE, especially in regions where the threshold value is below 0.1232
1 Introduction
In the 21st century, with the continuous development of the global economy and the continuous growth of the population, the dependence and consumption of human society on natural resources has reached an unprecedented height Ariken et al., 2021; Yin et al., 2021. However, this process is also accompanied by severe challenges such as environmental degradation and ecological imbalance Carpenter et al., 2009; Lin et al., 2020; Ruckelshaus et al., 2020, forcing us to re-examine the relationship between economic development and ecological protection. Ecological products EP DU et al., 2022b; Wang et al., 2023, as an important resource endowed by nature to human beings, not only carry multiple ecological service functions such as regulating climate, purifying environment and maintaining biodiversity, but also are the cornerstone of sustainable development of human society Gao et al., 2022. Therefore, improving the efficiency of EP supply, realizing the efficient utilization of resources and the effective protection of the ecological environment have become an important issue to be solved urgently.
The supply efficiency of ecological products EPSE, in short, refers to the ability to produce EP that meet human needs with the least resource input and environmental cost in a certain period of time Jing and Hao, 2018. It is directly related to the rational allocation of ecological resources, the health of the ecological environment and the wellbeing of human society Pascual et al., 2022. However, in the traditional development model, due to information asymmetry, backward technology, poor management and other reasons, the supply of EP often has problems such as low efficiency and low quality, which is difficult to meet the growing ecological needs Ariken et al., 2021. In the face of this challenge, we need to explore effective ways to improve the EPSE from multiple dimensions. The vigorous development of the digital economy DE Li et al., 2023a provides new ideas and solutions for solving this problem. The DE takes data as the core resource Guaita Martínez et al., 2022 and relies on advanced technologies such as the Internet, big data, cloud computing, and artificial intelligence to build an efficient, intelligent, and open economic ecosystem Luo et al., 2023. This system has a profound impact on all aspects of the supply of EP by optimizing resource allocation, promoting information circulation, and improving decision-making efficiency Chen et al., 2023; Lu and Haoming, 2023; Rusch et al., 2022, thus forming a unique impact mechanism. Therefore, it is particularly urgent to clarify how the DE can empower the EPSE.
The concept of EP in China appeared in the “National Main Functional Area Plan” issued by the State Council in 2010, which proposed to enhance the production capacity of EP as an important task of land space development Gao et al., 2022. “EP” as a characteristic expression of China, refers to natural elements to maintain ecological security, ensure ecological regulation function, and provide a good living environment, including fresh air, clean water, and pleasant climate Wang et al., 2023; Y et al., 2022. On such a basis, EP evolve into final products or services provided by the ecosystem through joint action of biological production and human social production and are used as well as consumed by human society Du et al., 2022a. The closest study is about ecosystem services in the world Bouwma et al., 2018; Costanza et al., 1997; Fisher et al., 2009; Stevenson et al., 2021. EP or ecosystem services, especially ecological regulation products, have significant externalities and indivisibility Dimitrov et al., 2023; Perrings et al., 2010. The realization of their value is complex and depends on quality. At the same time, they integrate the dual attributes of natural reproduction and social reproduction Wang et al., 2023, and are often manifested as compound products, which are the comprehensive embodiment of ecological, economic, social and cultural values Du et al., 2022a. At present, the research on the EPSE mainly focuses on the measurement of the EPSE, the types of regional and EP and the influencing factors. Firstly, the research on the measurement of supply efficiency mainly involves the difference of measurement methods and evaluation index systems. In the measurement method, scholars mostly use data envelopment analysis to evaluate the EPSE Hong-rui and Jie-hua, 2017; Hua and Shunbo, 2021; Hui and Hai-quan, 2021; Ya-mei and Yu-xin, 2020; Ying Z. et al., 2018. On this basis, scholars pay more attention to the improved DEA model, that is, the SBM model Rong, 2023; Yixiong et al., 2022, to measure the supply efficiency, and the construction of the index system is more practical, considering the part of the undesired output. Secondly, scholars have explored the supply efficiency of different regions or certain types of EP. The research on the supply efficiency of different regions mainly includes the Yangtze River Basin Chunlin and Yuting, 2023, Northeast China Hong-rui and Jie-hua, 2017; Hui and Hai-quan, 2021, Zhejiang Zhoushan Yixiong et al., 2022 and other coastal areas Yi-xiong et al., 2022. In addition, more attention is paid to the exploration of the supply efficiency of specific types of EP, including marine EP Yi-xiong et al., 2022, rural ecological public products Hua and Shunbo, 2021, water EP Yixiong et al., 2022, forest EP Hui and Hai-quan, 2021; Ying et al., 2018b, etc. Thirdly, the research on the influencing factors of supply efficiency is mainly analyzed from the perspectives of supply mode, management strategy, economy, science and technology, and industrial structure. The efficient collaboration of EP suppliers is the key to improve the EPSE. Therefore, it is particularly important to explore the EP supply model suitable for China’s national conditions, such as the PPP model Fan-rong and Ai-ping, 2016; Ying et al., 2018a, multi-agent collaborative governance Li, 2016, etc. However, because of the public nature of EP, the government pays more attention to how to balance the input and output efficiency of EP Pascual et al., 2022 and how climate change affects the EPSE in management decisions Susaeta et al., 2016. At the same time, some scholars have analyzed the influence of economy, science and technology, and industrial structure on the EPSE Jing and Hao, 2018; Yi-xiong et al., 2022, and put forward the concept of overall governance such as changing the mode of economic development. In addition, China’s DE has begun to shift to a new stage of deepening application, standardized development and inclusive sharing Liu et al., 2022. The development of DE is promoting the transformation of green production mode and the improvement of production efficiency Tao et al., 2020a. The theoretical research on DE and EP has also been carried out, such as the relationship between DE and the realization of EP value Fuchen et al., 2023; Lu and Haoming, 2023; Zhouying et al., 2024, the relationship between DE and the value conversion efficiency of EP or green ecological efficiency Fanbin et al., 2023a; Xiao et al., 2023; Yang and Liang, 2023, and the relationship between DE and the supply of EP Chen et al., 2023; Rusch et al., 2022; Xue and Xue-tao, 2023; Yang et al., 2024. These studies provide a theoretical and methodological reference for further exploring the mechanism of DE development to promote the value realization of EP. However, in the research of DE development and EP, there is still a lack of quantitative exploration of the impact of DE development on the EPSE in China.
In summary, compared with the existing literature, this paper is mainly different in three aspects: Firstly, about the index system of EPSE, the existing research input indicators mostly select the factor input of all industries such as labor input of all industries, lack of pertinence, or their undesired output indicators are not perfect such as only considering noise pollution, ignoring the relevant elements of ecological regulation services. On this basis, this paper optimizes and improves the index system of EPSE, and systematically analyzes the China’s EPSE as a whole. Secondly, the existing research mainly emphasizes the direct impact of the DE on a certain type of EP, and lacks in-depth discussion on the impact mechanism of the DE on the EPSE. This paper focuses on clarifying how the DE can empower the EPSE. Finally, based on the conclusions of empirical analysis, policy recommendations are put forward from the aspects of digital development and transformation, institutional mechanism innovation and human capital structure reform.
The organizational structure of the rest of this article is as follows. Section 2 is the theoretical mechanism and research hypothesis, while Section 3 is the research design, including the introduction of research methods and variable descriptions, Section 4 is empirical analysis, including the current characteristics, empirical results, robustness and endogenous test of EPSE and DE, Section 5 is a further discussion of the research content, exploring the impact mechanism, heterogeneity analysis and non-linear impact of the DE on the EPSE, and finally Section 6 summarizes the research and puts forward countermeasures and suggestions.
2 Theoretical mechanism and research hypothesis
During economic development, the input of ecological resources plays a significant role in influencing the economic growth of wealthy regions. In the neoclassical economic growth theory, Cobb-Douglas function, as a commonly used production function model, can illustrate the contribution of various factors to the output. On this basis, this paper constructs the production function of EP, which is essentially a technical formula for transforming labor, capital and ecological resources into a certain commodity or service. On this basis, this paper constructs the production function of EP, which is essentially a technical formula for transforming labor, capital and ecological resources into a certain commodity or service Wang et al., 2021. The production function model and logarithmic form of EP are as formulas 1, 2.
Where: Q represents the total output of EP and takes two forms: physical quantity and monetary value, while γ, θ, α, β and δ are the output elasticity coefficients, and λ is a constant term; E is irreplaceable in the production of EP, refers to all kinds of natural resources that provide ecological services and ecological carrying capacity Wang et al., 2022, includes not only biological resources such as natural resources, but also natural ecosystems, and ecological and cultural resources that have been integrated into natural ecosystems and coordinated with each other for a long time Ma et al., 2020; K is capital, which is the key factor to improve the value of EP and market transformation; L is labor input, and human impact on the ecosystem is ubiquitous as human labor protection, restoration and construction are essential to ensure the production capacity of the ecosystem Subramanian, 2019; N is the amount of land input and refers to the narrow concept of land occupied by the management and development of EP Yang et al., 2022, in which traditional production function pays more attention to the substitution whereas EP production function to the complementarity between the factors Subramanian, 2019; Yao et al., 2022; A is other inputs such as technology that mainly improves the ecological production capacity of the ecosystem by restoring the balance of the ecosystem, indirectly increases the output, and directly enhances the premium capacity by improving the development and operation, of EP. To some extent, capital and land follow the law of diminishing marginal returns, and there is a certain substitutability between them. But this substitutability of ecological resources is limited, and even impossible in some cases. Based on the production function, the EPSE is usually the maximum ecological output of the given input or the minimum cost of the given output. Based on this, this paper holds that the EPSE refers to the maximization of the supply of EP with the minimum resource input and environmental pollution under the premise of ensuring the safety of the ecological environment. This includes not only the fresh air and clean water directly provided by the natural ecosystem but also the ecological value indirectly realized through the ecological utilization industry. Therefore, improving the EPSE will not only help protect the ecological environment, but also promote the development of green industries and promote sustainable economic growth.
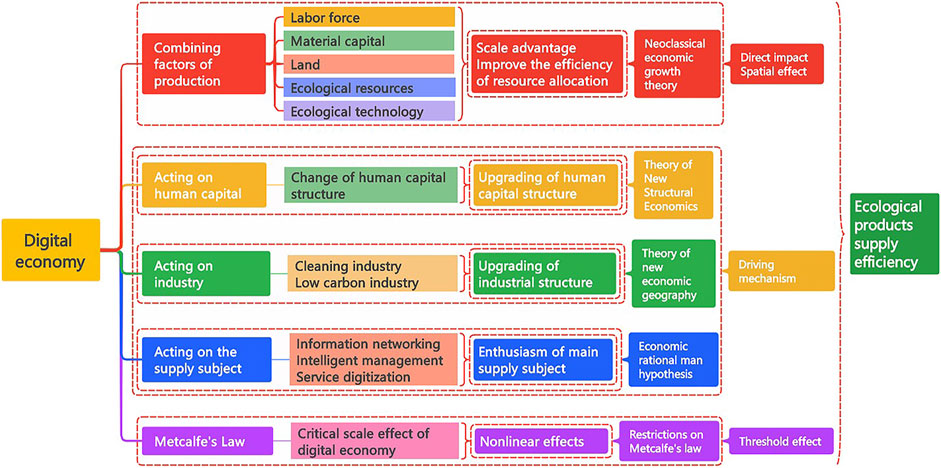
The DE affects the supply mode of EP by acting on the production factors of EP and then affects the EPSE. Combined with the production function, data, as an input factor, is combined with labor force, material capital, land resources, ecological technology and ecological resources to adjust and optimize the allocation of resources, form the scale advantage of ecological factor allocation, promote the transformation of ecological production factors into EP, and then improve the EPSE. Specifically, firstly, digital technology is combined with production factors such as labor capital, material capital and ecological resources to further optimize resource allocation and form scale advantages Fanbin et al., 2023a; Liu et al., 2022. Secondly, through advanced ecological technology, the effective integration of the DE and the development of EP-related industries reduces the degree of ecological damage caused by high-polluting industries, thus alleviating the environmental pressure caused by high-polluting operations Zhang et al., 2021b, thereby improving the EPSE. Thirdly, the development of the DE has alleviated the problem of information asymmetry in the supply of EP to a certain extent Tao et al., 2020a. At the same time, through precision marketing, reducing marketing costs, enhancing brand influence, promoting supply chain coordination and optimization, and promoting green consumption, the DE helps to improve the supply efficiency and market competitiveness of EP Łęgowik-Małolepsza et al., 2024.
In addition, the development of the DE has alleviated the problem of information asymmetry in the supply of EP to a certain extent Tao et al., 2020b, thereby reducing supply costs and improving supply efficiency. The DE itself has the characteristics of openness and sharing. By compressing the space-time transmission distance of information transmission, it effectively breaks the state of regional dispersion and isolation, and strengthens the breadth and depth of inter-regional economic activities. Moreover, knowledge and information itself have the characteristics of strong mobility and easy dissemination. Through the inter-regional cooperation and sharing mechanism Herman and Oliver, 2023, it guides the deep integration of the DE and the EP industry. The popularity of the Internet can optimize the efficiency of inter-regional resource allocation, increase the opportunities for inter-regional enterprise cooperation and development, promote regional economic growth, and promote the development of digital finance. Domestic and foreign scholars generally believe that the Internet has spatial spillover effects Li G. et al., 2023. In theory, the impact of the DE based on Internet technology on the EPSE should also have spatial spillover effects. Therefore, the following research hypotheses are proposed.
Hypothesis 1:. DE can promote the EPSE and has a spatial spillover effect.
The growth of DE will lead to some changes in human capital structure. The proportion of advanced human capital required for the growth of DE will increase, and the proportion of primary human capital will decrease Zhang and Lian, 2023, that is, the advancement of human capital will lead to the innovation of the human capital market Wu and Yang, 2022. The theory of new structural economics shows that in the process of human capital upgrading, with the dynamic transformation of the proportion of primary and intermediate human capital and senior human capital, the optimal demand of human capital required by the social and economic structure is met, and senior talents are transported for the sustainable growth of the economy Guaita Martínez et al., 2022, to improve the production capacity of human labor protection, restoration and construction of ecosystem, and improve the supply efficiency. Therefore, the following research hypotheses are induced stepwise.
Hypothesis 2a:. DE improves the EPSE by promoting the upgrading of the human capital structure.
The new economic geography theory shows that the diffusion effect of information technology makes the interconnection between economies closer Tao et al., 2020a. With continuous diffusion, DE will foster the transformation and upgrading of industrial structure. The growth of DE provides more developmental opportunities for technological innovation. The advancement of digital technology has led to the emergence of high-tech industries and the changes in industrial structure. The composition of labor, capital, and technology-intensive industries has shifted, with a decline in the proportion of the former and an increase in the latter two, which has led to a more advanced industrial structure. The tertiary industry in the DE accounts for a significant proportion and causes relatively little ecological damage. The energy consumption per unit of GDP in the tertiary industry is significantly lower than that of the secondary industry. When the industry with relatively low ecological impact assumes a leading position Chen et al., 2022, the carbon emission intensity can be reduced and the supply of EP can be enhanced and improve the supply efficiency. Therefore, the following research hypotheses are further induced.
Hypothesis 2b:. The growth of DE improves the EPSE by promoting the upgrading of the industrial structure.
As digital infrastructure improves and the integration between the digital industry and the EP industry deepens, the process of digital construction of the EP industry will be promoted. In the process of digitalization of EP, the digitalization construction of the main body of EP supply is a process of mutual integration between the main body of EP supply, economy and society Luo et al., 2023. Digitization can better coordinate the relationship between the government, market and social development, reduce the cost of governmental regulation and enterprise management, improve the efficiency of government and enterprise management, and thus increase governmental budget revenue and enterprise operating profit by enabling the government agencies and enterprises to obtain network EP information, intelligent ecological industry management, and digitize social-ecological services. Although the government is the representative of the public interest, but from the perspective of economic rationality, when the burden of governmental regulation becomes excessive, the government’s motivation to offer environmentally-friendly products can be diminished Kemkes et al., 2010. So the government’s financial strength is very important to improve the EPSE. The enterprises generally provide EP because of the need to maximize profits or assume social responsibilities. With the empowerment of digitalization to enterprises, the cost of producing EP is reduced and the profit is relatively increased, thus improving the enthusiasm of enterprises to supply EP and promoting supply efficiency Sheng et al., 2020. Therefore, the following hypotheses are induced.
Hypothesis 2c:. DE improves the EPSE by increasing governmental revenue.
Hypothesis 2d:. DE improves the EPSE by increasing the operating profit of enterprises.
The development of DE has made the high-quality online product trading market more prosperous and weakened the production boundary of different departments, further improving the efficiency of social operation Tao et al., 2020b. Based on this, with the digital development of EP-related industries, the internal structure and operation efficiency of various industries have been optimized and improved, thus improving the EPSE. However, according to Metcalfe’s Law, the positive spillover effect of DE development will also face a critical scale Rohlfs, 1974, that is to say, this spillover effect may have nonlinear characteristics. Therefore, the impact of DE on the EPSE may also change Han et al., 2022, with non-linear characteristics. Therefore, the following research hypothesis is finally induced:
Hypothesis 3:. The DE has a threshold effect on the EPSE.
The theoretical mechanism of DE on the EPSE is shown in Figure 1.
3 Research design
3.1 Research methods and model construction
3.1.1 Entropy TOPSIS
This paper uses the entropy weight TOPSIS method which can fully consider the importance of each attribute, to evaluate DE and the EPSE. In addition to avoiding the influence of subjectivity and uncertainty on the decision results, this method can also deal with situations where there is a correlation between the attributes, effectively exerting the advantages of the two and improving the accuracy and reliability of decision-making Li G. et al., 2023; Li X. et al., 2023. In addition, the entropy method is used to measure the expected output and undesired output. Because this method are relatively mature, the specific details refer to the research of Tan and Qi 2023.
3.1.2 Undesirable SBM
In the DEA efficiency evaluation model, the measurement of efficiency allows all inputs to be reduced in proportion or requires all outputs to be increased in proportion. However, when there is non-zero relaxation of input or output, the part of relaxation improvement is not reflected in the measurement of efficiency value Wang et al., 2024. Therefore, the use of the CCR model or BCC model tends to overestimate the efficiency of decision-making units. In practical applications, there are sometimes so-called “undesirable outputs”, that is, undesirable output results. In this case, the traditional DEA model is unable to meet the requirements of the monotonic linear relationship. Based on this, Tone 2001 proposed the SBM Slack Based Measure model. It successfully solves the problem of neglecting slack variables and failing to meet the monotonic linear relationship in the process of efficiency evaluation. The undesirable SBM model is a derivative form of the DEA model. Compared with the traditional DEA model, the undesirable SBM model can not only avoid the deviation caused by radial and angle measurement but also fully consider the influence of undesirable output factors in the production process, to more truly reflect the essence of efficiency evaluation. Therefore, this paper uses the SBM model considering undesired output and non-oriented considering both input and output to measure the EPSE. Suppose it has
3.1.2.1 Objective function
3.1.2.2 Constraint conditions
Where:
3.1.3 Construction of spatial econometric model
The previous theoretical analysis shows that the growth of DE and EPSE have certain spatial spillover effect. Therefore, this paper uses the spatial panel model to verify the impact of DE on the EPSE, and the spatial correlation is first verified. If there is a spatial correlation, the spatial econometric model Li et al., 2023a is screened. Otherwise, the ordinary panel model is used. If there is no spatial correlation, the ordinary panel will be used for regression analysis. The Moran’s index I is shown in formula 5:
Where:
After the spatial correlation test, the spatial econometric model was screened by the LM test, Hausman test, LR and Wald test. The general models of the ordinary panel and spatial panel are shown in formulas 6 –96 –96 –9:
Among them, formula 6 stands for the ordinary panel model, while formula 7 for the SAR, formula 8 for the SEM, and formula 9 for the SDM. The control variable is Z. The spatial lag terms of the EPSE, DE and Z are
3.1.4 Construction of panel threshold model
To further explain the nonlinear impact of the DE on the EPSE, this paper constructs the following panel threshold model Yu et al., 2023 to further test the theoretical hypothesis. The general model of the panel threshold is shown in formula 10:
Where: The threshold variable is T, the threshold value is λ, I∙ represents the indicative function of the threshold model. If it is true in brackets, the I will be one; otherwise, I is 0.
3.2 Variable declaration
3.2.1 Explained variable
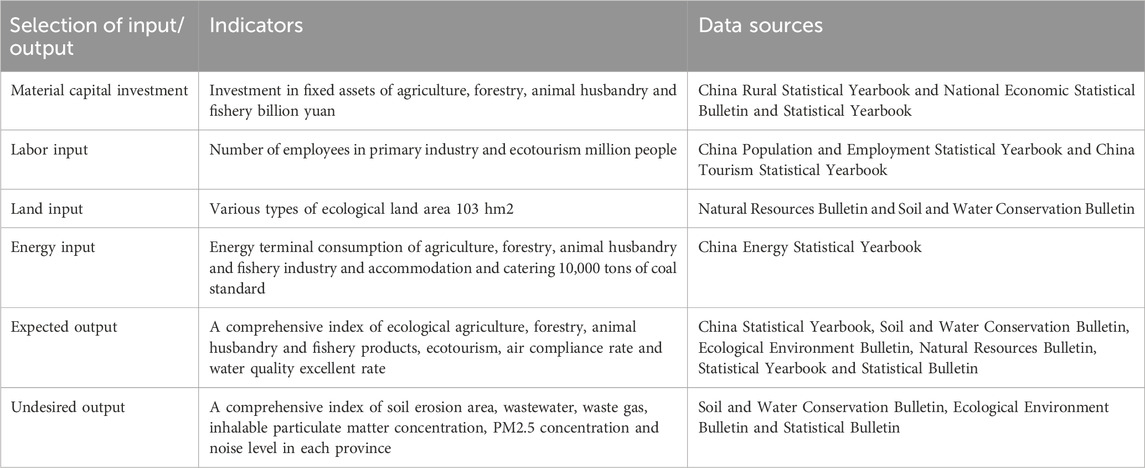
Based on the source of the main body of EP production, the form of expression, the perspective of function and the division of supply subjects, and drawing on the existing research, this paper selects the input indicators for the measurement of the EPSE as material capital input, land input, labor input and energy input related to EP. The output indicators are divided into expected output and unexpected output. Referring to the “green development index system”, “ecological civilization construction assessment target system” and “EP total value accounting standard” formulated by the National Development and Reform Commission, combined with the connotation and characteristics of EP, this paper mainly provides services in the natural ecosystem and provides the final product output under the support conditions as the basis for the selection of output indicators. The expected output is EP such as ecological agriculture, forestry, animal husbandry and fishery products, ecological regulation products, and ecological tourism, etc. Undesired output is soil erosion area, wastewater, waste gas, inhalable particle concentration, PM2.5 concentration and noise level. The SBM model generally requires that the number of decision-making units is 3–5 times the number of indicators. Therefore, this paper calculates the relevant EP and non-EP respectively, and uses their comprehensive index as the expected output and non-expected output, and then calculates the EPSE. The specific index system is shown in Table 1.
3.2.2 Core explanatory variables
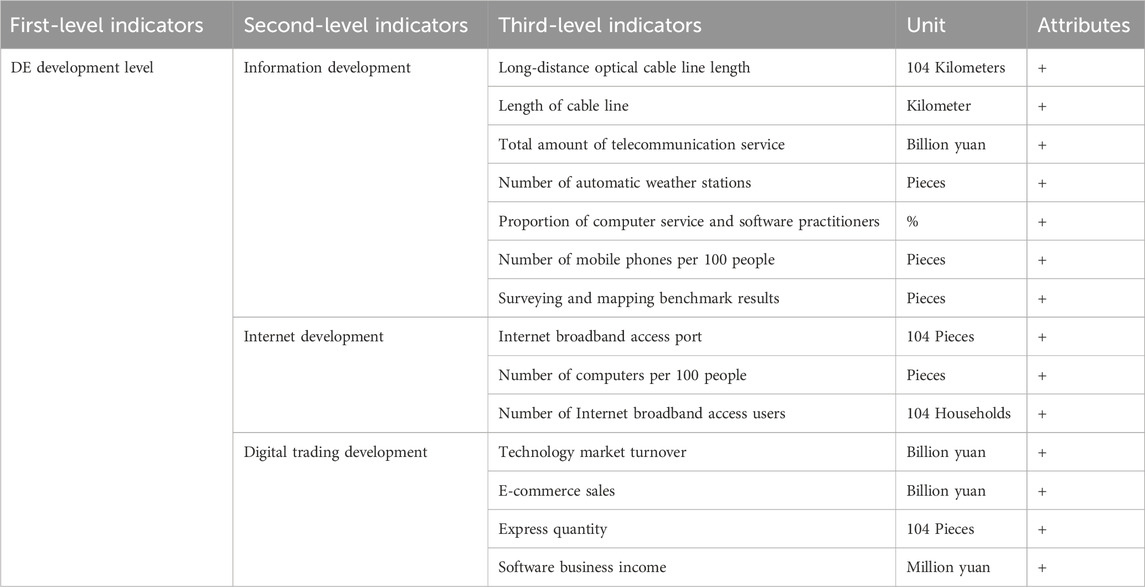
The DE is measured by the composite index. Currently, there is no unified standard for measuring the development level of DE in academia. Drawing on the existing academic achievements Han et al., 2022; Ren et al., 2023; Zhang et al., 2021b, this paper assesses the comprehensive index of DE development across three domains: information technology development, internet infrastructure development, and digital transaction activity development, as outlined in Table 2. Informatization development is the basis of DE development, which promotes the transformation and upgrading of traditional industries and improves the structure of economic development. The development of the internet is the embodiment of the growth of digital technology, improves the industrial structure, etc., and further promotes the growth of the ecological economy. The growth of digital transactions provides insight into the market size and development pattern of DE. To enhance accuracy and reliability, this study employs entropy weight TOPSIS to calculate the comprehensive index of DE development.
3.2.3 Mechanism variables
Combined with theoretical analysis, this paper discusses the optimization of human capital, the optimization of industrial structure and the enthusiasm of EP suppliers from the government and enterprises as mechanism variables, which are measured by the proportion of advanced education Hc, the proportion of tertiary industry Ti, local government fiscal revenue Gr and enterprise operating profit Tp. To eliminate heteroscedasticity, the absolute quantities Gr and Tp are logarithmically processed.
3.2.4 Control variables
The control variables mainly construct the analysis framework of the influencing factors of the EPSE from the aspects of education level, science and technology level, information level, economic development, urbanization level, population density and environmental regulation Jiun et al., 2022; Sun and Wu, 2020. Education level Edu selects the proportion of regional colleges and universities in the national totality as the measurement index; the level of science and technology Tec is gauged by the proportion of regional patent applications to the national total. The urbanization rate Urb is determined by the proportion of the urban population to the national total. Population density Pop is calculated as the number of people per square kilometer, and the intensity of environmental regulation Env is assessed using the ratio of industrial pollution control investment to industrial added value Song et al., 2021. The control variable indexes all select the relative number to represent the development level, which can abstract the absolute difference of the phenomenon and make the comparison between the regions more meaningful.
3.3 Data sources
China first proposed the concept of EP in 2010, so this paper selects data from 30 provinces autonomous regions and municipalities also called provinces except Hong Kong, Macao, Taiwan and Tibet in China from 2011 to 2022 as research samples. The original data is derived from the China Rural Statistical Yearbook, China Population and Employment Statistical Yearbook, China Tourism Statistical Yearbook, China Statistical Yearbook, China Energy Statistical Yearbook, Soil and Water Conservation Bulletin, Ecological Environment Bulletin, Natural Resources Bulletin, the statistical yearbooks and statistical bulletins of the provinces and municipalities over the years. Some missing data are estimated by the average growth rate of the past 5 years. Table 3 shows the variable description and measurement methods.
4 Empirical test
4.1 Variation characteristics of EPSE and DE development
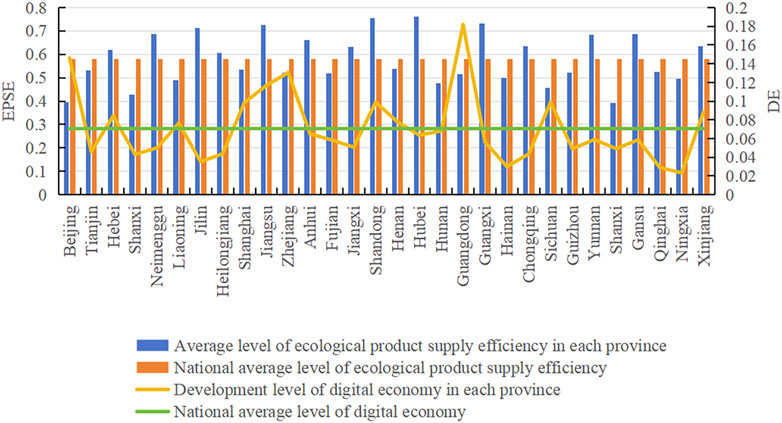
The comprehensive index of EPSE and DE development of 30 provinces municipalities and autonomous regions in China from 2011 to 2022 is calculated. Firstly, the EPSE in various provinces and cities is obviously different, and the national average level is 0.579. Among them, the EPSE in Hebei, Jilin, Heilongjiang, Jiangsu, Guangxi, Yunnan and Gansu is higher than the national average level. The EPSE in Beijing, Shanxi, Hunan and Shaanxi is relatively low, far below the national average. Secondly, the average level of the DE development in all provinces and cities is generally not high, and the national DE development level is only 0.071. Among them, the development level of the DE in Beijing, Shanghai, Jiangsu, Zhejiang and Guangdong is much higher than the national average, while the development level of DE in Shanxi, Jilin, Hainan, Qinghai and Ningxia is much lower than the national average. The related change trend is shown in Figure 2.
4.2 Analysis of model regression results
4.2.1 Descriptive statistics
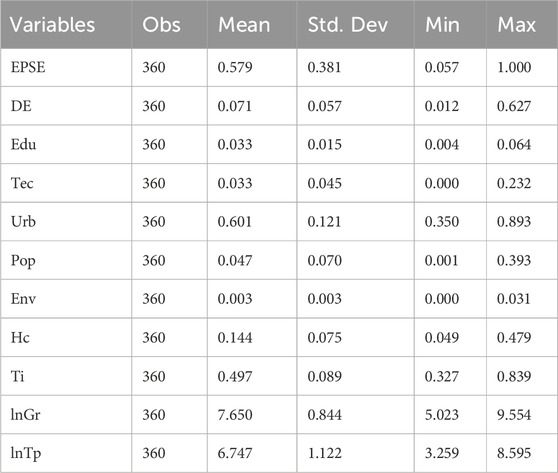
It can be seen from Table 4 that the maximum value of EPSE is 1, the minimum value is 0.057, and the mean and variance are 0.579 and 0.381, respectively, indicating that the EPSE between the study areas is quite different. The maximum value of DE is 0.627 and the minimum value is 0.012, indicating that the development level of DE in different years is also different. The statistical results of other variables are also within the normal range.
4.2.2 Parametric test
Panel unit root tests include the LLC test, IPS test and HT test Wu et al., 2024, in which the LLC test is suitable for the long panel while the IPS and HT tests are for the short panel. Combined with the panel data in this paper, IPS and HT are selected to test the data stability. The test results show that all unit roots are stable and reject the null hypothesis. The results of the KAO cointegration test show that the p-value of ADF is significant at the level of 5%, rejecting the original hypothesis that all variables have a cointegration relationship, indicating that there is a long-term stable relationship between variables, and the regression residual of the equation is stable. Therefore, the original equation can be regressed directly on this basis, and the regression result is more accurate. The VIF test results show that the values are less than 10. It is generally believed that if the VIF is not greater than 10, there is no serious multicollinearity, but strictly speaking, the VIF value is not greater than 5. Therefore, variables with VIF values greater than five are eliminated to avoid spurious regression caused by multicollinearity.
4.2.3 Selection of weight matrix
Spatial econometric analysis is the introduction of spatial effects in traditional econometric analysis. The introduction method is realized by spatial weight matrix. Therefore, before spatial econometric analysis, it is necessary to select the appropriate spatial weight matrix. Common spatial weight matrices include adjacency, inverse distance and economic geographic spatial weight matrix, etc. Zhang and Yu, 2018. The adjacency spatial weight matrix represents the adjacency relationship between geographical units by 0 and 1, which is easy to understand and construct. However, some assumptions do not conform to the objective facts. For example, it is assumed that the correlation between spatial individuals is only determined by whether the spatial individuals are adjacent. The inverse distance space weight matrix assigns weights by the reciprocal of the distance, so that there is a stronger interaction between geographical units at close range. Although spatial correlation originates from spatial adjacency or proximity, geographical location is not the only factor that produces spatial correlation. When studying regional economics, scholars have found that many factors such as regional economic development level, social environment and cultural background may make spatial individuals interact with each other.
The economic geospatial weight matrix organically combines geospatial elements and economic variables. This method not only considers the spatial distance and adjacency relationship between geographical units, but also integrates economic factors such as economic development level and economic connection, so as to reflect the interaction and influence between geographical units more comprehensively. By comprehensively considering economic and geographical factors, the analysis deviation caused by insufficient consideration of a single factor can be reduced, and the accuracy and reliability of the analysis results can be improved. Therefore, in order to describe the interaction between spatial objects more accurately, this paper considers the influence of spatial distance and adjacency relationship, and selects the economic geographic spatial weight matrix as the premise of spatial econometric analysis.
4.2.4 Spatial correlation test
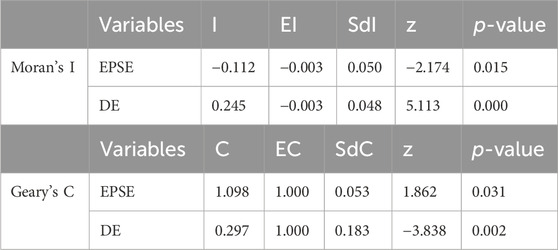
Based on the spatial weight matrix of economic geography, Moran’s I and Geary’s C are used to measure the spatial correlation between the EPSE and the development level of DE in this paper. The results show that the spatial correlation of the EPSE and the growth level of DE is significant at the level of 1%. Table 5 shows the specific indicators.
4.2.5 Analysis of empirical results
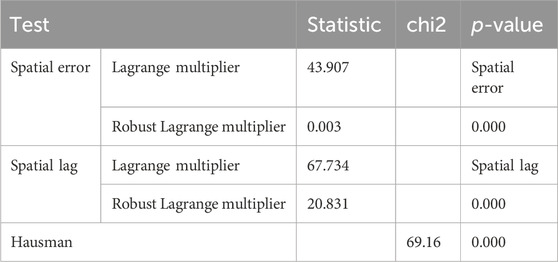
Before the model regression, it is necessary to filter the spatial econometric model SAR, SEM or SDM. When the model is set, the LM test will be first performed. Compared with mixed OLS, the test needs to be judged by spatial error and spatial lag. If both are not significant, it is directly returned to OLS; if only spatial error test results are significant, SEM will be used; if only test results of spatial lag are significant, the SAR will be selected. If both are significant, a robust LM test will be further performed. If the spatial lag significance is higher than the spatial error significance, SAR will be selected, otherwise, SEM will be selected. If the robust LM test is significant, LR and Wald tests will be performed. If the tests are significant, the SDM will be selected. Furthermore, the Hausman test is used to choose the random utility model or the fixed effect model. If p-value of the test result is significant, the null hypothesis will be rejected and the fixed effect model will be adopted. Based on formulas 9–11, the correlation test is shown in Table 6, which shows that the spatial lag model is suitable for this study.
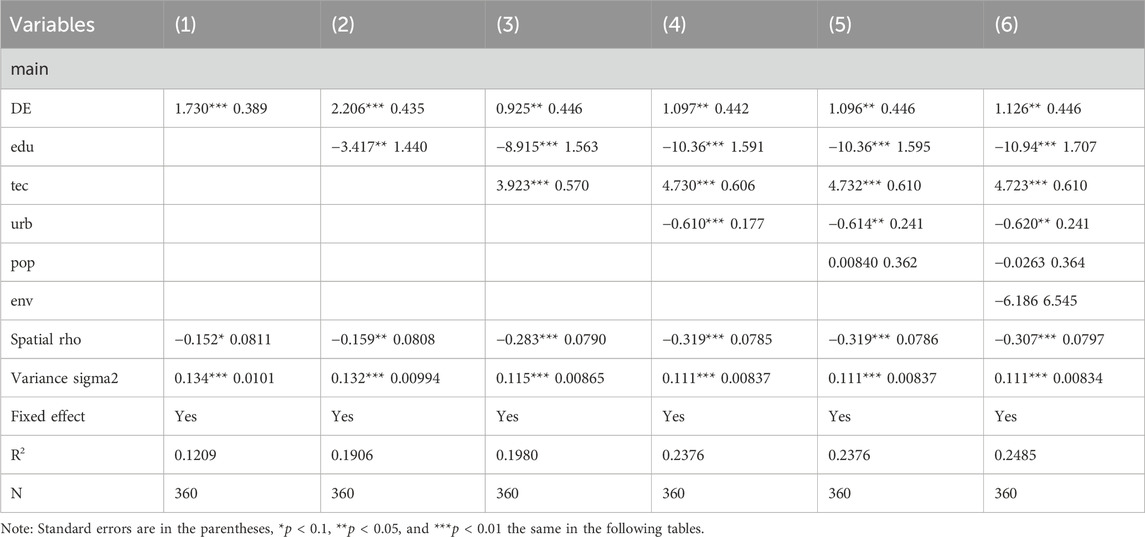
Based on the above analysis, the regression results are shown in Table 7. Columns 1 - 6 are successively added to the control variable SAR fixed effect model. From the estimation results of R2, considering the influence of control variables as much as possible, this paper takes the regression results of Table 6 6 as the standard. The results show that the Spatial rho coefficient is significant, indicating that the EPSE in this region is affected by the EPSE in adjacent regions, that is, the EPSE has a significant spatial correlation between regions. The regression coefficient of the DE is significantly positive, indicating that with the development of the DE, the EPSE is further improved, which is consistent with the research results of Kong Fan bin et al. Fanbin et al., 2023b. Through precise monitoring, intelligent decision-making, automated production, optimization of resource allocation and supply chain management, demand forecasting and personalized customization, digitization can significantly improve the EPSE, reduce production costs, speed up market response, and promote eco-friendly and sustainable development. The production model comprehensively optimizes the production and supply system of EP Gerasimova et al., 2023. Therefore, hypothesis 1 is verified. It also shows that the vigorous development of the current regional DE can promote the improvement of the supply efficiency of local EP. From the regression results of control variables, the development of science and technology has a significant positive impact on the EPSE in the region. The level of education and urbanization have a significant negative impact on the EPSE in the region. Population density and environmental regulation have a negative impact, but not significant.
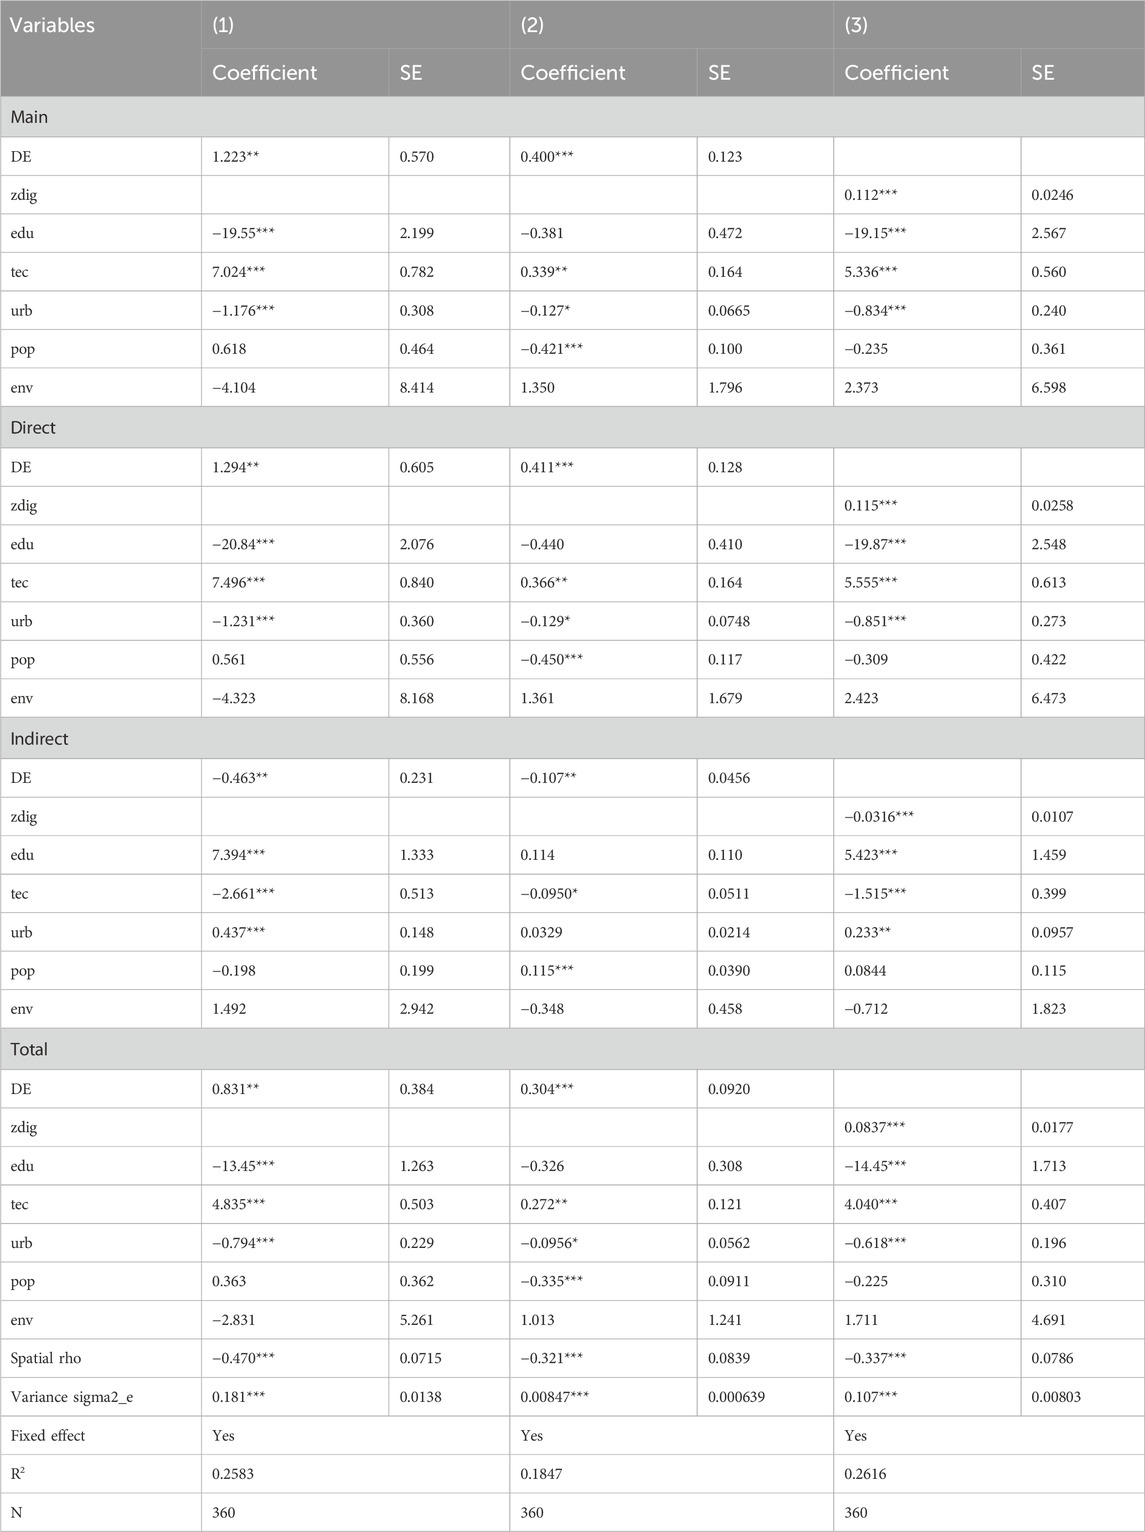
Based on the spatial autoregressive results, the spatial spillover effect is further analyzed. Through the partial differential method, the results of the spatial lag equation are further unbiased, and the spatial effect is decomposed into direct and indirect spillover effects. The results are shown in Table 8. The direct effect and total effect of the DE are positive and significant, and the indirect effect is negative and significant. It shows that the development of the local DE can promote the improvement of the EPSE in the region and inhibit the improvement of the EPSE in neighboring areas. The promotion effect is greater than the inhibition effect, so the total effect is significantly positive. The possible reason is that the development of the DE is unbalanced among provinces, so the DE in different regions has different effects on the EPSE. In the early stage of DE development, because the agglomeration effect will lead to the return of production factors, the region with the high level of DE development has a negative spatial spillover effect on the EPSE in adjacent regions with the low level of DE development, so the DE has a limited effect on the supply capacity of EP in the whole region. At the same time, the integration of DE development and EP supply is still in the exploratory stage. The role of digital technology innovation and related digital infrastructure in improving the EPSE is not yet mature, and it is difficult to enable the overall improvement of the EPSE.
From the decomposition of the spatial effect of the control variables, the direct effect of education level is significantly negative, and the indirect effect is significantly positive, indicating that the improvement of education level in the region has a certain crowding out effect on the EPSE, but the development of education level in the region will significantly promote the improvement of the EPSE in the adjacent economic regions, that is, in the early stage, the benefits of investment in education in the region to the EPSE are more obvious in the neighboring regions. Because the crowding-out effect is greater than the promotion effect, the total effect is significantly negative. The direct effect of science and technology development level is positive, and the indirect effect is negative. Regions with higher levels of scientific and technological development tend to have higher levels of economic development, stronger people’s ecological awareness and higher demand for EP, further promoting the EPSE, while regions with lower levels of scientific and technological development are on the contrary, and may even undertake related non-EP enterprises. Therefore, in the early stage of development, the improvement of the level of science and technology in the region will give priority to promoting the improvement of the EPSE in the region and inhibiting the improvement of the EPSE in adjacent economic regions. However, with the further development of science and technology, the diffusion effect of science and technology will gradually emerge. The direct effect of urbanization level is significantly negative, and the indirect effect is significantly positive. Although the development of urbanization can narrow the gap between urban and rural areas to a certain extent, if the development of urbanization is faster than that of population urbanization, it may lead to extensive and inefficient construction of land, insufficient protection of natural historical and cultural heritage, and even environmental pollution and ecological damage. The improvement of the urbanization level inhibits the improvement of the EPSE in the region. To meet people’s demand for EP, the adjacent economic regions pay more attention to the supply of EP. In other words, the improvement of the urbanization level in the region will promote the improvement of the EPSE in the adjacent economic regions.
4.3 Robustness test
4.3.1 Transforming weight matrix
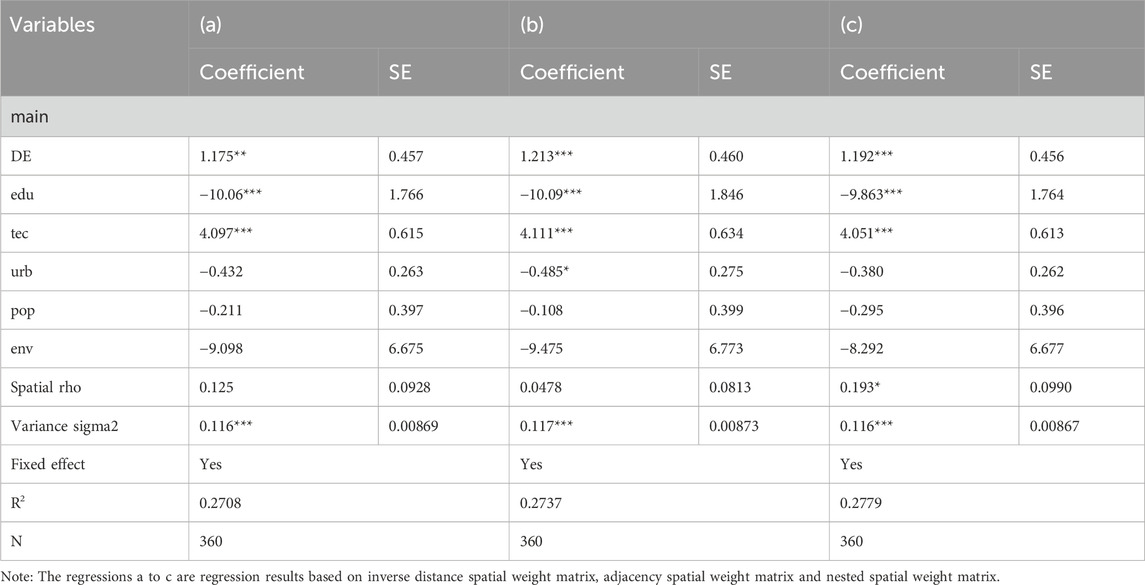
In addition to constructing the economic geographic spatial weight matrix, this paper also constructs the inverse distance, the adjacency and the nested spatial weight matrix, which are respectively substituted into the set benchmark model equations. Through sequential regression, it is found that no matter which matrix is based on, the positive impact of DE on the EPSE is significant, and the characteristics are basically the same. It can be seen that the results of SAR regression using economic geospatial weight matrix are robust. Table 9 a to c show the regression results of different spatial weight matrix.
4.3.2 Substitution variable
The explained variables are replaced by the super-efficiency SBM measurement results of undesired output and the supply capacity of EP and then regressed. The regression result of DE is still significant as shown in Table 10 1 and 2. The core explanatory variable uses the total amount of post and telecommunications business in 1984 as a replacement variable for the development level of the DE. The basic idea is that the technical factors involved in the historical communication infrastructure will affect the subsequent development of the DE, while the traditional telecommunications tools will gradually withdraw from the supply level of EP with the further innovation of science and technology. However, the volume of post and telecommunications business is cross-sectional data in 1984. This paper introduces a time series variable to construct a substitution variable of a core explanatory variable. The specific method is to use the product of the number of Internet users in the previous year and the volume of post and telecommunications business in 1984 as the substitution variable of the development level of the DE. The regression result of the instrumental variables of DE is still significant, as shown in Table 10 3. It further shows that the original regression results are robust.
4.3.3 Excluding interference of outliers
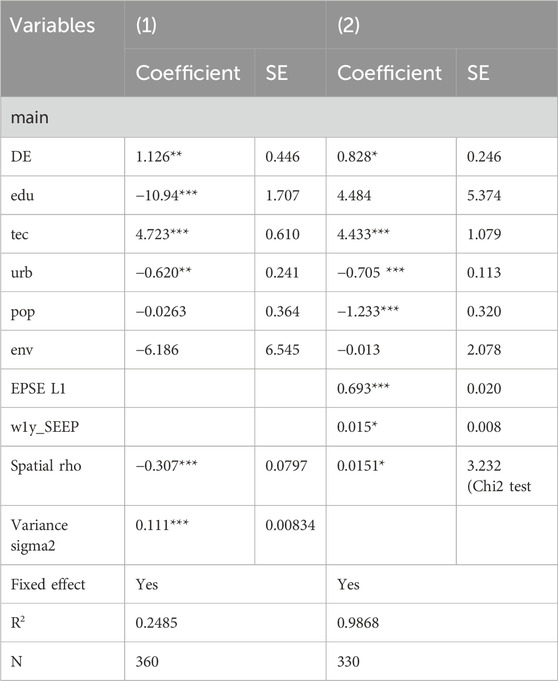
To eliminate the interference of outliers on the benchmark regression results, the comprehensive index of EPSE, DE and control variables are tailed by 1%, and the model can be regressed again. Table 11 1 shows the results. After cleaning the data, it is found that all regression results remain unchanged, making known that the above conclusions are robust.
4.3.4 Endogeneity test
To test the endogenous distress of the model results, the generalized method of moments estimation GMM method is usually used. The reason why GMM can be used as an endogeneity test is that it does not depend on the specific distribution of the model, but based on the consistency of the sample moment and the theoretical moment to estimate the parameters. When there are endogenous variables in the model, that is, the explanatory variables are related to the random error term, the traditional least squares method may produce biased and inconsistent estimates. By constructing instrumental variables, GMM transforms endogenous variables into exogenous observable moment conditions, so as to effectively solve the endogenous problem and obtain consistent, unbiased and effective parameter estimation.
On this basis, this paper further considers the spatial correlation, and reflects the interaction between spatial units through the spatial weight matrix. Using spatial dynamic GMM can capture the characteristics and trends of spatial data more accurately. Therefore, the spatial dynamic GMM two-step method is used to re-regression the model, and the regression results are tested. The results are shown in Table 11 2. Among them, the impact of DE on the EPSE is still significant, and there is little difference with the benchmark regression results, indicating that the original regression results are basically not affected by endogeneity. The lag term and spatial lag term of the explained variables are significant, indicating that the previous EPSE has a positive impact on the current EPSE. In addition, the saran over identification LM test is equal to 23.418, and the p-value is 1. There is no over-identification problem, indicating that the regression results of spatial dynamic GMM are credible, which further verifies the robustness of the regression results.
5 Further discussion
5.1 Mechanism test
Based on theoretical analysis, the development level of DE has a certain mechanism effect on promoting the EPSE. To verify Hypothesis 2, this paper constructs the model through model screening shown in formulas 11–14.
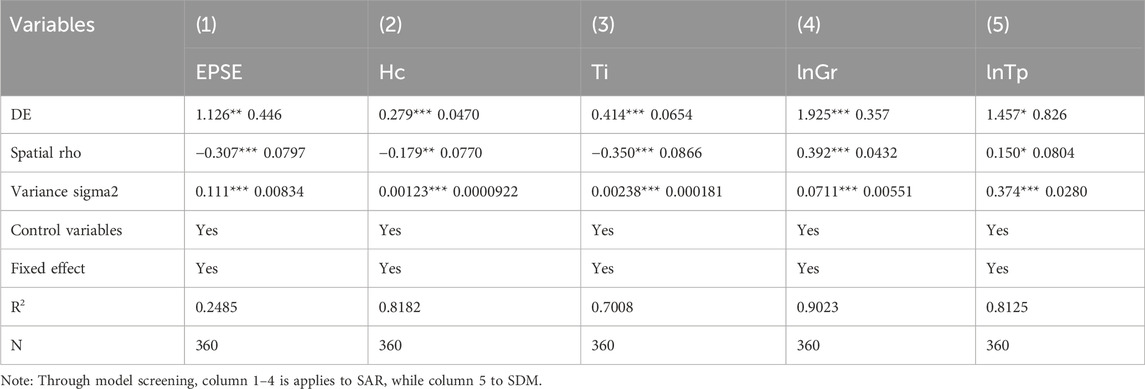
Based on the above measurement models, the empirical results are presented in Table 12. Among them, Column 1 tests the impact of DE on the EPSE. The impact of DE development on the advancement of human capital structure is listed in column 2. It shows that the improvement of the development level of DE will increase the demand for advanced human capital He et al., 2023 and make the human capital structure tend to be advanced. Advanced human capital cognitive ability and ecological protection awareness are stronger Wu and Yang, 2022, which is more conducive to the development and mastery of advanced digital technology, to enhance the ability of environmental monitoring and protection, promote the innovation of green technology, form the production mode of green low carbon cycle Rusch et al., 2022, and ultimately promote the improvement of EPSE. Hypothesis 2a has been verified. Column 3 is the impact of DE development on the upgrading of the industrial structure. The development of DE promotes the deep integration of digital industry and ecological industry Shi et al., 2022. Through the development of emerging industries such as ecological agriculture, smart forestry and ecological tourism, the added value and market competitiveness of EP are enhanced. By promoting the “Internet + Ecology” model, using e-commerce platforms, social media and other channels, the sales channels of EP have been broadened, and market awareness and market share have been improved. At the same time, it also promotes the transformation and upgrading of traditional industries, makes the industrial structure more advanced, reduces energy consumption and emissions Chen et al., 2022, and improves production efficiency. Hypothesis 2b has been verified. Columns 4 and 5 are the impact of DE development on the enthusiasm of EP suppliers. The regression coefficients are 1.925 and 1.457, respectively. It shows that the development of DE reduces the management cost through technological innovation and intelligent management mode, so as to improve the local fiscal revenue of the government and the operating profit of enterprises, so that local governments and enterprises have more financial resources to encourage the supply of EP and actively develop the EP industry. Therefore, the government can actively formulate support policies and improve infrastructure, reduce the cost of enterprise transformation, strengthen supervision and evaluation, and ensure the quality of EP. For example, ecological compensation, green finance, etc., further stimulate the enthusiasm of enterprises and individuals to participate in the supply of EP Sheng et al., 2020, thereby improving the EPSE. Hypothesis 2c and 2d have been verified. In summary, the DE ultimately promotes the improvement of the EPSE by promoting the upgrading of human capital structure, the upgrade of industrial structure, the improvement of government local fiscal revenue and corporate operating profits.
5.2 Heterogeneity analysis
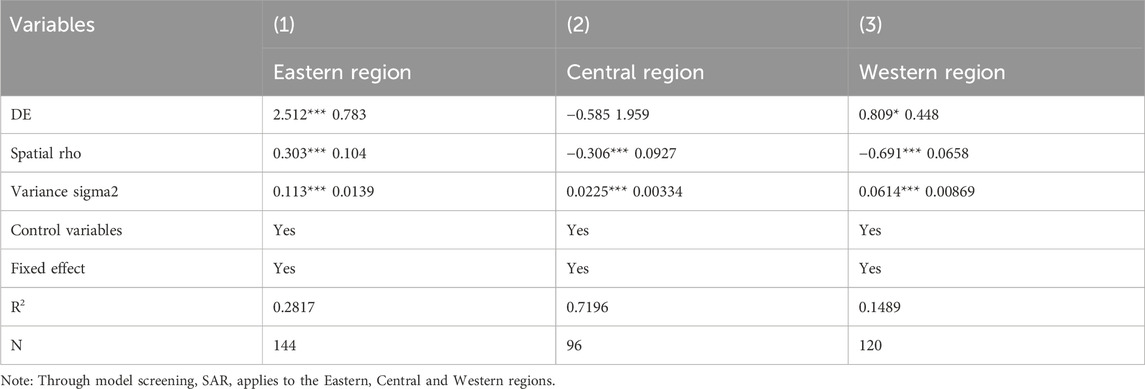
The above analysis shows that the DE has a significant spatial spillover effect on the EPSE. To test whether there is heterogeneity in the EPSE in eastern, central and western China, this paper constructs the economic geographic spatial weight matrix and conducts spatial econometric regression on them respectivelyDian et al., 2024. The empirical results are shown in Table 13 as follows. The results show that in the context of the vigorous development of the DE, its impact on the EPSE in different regions shows significant differences. Due to the superior basic conditions, the eastern region has a high degree of integration of DE and EP, which has significantly promoted the improvement of EPSE; although the central region has shown a certain negative impact, it is not significant, and its strategic adjustment needs to focus more on the relationship between balanced development and protection; the western region is facing unique challenges and opportunities. It is necessary to optimize EPSE through government guidance and characteristic development path.
Specifically, the eastern region, as the forefront of the development of the DE, has the advantages of mature technology and perfect infrastructure Zhao et al., 2020. Therefore, the region should further deepen the integration of DE and EP, and use advanced technologies such as big data and cloud computing to optimize the production, distribution and supply process of EP, so as to achieve accurate management and efficient operation. At the same time, the eastern region should increase R&D investment in green technology, clean energy and other fields, and promote the transformation of traditional industries to green and intelligent, so as to improve the supply quality and efficiency of EP. In addition, strengthening inter-regional coordination and cooperation to form a joint force for green development is also an important way to enhance EPSE in the eastern region.
The central region is in a transitional zone in the development of DE, facing the dual pressures of economic development and ecological protection Zhang D. et al., 2021. Therefore, the central region should pay attention to the relationship between balanced development and protection when formulating strategies to avoid ecological damage caused by over-exploitation. The key to achieving this goal is to optimize the allocation of resources through DE means and guide the industry to develop in a green and low-carbon direction. At the same time, the central region should seize the opportunity of DE development, promote the transformation and upgrading of traditional industries, improve the efficiency of resource utilization, reduce environmental pollution, and indirectly improve the EPSE. In addition, strengthening the coordinated development among the provinces in the region and forming a more balanced development trend are also effective strategies for the central region to enhance EPSE.
Due to the relatively backward development, the western region faces many challenges in the process of green development transformation. However, the western region also has rich natural resources and unique ecological environment advantages Niu et al., 2022, which provides favorable conditions for the development of characteristic EP. Therefore, the western region should make full use of these advantageous resources, broaden the sales channels through DE means, improve product awareness, and increase the supply and EPSE. At the same time, the western region also needs to strengthen environmental governance and supervision, establish a sound e-waste recycling system, and reduce environmental pollution. The government should play a guiding role in promoting the supply of EP and the formation of green development model through policy support and capital investment Rong, 2023. In short, the impact of the development level of the DE on the EPSE has significant heterogeneity in the Eastern, Central and Western regions.
5.3 Threshold effect
Based on Model 10, the panel threshold effect is tested. The threshold variable is the core explanatory variable and the explanatory variable is the EPSE. The threshold effect test results are shown in Table 14. The results show that the model has a significant single threshold effect, and the threshold value is 0.1232. Therefore, hypothesis 3 is verified.
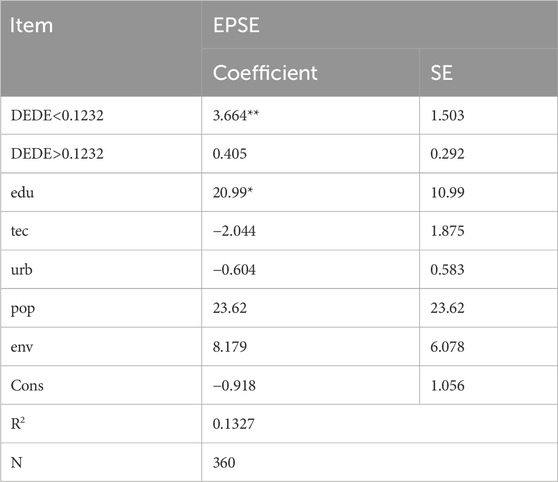
Table 15 shows the regression results of the panel threshold effect model. When the DE is less than the threshold value of 0.1232, it has a significant positive impact on the EPSE, that is, with the improvement of the DE, the EPSE is further improved. When the development level of DE is greater than the threshold value of 0.1232, the DE has no statistically significant effect on the EPSE. This shows that the DE has a non-linear effect on the EPSE, and will not promote the improvement of the EPSE from beginning to end, that is to say, the DE has a limited enabling effect on the EPSE. In the early stage of development, the DE has promoted the significant improvement of regional resource allocation efficiency by reducing the technical threshold. The application of advanced technologies such as big data and cloud computing has made the information flow more rapid and symmetrical, effectively reducing the information asymmetry in the market, reducing transaction costs, and accelerating inter-regional exchanges and cooperation Xiao et al., 2023. This efficient resource allocation model not only promotes the rapid growth of regional economy, but also promotes the coordinated development of related industries through diffusion effect and spillover effect, which provides a broad space for environmental protection technology innovation and industrial upgrading Chen et al., 2022; Guaita Martínez et al., 2022, and lays a solid foundation for the improvement of EPSE.
However, with the further development of the DE, its negative externalities have become increasingly prominent, posing a threat to the sustainable development of economy and ecology. Firstly, the imbalance between urban and rural development is becoming more and more serious Deng et al., 2023; Peng and Dan, 2023. Due to the lack of infrastructure construction and talent reserve in rural areas, it is difficult to fully enjoy the dividends brought by the DE, which leads to the widening of the digital divide between urban and rural areas and further aggravates the imbalance of regional economic development. Secondly, the imbalance between the development of consumer Internet and industrial Internet is also worthy of attention. The consumer Internet has risen rapidly with its low threshold and high penetration rate, while the industrial Internet has lagged behind due to its complex technology and wide application scenarios Herman and Oliver, 2023. This imbalance not only affects the optimization and upgrading of the internal structure of the DE, but also may lead to distortion and waste of resource allocation. More importantly, the further development of the DE has a non-negligible impact on the ecological environment. Although the DE has a significant role in promoting EPSE, its development may also be accompanied by a series of potential negative effects. For example, the increase of electronic waste Brindhadevi et al., 2023 is a prominent problem brought by the rapid development of DE. With the acceleration of the upgrading of electronic products, a large number of waste electronic products will cause serious pollution to the environment if not handled properly. Therefore, it is very important to establish a perfect e-waste recycling system. In addition, the operation of the DE is inseparable from a large amount of energy consumption, especially the energy consumption of infrastructure such as data centers and cloud computing are becoming increasingly prominent Lin and Huang, 2023. This not only increases the energy burden, but also may lead to an increase in carbon emissions. With the increase of energy consumption and the increase of electronic waste, the ecological cost of DE is gradually rising. These negative externalities limit the further improvement of the EPSE and pose a certain degree of challenge to the sustainable development of the ecological environment. In short, the DE has shown significant economic and ecological advantages in the initial stage. However, with the leap and deepening of the development threshold, its negative externalities have gradually emerged, which limits the further improvement of the EPSE. It is worth noting that the current average level of DE development is 0.071, and the threshold value is 0.1232, indicating that the DE should be vigorously developed and the dividend period of the promotion effect of the DE on the EPSE should be grasped.
Figure 3 shows the likelihood ratio test of the threshold. The red dotted line represents the 95% confidence interval level, below which it is the threshold value that passes the test of the confidence interval.
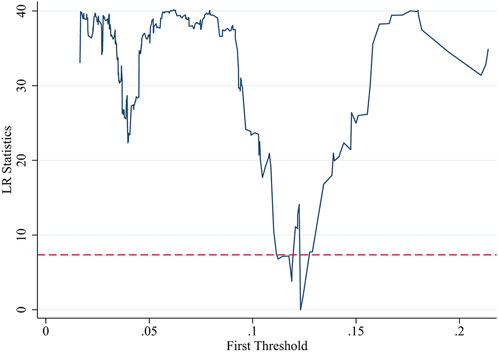
Figure 3. Likelihood ratio test diagram of threshold value. The red dotted line represents the 95% confidence interval level.
6 Conclusions and implications
6.1 Conclusions
To explore the influence mechanism of the DE on the EPSE, this paper constructs an index system of the EPSE and uses the SBM model of undesired output to measure its efficiency value. At the same time, the entropy weight TOPSIS is used to measure the comprehensive index of the development level of the DE. On this basis, with the help of the spatial econometric model and panel threshold effect model, this paper empirically analyzes the impact of DE development on the EPSE in 30 provinces cities and districts of China from 2011 to 2022 and conducts robustness test, endogenous test, mechanism test, heterogeneity and nonlinear analysis. The research shows that: Firstly, the EPSE in various provinces and cities is significantly different. The national average level is 0.579. The average level of DE development in various provinces and cities is generally not high, and the national DE development level is only 0.071. Secondly, from the regression results of the spatial econometric model, the development level of the DE has a significant spatial spillover effect on the EPSE, and the spatial spillover effect of the development level of the DE on the EPSE in neighboring areas is significantly negative. Thirdly, from the analysis of the impact mechanism, the DE promotes the EPSE by upgrading the human capital structure, upgrading the industrial structure, and increasing local government fiscal revenue and corporate operating profits. Fourthly, from the perspective of heterogeneity analysis, the impact of the DE development level on the EPSE has significant heterogeneity in the Eastern, Central and Western regions. Among them, the impact on the central region is not significant. Fifthly, from the regression results of the threshold effect, there is a significant single threshold effect on the impact of the DE on the EPSE. When it is less than the threshold value of 0.1232, the DE will significantly promote the improvement of the EPSE.
6.2 Implications
Drawing upon the research conclusions, the following policy implications are proposed from various perspectives.
1 Policy makers play a vital role in promoting the EPSE. By formulating special support policies, such as financial subsidies, tax incentives and R&D funding support, the government provides a strong policy guarantee for the application of advanced technologies such as big data and the Internet of Things in the EP industry. At the same time, the construction of digital ecological product standard system not only ensures the accuracy and traceability of information in the process of digitalization of EP, but also lays a foundation for market norms and consumer trust. In addition, the construction of digital government not only improves the efficiency of government management, but also provides a more convenient service channel for enterprises and the public, and promotes political and business interaction and information sharing. In terms of regional coordination, policymakers actively promote the coordinated development of inter-provincial eco-product industries. By building an information sharing platform and formulating coordinated development plans, digital technology has effectively played a radiation-driven role in the supply of eco-products in neighboring regions.
2 As the main body of EP supply, the enthusiasm and innovation of enterprises directly determine the success or failure of industrial transformation. In the face of new opportunities in the DE, enterprises have implemented digital transformation strategies, deeply integrated digital technology into all aspects of production, management, and marketing, and achieved a double improvement in operational efficiency and market response speed. At the same time, enterprises cooperate with universities and research institutions to carry out digital skills training, improve employees’ digital literacy, and build a talent team that meets the needs of DE development. Moreover, through the development of e-commerce platform, enterprises have broken the geographical restrictions, realized the omni-channel marketing of EP, and further promoted the balance between supply and demand. In terms of technological innovation, enterprises increase R&D investment and promote the deep integration of digital technology and EP development, which not only enhances product competitiveness, but also drives the upgrading of the entire industrial chain. In addition, enterprises also actively participate in regional coordinated development, use digital technology to promote resource sharing and complementary advantages, and jointly open up a broader market space.
3 Environmental institutions also play an indispensable role in improving the EPSE driven by the DE. By establishing a digital monitoring system for EP, environmental agencies can grasp the environmental protection status of the production, circulation and consumption of EP in real time, and provide a scientific basis for policy formulation and supervision. At the same time, the promotion of green certification and labeling system has enhanced consumers’ trust in EP and promoted the development of green consumption. In addition, environmental agencies have also actively carried out digital environmental protection publicity and education, which has improved the public’s awareness and participation in environmental protection. In terms of technical support, environmental agencies actively participate in the exchange and cooperation of environmental protection technology, promote the innovation and application of environmental protection technology, and provide strong support for the digital transformation of EP industry.
In short, the DE has shown certain potential and value in promoting the EPSE. Through the support of policy guidance, enterprise practice and environmental institutions, the DE not only promotes the digital transformation and industrial upgrading of the EP industry, but also realizes the harmonious coexistence of economic and ecological benefits. In the future, with the continuous development and application of digital technology, it is necessary to pay attention to the threshold effect of its DE. It is particularly important to strengthen the precise guidance at the policy level and encourage technological innovation, aiming to promote the widespread adoption of green energy and the significant improvement of energy utilization efficiency, so as to cope with the new challenges brought by the DE.
6.3 Research prospect
Although this paper systematically discusses the influence mechanism of DE on the EPSE in China, there are still some shortcomings. In the next study, we can extend to two aspects.
Firstly, the data coverage is limited. It is difficult to obtain complete statistical data at the micro level of EP, which leads to insufficient research on prefecture-level cities such as counties. The next step will try to find suitable data alternatives to study the EPSE in counties or prefecture-level cities.
Secondly, the model hypothesis is not deep enough. In the context of DE, variables such as data elements, digital platforms, and digital technology applications have an increasingly significant impact on the EPSE. However, this paper only analyzes the impact of the overall development of DE on the EPSE. In the future, more key variables will be introduced to further refine the research content in the process of model construction.
Data availability statement
The original contributions presented in the study are included in the article/Supplementary Material, further inquiries can be directed to the corresponding author.
Author contributions
JS: Writing–original draft, Writing–review and editing.
Funding
The authors declare that no financial support was received for the research, authorship, and/or publication of this article.
Conflict of interest
The author declares that the research was conducted in the absence of any commercial or financial relationships that could be construed as a potential conflict of interest.
Publisher’s note
All claims expressed in this article are solely those of the authors and do not necessarily represent those of their affiliated organizations, or those of the publisher, the editors and the reviewers. Any product that may be evaluated in this article, or claim that may be made by its manufacturer, is not guaranteed or endorsed by the publisher.
References
Ariken, M., Zhang, F., Weng Chan, N., and Kung, H. t. (2021). Coupling coordination analysis and spatiotemporal heterogeneity between urbanization and eco-environment along the Silk Road Economic Belt in China. Ecol. Indic. 121, 107014. doi:10.1016/j.ecolind.2020.107014
Bouwma, I., Schleyer, C., Primmer, E., Winkler, K. J., Berry, P., Young, J., et al. (2018). Adoption of the ecosystem services concept in EU policies. Ecosyst. Serv. 29, 213–222. doi:10.1016/j.ecoser.2017.02.014
Brindhadevi, K., Barceló, D., Chi, N. T. L., and Rene, E. R. (2023). E-waste management, treatment options and the impact of heavy metal extraction from e-waste on human health: scenario in Vietnam and other countries. Environ. Res. 217, 114926. doi:10.1016/j.envres.2022.114926
Carpenter, S. R., Mooney, H. A., Agard, J., Capistrano, D., DeFries, R. S., Díaz, S., et al. (2009). Science for managing ecosystem services: beyond the millennium ecosystem assessment. Proc. Natl. Acad. Sci. 106, 1305–1312. doi:10.1073/pnas.0808772106
Chen, C., Ye, F., Xiao, H., Xie, W., Liu, B., and Wang, L. (2023). The digital economy, spatial spillovers and forestry green total factor productivity. J. Clean. Prod. 405, 136890. doi:10.1016/j.jclepro.2023.136890
Chen, S., Ding, D., Shi, G., and Chen, G. (2022). Digital economy, industrial structure, and carbon emissions: an empirical study based on a provincial panel data set from China. Chin. J. Popul. Resour. Environ. 20, 316–323. doi:10.1016/j.cjpre.2022.11.002
Chunlin, D., and Yuting, G. (2023). Multi-center collaborative governance: also research on the innovation path of ecological product supply in watershed-take the Yangtze River economic belt as an example in Chinese. J. Party Sch. Tianjin Comm. CPC 25, 86–95. doi:10.16029/j.cnki.1008-410X.2023.03.009
Costanza, R., d'Arge, R., De Groot, R., Farber, S., Grasso, M., Hannon, B., et al. (1997). The value of the world's ecosystem services and natural capital. nature 387, 253–260. doi:10.1038/387253a0
Deng, X., Guo, M., and Liu, Y. (2023). Digital economy development and the urban-rural income gap: evidence from Chinese cities. PLoS One 18, e0280225. doi:10.1371/journal.pone.0280225
Dian, J., Song, T., and Li, S. (2024). Facilitating or inhibiting? Spatial effects of the digital economy affecting urban green technology innovation. Energy Econ. 129, 107223. doi:10.1016/j.eneco.2023.107223
Dimitrov, I., Koprinkova-Noncheva, N., and Dimitrova, A. (2023). Key factors and conditions for implementing the drop-shipping method as an alternative to traditional supply chain. Entrepreneursh. Sustain. Issues 11, 498–515. doi:10.9770/jesi.2023.11.233
Du, W., Yan, H., Feng, Z., Yang, Z., and Yang, Y. (2022a). The external dependence of ecological products: spatial-temporal features and future predictions. J. Environ. Manage. 304, 114190. doi:10.1016/j.jenvman.2021.114190
DU, Y., Wang, J., and Sun, X. (2022b). How can‘ecological products’be continuously transformed into‘farmers wealth’?in Chinese. China Popul. Resour. Environ. 32, 150–159. doi:10.12062/cpre.20220611
Fanbin, K., Wenjie, C., and Caiyao, X. (2023a). Does the development of digital economy improve the ValueTransformation efficiency of forest ecological products: an empirical analysis in lishui, Zhejiang province in Chinese. Chin. Rural. Econ., 163–184. doi:10.20077/j.cnki.11-1262/f.2023.05.009
Fanbin, K., Wenjie, C., and Caiyao, X. (2023b). Does the development of digital economy improve the ValueTransformation efficiency of forest ecological products:an EmpiricalAnalysis in lishui. Chin. Rural. Econ., 163–184. doi:10.20077/j.cnki.11-1262/f.2023.05.009
Fan-rong, L., and Ai-ping, R. (2016). The research of PPP mode in ecological products supply in Chinese. Econ. Problems, 11–16. doi:10.16011/j.cnki.jjwt.2016.12.003
Fisher, B., Turner, R. K., and Morling, P. (2009). Defining and classifying ecosystem services for decision making. Ecol. Econ. 68, 643–653. doi:10.1016/j.ecolecon.2008.09.014
Fuchen, B., Peng, G., and Wolin, Z. (2023). Ecological resources enabling rural common prosperity: the promoting role of digital economy in Chinese. J. China Agric. Univ. 28, 263–275. doi:10.11841/j.issn.1007-4333
Gao, S., Yang, L., and Jiao, H. (2022). Changes in and patterns of the tradeoffs and synergies of production-living-ecological space: a case study of Longly County, Guizhou Province, China. Sustainability 14, 8910. doi:10.3390/su14148910
Gerasimova, V., Prause, G., and Hoffmann, T. (2023). NFT-enriched smart contracts for smart circular economy models. Entrepreneursh. Sustain. Issues 11, 93–110. doi:10.9770/jesi.2023.11.27
Guaita Martínez, J. M., Puertas, R., Martín Martín, J. M., and Ribeiro-Soriano, D. (2022). Digitalization, innovation and environmental policies aimed at achieving sustainable production. Sustain. Prod. Consum. 32, 92–100. doi:10.1016/j.spc.2022.03.035
Han, D., Ding, Y., Shi, Z., and He, Y. (2022). The impact of digital economy on total factor carbon productivity: the threshold effect of technology accumulation. Environ. Sci. Pollut. Res. 29, 55691–55706. doi:10.1007/s11356-022-19721-x
He, M., Huang, J., and Sun, R. (2023). Forecast of advanced human capital gap based on PSO-BP neural network and coordination pathway: example of beijing–tianjin–hebei region. Sustainability 15, 4671. doi:10.3390/su15054671
Herman, P. R., and Oliver, S. (2023). Trade, policy, and economic development in the digital economy. J. Dev. Econ. 164, 103135. doi:10.1016/j.jdeveco.2023.103135
Hong-rui, Z., and Jie-hua, L. (2017). Analysis on input-output efficiency of supply of forest eco-products: a case study of key state-owned forest area of Northeast in Chinese. Econ. Problems, 87–94. doi:10.16011/j.cnki.jjwt.2017.09.015
Hua, H., and Shunbo, Y. (2021). Measuring the efficiency of ecologically oriented rural public goods supply and its influencing factors in Chinese. J. Northwest A&F Univ. Sci. Ed. 21, 104–112. doi:10.13968/j.cnki.1009-9107.2021.05.12
Hui, Y., and Hai-quan, W. (2021). The effective path choice of forest ecological products supply from the perspective of poverty AlleviationBased on empirical study of Heilongjiang province. Resour. Development&Market 37, 136–140+145. doi:10.3969/j.issn.1005-8141.2021.02.002
Jing, Z., and Hao, Y. (2018). Effective supply of eco-product and its influence factors at provincial scale of China from the perspective of supply-side reform in Chinese. Chin. J. Appl. Ecol. 29, 3326–3336. doi:10.13287/j.1001-9332.201810.010
Jiun, R. C. C., Zahra, S., Khan, D., Gupta, R., Popp, J., and Oláh, J. (2022). Assessing the asymmetric impact of physical infrastructure and trade openness on ecological footprint: an empirical evidence from Pakistan. PLoS One 17, e0262782. doi:10.1371/journal.pone.0262782
Kemkes, R. J., Farley, J., and Koliba, C. J. (2010). Determining when payments are an effective policy approach to ecosystem service provision. Ecol. Econ. 69, 2069–2074. doi:10.1016/j.ecolecon.2009.11.032
Łęgowik-Małolepsza, M., Kollmann, J., Kollmann, J., Chamrada, D., and Chamrada, D. (2024). Eco-marketing and the competitive strategy of enterprises–review of the research results of energy companies. Entrepreneursh. Issues 11, 135–153. doi:10.9770/jesi.2024.11.49
Li, G., Li, X., and Huo, L. (2023a). Digital economy, spatial spillover and industrial green innovation efficiency: empirical evidence from China. Heliyon 9, e12875. doi:10.1016/j.heliyon.2023.e12875
Li, L. (2016). Research on ecological products supplier in China: based on polycentric governance in Chinese. Ecol. Econ. 32, 96–99.
Li, X., Meng, X., Ji, X., Zhou, J., Pan, C., and Gao, N. (2023b). Zoning technology for the management of ecological and clean small-watersheds via k-means clustering and entropy-weighted TOPSIS: a case study in Beijing. J. Clean. Prod. 397, 136449. doi:10.1016/j.jclepro.2023.136449
Lin, B., and Huang, C. (2023). How will promoting the digital economy affect electricity intensity? Energy Policy 173, 113341. doi:10.1016/j.enpol.2022.113341
Lin, G., Jiang, D., Fu, J., Cao, C., and Zhang, D. (2020). Spatial conflict of production–living–ecological space and sustainable-development scenario simulation in Yangtze River Delta agglomerations. Sustainability 12, 2175. doi:10.3390/su12062175
Liu, L., Ding, T., and Wang, H. (2022). Digital economy, technological innovation and green high-quality development of industry: a study case of China. Sustainability 14, 11078. doi:10.3390/su141711078
Lu, Z., and Haoming, W. (2023). The legal structure of ecological product value realization in the era of digital economy: taking “ant forest” as an example in Chinese. Nanjing J. Soc. Sci., 66–77. doi:10.15937/j.cnki.issn1001-8263.2023.07.008
Luo, S., Yimamu, N., Li, Y., Wu, H., Irfan, M., and Hao, Y. (2023). Digitalization and sustainable development: how could digital economy development improve green innovation in China? Bus. Strategy Environ. 32, 1847–1871. doi:10.1002/bse.3223
Ma, G., Wang, J., Yu, F., Yang, W., Ning, J., Peng, F., et al. (2020). Framework construction and application of China's Gross Economic-Ecological Product accounting. J. Environ. Manage. 264, 109852. doi:10.1016/j.jenvman.2019.109852
Niu, L., Shao, Q., Ning, J., and Huang, H. (2022). Ecological changes and the tradeoff and synergy of ecosystem services in western China. J. Geog. Sci. 32, 1059–1075. doi:10.1007/s11442-022-1985-6
Pascual, A., Giardina, C. P., Povak, N. A., Hessburg, P. F., and Asner, G. P. (2022). Integrating ecosystem services modeling and efficiencies in decision-support models conceptualization for watershed management. Ecol. Modell. 466, 109879. doi:10.1016/j.ecolmodel.2022.109879
Peng, Z., and Dan, T. (2023). Digital dividend or digital divide? Digital economy and urban-rural income inequality in China. Telecommun. Policy 47, 102616. doi:10.1016/j.telpol.2023.102616
Perrings, C., Naeem, S., Ahrestani, F., Bunker, D. E., Burkill, P., Canziani, G., et al. (2010). Ecosystem services for 2020. Science 330, 323–324. doi:10.1126/science.1196431
Ren, X., Zeng, G., and Gozgor, G. (2023). How does digital finance affect industrial structure upgrading? Evidence from Chinese prefecture-level cities. J. Environ. Manage. 330, 117125. doi:10.1016/j.jenvman.2022.117125
Rohlfs, J. (1974). A theory of interdependent demand for a communications service. Bell J. Econ. Manag. Sci. 5, 16–37. doi:10.2307/3003090
Rong, S. (2023). Efficiency of ecological products supply in China and its influencing factors from perspectives of technology innovation and institutional integration. J. Nat. Resour. 38, 2966–2985. doi:10.31497/zrzyxb.20231203
Ruckelshaus, M. H., Jackson, S. T., Mooney, H. A., Jacobs, K. L., Kassam, K.-A. S., Arroyo, M. T., et al. (2020). The IPBES global assessment: pathways to action. Trends Ecol. Evol. 35, 407–414. doi:10.1016/j.tree.2020.01.009
Rusch, M., Schöggl, J. P., and Baumgartner, R. J. (2022). Application of digital technologies for sustainable product management in a circular economy: a review. Bus. Strategy Environ. 32, 1159–1174. doi:10.1002/bse.3099
Sheng, J., Zhou, W., and Zhu, B. (2020). The coordination of stakeholder interests in environmental regulation: lessons from China’s environmental regulation policies from the perspective of the evolutionary game theory. J. Clean. Prod. 249, 119385. doi:10.1016/j.jclepro.2019.119385
Shi, J., Li, S., Song, Y., Zhou, N., Guo, K., and Bai, J. (2022). How socioeconomic factors affect ecosystem service value: evidence from China. Ecol. Indic. 145, 109589. doi:10.1016/j.ecolind.2022.109589
Song, Y., Zhang, X., and Zhang, M. (2021). The influence of environmental regulation on industrial structure upgrading: based on the strategic interaction behavior of environmental regulation among local governments. Technol. Forecast. Soc. Change 170, 120930. doi:10.1016/j.techfore.2021.120930
Stevenson, H., Auld, G., Allan, J. I., Elliott, L., and Meadowcroft, J. (2021). The practical fit of concepts: ecosystem services and the value of nature. Glob. Environ. Polit. 21, 3–22. doi:10.1162/glep_a_00587
Subramanian, M. (2019). Anthropocene now: influential panel votes to recognize Earth's new epoch. Nature. doi:10.1038/d41586-019-01641-5
Sun, C., and Wu, F. (2020). Differences and convergence of matching development of high-class service industry and advanced manufacturing industry in China. J. Quantitative and Technol. Econ. 37, 3–24. doi:10.13653/j.cnki.jqte.2020.12.001
Susaeta, A., Adams, D. C., Carter, D. R., and Dwivedi, P. (2016). Climate change and ecosystem services output efficiency in southern loblolly pine forests. Environ. Manag. 58, 417–430. doi:10.1007/s00267-016-0717-z
Tan, H., and Qi, X. (2023). Synergistic interconstruction of the green development concept in Chinese rural ecological agriculture. Sustainability 15, 3961. doi:10.3390/su15053961
Tao, Z., Zhi, Z., and Shangkun, L. (2020a). Digital Economy,Entrepreneurship,and high-quality economic development: empirical evidence from urban China in Chinese. J. Manag. World 36, 65–76. doi:10.19744/j.cnki.11-1235/f.2020.0154
Tao, Z., Zhi, Z., and Shangkun, L. (2020b). Digital Economy,Entrepreneurship,and high-quality economic development: empirical evidence from urban China in Chinese. J. Manag. World 36, 65–76. doi:10.19744/j.cnki.11-1235/f.2020.0154
Tone, K. (2001). A slacks-based measure of efficiency in data envelopment analysis. Eur. J. Oper. Res. 130, 498–509. doi:10.1016/s0377-2217(99)00407-5
Wang, J., Yu, F., Ma, G., Peng, F., Zhou, X., Wu, C., et al. (2021). Gross economic-ecological product as an integrated measure for ecological service and economic products. Resour. conservation Recycl. 171, 105566. doi:10.1016/j.resconrec.2021.105566
Wang, K., Liu, P., Sun, F., Wang, S., Zhang, G., Zhang, T., et al. (2023). Progress in realizing the value of ecological products in China and its practice in shandong province. Sustainability 15, 9480. doi:10.3390/su15129480
Wang, N., Du, Y., Liang, F., Wang, H., and Yi, J. (2022). The spatiotemporal response of China's vegetation greenness to human socio-economic activities. J. Environ. Manage. 305, 114304. doi:10.1016/j.jenvman.2021.114304
Wang, S., Zhang, S., Xi, G., and Wong, M. C. S. (2024). Analysis of innovation efficiency and influencing factors of listed companies in Beijing-Tianjin-Hebei economic zone based on improved DEA. Insights into Reg. Dev. 6 (2), 24–47. doi:10.9770/ird.2024.6.2(2)
Wu, B., and Yang, W. (2022). Empirical test of the impact of the digital economy on China's employment structure. Finance Res. Lett. 49, 103047. doi:10.1016/j.frl.2022.103047
Wu, Y., Zong, T., Shuai, C., and Jiao, L. (2024). How does new-type urbanization affect total carbon emissions, per capita carbon emissions, and carbon emission intensity? An empirical analysis of the Yangtze River economic belt, China. J. Environ. Manage. 349, 119441. doi:10.1016/j.jenvman.2023.119441
Xiao, Y., Wu, S., Liu, Z. Q., and Lin, H. J. (2023). Digital economy and green development: empirical evidence from China’s cities. Front. Environ. Sci. 11. doi:10.3389/fenvs.2023.1124680
Xue, J., and Xue-tao, S. (2023). The impact of Internet use on the supply of agricultural ecological products: theoretical analysis and evidence from farmers. J. Nat. Resour. 38, 1833–1847. doi:10.31497/zrzyxb.20230713
Ya-mei, W., and Yu-xin, W. (2020). An evaluation of supply efficiency of ecological public goods in Yangtze River economic belt--an empirical study based on three-phase DEA in Chinese. J. Yangtze Normal Univ. 36, 34–42+121. doi:10.19933/j.cnki.issn1674-3652.2020.03.004
Yang, C., Ji, X., Cheng, C., Liao, S., Obuobi, B., and Zhang, Y. (2024). Digital economy empowers sustainable agriculture: implications for farmers’ adoption of ecological agricultural technologies. Ecol. Indic. 159, 111723. doi:10.1016/j.ecolind.2024.111723
Yang, R., Chen, H., Chen, S., and Ye, Y. (2022). Spatiotemporal evolution and prediction of land use/land cover changes and ecosystem service variation in the Yellow River Basin, China. Ecol. Indic. 145, 109579. doi:10.1016/j.ecolind.2022.109579
Yang, Y., and Liang, Q. (2023). Digital economy, environmental regulation and green eco-efficiency—empirical evidence from 285 cities in China. Front. Environ. Sci. 11. doi:10.3389/fenvs.2023.1113293
Yao, G., Li, H., Wang, N., Zhao, L., Du, H., Zhang, L., et al. (2022). Spatiotemporal variations and driving factors of ecological land during urbanization—a case study in the Yangtze River’s lower reaches. Sustainability 14, 4256. doi:10.3390/su14074256
Yu, B., Lili, D. L., and Xin, Z. (2022). Ecological product value realization mechanism of marine ranch blue carbon sink under the influence of time preference in Chinese. Resour. Sci. 44, 2487–2500. doi:10.18402/resci.2022.12.08
Yin, C., Zhao, W., Cherubini, F., and Pereira, P. (2021). Integrate ecosystem services into socio-economic development to enhance achievement of sustainable development goals in the post-pandemic era. Geogr. Sustain. 2, 68–73. doi:10.1016/j.geosus.2021.03.002
Ying, Q., Xiangang, Z., and Zhihua, X. (2018a). Promoting the supply side reform of ecological products based on PPP model in Chinese. J. Arid Land Resour. Environ. 32, 7–12. doi:10.13448/j.cnki.jalre.2018.099
Ying, Z., Bin, Z., Hongwei, N., and Jiehua, L. (2018b). Study on output efficiency of forest ecological products based onSupply theory of public goods in Chinese. Issues For. Econ. 38, 25–32+102. doi:10.16832/j.cnki.1005-9709.2018.02.005
Yi-xiong, H., Jia-hang, R., Su-mei, X., Min, X., Xiang-yu, C., and Bai-qiong, L. (2022). Economic effects of marine ecological product policies: improving supply efficiency and realizing common prosperity —data analysis based on China's coastal provinces in Chinese. Mar. Sci. 46, 74–87. doi:10.11759/hykx20220824004
Yixiong, H., Yihui, Z., and Chunlin, L. (2022). Supply efficiency of water ecological products and its influencing factors in Zhoushan City based on RSBM-DEA model in Chinese. Water Resour. Prot. 38, 195–203. doi:10.3880/j.issn.10046933.2022.04.027
Yu, H., Xu, J., Hu, H., Shi, X., Wang, J., and Liu, Y. (2023). How does green technology innovation influence industrial structure? Evidence of heterogeneous environmental regulation effects. Environ. Dev. Sustain. 26, 17875–17903. doi:10.1007/s10668-023-03369-9
Zhang, D., Li, S., Zhang, Z., Li, N., Yuan, X., Jia, Z., et al. (2021a). Urinary stone composition analysis and clinical characterization of 1520 patients in central China. Sci. Rep. 11, 6467. doi:10.1038/s41598-021-85723-3
Zhang, W., Zhao, S., Wan, X., and Yao, Y. (2021b). Study on the effect of digital economy on high-quality economic development in China. PLoS One 16, e0257365. doi:10.1371/journal.pone.0257365
Zhang, X., and Yu, J. (2018). Spatial weights matrix selection and model averaging for spatial autoregressive models. J. Econ. 203, 1–18. doi:10.1016/j.jeconom.2017.05.021
Zhang, Y., and Lian, R. (2023). Sustainable development of human capital structure and firm performance—based on Chinese A-share listed companies. Theor. Econ. Lett. 13, 549–567. doi:10.4236/tel.2023.133035
Zhao, M., Liu, F., Song, Y., and Geng, J. (2020). Impact of Air pollution regulation and technological investment on sustainable development of green economy in Eastern China: empirical analysis with panel data approach. Sustainability 12, 3073. doi:10.3390/su12083073
Keywords: digital economy, supply efficiency of ecological products, spatial spillover effect, mechanism analysis, threshold effect
Citation: Shao J (2024) Influence mechanism of digital economy development on the supply efficiency of ecological products. Front. Environ. Sci. 12:1435156. doi: 10.3389/fenvs.2024.1435156
Received: 19 May 2024; Accepted: 02 October 2024;
Published: 14 October 2024.
Edited by:
Faik Bilgili, Erciyes University, TürkiyeReviewed by:
Manuela Tvaronaviciene, Vilnius Gediminas Technical University, LithuaniaYan Tang, Tianjin University of Technology, China
Copyright © 2024 Shao. This is an open-access article distributed under the terms of the Creative Commons Attribution License (CC BY). The use, distribution or reproduction in other forums is permitted, provided the original author(s) and the copyright owner(s) are credited and that the original publication in this journal is cited, in accordance with accepted academic practice. No use, distribution or reproduction is permitted which does not comply with these terms.
*Correspondence: Jingbo Shao, MjAxMzA3MTI3QGd6bnUuZWR1LmNu
 Jingbo Shao