 Yunhui Dong1
 Yiniu Cui
- 1School of business , Guangxi University, Nanning, China
- 2The University of Sydney Business School, University of Sydney, Sydney, NSW, Australia
- 3Jilin University, Changchun, Hebei, China
- 4Yunnan University, Kunming, China
This article is based on panel data from 266 cities in China from 2009 to 2020. Classical economics theory and Marxist political economy theory are used as the theoretical basis for the study. Static spatial Durbin model regression and dynamic spatial Durbin model regression are conducted to analyze the impact of education investment on carbon dioxide emissions. The results show that education investment can significantly reduce carbon dioxide emissions, not only through spatial spillover effects, but also through dynamic effects over time. The implementation of education investment in one city can have a positive impact on surrounding cities, thereby achieving a certain degree of reduction in carbon emissions. Additionally, the inhibitory effect of education investment on carbon emissions is more significant in the short term. Furthermore, the study found that there is significant heterogeneity in the effect of education investment on carbon dioxide emissions between northern and southern cities, with education investment in southern cities having a more significant effect. This may be related to the industrial structure and climate of southern cities. The conclusions of this study provide useful reference for the development of education policies and environmental protection policies. In the future, the government can increase education investment appropriately to achieve the goal of reducing carbon dioxide emissions. And research has shown that education investment can suppress carbon emissions by influencing changes in energy and industrial structures. Therefore, when using measures to reduce emissions in education investment, we can focus on these two aspects.
1 Introduction
On 22 September 2020, President Xi Jinping announced at the United Nations Sustainable Development Summit that China aims to achieve peak carbon emissions before 2030 and carbon neutrality before 2060. This is crucial for global climate change efforts. Carbon neutrality involves transforming energy and industries to a nearly zero-emission state after greenhouse gas emissions peak. As one of the largest carbon-emitting countries, China’s commitment will significantly contribute to global emissions reduction and economic transformation (Kong and wang, 2022). Achieving carbon neutrality will promote industrial restructuring and energy transformation, which is vital for China’s economic upgrade and green development. To reach this goal, the Chinese government has implemented policies to adjust the energy structure, promote clean energy technologies, and develop green finance. China also collaborates with the international community in areas such as carbon trading, emission accounting, and reduction technologies (Hepburn et al., 2021).
With climate change as a pressing issue, reducing carbon emissions has become a global priority. Education investment is a crucial policy tool for reducing carbon emissions through its transformative power. The Chinese government has significantly increased education investment, especially after the “13th Five-Year Plan”, focusing on education in poor areas, modernization, and equality (Razzaq et al., 2023). This investment improves infrastructure, technology, and educational models, optimizing resource allocation and improving teacher and student quality. Education investment also attracts social investment from high-tech enterprises and multinational corporations, enhancing industry-university-research cooperation. Studies show a strong correlation between education level and carbon emissions, as higher education levels lead to greater environmental awareness and adoption of low-carbon lifestyles and business practices (Cui et al., 2024). By embedding environmental education into daily courses and work, the government can enhance national environmental literacy, promoting green lifestyles and production models, thus reducing carbon emissions.
China is currently in a stage of economic transformation, striving to shift from the traditional high energy consuming and high polluting economic model to a green and low-carbon economic model. Education investment can cultivate a large number of talents with green skills and environmental awareness, thereby promoting the research and application of green technologies and promoting sustainable economic development (Wang et al., 2022). Education investment can promote technological innovation, especially in the fields of clean energy and low-carbon technology. Higher education institutions and research institutions can significantly reduce carbon emissions in industrial production and energy consumption by developing new technologies, promoting industrial upgrading and green development. As one of the world’s largest carbon emitters, China bears an important responsibility for reducing emissions in the international community. Reducing carbon emissions through education investment not only contributes to domestic environmental governance, but also demonstrates China’s positive attitude towards global climate change response, enhances international image, and fulfills global responsibilities (Guo and Cui, 2024).
Research in the European Union shows that increased education investment within a low-carbon economic model leads to substantial carbon emission reductions (Ma and Cui, 2024). In developing nations, it can decelerate carbon emissions growth. Therefore, investing in education is crucial for mitigating carbon emissions, enhancing environmental awareness, and achieving global green development. The research aims to explore the role of education investment in mitigating carbon emissions, focusing on: (1) How does education investment contribute to carbon emission reduction? (2) Are there temporal and spatial variations in its impact? (3) Does the impact differ across regions, and what are the pathways through which education investment affects carbon emissions?
Although many scholars at home and abroad have conducted extensive research on the impact of education investment on carbon emissions, there are still some research gaps in existing literature. These research gaps are mainly manifested in the following aspects: (1) Relative lack of theoretical foundation: Most studies only superficially discuss the impact of education investment on carbon emissions, without conducting in-depth research from an economic theory perspective (Zhu et al., 2021; Xu et al., 2023). (2) Single research dimension: Most researchers only explore the relationship between education investment and carbon emissions in isolation. Some studies focus on the temporal dimension, while others extend to spatial effects, but few scholars have combined these two aspects (Alkhateeb et al., 2020). (3) Lack of regional heterogeneity analysis: Previous studies have mostly focused on examining the overall situation in China, with little research on heterogeneous spatial dynamics, such as analyzing differences between northern and southern regions of China. (4) Lack of exploration on specific impact mechanisms: Many scholars have not yet explored the channels and mechanisms through which education investment affects carbon emissions (Silva et al., 2022).
To fill these research gaps, this study aims to make the following improvements and developments: (1) Theoretical Expansion: This study will be based on the theories of Western classical economics and Marxist political economy to investigate the mechanisms by which education investment affects carbon emissions, and will extend the research to real-world applications. (2) Comprehensive Dimension Analysis: Using a dynamic spatial Durbin model to empirically test the relationship between education investment and carbon emissions from both time and spatial dimensions, comprehensively examining their correlation. (3) Regional Heterogeneity Analysis: By distinguishing between northern and southern regions of China, this study will conduct spatial dynamic heterogeneity analysis on the impact of education investment on carbon emissions, providing more targeted analysis and accurate research results. (4) Exploration of Impact Mechanisms: Examining the impact channels of education investment on carbon emissions through energy structure and industrial structure, in order to gain a more comprehensive understanding of its impact. Through these improvements and developments, this study aims to fill existing research gaps and provide more in-depth, comprehensive, and accurate research results on the impact of education investment on carbon emissions. The novelty and contribution of the research lie in the expansion of its theoretical foundation, analysis of comprehensive dimensions, exploration of regional heterogeneity, and in-depth study of specific influencing mechanisms.
2 Literature review
2.1 The impact of education investment on carbon emissions
Reducing carbon emissions and achieving carbon neutrality have become critical global issues. Scholars have recognized the pivotal role of education in mitigating carbon emissions (Zhu et al., 2021). Education can enhance individuals’ environmental awareness and capabilities, thus helping address the escalating environmental crisis (Xu et al., 2023). From an economic perspective, investing in education firstly improves overall human capital and labor productivity, leading to reduced resource waste and carbon emissions during the production process. For instance, a study analyzing education and carbon emission data in China from 1995 to 2015 found that educational investment can enhance human capital and labor productivity, resulting in reduced resource waste and carbon emissions (Lin et al., 2021). Secondly, education investment promotes innovation in green technologies and the development of cleaner and more energy-efficient production methods to minimize carbon emissions (Feng et al., 2024). Highly skilled scientists worldwide have already developed advanced technologies that utilize renewable resources more effectively, facilitating the optimization and adjustment of the energy structure (Ling et al., 2024). Thirdly, education investment strengthens public understanding of environmental protection and sustainable development concepts, fostering support for government environmental governance policies and guiding individuals towards adopting sustainable consumption and production practices, ultimately achieving the goal of reducing carbon emissions (Shen et al., 2024). A study utilizing fixed-effects panel data models for European countries from 2000 to 2014 revealed that education investment enhances public understanding of environmental protection and sustainable development concepts, drives support for government environmental governance policies, and encourages the adoption of sustainable production and consumption patterns, leading to a reduction in carbon emissions (Maranzano et al., 2022). The cultivation of strong individual environmental awareness spreads through channels like social media, creating a ripple effect and even societal recognition (Feng et al., 2023). This means that more people will engage in environmental protection actions, ultimately achieving national carbon emission reduction and sustainable development. From a Marxist perspective, education enables workers to acquire environmental protection skills, internalize environmental consciousness, and develop environmentally friendly behaviors. In this way, both businesses and individuals can gradually adapt to low-carbon and environmentally friendly production and lifestyle practices (Silva et al., 2022). Furthermore, according to Marxism, education is a crucial component of the superstructure that can profoundly influence social production methods and relations (Dibaz and Erkilc, 2021). Therefore, besides enhancing environmental awareness, cognition, and capabilities to reduce carbon emissions, education investment can also promote the formation of environmental organizations and popularize environmental concepts, reversing the trend of capitalism’s profit pursuit at the expense of the environment. Lastly, Marxism posits that in a capitalist society, genuine environmental protection is unattainable, but education can drive improvements in the social system and facilitate the establishment of a genuine environmental protection framework (Feng et al., 2024). Government investments and policy support in the field of education will progressively encourage businesses and individuals to apply advanced environmental concepts and skills in all aspects of production and life, ultimately realizing the goal of reducing carbon emissions (Bartik, 2020).
In summary, hypothesis 1 of this article is proposed: education investment has an inhibitory effect on carbon emissions.
Studying the spatial spillover effects of education investment is necessary because it provides a deeper and more comprehensive understanding of the impact of education investment. The spatial spillover effects of education investment refer to the positive effects generated in neighboring areas outside the investment region. This spillover effect is related to the research on regional heterogeneity, as the spatial spillover effects of education investment are influenced by the geographical proximity and economic linkages between different regions. Specifically, the logic relationship of studying the spatial spillover effects of education investment can be explained as follows (Feng et al., 2023). Firstly, education investment improves human capital and skill levels in the investment region, thereby promoting economic growth and enhancing innovation capacity. This economic growth and enhanced innovation capacity have positive impacts on the surrounding areas of the investment region. For example, education investment can provide more employment opportunities and a highly skilled workforce, attracting people from surrounding areas to migrate and work in the investment region, thereby promoting the economic development of the surrounding areas. Secondly, the spatial spillover effects of education investment also involve the dissemination of knowledge and technology. Education investment improves the talent cultivation level and research and innovation capacity in the investment region, making the investment region a center for knowledge and technology production and innovation (Feng et al., 2024). The innovation activities of this knowledge and technology diffuse to the surrounding areas through personnel mobility and technology transfer, thereby promoting the economic development and technological upgrading of the surrounding areas. Lastly, the spatial spillover effects of education investment can also be reflected through promoting regional economic linkages. The economic development and enhanced innovation capacity in the investment region attract more investment and resources, facilitating economic cooperation and trade between the investment region and the surrounding areas. This economic linkage brings shared economic benefits and development opportunities, further driving the overall regional economic growth. In conclusion, studying the spatial spillover effects of education investment is aimed at better understanding the impact of education investment and exploring how education investment generates positive effects through the improvement of human capital, dissemination of knowledge and technology, and promotion of regional economic linkages. It is related to the research on regional heterogeneity, as the spatial spillover understand opportunities effects help us how education investment generates transmission effects and shared economic development between different regions (Shen et al., 2023).
2.2 The spatial effect of education investment on carbon emissions
The impact of education investment on carbon emissions exhibits spatial effects, and this study aims to elucidate the specific mechanisms through the lenses of classical economics and Marxist political economy. From the perspective of classical economics, firstly, based on the principle of externality, carbon emissions have externalities because they have negative impacts on the whole society and environment, which are not reflected in market prices (Ekici et al., 2022). Local education investment can increase people’s environmental awareness and energy efficiency, thereby reducing local carbon emissions. This reduction effect will further have external effects on adjacent areas, namely, reducing carbon emissions in adjacent areas. Hence, it can be inferred that local education investment also exerts a restraining influence on carbon emissions in neighboring regions. Wang et al. (2021) conducted an analysis utilizing time-series data and panel data models to explore the connection between education investment and carbon emissions. Their findings revealed that the impact of education investment in reducing carbon emissions extends beyond the local area, encompassing external effects that contribute to the decrease of carbon emissions in adjacent regions. Secondly, based on the principle of competition, when an area achieves outstanding achievements in environmental protection and energy utilization, other areas will also be affected because they will lag behind in resource utilization efficiency and corporate competitiveness. Local education investment can improve people’s environmental awareness and skills, thereby promoting local economic development and industrial upgrading (Xu and Luo, 2020). This competitive advantage will affect adjacent areas, prompting them to also strengthen investment and policy formulation in environmental protection and energy utilization, thereby reducing carbon emissions. Thirdly, based on the knowledge spillover effect, education investment will cultivate a group of talents with advanced environmental awareness and technical skills, and these talents may spread to adjacent areas, driving the improvement of carbon emission control levels in adjacent areas. In a study conducted by Zhang et al. (2023) on the influence of education on carbon emissions in China, the researchers also investigated the mediating role of technological innovation. The findings demonstrated that education investment plays a crucial role in nurturing individuals with heightened environmental consciousness and technical expertise. These skilled individuals subsequently migrate to other regions, leading to a reduction in carbon emissions. Education investment can attract more high-quality talents to the region, and these talents often have higher environmental awareness and technical skills in work and life, thereby playing a demonstrative and driving role in adjacent areas and promoting the improvement of adjacent areas’ carbon emission control capabilities (Fang et al., 2024). Finally, based on the cross-regional supply chain theory, local enterprises may have certain supply chain relationships with adjacent enterprises, such as raw material supply and component production (Wang et al., 2021). Through education investment, local enterprises can improve their own environmental awareness and technical skills, thereby raising higher environmental requirements for adjacent enterprises, indirectly promoting adjacent areas’ carbon emission control capabilities. From the perspective of Marxist political economy, firstly, according to the socialized production principle of Marxist political economy, as the degree of socialization of production increases, production activities are less likely to be limited to a specific area or country (Grosfoguel, 2011). Therefore, talents with environmental awareness and technical skills cultivated by local education investment can play an important role in cross-regional cooperation. Thus, this form of cross-regional cooperation will restrain carbon emissions in adjacent areas. Secondly, based on the global nature of environmental issues, environmental problems are a global issue, not just a local problem. Therefore, talents cultivated by local education investment can promote the development of environmental protection globally. These talents can share local environmental resources and experience in cross-regional cooperation, thereby improving the environmental awareness and technical skills of adjacent areas and further restraining their carbon emissions (He et al., 2022). In conclusion, education investment has spatial effects on carbon emissions. The specific mechanisms of these effects can be elucidated through the perspectives of classical economics and Marxist political economy, including the principles of externality, competition, knowledge spillover effect, and cross-regional supply chain theory (Shen et al., 2023). These mechanisms illustrate that education investment not only has an impact on carbon emissions in the local area but also generates external effects on adjacent areas, thereby promoting the improvement of adjacent areas’ carbon emission control capabilities.
Therefore, this article proposes hypothesis 2: Education investment in the local area has a inhibitory effect on carbon emissions in adjacent areas, and there is a spatial spillover effect.
Studying the impact of education investment on carbon emissions is just one aspect, while continuing to research the regional heterogeneity between the north and south can provide a more comprehensive perspective and in-depth understanding. The impact of education investment is influenced by significant disparities in economic development, industrial structure, energy consumption patterns, and climate conditions between the north and south. Therefore, the study of regional heterogeneity is closely related to the impact of education investment. Specifically, the disparity in industrial structure between the north and south is an important aspect of regional heterogeneity research. The southern region primarily focuses on light industries and service industries, while the northern region is dominated by heavy industries such as steel, metallurgy, machinery, and energy. This leads to significant differences in production methods and energy consumption patterns, which in turn have varying impacts on carbon emissions. By studying regional heterogeneity, we can gain a deeper understanding of the impact of industrial structure disparities on education investment and provide guidance for developing region-specific education investment strategies. Additionally, the disparity in technological levels between the north and south is also a crucial aspect of regional heterogeneity research. The southern region typically has relatively higher technological levels compared to the northern region. Production methods with higher technological content usually exhibit higher resource utilization and labor productivity, resulting in lower carbon emissions (Niu et al., 2024). Therefore, the effectiveness of increasing education investment in reducing carbon emissions may vary in different regions. By studying regional heterogeneity, we can gain insights into the impact of technological level disparities on the relationship between education investment and carbon emissions, thereby supporting the development of targeted education investment strategies for different regions. In summary, there is a logical relationship between the study of regional heterogeneity and the impact of education investment (Zhang et al., 2023). After studying education investment, further research on regional heterogeneity can provide a more comprehensive and in-depth understanding, helping to uncover the complex relationship between education investment and carbon emissions, and providing a scientific basis for developing region-specific education investment strategies.
2.3 The heterogeneity of education investment on carbon emissions in north and south China
Regional heterogeneity in the impact of education investment on carbon emissions may arise due to notable disparities in economic development, industrial structure, energy consumption patterns, and climate conditions between the southern and northern regions of China. This heterogeneity can be attributed to various factors from the standpoint of classical economics. Firstly, there is a large difference in industrial structure between the two regions, with the southern region focusing on light industry and service industries, and the northern region focusing on heavy industries such as steel, metallurgy, machinery, and energy (Lin and Wang, 2023). This leads to significant differences in production methods and energy consumption, which in turn affects the level of carbon emissions. Secondly, there is also a difference in technological level between the two regions, with the southern region having a relatively higher technological level than the northern region. Production methods with higher technological content usually have higher resource utilization and labor productivity, resulting in lower carbon emissions (Li et al., 2019). Therefore, in the northern region, increasing education investment can more effectively reduce carbon emissions (Shen et al., 2024). Finally, education investment can improve human capital levels, promote green technology and environmental awareness, and encourage green production and lifestyles. Undoubtedly, the impact of education investment on carbon emissions varies between the southern and northern regions of China, and this difference can be attributed to several factors. In a study conducted by Zhang and Wang (2019) on the impact of education investment on carbon emissions in southern China, a spatial panel model was employed. The findings revealed that high-tech production methods exhibit greater resource utilization and labor productivity, leading to comparatively lower carbon emissions. Consequently, increasing education investment can effectively contribute to the reduction of carbon emissions in southern China. Additionally, from the perspective of Marxist political economy, notable disparities in production modes exist between the northern and southern regions of China. Marxist political economists believe that production mode is the foundation and driving force of social development, and different production modes have different impacts on productivity and production relations. The southern region mainly relies on agriculture and handicrafts while the northern region is dominated by heavy industries, leading to differences in education investment and carbon emissions between the two regions. Furthermore, according to Marxist political economists, policies and regulations serve as a concentrated manifestation of state intentions, exerting a crucial influence on guiding economic development and the transformation of social production modes (Alami et al., 2022). The variations in policies and regulations between the northern and southern regions of China have distinct effects on both education investment and carbon emissions (Shen et al., 2024).
Therefore, this article proposes hypothesis 3: There is a significant north-south difference in the impact of education investment on carbon emissions.
2.4 The impact mechanism of education investment on carbon emissions
When conducting research on the impact of education investment on carbon emissions, it is inevitable to discuss the variables of energy structure and industrial structure, as these two variables play important mediating roles throughout the research process. The following will elaborate on the research on the impact of education investment on carbon emissions from these two aspects.
Education investment can indirectly reduce carbon emissions by influencing energy structure. Firstly, education investment can improve the quality and skill level of human resources, thereby promoting the transformation of energy structure (Baharin et al., 2020). By providing high-quality education and training opportunities, education investment helps enhance the technical capabilities and innovation awareness of the workforce. This will encourage enterprises to pay more attention to the development and utilization of clean energy, reducing reliance on high-carbon energy and lowering carbon emissions. Secondly, education investment can raise environmental awareness and a sense of responsibility among companies and individuals (Cui et al., 2023). Through education investment, people gain a better understanding of the importance of environmental protection and the impact of carbon emissions on climate change, fostering environmental values and behavioral habits. At the enterprise level, education investment can encourage companies to prioritize environmental responsibility, prompting them to adopt emission reduction measures and transition to clean energy (Raihan et al., 2023).
Simultaneously, industrial structure also plays a significant role in the impact of education investment on carbon emissions. Firstly, education investment can enhance the quality and skill level of human resources, promoting the upgrading and transformation of the industrial structure. By providing high-quality education and training opportunities, education investment helps improve the technical capabilities and innovation awareness of the workforce (Indrawati and Kuncoro, 2021). This will encourage companies to focus more on technological innovation and green development, driving the industrial transition towards low-carbon and environmentally friendly directions and reducing carbon emissions. Secondly, education investment can drive the development of green industries. Through cultivating and attracting talent, education investment can strengthen support and guidance for green industries. Green industries encompass clean energy, energy conservation and environmental protection, and circular economy sectors, which are crucial for reducing carbon emissions (Shaikh, 2017). Education investment can provide relevant professional knowledge and skill training, foster professionals needed in green industries, and promote their development and growth. At the enterprise level, education investment can make companies more aware of their environmental responsibilities, driving them to adopt emission reduction measures and green production methods, thereby upgrading the industrial structure and reducing carbon emissions (Cui et al., 2023).
Therefore, we propose hypothesis 4 in this paper: Education investment can suppress carbon emissions by influencing energy structure and industrial structure.
The impact of education investment on carbon emissions is a complex issue involving multiple factors in the economy, environment, and society (Yang et al., 2021). Therefore, it is necessary to study this issue from different theoretical perspectives. The classical economic school and the Marxist political economy school are two important economic schools, each with its own perspective on economic phenomena and social issues. These two schools of thought provide distinct perspectives and analytical approaches in examining the influence of education investment on carbon emissions. Despite their differing fundamental assumptions and analytical methods, both schools offer valuable insights and viewpoints regarding the correlation between education investment and carbon emissions. The classical economic school emphasizes the role of market mechanisms and free competition, arguing that investing in education can improve human capital quality and skills, leading to higher economic growth rates, reduced demand for and consumption of natural resources, and lower carbon emissions. This viewpoint emphasizes the dual role of education investment in economic development and environmental protection. The Marxist political economy school, on the other hand, focuses on class struggle and production relations, highlighting the exploitation and inequality under the capitalist system and proposing solutions through socialist revolution and the establishment of public ownership of the means of production. From this perspective, education investment can improve the awareness and organizing ability of the working class, promote the development of class struggle, and ultimately drive socialist revolution and the establishment of public ownership of the means of production, achieving environmental protection and sustainable development (Shen et al., 2023). This viewpoint emphasizes the importance of education investment in social change and environmental protection. By comparing the viewpoints of different economic schools on the relationship between education investment and carbon emissions, we can gain a more comprehensive and in-depth understanding, which is helpful for formulating more scientific and effective policies and measures to achieve the dual goals of economic growth and environmental protection. Therefore, this literature review and hypothesis proposed in this article will revolve around the theories of these two economic schools (Shen et al., 2024).
3 Methodology and data
3.1 Methodology
3.1.1 OLS panel regression model construction
In order to explore the impact of education investment on carbon emissions, this article constructs a benchmark model regression, as shown in formula 1:
In formula (1),
3.1.2 Construction of static space Durbin model
The spatial Durbin model is an advanced spatial econometric model that enhances and expands upon the traditional Durbin model. Unlike the traditional Durbin model, which only takes into account the interactions among independent variables, the spatial Durbin model incorporates spatial interactions among the independent variables. Specifically, the spatial Durbin model divides the independent variables into two parts: endogenous variables and exogenous variables. The endogenous variables are influenced both by themselves and by spatially adjacent regions; the exogenous variables are influenced only by themselves. This design allows the model to consider the spatial interactions between regions and is closer to the actual situation. The spatial Durbin model allows for the examination of the relationship between education investment and carbon emissions, taking into consideration the interplay between different regions.
In order to investigate the spatial impact of education investment on carbon emissions, this article constructs a Spatial Durbin Model (SDM), as shown in formula (2).
In Eq. 2, the variable i represents the geographical area, while t represents the year. W is an
3.1.3 Construction of dynamic spatial Durbin model
The dynamic spatial Durbin model is a further development of the spatial Durbin model, considering the dynamics of time-series data and spatial interrelationships. It can better describe the time series and spatial correlations between the independent and dependent variables, and is suitable for studying urban planning, economic growth, environmental pollution, and other aspects. When studying the impact of education investment on carbon emissions, the dynamic spatial Durbin model can more comprehensively consider the time-series and spatial correlations between education investment and carbon emissions. Firstly, it takes time for investment in education to accumulate to have an impact on environmental protection, and it takes time for carbon emissions to accumulate as well, so the relationship between the two is dynamic; secondly, investment in education and carbon emissions can have different impacts in different regions. Due to regional variations in environmental issues and economic conditions, the impact of education investment on carbon emissions can differ significantly. To provide governments and enterprises with more precise environmental protection policies and investment plans, it is crucial to analyze this impact accurately, considering changes in time, space, and other influencing factors. The dynamic spatial Durbin model offers a more comprehensive approach to studying this relationship. However, there is currently limited research utilizing this model to investigate the impact of education investment on carbon emissions. Therefore, this study aims to fill this gap by constructing a dynamic spatial Durbin model to examine the impact of education investment on carbon emissions across 266 cities in China.
To comprehensively examine the impact of education investment on carbon emissions, this study utilizes a dynamic spatial Durbin model regression that incorporates both temporal and spatial dimensions. The specific model is represented by Eq. 3:
In Eq. 3,
3.1.4 Construction of mediating effect
In order to explore the mediating role of energy structure and industrial structure in the impact of education investment on carbon emissions in the future, this article draws on James H. Sobel (2008) and Jiang Ting (2022) to construct a mediating effect model, as shown in formulas (4)–(7):
Among them,
3.2 Variable description and data source
3.2.1 Explained variable
The explained variable in this model is carbon emissions (CO2). Carbon emissions are determined by the utilization of 10 different energy sources in each area, including crude coal, coke, unrefined petroleum, gas, lamp oil, diesel, fuel oil, natural gas, liquefied petroleum gas, and electricity (Jiang et al., 2022). The calculation method for carbon emissions is as follows:
In Eq. 8,
3.2.2 Core explanatory variable
The core explanatory variable in this study is education investment. Education investment refers to the total resources, including human, material, and financial resources, that a country or region invests in education for its development. Due to the lack of suitable statistical indicators to quantify the human and material resources invested in education activities, and considering the dominant position of state financial allocation in education investment, this paper takes reference from the practice of many scholars and selects the state financial investment in education in 266 cities from 2009 to 2020, which mainly includes education utility fees, investment in education infrastructure and other additional expenditure (Madani, 2019). The data is sourced from the “China Urban Statistical Yearbook” On this website, scholars can check the annual education investment amount of local governments in various cities in China, which can be found in Sections 2–11 of the annual yearbook.
3.2.3 Mediating variable
(1) Energy structure
This study introduces “energy structure” as another important mediating variable for research. It is defined as the proportion of traditional energy sources (such as coal, oil, and natural gas) in urban energy consumption. This indicator reflects the types and sustainability of energy usage in cities, holding significant environmental protection and economic implications. Data from the “China City Statistical Yearbook” and prefecture-level statistical bulletins are used to calculate the proportion of traditional energy sources in total energy consumption for each city, thereby analyzing the role of urban energy structure in the mechanism of the impact of educational investment on carbon emissions.
There are several reasons for choosing energy structure as the mediating variable between education investment and carbon emissions: (1) Energy structure is a direct influencing factor of carbon emissions, which refers to the proportion of different types of energy in energy consumption in a country or region, such as coal, oil, natural gas, and renewable energy. The use of traditional fossil fuels such as coal and oil is the main source of carbon emissions, while clean energy sources such as wind, solar, and hydropower help reduce carbon emissions. Therefore, the energy structure directly determines the level of carbon emissions. (2) Education investment promotes the optimization of energy structure, and can cultivate a large number of talents with clean energy technology and management capabilities, promoting the research and application of clean energy technology. For example, higher education and research institutions can develop more efficient clean energy technologies through technological innovation, reducing dependence on traditional fossil fuels. In addition, education can raise public awareness of environmental protection, encourage them to choose more environmentally friendly energy consumption methods in their daily lives, and thus promote the optimization of energy structure. (3) The change in energy structure reflects the indirect effect of education investment, and the impact of education investment on carbon emissions is often indirect, while the change in energy structure is a quantifiable mediating variable. By analyzing the changes in energy structure, we can gain a clearer understanding of how education investment achieves carbon reduction by optimizing the energy structure. For example, increasing research and application of clean energy technologies can directly reduce the use of high carbon energy sources such as coal and oil, thereby lowering carbon emissions. (4) The adjustment of energy structure is in line with national policy guidance. In the process of achieving carbon neutrality goals, the Chinese government has introduced a series of policies to promote the adjustment of energy structure. For example, promoting the “Carbon Peak Action Plan” and the “Renewable Energy Development Plan”. Education investment can effectively support the implementation of these policies and promote the adjustment and optimization of energy structure by cultivating professional talents in relevant fields and enhancing public environmental awareness.
(2) Industrial structure
This paper defines “industrial structure” as the proportion of the tertiary industry in the total industry. The tertiary industry, also known as the service industry, includes sectors such as finance, education, healthcare, and retail, which often have higher labor productivity and economic contribution. Therefore, the proportion of the tertiary industry is usually regarded as an important indicator of economic modernization and urbanization levels. The data used in this study are derived from the “China City Statistical Yearbook” specifically focusing on the economic value added of the service industry and the total industry in various prefecture-level cities. This data aims to provide insights into the industrial structure characteristics of different cities.
There are several reasons for choosing industrial structure as the mediating variable between education investment and carbon emissions: (1) The close relationship between industrial structure and carbon emissions. Industrial structure refers to the proportion and layout of various industries (such as agriculture, industry, and services) in economic activities of a country or region. Traditional industries with high energy consumption and emissions are the main sources of carbon emissions, while service and high-tech industries typically have lower carbon emissions. Therefore, the industrial structure directly affects the overall level of carbon emissions. (2) Education investment promotes the optimization and upgrading of industrial structure, and can drive technological progress and industrial upgrading in the economy. By enhancing the skill level and innovation ability of workers, education can promote the transformation and upgrading of traditional industries, reduce the proportion of high energy consuming and high emission industries, and increase the proportion of high-tech industries and service industries. For example, higher education and vocational education can cultivate high skilled talents and promote the development of manufacturing towards high added value and low emissions. (3) Changes in industrial structure reflect the indirect effects of education investment, and the impact of education investment on carbon emissions is often indirectly realized through multiple channels, with industrial structure changes being a significant mediating variable. Analyzing changes in industrial structure can provide a clearer understanding of how education investment can achieve carbon emissions reduction by promoting industrial structure optimization. For example, education has improved the quality of the labor force, promoted technological progress, and thus promoted the transformation of the industrial structure towards low-carbon direction. (4) The adjustment of industrial structure is in line with the national economic development strategy, and the Chinese government emphasizes the optimization and upgrading of industrial structure in promoting high-quality economic development. For example, both the “14th Five Year Plan” and the “Manufacturing Power Strategy” emphasize the need to vigorously develop high-tech industries and reduce high energy consuming and high emission industries. Education investment can effectively support the implementation of these strategies and promote the optimization and upgrading of industrial structure by cultivating talents in related fields and enhancing innovation capabilities.
3.2.4 Control variable
(1) Digital inclusive finance index (
The China Digital Inclusive Finance Index, compiled by the Digital Finance Research Centre of Peking University, evaluates the level of development of digital inclusive finance in countries. It takes into account various aspects such as digital payment, digital credit, digital insurance, and digital investment. By combining these aspects, the index provides a comprehensive measure of digital inclusive finance development, which can be used to assess the level of development in different countries. The index aims to offer an objective, detailed, and comprehensive assessment that accurately reflects the development and inclusiveness of digital finance in China. There is a correlation between digital inclusive finance and carbon emissions. The development of digital inclusive finance can contribute to economic development and social progress while also helping to reduce carbon emissions across all sectors. If the digital inclusion index is high, people can access financial services more easily, which is conducive to investment in education and also helps businesses to grow, thus reducing carbon emissions; and reducing the use of paper through online payments, e-billing and e-contracts can also reduce carbon emissions. Therefore, if digital inclusive finance is not used as a control variable, its impact on carbon emissions may be overlooked, thus leading to inaccurate research findings, so this paper uses digital inclusive finance as a control variable in this paper. The data is sourced from the Digital Finance Research Center of Peking University (2020).
(2) Environmental regulation (
The environmental regulation index is used by regulatory authorities to guide the establishment and implementation of enterprises, reduce pollutant emissions, and achieve environmental protection and first-class economic development. In this study, the emissions of contemporary wastewater, contemporary sulfur dioxide, and contemporary residue are utilized to calculate the whole index of regional environmental indicators (Cao et al., 2022). Environmental regulation and carbon emissions are correlated. The stringency of environmental regulations directly influences the production methods and emission levels of companies, thus impacting carbon emissions. Therefore, it is essential to consider environmental regulation as a control variable in order to analyze its influence on carbon emissions. For example, if environmental regulations are more stringent, firms will increase their investment in environmental facilities and research and development of environmental technologies, thereby reducing carbon emissions. Conversely, if environmental regulations are less stringent, firms may choose to reduce their environmental investments and increase their carbon emissions. If environmental regulation is not included as a control variable, its effect on investment in education and carbon emissions may be ignored, leading to inaccurate findings of the study. Therefore, when studying the impact of education investment on carbon emissions, environmental regulation needs to be included as a control variable in order to eliminate its impact on education investment and carbon emissions. The raw data for calculating the environmental regulation index, such as emissions of wastewater, contemporary sulfur dioxide, and residues, can be obtained from the China Urban Statistical Yearbook.
(3) Local government attention to the ecological environment (
In this paper, we use the number of times ecological environment appears in each local government report to indicate the level of local government attention to the ecological environment, following the practice of scholars such as Chen et al. (2018) and Shen et al. (2023). Local government’s ecological attention was selected as a control variable due to its impact on ecological protection and carbon emissions. When local governments prioritize the ecological environment, they tend to invest more in environmental protection facilities and enhance their oversight of enterprises. This, in turn, promotes the development of ecological environmental protection and reduces carbon emissions. Consequently, including local government’s ecological attention as a control variable helps to mitigate its influence on the relationship between education investment and carbon emissions, thereby enhancing the accuracy of the study. The data is sourced from the third-party data platform PIPIXIA1 (2020), which uses Python to extract text from various local government reports. The specific content is shown in Table 1.
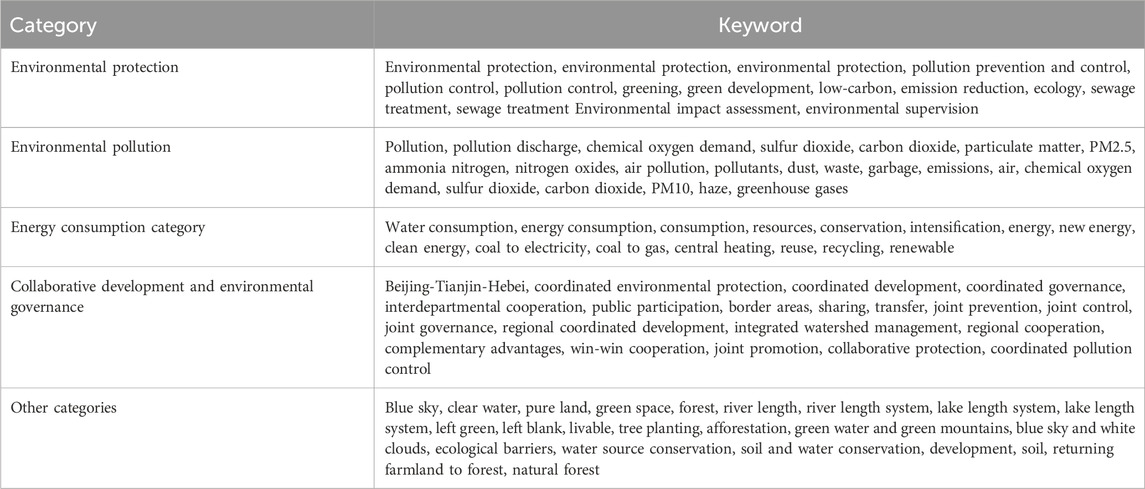
Table 1. Local government ecological environment attention text keywords.
(4) Urban green space (
The urban green space area represents the amount of green space within each city, encompassing various types such as public green spaces, residential green spaces, flat green spaces, road green spaces, and park green spaces. As a sub-system of the urban ecosystem, urban green space actively contributes to maintaining the ecological balance of the city. It was selected as a control variable because it plays a crucial role in absorbing carbon dioxide and reducing carbon emissions. In addition, urban green space can also affect the air quality and environmental quality of a city, and therefore the level of carbon emissions. For example, if urban green space is not controlled for in a study, the effect of urban green space on the relationship between investment in education and carbon emissions may be overlooked, leading to inaccurate findings. Therefore, controlling for urban green space can help improve the accuracy of the study. The data is sourced from the China Urban Statistical Yearbook. On this website, scholars can query the number of green space areas in various cities in China for each year. For details, please refer to Sections 2–5.
(5) Financial institutions’ deposits and loans
The number of deposits and loans of financial institutions reflects the extent to which financial services support economic development. A high level of financial institution deposits and loans indicates that financial institutions are providing significant financial support for education investment and enterprise development, which is conducive to education investment and enterprise development, thereby reducing carbon emissions. For example, if financial institutions have a high level of savings and loans, enterprises can more easily obtain financing support, which can accelerate technological upgrading and environmental protection facilities and help reduce carbon emissions. Furthermore, financial institutions play a vital role in promoting sustainable economic development by providing financial support for technological innovation and the construction of environmental protection facilities in enterprises, leading to a reduction in carbon emissions. Consequently, controlling the deposit and loan activities of financial institutions helps to eliminate their influence on the relationship between education investment and carbon emissions, thus enhancing the accuracy of the study. The data is sourced from the China Urban Statistical Yearbook. On this website, scholars can query the bank deposits and loans of various cities in China for each year. For details, please refer to Sections 2–13.
(6) Gross regional product
The gross regional product (GRP) serves as a crucial indicator of economic development and is a factor that influences carbon emissions. While a high GDP signifies advanced economic development, it can also result in increased energy consumption, environmental pressures, and subsequently, higher carbon emissions. For instance, regions with a high GDP tend to witness an upsurge in production scale and energy consumption by enterprises, potentially leading to elevated carbon emissions. Additionally, regional GDP holds significance as an economic indicator. Therefore, considering the role of regional GDP when examining the impact of education investment on carbon emissions helps in delving deeper into the role of education investment in balancing economic development and environmental protection. Failing to account for the influence of regional GDP and solely focusing on education investment itself may yield biased study findings. Hence, incorporating regional GDP as a control variable allows for a more comprehensive assessment of the impact of education investment on carbon emissions. It also facilitates the formulation of more reasonable policy recommendations to promote the harmonious development of the economy and the environment. The data utilized in this study is sourced from the China Urban Statistical Yearbook. On this website, scholars can query the GDP of various cities in China for each year. For details, please refer to Sections 2–9.
(7) Number of green patents
This refers to the total number of inventions, utility model and design patents in each city on the subject of green technologies, and is chosen to measure the innovation capacity of the city. Green technology patents refer to patents related to environmental protection, such as technological innovations in energy conservation and renewable energy. The development and application of these technologies can reduce carbon emissions and promote environmental protection. Therefore, the number of green technology patents can also be used as an indicator of the level of environmental protection, as well as one of the factors affecting carbon emissions. If the number of green technology patents is high, it indicates a high level of environmental protection in the region, which may lead to a reduction in carbon emissions. For example, if the number of green technology patents is high, companies may adopt more environmentally friendly technologies in their production processes, which may lead to a reduction in carbon emissions. In addition, green technology patents are an important indicator of the level of innovation, so considering the role of green technology patents when studying the impact of investment in education on carbon emissions can also help to explore in depth the role of investment in education in terms of environmental protection and technological innovation. If the impact of education investment on carbon emissions is only considered in terms of education investment itself, while the impact of green technology patents is ignored, it may lead to biased research findings. Hence, incorporating green technology patents as a control variable enables a more comprehensive evaluation of the impact of education investment on carbon emissions. This approach facilitates the formulation of more reasonable policy recommendations to foster the harmonious development of the economy and the environment. The data utilized in this study is obtained from the China National Intellectual Property Administration (2020). Scholars can access the website to retrieve the number of green technology patents for each year and city in China by manually entering the desired year and region for inquiry.
3.3 Descriptive statistics
The reasons for selecting the time period from 2009 to 2020 are as follows:1. Energy structure transformation: China has been promoting the transformation of its energy structure during this period, increasing the development and utilization of clean energy. With the increasing share of renewable energy, the impact of education investment on carbon emissions may change. Analyzing the data can provide a deeper understanding of whether education investment plays a positive role in promoting the development of clean energy and its effects during the transformation process. 2. Sustainable development progress: China’s sustainable development progress has been rapidly advancing during this period, and sustainable development has had a significant impact on carbon emissions. Education investment plays an important role in sustainable development. In 2012, the Development Research Center of the State Council of China issued the “Agenda 21 of the People’s Republic of China on Sustainable Development,” which aims to promote sustainable development and proposes a series of principles and measures.3. Education policies and environmental awareness: In 2010, the State Council of China issued the “National Medium- and Long-term Educational Reform and Development Plan (2010-2020)," which sets out the overall goals and key tasks for the development of education. It emphasizes promoting the sustainable development of education and focuses on cultivating environmental awareness and sustainable development capabilities. At the same time, environmental awareness in Chinese society has been increasing, and people have a deeper understanding of the importance of environmental protection. Studying the impact of education investment on carbon emissions can evaluate the role of education policies in environmental protection and sustainable development, and explore the influence of education investment on shaping public environmental awareness and behaviors. In conclusion, selecting the data from 2009 to 2020 to study the impact of education investment on carbon emissions, and conducting specific analyses from the perspectives of energy structure transformation, sustainable development progress, education policies, and environmental awareness, will help deepen our understanding of the mechanisms and effects of education investment on carbon emissions. This will provide a scientific basis for formulating targeted policies and measures.
In order to have a clearer understanding of each variable, this article has created a variable summary table to represent it, as shown in Table 2:
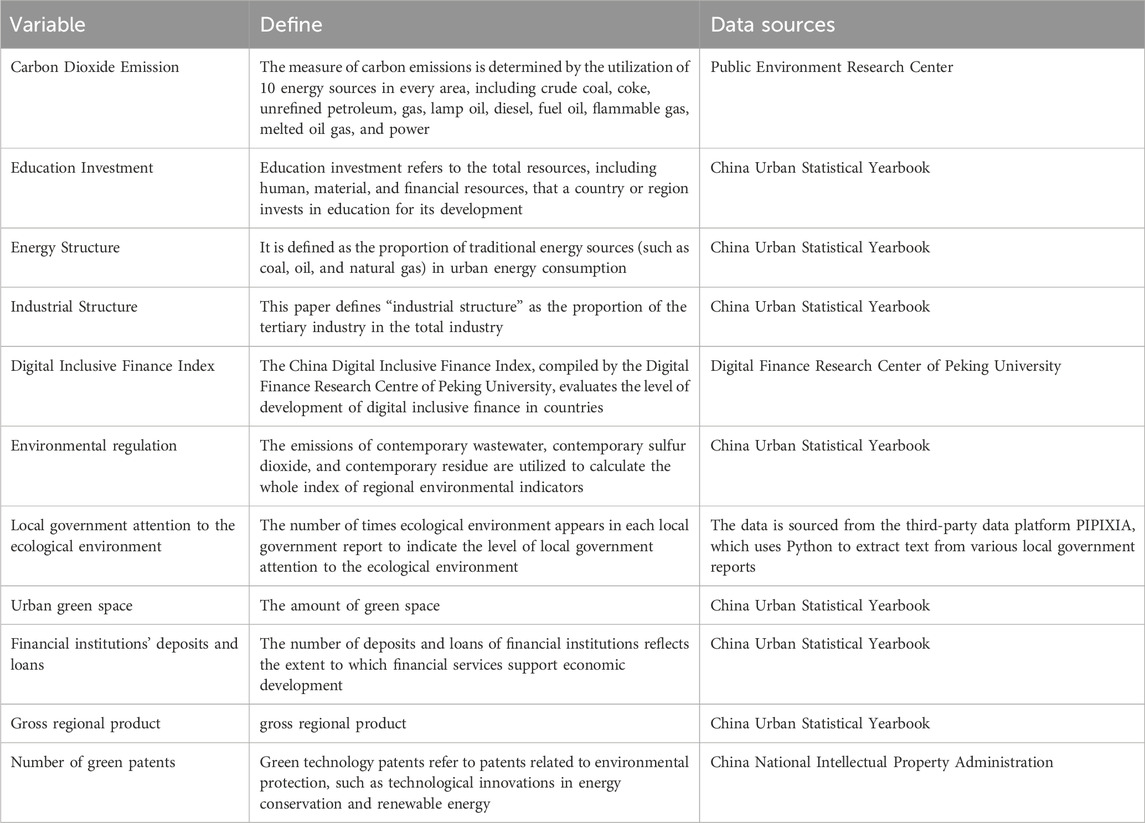
Table 2. Variable summary table.
The original data sources of all variables were listed when explaining the variables, and the author collected, organized, and processed the data of each variable2. In order to ensure the scientific accuracy of the empirical analysis and to reduce the impact of heteroskedasticity of the variables, the data on carbon dioxide emissions, investment in education, urban green areas, gross domestic product of each region, bank deposit and loan balances and the number of green patents were logarithmically processed. Table 3 presents the descriptive statistics for each variable. It is evident that the lnco2 variable exhibits substantial variation across regions, with a maximum value of 18.192 and a minimum value of 11.587. This indicates significant disparities in carbon emissions among different regions, highlighting the presence of pronounced geographical differences. Given these findings, it becomes crucial to conduct a regional heterogeneity study when examining the impact of education investment on carbon emissions. This approach allows for a more comprehensive analysis that takes into account the diverse characteristics and circumstances of different regions.
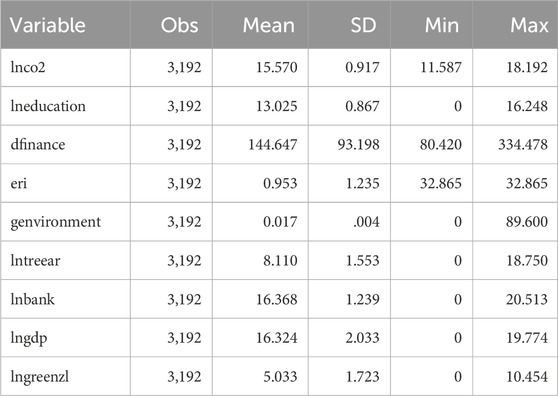
Table 3. Descriptive statistics.
4 Results and discussion
4.1 Data stability test
4.1.1 Unit root test
Many times series data exhibit non-stationary trends and there may not be a direct link between these series, but they may exhibit common trends. Therefore, if we perform a regression analysis between these series, a spurious or pseudo-regression may occur, even if the regression results have a high goodness of fit (R2), which is not practically meaningful. To avoid this, we must test the data for stationarity, of which the most used method is the unit root test. For panel data, i.e., data consisting of time and individuals, we need to perform unit root tests as well, especially when dealing with macro data. Therefore, in this paper, unit root tests were conducted for the variables involved, including FISHER, LLC, IPS and HADRI, and the results showed that all variables passed more than three unit root tests, proving that the data for these variables are stationary and can be subjected to subsequent regression studies. The specific inspection results can be seen in Table 4.
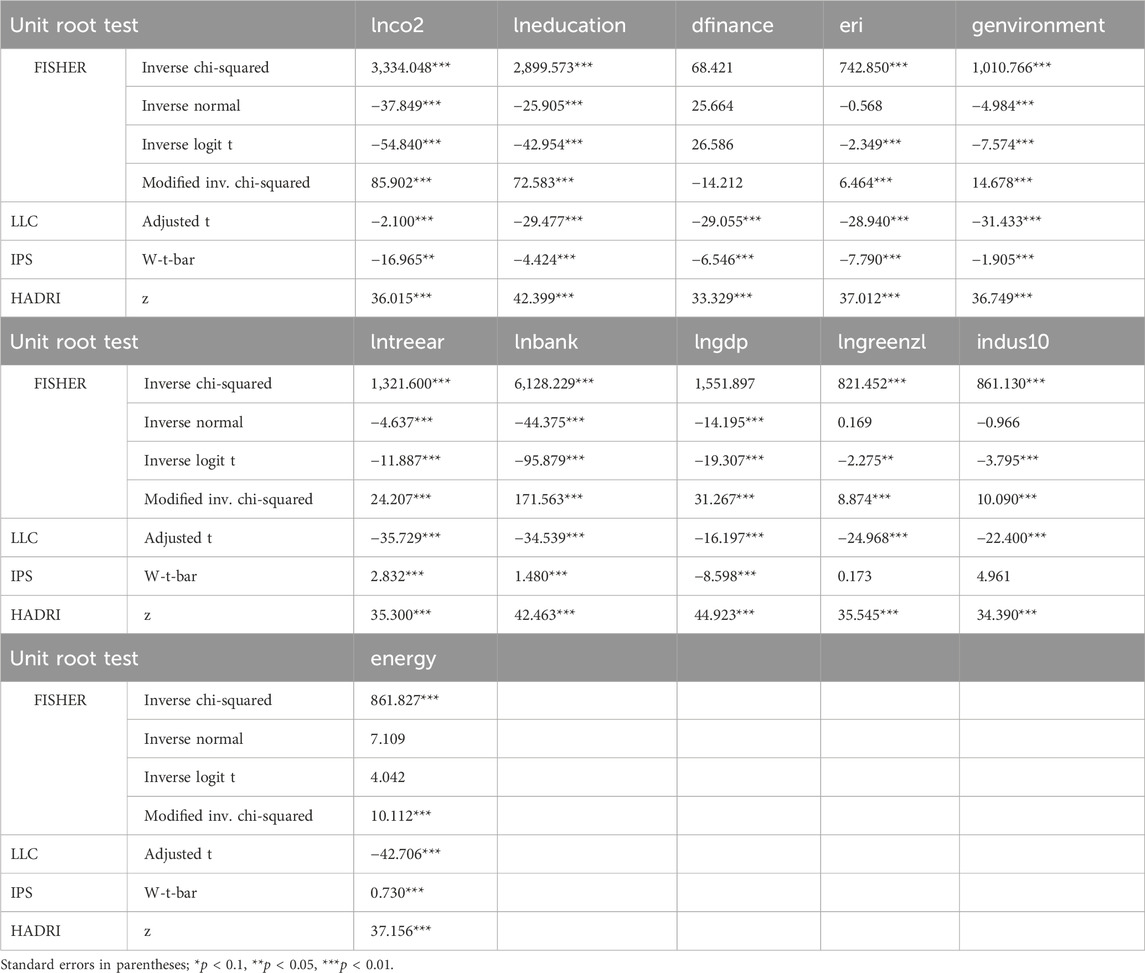
Table 4. Unit root test.
4.1.2 The cointegration test
The Cointegration Test is a modeling and theoretical analysis method that combines spatial structure and temporal dynamics through vector autoregressive analysis of time series. It was first proposed by Granger (1987) and aims to determine whether the regression equation’s causal relationship is a spurious regression, i.e., whether there exists a stable relationship between the variables. Cointegration tests are particularly valuable for testing causality in non-stationary series. Passing a cointegration test indicates the presence of a stable equilibrium relationship between the variables over time, with stationary residuals in their equations. This provides a solid foundation for subsequent regression analysis. In this study, we conducted a panel cointegration test using Kao, Pedroni, and Westerlund types. The results, presented in Table 5, indicate that all three tests are significant at the 1% level. This confirms the existence of a long-term stable equilibrium relationship between the variables considered in this study, establishing a reliable basis for subsequent regression analysis.
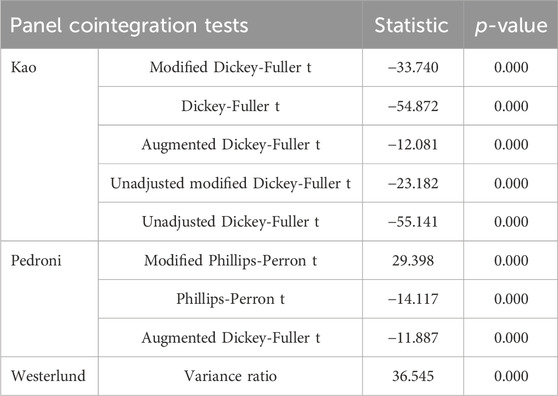
Table 5. Panel cointegration tests.
4.2 Benchmark regression
We first used the Hausman test to verify whether to use the fixed effects model. The results, as shown in the Hausman test in column (1) of Table 6, yielded a Hausman statistic of 327.31, which is significant at a 1% level. This indicates that the fixed effects regression model should be used. Therefore, this study empirically examined the impact of education investment on carbon dioxide emissions in 266 cities across the country using the fixed effects model, as shown in column (1) of Table 6. To address issues such as heteroscedasticity, within-group autocorrelation, and cross-sectional contemporaneous correlation in panel data, this study conducted corrective research using the PCSE model and FGLS model to modify the benchmark model. The regression results, presented in columns (2) and (3) of Table 6, show that the modified results are consistent with the benchmark regression results, confirming the robustness and reliability of the benchmark results. Additionally, this study conducted variance inflation factor (VIF) analysis to address multicollinearity among variables, as shown in column (4) of Table 6. The VIF values for all variables were below 5, indicating that multicollinearity has a minimal impact on the benchmark regression results and further confirming their robustness.
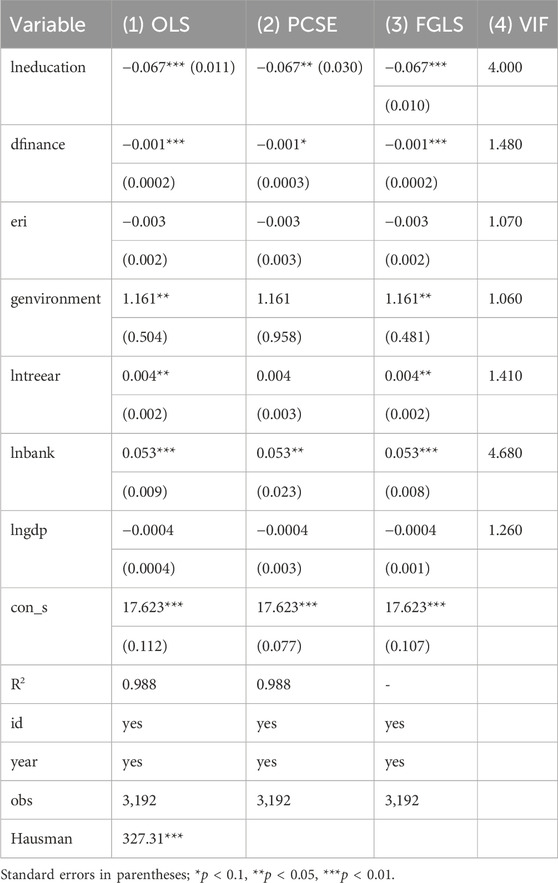
Table 6. Benchmark regression results.
The Ordinary Least Squares (OLS) regression model demonstrates a strong goodness of fit, with an R2 value of 0.988. This high value indicates that the regression model is well-suited and justifies its construction. Analyzing the regression results in column (1) of Table 6, we observe a significant and negative coefficient of −0.067 for the impact of education investment on carbon emissions. This coefficient is significant at the 1% level, suggesting that an increase in government investment in education is associated with a decrease in carbon emissions. This finding supports the notion that investment in education has a dampening effect on carbon emissions. This is not difficult to understand; an increase in government investment in education will increase public awareness of environmental protection and climate change, and promote the spread and increase of environmental awareness. This will lead to a greater understanding of the impact of carbon emissions and therefore a greater appreciation of the importance of reducing carbon emissions. At the same time, government investment in education can also encourage people to adopt a more environmentally friendly and low-carbon lifestyle, such as cycling or walking instead of driving, reducing energy waste and cutting carbon emissions. These measures can reduce carbon emissions not only for individuals but also for society. Therefore, Hypothesis 1 proposed in this paper is validated.
The regression analysis also reveals that digital inclusive finance
4.3 Spatial Durbin model regression analysis
4.3.1 Spatial autocorrelation test
Prior to constructing the spatial model, we calculated the global Moran index for carbon dioxide emissions (
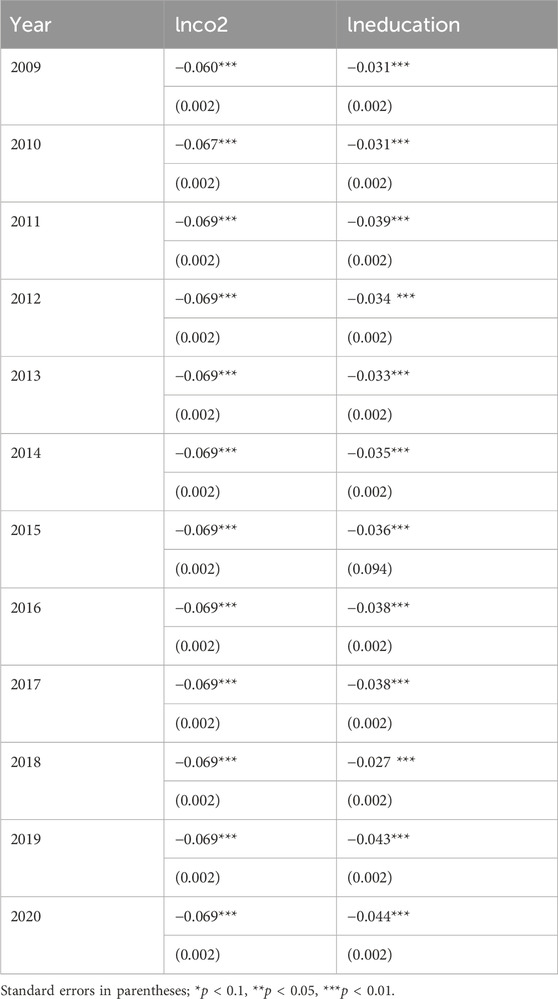
Table 7. Moran I test results.
Looking at the Moran scatter plot in Figure 1, we can see that in 2020, the majority of cities have a negative spatial autocorrelation between CO2 emissions and investment in education, as the Moran scatter points fall in the second and fourth quadrants.
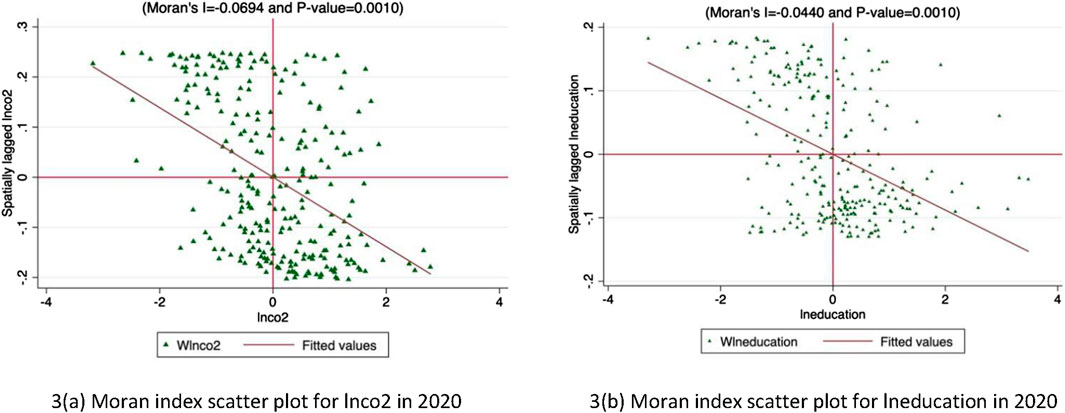
Figure 1. Moran’s I scatter plot in 2020. (A) Moran index scatter plot for lnco2 in 2020. (B) Moran index scatter plot for lneducation in 2020.
4.3.2 Static space Durbin model and dynamic space Durbin model regression analysis
This study uses the Dynamic Spatial Durbin Model (DSDM) for the following reasons: (1) Considering temporal and spatial dependencies, changes in carbon emissions are not only affected by current education investments, but also by the lagged effects of past education investments. The dynamic spatial Durbin model can capture both temporal dynamic effects and spatial spillover effects simultaneously. (2) Reflecting spatial interactions, carbon emissions between cities may have spatial interactions, such as carbon emission policies, technological innovations, and economic activities in neighboring cities that may have an impact on the carbon emissions of their own city. DSDM can effectively capture and quantify this spatial spillover effect. (3) The complexity of policy transmission mechanisms and the impact of education investment on carbon emissions are achieved through various pathways and mechanisms, such as technological progress and increased public environmental awareness. These mechanisms are complex in space and time, and DSDM can more comprehensively reflect these complex conduction mechanisms.
The spatial Durbin model has the following advantages: (1) capturing dynamic effects, DSDM can analyze the cumulative and lagged effects of education investment at different time points, which helps to understand the long-term impact of education investment on carbon emissions. (2) Spatial spillover effects, by introducing spatial weight matrices, DSDM can capture the mutual influence between neighboring regions and quantify the spillover effects of education investment and carbon emissions in space. (3) With higher estimation accuracy, DSDM can consider both temporal and spatial autocorrelation, making the model estimation more accurate and avoiding errors caused by neglecting spatial dependence and time lag effects. (4) Through DSDM, researchers can identify policy transmission pathways and differences in effects in different regions, providing scientific basis for coordinated development and policy formulation between regions.
Using the dynamic spatial Durbin model to study the impact of urban education investment on carbon emissions can comprehensively capture the dynamic effects in time and space, reflect the interactions between cities, provide more accurate estimates and profound policy analysis, and provide important theoretical and empirical support for understanding and solving carbon emission problems.
Will investment in education in the local region have an impact on CO2 emissions in neighboring regions? The objective of this paper is to examine the potential positive or negative effects of investment in education on carbon dioxide emissions. To achieve this, both static and dynamic spatial Durbin model regressions were employed to analyze the spatial spillover effects of education investment on carbon dioxide emissions. A series of tests were conducted prior to the spatial Durbin regressions and the results are shown in Table 8. To determine what type of fixed effects model to choose, tests were also conducted to determine whether to choose time fixed, individual fixed or double fixed, where the regression results for both individual fixed and time fixed were significant at the 1% significance level with coefficients of 221.30 and 11,342.79 respectively, hence the individual and time double fixed model was chosen for the spatial Durbin model in this paper. On this basis, to ensure that our choice of spatial Durbin model is reasonable, the Wald test and the likelihood ratio test were carried out respectively. The results of these tests were significant at the 1% significance level, and the original hypothesis that the spatial Durbin model could be reduced to a spatial lagged model (SLM), or a spatial error model (SEM) was rejected, proving that the choice of the spatial Durbin model in this paper is reasonable.
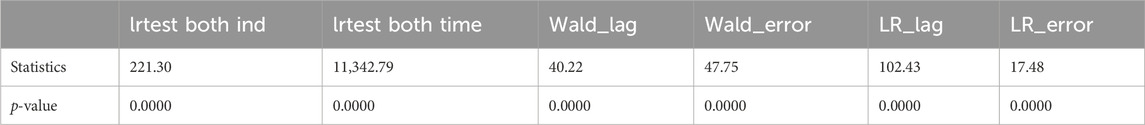
Table 8. Wald and LR test.
Static spatial panel regression and dynamic panel regression are two commonly used methods for analyzing panel data. Static spatial panel regression involves the analysis of data from multiple regions that are fixed in relation to each other at a particular point in time. This method controls for differences between regions, but cannot take into account changes over time. Dynamic panel regression refers to the analysis of data from multiple regions at multiple points in time, where the relationship between these regions changes over time. This method can take into account changes over time, but cannot control for differences between regions. In practical applications, both relationships between regions and changes over time are inevitable. Only a dynamic spatial panel regression model that considers both space and time can provide a comprehensive analysis of relationships between regions and changes over time, leading to more accurate and comprehensive conclusions. Dynamic spatial panel regression models help to study the dynamic interactions between regions, such as the linkage effect, spatial transmission effect and spatial spillover effect between regions. In addition, dynamic spatial panel regression models can study temporal heterogeneity, such as changes in time trends and the effects of time cycles, which cannot be studied in static panel regression models either. Therefore, in this paper, two models, static spatial panel regression and dynamic spatial panel regression, were chosen for comparative analysis, to analyze the impact of education investment more comprehensively on carbon emissions, and the specific regression results are shown in Table 9.
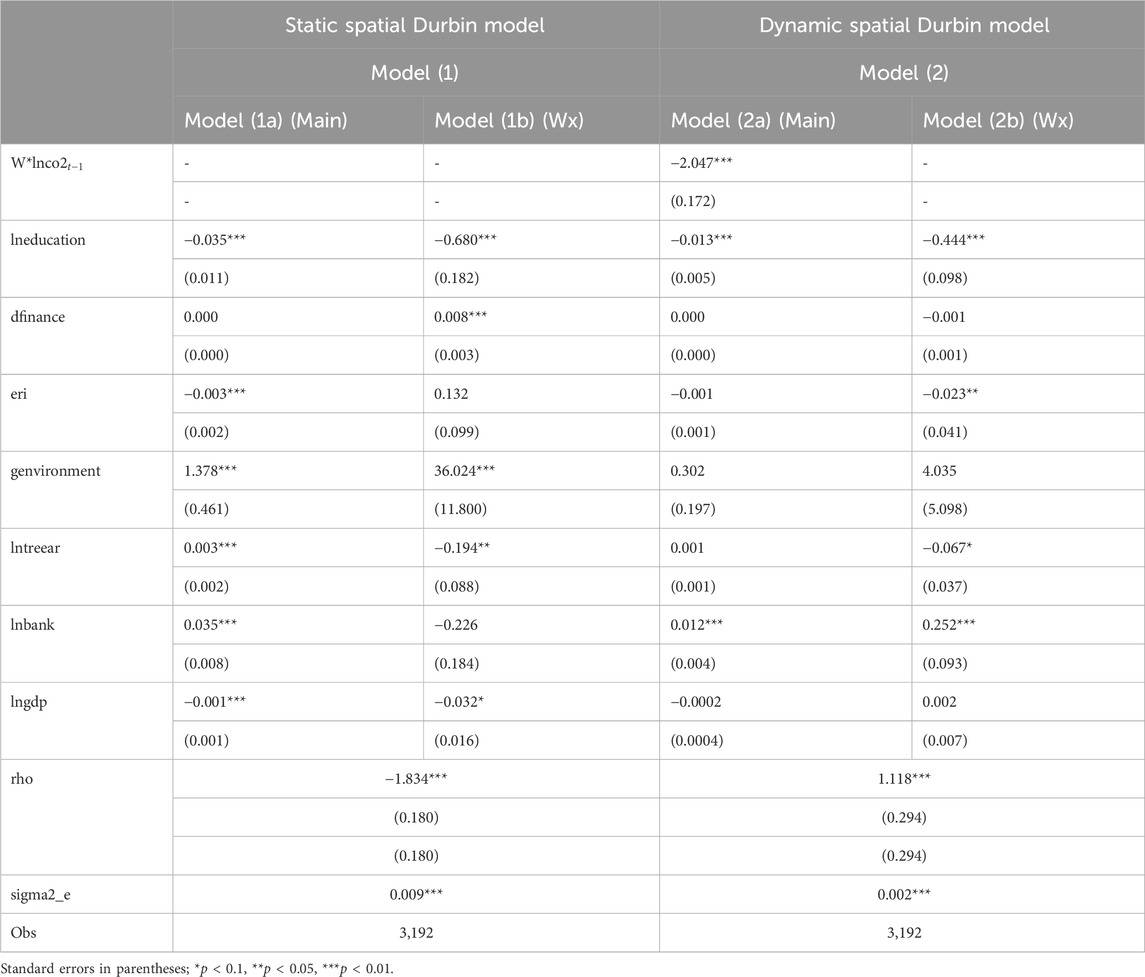
Table 9. Static space Durbin model regression and dynamic space Durbin model regression results.
Table 9 presents the results of both the static spatial Durbin model and the dynamic spatial Durbin model. In both models, the main regression effect (Main) and the spatial spillover effect (Wx) of investment in education exhibit a suppressive impact on CO2 emissions, with coefficients that are statistically significant at the 1% level. Specifically, in the static spatial Durbin model regression (Model 1), investment in education demonstrates a dampening effect on CO2 emissions in both the main effect and the spatial spillover effect, with coefficients of −0.035 and −0.680 respectively. Similarly, in the dynamic spatial Durbin model regression (Model 2), investment in education continues to exhibit a dampening effect on CO2 emissions in both the main effect and the spatial spillover effect, with coefficients of −0.01. It is worth noting that the absolute values of the coefficients in the dynamic spatial Durbin regressions are smaller than those in the static spatial Durbin regressions for both the main effect and the spatial spillover effect. This indicates that considering only static spatial panel data may overestimate the suppressive effect of education investment on CO2 emissions. Thus, conducting dynamic spatial Durbin model regressions becomes necessary in order to obtain a more accurate understanding of the relationship. The dynamic spatial Durbin model is able to take into account both temporal and spatial dynamics, and is better able to capture the trends in the dampening effect of investment in education on carbon emissions than a static model. Dynamic models require more data and more complex calculations, so the resulting coefficients are likely to be more conservative and less suppressive. Comparing the static spatial Durbin model regression with the dynamic spatial Durbin model reveals a certain degree of consistency in the results, suggesting greater robustness. Additionally, when comparing the baseline regression results with the spatial panel regression results, it becomes evident that the variables in the baseline regression for non-spatial panel data exhibit larger effects compared to the spatial Durbin regression. This indicates that neglecting the spatial spillover effect may lead to an overestimation of the impact effect. Hence, conducting spatial model regression becomes necessary to accurately account for the spatial dynamics.
Through the above analysis, hypothesis 2 of this paper holds true, that is, investment in education in the region has a suppressive effect on carbon emissions in neighboring regions and there is a spatial spillover effect.
4.3.3 Short-term spatial Durbin model regression and long-term spatial Durbin model regression analysis
The disparity in results between the short-term and long-term spatial Durbin model regressions can be attributed to their focus on different time scales. The short-term model examines the immediate and indirect relationship between education investment and carbon emissions, while the long-term model delves into the long-term dynamics between these variables. Since the impact of education investment may require a certain time lag to become evident, it becomes challenging to capture the long-term effects of education investment on carbon emissions in the short-term model. Conversely, the long-term model provides a more comprehensive understanding of the role of education investment in environmental protection by accurately reflecting the long-term impact of education investment on carbon emissions. In addition, there may be other differences between short-term and long-term models, such as factors such as model setup, sample selection, and control variables. These factors can also affect the estimation results of the model.
Table 10 presents the results of the dynamic spatial Durbin model regressions, examining the impact of education investment on carbon emissions across different time horizons. The short-term spatial Durbin model regressions focus on the immediate relationship between the independent and dependent variables. In this analysis, SR-Direct, SR-Indirect, and SR-Total represent the short-term direct, indirect, and total effects of education investment on carbon emissions, respectively. On the other hand, the long-term spatial Durbin model regressions explore the time-lagged effects of the independent and dependent variables. Specifically, they investigate the impact of the independent variable on the dependent variable over time and vice versa. In the results of this regression, LR-Direct, LR-Indirect, and LR-Total represent the long-term direct, indirect, and total effects of education investment on carbon emissions, respectively. The key distinction between the short-term and long-term spatial Durbin model regressions lies in their focus on different time scales. The short-term model examines the immediate direct and indirect relationship between education investment and carbon emissions. In the short term, the total effect of education investment on carbon emissions is −0.218, comprising a direct effect of −0.012 and an indirect effect of −0.206. These findings suggest that education investment in the short term leads to a reduction in carbon emissions. The indirect effect may be attributed to the promotion of technological progress and economic development through increased education levels, thereby contributing to lower carbon emissions. In contrast, the long-term model explores the long-term relationship between education investment and carbon emissions. In the long term, the total effect of education investment on carbon emissions is −0.109, with a direct effect of −0.015 and an indirect effect of −0.093.

Table 10. Results of OLS panel regression and spatial regression.
Why does this phenomenon occur? The reasons can be explained from the following aspects: (1) The lag effect of education investment: Education investment usually takes a long time to take effect. From the investment of educational resources to the cultivation of talents, and then to these talents applying their learned knowledge and skills in practical work, this process may take several years or even decades. Therefore, in the short term, the direct impact of education investment on carbon emissions will be more significant, but in the long term, this impact will gradually disperse and accumulate, showing a relatively small effect. (2) The iteration of technology and industry: In the short term, technological innovation promoted through education investment can be quickly applied to areas that reduce carbon emissions, such as new energy technologies, energy-saving technologies, etc. However, over time, new technologies will continue to emerge, and old technologies may be eliminated or replaced. Therefore, the significant impact of education investment on carbon emissions in the early stages may be diluted by the development of new technologies. (3) Industrial upgrading and transformation: Education investment can promote technological upgrading in specific industries in the short term, thereby reducing carbon emissions. However, over time, the industrial structure may change, and the impact of education investment on specific industries may weaken, resulting in smaller long-term effects. Although the long-term impact of education investment on carbon emissions is smaller compared to the short term, it still demonstrates a negative effect. Overall, these findings highlight the varying effects of education investment on carbon emissions across different time horizons, providing insights into the temporal dynamics of this relationship.
In the short term, the direct effect of education investment on carbon emissions is significantly negative, with a coefficient of −0.012. However, in the long term, although the direct effect remains negative, it is not statistically significant. On the other hand, both the indirect effect and the total effect of education investment on carbon emissions are significantly negative in both the short and long term regressions. Notably, the coefficient for the short-term indirect and total effects is higher than that of the long-term effects. This suggests that the impact of education investment on carbon emissions may differ between the short and long term. In the short term, investment in education may contribute to economic development and technological progress by improving people’s skills and knowledge, thereby reducing carbon emissions. This direct effect is significant because in the short term, economic growth and technological progress respond relatively quickly, and investment in education has a relatively rapid impact on these aspects. However, in the long term, while investment in education can still have a positive impact on technological progress and economic development, this impact may be constrained by other factors, leading to a weaker impact on carbon emissions. The impact of investment in education on carbon emissions is complex and needs to be considered and analyzed from a number of perspectives. For example, while investment in education may contribute to technological progress and economic development, thereby reducing carbon emissions, it may also lead to population growth, urbanization and changes in consumption habits, among others, which may all have an impact on carbon emissions. It is also possible that the short-term aggregate effect is greater than the long-term aggregate effect due to the different time horizons in the models, leading to differences in the results. Short-term models may focus more on the direct impact of investment in education on carbon emissions, while long-term models focus more on the indirect impact of investment in education on carbon emissions.
Table 10 also reveals that the short-term effects of urban green space on carbon emissions are more pronounced compared to the long-term effects. This can be attributed to the direct reduction of carbon emissions within the city that occurs when urban green space is increased in the short term. For example, an increase in urban green space can reduce carbon emissions by absorbing greenhouse gases such as CO2 from the atmosphere. In addition, urban green spaces can also reduce temperatures and improve air quality, thus contributing to health and environmental quality within cities and further reducing carbon emissions. And in the long term, while an increase in urban green space can still reduce carbon emissions, this dampening effect may be constrained by other factors. For example, with further urbanization and industrialization, carbon emissions within cities may increase, thus offsetting the suppressive effect of urban green space. Furthermore, the impact of urban green space on carbon emissions is influenced by various factors, including urban planning, management, and maintenance. It is worth noting that the short-term effect of urban green space on carbon emissions is more significant than the long-term effect. This is likely because, in the short term, the increase in urban green space directly reduces carbon emissions within cities. However, in the long term, the suppressive effect of urban green space may be offset by the processes of urbanization and industrialization.
4.4 A north-south regional heterogeneity analysis of the impact of investment in education on carbon emissions
Table 11 reveals substantial variation in the impact of education investment on carbon emissions reduction between the southern and northern regions of the country. Specifically, in the southern region, there is a notable suppressive effect of education investment on carbon emissions, as indicated by the significant coefficients of −0.030 and −2.847 for the main effect and spatial effect, respectively. Moreover, the spatial spillover effect of education investment on carbon emissions is significantly larger than the main effect in the southern region. In contrast, neither the main effect nor the spatial spillover effect is significant in the northern region. The reasons for this may be as follows: firstly, in terms of industrial distribution and production methods, the northern region is dominated by heavy industry, including the iron and steel industry, metallurgical industry, machinery, energy, etc. Such industrial activities are the material basis for the development of the national economy, and the government’s environmental controls on their production activities are more lenient, so the local education investment will also have a lower conversion rate to green production technologies. In contrast, the southern region has a higher proportion of advanced manufacturing and service industries, which generally pay more attention to energy saving and emission reduction under stricter environmental controls, and furthermore, education investment in the southern region is more likely to promote the upgrading of relevant environmental protection technologies and the application and promotion of green energy, facilitating the implementation of energy saving and emission reduction measures. The southern region tends to use gas, while the northern region uses more biomass and coal; in terms of usage, the southern region is dominated by cooking, while the northern region is dominated by heating, and research shows that carbon emissions are highest for heating purposes. As a result, the southern region exhibits a comparatively lower carbon emission intensity, highlighting the pronounced suppressive effect of education investment on carbon emissions. Additionally, the southern region generally boasts a higher level of economic development compared to the northern region. This translates to a greater abundance of educational resources and a higher level of talent training in the southern region. The presence of high-quality talent can optimize the industrial structure by enhancing the region’s total factor productivity, thereby promoting sustainable economic growth. Finally, the closeness of external relations between the north and the south will also have a significant impact on emissions reduction. This means that more enterprises can engage in more technology-intensive and profitable industries through factor comparisons, shifting energy-intensive and inefficient industries out of the region. Thus, in line with the need for industrial upgrading, investment in education is more likely to promote technological innovation in environmental protection in the South, and therefore has a more significant impact on emissions reduction. In contrast, foreign trade in the North is more dependent on the processing of primary products and the extraction of raw materials, and investment in education is less likely to have a significant impact on local emissions reductions.
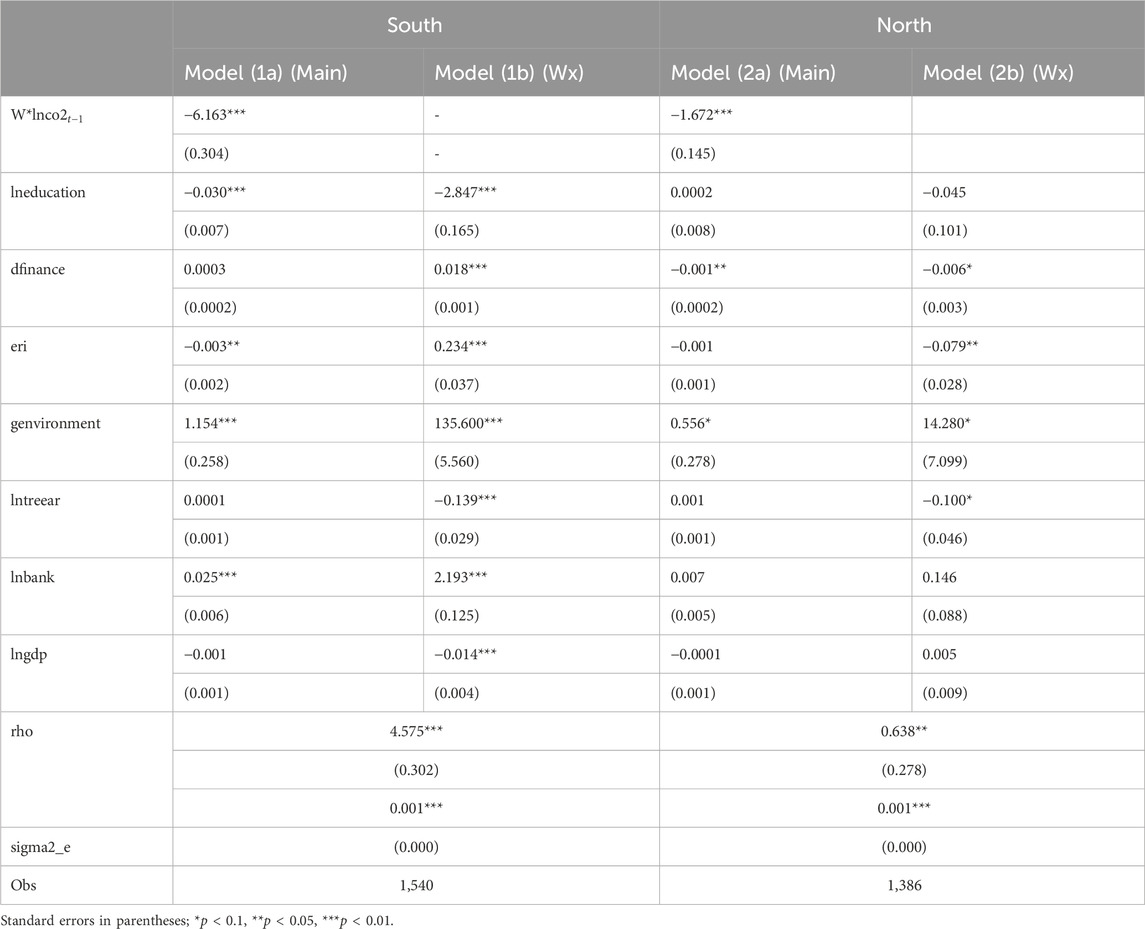
Table 11. Analysis of north-south differences in the dynamic spatial Durbin effect.
Through the above analysis, hypothesis 3 of this paper is tested, namely, that there is a significant North-South difference in the impact of investment in education on carbon emissions.
4.5 Mediating effect analysis of the impact of investment in education on carbon emissions
This study used the mediation effect model to examine the mediating role of industrial structure and energy structure in the relationship between education investment and carbon emissions. However, the mediation effect regression may suffer from the problem of omitted variables, which could lead to an insufficiently robust model construction. Therefore, this study conducted the Sobel test to validate the results. As shown in Table 12, the Sobel test results for both industrial structure and energy structure were significant at the 10% level, indicating that the mediation mechanism tested in this study is scientifically and robustly valid. Hence, the mediation effect model can be used for regression analysis.

Table 12. Mediating effect mechanism test results.
The transmission mechanism of the impact of education investment on carbon emissions was theoretically analyzed from the perspectives of industrial structure and energy structure in the previous sections. To verify this mechanism, this study uses mediation effect regression with industrial structure (Model 1) and energy structure (Model 2) as the mediating variables. The regression results are shown in Table 13.
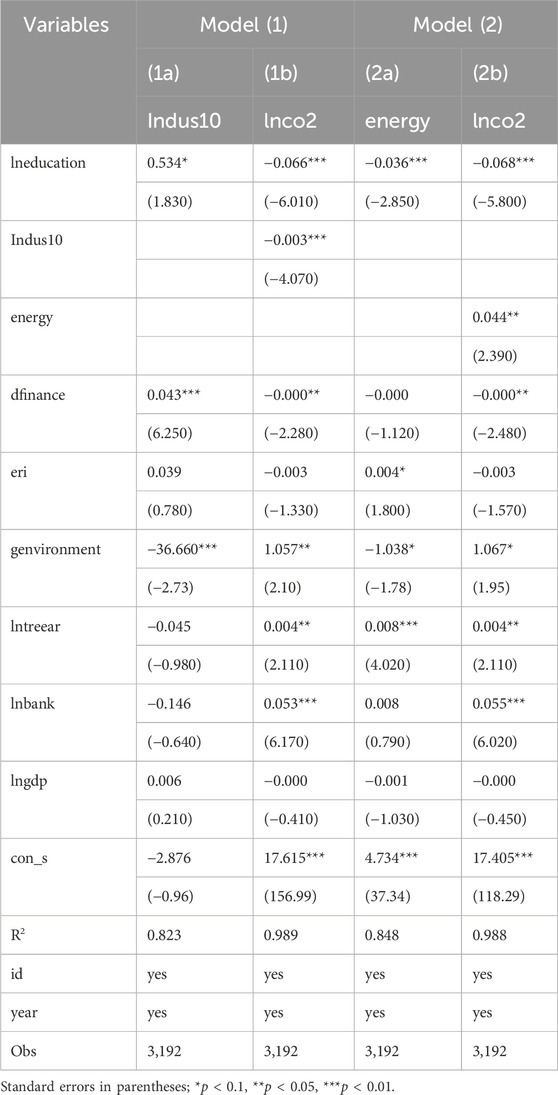
Table 13. Test results of the mechanism of investment in education affecting carbon emissions.
Firstly, as shown in regression result (1a), the coefficient of the influence of education investment on industrial structure is 0.534, significant at the 10% level. This indicates that education investment can promote the development of the tertiary industry in the industrial structure. Furthermore, according to regression result (1b), the transition of industrial structure towards the tertiary industry can reduce carbon dioxide emissions, with a coefficient of −0.003, significant at the 1% level. This is because education investment can cultivate more professionals who are knowledgeable about environmental protection and carbon reduction policies. These professionals can participate in the formulation and implementation of relevant policies, thus promoting industrial structural upgrading and carbon reduction goals.
Secondly, as shown in regression result (2a), the coefficient of the influence of education investment on energy structure is −0.036, significant at the 1% level. This indicates that education investment can promote the transition from traditional energy to new clean energy in the energy structure. Furthermore, according to regression result (2b), there is a positive correlation between the proportion of traditional energy and carbon dioxide emissions, with a coefficient of 0.044, significant at the 5% level. This means that the lower the proportion of traditional energy, the lower the carbon dioxide emissions. This is because education investment can enhance people’s understanding of energy structure and promote the importance of renewable and clean energy. Through education, people can better understand the advantages and feasibility of clean energy, thereby promoting energy structural upgrading and transformation, reducing the proportion of traditional energy, and lowering carbon emissions.
In conclusion, this study validates Hypothesis 4 that education investment can suppress carbon emissions by promoting industrial structural upgrading and reducing the proportion of traditional energy.
4.6 Robustness tests
4.6.1 Robustness and endogeneity test of benchmark regression
To address the endogeneity issue in the benchmark regression, this study employs Generalized Method of Moments (GMM) estimation. The GMM results, as presented in Table 14 (1), demonstrate a significant inhibitory effect of education investment on carbon dioxide emissions at a 1% significance level, which aligns with the findings of the benchmark regression. Moreover, control variables are introduced to assess the robustness of the benchmark regression, as depicted in Table 14 (2). Even after incorporating the number of green patents as a control variable in the regression model, education investment continues to exhibit a significant inhibitory effect on carbon dioxide emissions at a 1% significance level, reinforcing the robustness of the benchmark regression results. Thus, these two approaches provide compelling evidence for the reliability and robustness of the benchmark regression results in this study.
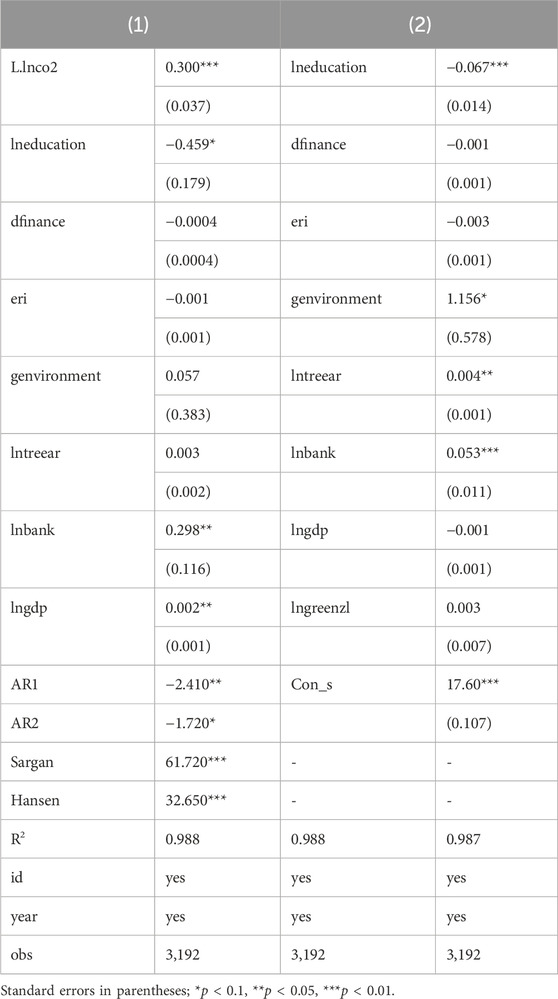
Table 14. Endogenous test and robustness test.
In addition, in order to further validate the robustness of the regression results, this study selects education-related variables as alternative explanatory variables to replace the main explanatory variable for robustness testing. As shown in Table 15, this study selects the number of education practitioners, the number of regular higher education institutions, and the volume of library collections as substitute variables for education investment to conduct regression analysis. The regression results demonstrate that these three variables have a significant inhibitory effect on carbon emissions, which is generally consistent with the main regression results, further confirming the scientific and robust nature of the empirical findings.
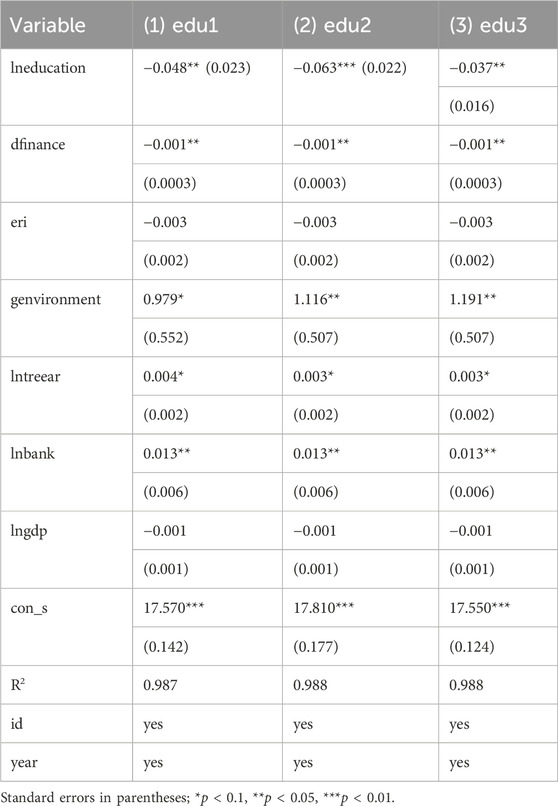
Table 15. Robustness test for replacing main regression variables.
4.6.2 Robustness test of spatial Durbin model regression
To examine the robustness of the spatial Durbin model, this study employs a 0–1 spatial weight matrix as a replacement for the geographical weight matrix in the regression analysis. The regression results, presented in Table 16, reveal that education investment exhibits a significant inhibitory effect on carbon dioxide emissions at a 1% significance level in both the long-term and short-term effects. These findings align closely with the results obtained using the geographical weight matrix in the previous analysis. Thus, the regression results of the dynamic spatial Durbin model constructed in this study are deemed robust and reliable.
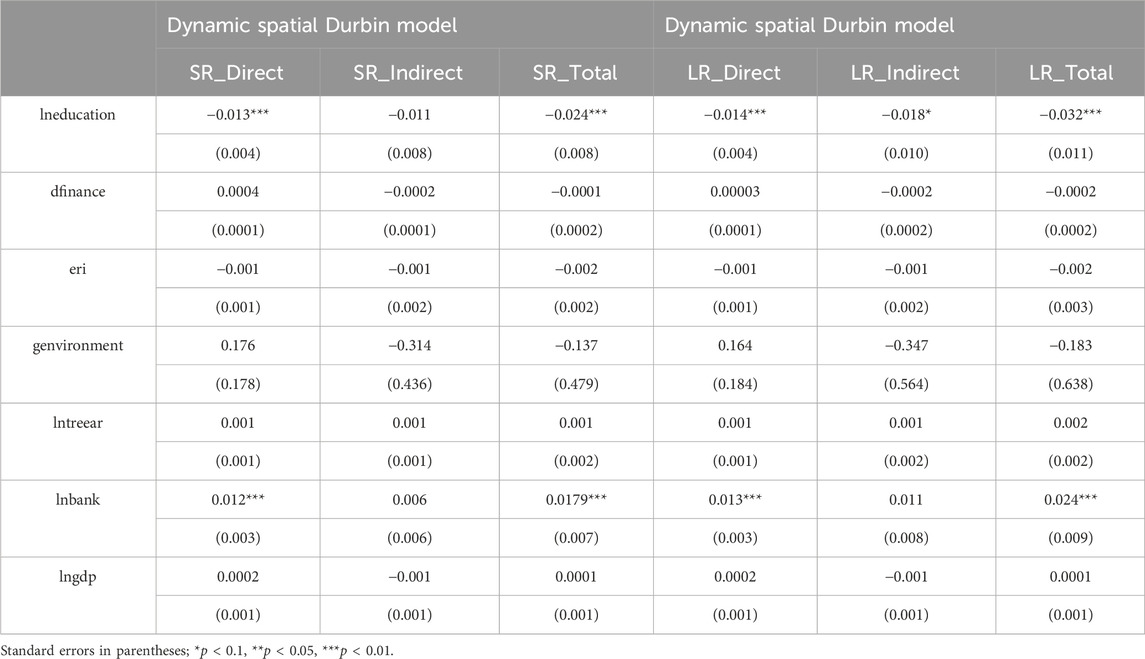
Table 16. Dynamic spatial Durbin model regression of 0–1 spatial weight matrix.
5 Conclusion and policy implication
Based on panel data from 266 cities in China from 2009 to 2020, this study utilizes theories from the classical school of economics and Marxist political economy to investigate the impact of education investment on carbon emissions. The results show that education investment has a significant suppressive effect on carbon emissions and exhibits negative spatial spillover effects. In other words, implementing education investment in one city can have a positive impact on neighboring cities, thus achieving environmental protection to some extent. Furthermore, the study finds apparent regional heterogeneity in the relationship between education investment and carbon emissions, with education investment in southern cities having a more significant effect in suppressing carbon emissions. This phenomenon may be closely related to factors such as industrial structure and climate in southern cities. The findings of this study have important academic implications for deepening our understanding of the relationship between education investment and carbon emissions. They also provide valuable references for policymakers to promote sustainable development and environmental protection. Additionally, this study conducts an analysis of the mechanism of how education investment affects carbon emissions by considering energy structure and industrial structure as mediating variables. It concludes that education investment can suppress carbon emissions by influencing changes in energy structure and industrial structure.
According to the conclusions of this study, the following policy suggestions are proposed.
(1) Increase investment in education, promote environmental awareness and technological development
The research results indicate that education investment has a significant inhibitory effect on carbon emissions and has a positive impact on neighboring cities. Therefore, it is recommended that the government further increase investment in education, especially in environmental education, to cultivate public awareness and skills in environmental protection. This not only helps to reduce carbon emissions, but also affects neighboring areas through knowledge diffusion and technology transfer, forming regional environmental synergies.
(2) Promote the integration of education and green industries
Education investment has a more significant effect on suppressing carbon emissions in southern cities, which may be related to the local industrial structure and climate conditions. It is recommended that policymakers combine education investment with green industries to promote the research and application of green technologies. For example, green technology courses can be added to higher education and vocational education to promote talent cultivation in green industries, thereby promoting the transformation and upgrading of industrial structure and reducing carbon emissions.
(3) Adopt policy measures for regional differentiation
Research has found that there is regional heterogeneity in the relationship between education investment and carbon emissions, with the effect being more significant in southern cities. Therefore, it is recommended that the government consider the specific situation of different regions and adopt differentiated policy measures when formulating environmental protection policies. For example, in southern cities, the integration of education and green industries can be emphasized, while in northern cities, more targeted policies can be formulated based on local conditions.
(4) Strengthen cross regional cooperation and coordination
Due to the negative spatial spillover effects of education investment, one city’s education investment can have a positive impact on neighboring cities. It is recommended to strengthen cooperation and coordination between regions, especially in education and environmental protection. Regional education cooperation mechanisms can be established to share educational resources and technological achievements, promoting collaborative development within the region.
(5) Promote the adjustment of energy structure and industrial structure
Research has shown that education investment can suppress carbon emissions by influencing energy and industrial structures. It is recommended that policymakers promote the adjustment of energy and industrial structures while increasing investment in education. For example, encouraging and supporting the research and application of clean energy, reducing dependence on traditional fossil fuels; Promote the transformation and upgrading of high polluting industries, develop green and low-carbon industries, and fundamentally reduce carbon emissions.
This article has the following limitations: (1) Education investment can only objectively reflect the quantity of investment in education, but it cannot reflect the quality of education. However, the quality of education is also an important factor affecting carbon emissions, which requires further research at a deeper level. (2) The heterogeneity study only roughly divided China into north and south regions, but China has a vast territory and complex economic structure. It is insufficient to analyze only the north-south regions, and more detailed division research is needed.
Future research can focus on the following aspects: (1) Consider the correlation between education quality and carbon emissions. The impact of education investment on carbon emissions may be closely related to the quality of education. Future research can further explore the relationship between education quality and carbon emissions to understand whether the impact of education investment on carbon emissions is moderated by education quality. (2) Consider regional differences and policy promotion. Due to the significant regional differences in China, future research can divide China into multiple regions for study, and more carefully consider the heterogeneity of the relationship between education investment and carbon emissions in different regions. At the same time, it is also important to explore how to translate research results into practical policies to promote the impact of education investment on carbon emissions in a wider range.
Data availability statement
The original contributions presented in the study are included in the article/supplementary material, further inquiries can be directed to the corresponding authors.
Author contributions
YD: Investigation, Writing–original draft. JG: Software, Writing–review and editing. JQ: Software, Writing–review and editing. YC: Conceptualization, Project administration, Supervision, Writing–review and editing. MG: Data curation, Writing–review and editing.
Funding
The author(s) declare that no financial support was received for the research, authorship, and/or publication of this article.
Conflict of interest
The authors declare that the research was conducted in the absence of any commercial or financial relationships that could be construed as a potential conflict of interest.
Publisher’s note
All claims expressed in this article are solely those of the authors and do not necessarily represent those of their affiliated organizations, or those of the publisher, the editors and the reviewers. Any product that may be evaluated in this article, or claim that may be made by its manufacturer, is not guaranteed or endorsed by the publisher.
Footnotes
1This data belongs to paid data and can be sought from the author if needed.
2The processed empirical data can be provided by the author.
References
Alami, I., Alves, C., Bonizzi, B., Kaltenbrunner, A., Koddenbrock, K., Kvangraven, I., et al. (2022). International financial subordination: a critical research agenda. Rev. Int. Political Econ. 30, 1360–1386. doi:10.1080/09692290.2022.2098359
Alkhateeb, T. T. Y., Mahmood, H., Altamimi, N. N., and Furqan, M. (2020). Role of education and economic growth on the CO2 emissions in Saudi Arabia. Entrepreneursh. Sustain. Issues 8 (2), 195–209. doi:10.9770/jesi.2020.8.2(12)
Baharin, R., Syah Aji, R. H., Yussof, I., and Mohd Saukani, N. (2020). Impact of human resource investment on labor productivity in Indonesia. Iran. J. Manag. Stud. 13 (1), 139–164. doi:10.22059/IJMS.2019.280284.673616
Bartik, T. J. (2020). Using place-based jobs policies to help distressed communities. J. Econ. Perspect. 34 (3), 99–127. doi:10.1257/jep.34.3.99
China National Intellectual Property Administration (2020). Number of green-patents, China, from 2009 to 2020. Available at: https://www.cnipa.gov.cn/col/col61/index.html.
Cui, Y., Aziz, G., Sarwar, S., Waheed, R., Mighri, Z., and Shahzad, U. (2023). Reinvestigate the significance of STRIPAT and extended STRIPAT: an inclusion of renewable energy and trade for gulf council countries. Energy & Environ., 0958305X231181671. doi:10.1177/0958305x231181671
Cui, Y., Zhong, C., Cao, J., and Guo, M. (2023). Can green finance effectively mitigate PM2. 5 pollution? What role will green technological innovation play? Energy & Environ., 0958305X231204030. doi:10.1177/0958305x231204030
Cui, Y., Zhong, C., Cao, J., Guo, M., and Zhang, M. (2024). Spatial effect of carbon neutrality target on high-quality economic development—channel analysis based on total factor productivity. Plos one 19 (1), e0295426. doi:10.1371/journal.pone.0295426
Cui, Y. N., Wang, G. Y., Irfan, M., Wu, D. S., and Cao, J. H. (2022). The effect of green finance and unemployment rate on carbon emissions in China. Front. Environ. Sci. 10, 887341. doi:10.3389/fenvs.2022.887341
Digital Finance Research Center of Peking University (2020). Digital financial inclusion index, China, 2009-2020. Research Group of Digital Finance Research Center at Peking University. Available at: https://idf.pku.edu.cn/docs/20210421101507614920.pdf.
Dilbaz, E., and Erkılıç, T. A. (2021). The views and the effects of materialist philosophy and socialist ideology on curriculums and educational administration. Educ. Q. Rev. 4 (2). doi:10.31014/aior.1993.04.02.300
Ekici, F., Orhan, G., Gümüş, Ö., and Bahce, A. B. (2022). A policy on the externality problem and solution suggestions in air transportation: the environment and sustainability. Energy 258, 124827. doi:10.1016/j.energy.2022.124827
Fang, G., Chen, G., Yang, K., Yin, W., and Tian, L. (2024). How does green fiscal expenditure promote green total factor energy efficiency? evidence from Chinese 254 cities. Appl. Energy 353, 122098. doi:10.1016/j.apenergy.2023.122098
Fang, G., Gao, Z., Wang, L., and Tian, L. (2022). How does green innovation drive urban carbon emission efficiency? evidence from the Yangtze River Economic Belt. J. Clean. Prod. 375, 134196. doi:10.1016/j.jclepro.2022.134196
Fang, G., Yang, K., Tian, L., and Ma, Y. (2022). Can environmental tax promote renewable energy consumption? an empirical study from the typical countries along the Belt and Road. Energy 260, 125193. doi:10.1016/j.energy.2022.125193
Feng, Y., Gao, Y., Hu, S., Sun, M., and Zhang, C. (2024a). How does digitalization affect the green transformation of enterprises registered in China's resource-based cities? Further analysis on the mechanism and heterogeneity. J. Environ. Manag. 365, 121560. doi:10.1016/j.jenvman.2024.121560
Feng, Y., Gao, Y., Meng, X., Shi, J., Shi, K., Hu, S., et al. (2023). The impacts of casual environmental regulation on carbon intensity in China: dual mediating pathways of energy low-carbon reconstitution and industrial structure upgrading. Environ. Res. 238, 117289. doi:10.1016/j.envres.2023.117289
Feng, Y., Liu, G., Meng, X., Jiang, K., Huang, R., Zhang, C., et al. (2024b). How does digital government affect carbon intensity at the global level? New perspective of resource allocation optimization. Resour. Policy 94, 105108. doi:10.1016/j.resourpol.2024.105108
Feng, Y., Sun, M., Pan, Y., and Zhang, C. (2024). Fostering inclusive green growth in China: identifying the impact of the regional integration strategy of Yangtze River Economic Belt. J. Environ. Manag. 358, 120952. doi:10.1016/j.jenvman.2024.120952
Feng, Y., Zhang, J., Geng, Y., Jin, S., Zhu, Z., and Liang, Z. (2023). Explaining and modeling the reduction effect of low-carbon energy transition on energy intensity: empirical evidence from global data. Energy 281, 128276. doi:10.1016/j.energy.2023.128276
Grosfoguel, R. (2011). Decolonizing post-colonial studies and paradigms of political-economy: transmodernity, decolonial thinking, and global coloniality. Transmodernity J. Peripher. Cult. Prod. luso-hispanic world 1 (1). doi:10.5070/t411000004
Guo, M., and Cui, Y. (2024). Research on the impact path of China’s environmental protection investment on green development—based on the perspective of industrial structure upgrading. Front. Environ. Sci. 11, 1328231. doi:10.3389/fenvs.2023.1328231
He, Y., Wang, H., Chen, R., Hou, S., and Xu, D. (2022). The forms, channels and conditions of regional agricultural carbon emission reduction interaction: a provincial perspective in China. Int. J. Environ. Res. Public Health 19 (17), 10905. doi:10.3390/ijerph191710905
Hepburn, C., Qi, Y., Stern, N., Ward, B., Xie, C., and Zenghelis, D. (2021). Towards carbon neutrality and China's 14th Five-Year Plan: clean energy transition, sustainable urban development, and investment priorities. Environ. Sci. Ecotechnology 8, 100130. doi:10.1016/j.ese.2021.100130
Indrawati, S. M., and Kuncoro, A. (2021). Improving competitiveness through vocational and higher education: Indonesia’s vision for human capital development in 2019–2024. Bull. Indonesian Econ. Stud. 57 (1), 29–59. doi:10.1080/00074918.2021.1909692
Infante, D., Smirnova, J., and Tagliafierro, G. (2019). Education, environmental awareness and carbon dioxide emissions: evidence from European countries. Energy Policy 128, 853–863. doi:10.1016/j.enpol.2019.02.052
Kong, F., and Wang, Y. (2022). How to understand carbon neutrality in the context of climate change? With special reference to China. Sustain. Environ. 8 (1), 2062824. doi:10.1080/27658511.2022.2062824
Li, Y., Cai, Y., and Hu, X. (2019). Impact of education on carbon emissions in China: a dynamic panel data analysis. J. Clean. Prod. 229, 1099–1109. doi:10.1016/j.jclepro.2019.05.186
Li, Z., Shao, S., Shi, X., Sun, Y., and Zhang, X. (2019). Structural transformation of manufacturing, natural resource dependence, and carbon emissions reduction: evidence of a threshold effect from China. J. Clean. Prod. 206, 920–927. doi:10.1016/j.jclepro.2018.09.241
Lin, B., and Wang, C. (2023). Does industrial relocation affect regional carbon intensity? Evidence from China's secondary industry. Energy Policy 173, 113339. doi:10.1016/j.enpol.2022.113339
Lin, X., Zhao, Y., Ahmad, M., Ahmed, Z., Rjoub, H., and Adebayo, T. S. (2021). Linking innovative human capital, economic growth, and CO2 emissions: an empirical study based on Chinese provincial panel data. Int. J. Environ. Res. public health 18 (16), 8503. doi:10.3390/ijerph18168503
Ling, S., Jin, S., Wang, H., Zhang, Z., and Feng, Y. (2024). Transportation infrastructure upgrading and green development efficiency: empirical analysis with double machine learning method. J. Environ. Manag. 358, 120922. doi:10.1016/j.jenvman.2024.120922
Liu, N., Hong, C., and Sohail, M. T. (2022). Does financial inclusion and education limit CO2 emissions in China? A new perspective. Environ. Sci. Pollut. Res. 1–8. doi:10.1007/s11356-021-17032-1
Ma, G., and Cui, Y. (2024). An analysis of the sustainability issues of US treasury bonds—a study based on the vector error correction model and trend forecasting. J. Knowl. Econ., 1–26. doi:10.1007/s13132-024-01960-7
Madani, R. A. (2019). Analysis of educational quality, a goal of education for all policy. High. Educ. Stud. 9 (1), 100–109. doi:10.5539/hes.v9n1p100
Maranzano, P., Cerdeira Bento, J. P., and Manera, M. (2022). The role of education and income inequality on environmental quality: a panel data analysis of the EKC hypothesis on OECD countries. Sustainability 14 (3), 1622. doi:10.3390/su14031622
Niu, S., Zhang, K., Zhang, J., and Feng, Y. (2024). How does industrial upgrading affect urban ecological efficiency? new evidence from China. Emerg. Mark. Finance Trade 60 (5), 899–920. doi:10.1080/1540496x.2023.2260544
PIPIXiA database (2020). Local government attention to the ecological environment. China, 2009–2020. Available at: http://www.ppmandata.cn/trade/detail?id=1792.
Public Environment Research Center (2020). China's carbon dioxide emissions, China, from 2009 to 2020. Available at: https://www.ipe.org.cn/AirMap_fxy/AirMap.html?q=1.
Raihan, A., Rashid, M., Voumik, L. C., Akter, S., and Esquivias, M. A. (2023). The dynamic impacts of economic growth, financial globalization, fossil fuel, renewable energy, and urbanization on load capacity factor in Mexico. Sustainability 15 (18), 13462. doi:10.3390/su151813462
Razzaq, A., Cui, Y., Irfan, M., Maneengam, A., and Acevedo-Duque, Á. (2023). Asymmetric effects of fine particulate matter and stringency policy on COVID-19 intensity. Int. J. Environ. Health Res. 33 (9), 837–849. doi:10.1080/09603123.2022.2059452
Razzaq, A., Sharif, A., Najmi, A., Tseng, M. L., and Lim, M. K. (2021). Dynamic and causality interrelationships from municipal solid waste recycling to economic growth, carbon emissions and energy efficiency using a novel bootstrapping autoregressive distributed lag. Resour. Conservation Recycl. 166, 105372. doi:10.1016/j.resconrec.2020.105372
Reick, A. (2020). Reducing the carbon footprint-one step at a time: bottom-up steering towards more sustainable behavior: a case study of the app Deedster.
Shaikh, Z. A. (2017). Towards sustainable development: a review of green technologies. Trends Renew. Energy 4 (1), 1–14. doi:10.17737/tre.2018.4.1.0044
Shen, Q., Pan, Y., and Feng, Y. (2023). Identifying and assessing the multiple effects of informal environmental regulation on carbon emissions in China. Environ. Res. 237, 116931. doi:10.1016/j.envres.2023.116931
Shen, Q., Pan, Y., and Feng, Y. (2023). The impacts of industrial collaborative agglomeration on industrial sulfur dioxide emissions in China: from the novel perspective of spatiotemporal matrix. Environ. Sci. Pollut. Res., 1–19. doi:10.1007/s11356-023-28705-4
Shen, Q., Pan, Y., Wu, R., and Feng, Y. (2023). Peer effects of environmental regulation on sulfur dioxide emission intensity: empirical evidence from China. Energy & Environ., 0958305X231201232. doi:10.1177/0958305x231201232
Shen, Q., Wu, R., Pan, Y., and Feng, Y. (2024). Explaining and modeling the impacts of inclusive finance on CO2 emissions in China integrated the intermediary role of energy poverty. Humanit. Soc. Sci. Commun. 11 (1), 82–19. doi:10.1057/s41599-023-02595-w
Silva, D. C., Noriller, R. M., Arakaki, K. K., and da Silva, J. P. (2022). Determinants of CO2 emission in mercosur: the rule of investment in education. Rev. Bras. Gestão Desenvolv. Reg. 18 (1). doi:10.54399/rbgdr.v18i1.5391
Tang, C. F., Abosedra, S., and Naghavi, N. (2021). Does the quality of institutions and education strengthen the quality of the environment? Evidence from a global perspective. Energy 218, 119303. doi:10.1016/j.energy.2020.119303
Wang, J., Wang, G., Cui, Y., and Zhang, J. (2022). How does imported pork regulate the supply and demand of China's pig market during the epidemic? based on the analysis of African swine fever and COVID-19. Front. Veterinary Sci. 9, 1028460. doi:10.3389/fvets.2022.1028460
Wang, X., Lin, Y., and Shi, Y. (2021). Linking industrial agglomeration and manufacturers inventory performance: the moderating role of firm size and enterprise status in the supply chain. J. Manuf. Technol. Manag. 32 (2), 448–484. doi:10.1108/jmtm-11-2019-0417
Xu, P., and Luo, F. (2020). Investing a better future: education for sustainable development as a means to strengthen the environmental education. IOP Conf. Ser. Earth Environ. Sci. 576 (1), 012011. doi:10.1088/1755-1315/576/1/012011
Xu, P., Zhang, J., and Mehmood, U. (2023). How do green Investments, foreign direct investment, and renewable energy impact CO2 emissions? Measuring the role of education in E-7 nations. Sustainability 15 (19), 14052. doi:10.3390/su151914052
Yang, H., Li, X., Ma, L., and Li, Z. (2021). Using system dynamics to analyse key factors influencing China's energy-related CO2 emissions and emission reduction scenarios. J. Clean. Prod. 320, 128811. doi:10.1016/j.jclepro.2021.128811
Zhang, X., and Wang, Y. (2019). The impact of education on carbon emissions in China's northern region: empirical analysis based on the spatial panel model. J. Clean. Prod. 228, 710–717. doi:10.1016/j.jclepro.2019.04.124
Zhang, Y., and Liu, Y. (2021). The impact of education on carbon emissions in China: the mediating role of technological innovation. J. Clean. Prod. 279, 123701. doi:10.1016/j.jclepro.2020.123701
Zhang, Z. H., Ling, D., Yang, Q. X., Feng, Y. C., and Xiu, J. (2023). Central environmental protection inspection and carbon emission reduction: a tripartite evolutionary game model from the perspective of carbon neutrality. Petroleum Sci. 21, 2139–2153. doi:10.1016/j.petsci.2023.11.014
Zhou, X. (2021). Ecological civilization in China: challenges and strategies. Capital. Nat. Social. 32 (3), 84–99. doi:10.1080/10455752.2020.1802497
Keywords: carbon emissions, education investment, dynamic spatial Durbin model, regional, industrial structure
Citation: Dong Y, Gao J, Qiu J, Cui Y and Guo M (2024) The dynamic spatial effects of education investment on carbon emissions: heterogeneous analysis based on north-south differences in China. Front. Environ. Sci. 12:1432457. doi: 10.3389/fenvs.2024.1432457
Received: 14 May 2024; Accepted: 22 July 2024;
Published: 14 August 2024.
Edited by:
Shigeyuki Hamori, Yamato University, JapanReviewed by:
Kashif Iqbal, Shanghai Dianji University, ChinaYanchao Feng, Zhengzhou University, China
Guochang Fang, Nanjing University of Finance and Economics, China
Copyright © 2024 Dong, Gao, Qiu, Cui and Guo. This is an open-access article distributed under the terms of the Creative Commons Attribution License (CC BY). The use, distribution or reproduction in other forums is permitted, provided the original author(s) and the copyright owner(s) are credited and that the original publication in this journal is cited, in accordance with accepted academic practice. No use, distribution or reproduction is permitted which does not comply with these terms.
*Correspondence: Jialin Gao, Z2psMTE0ODE4MDc4OEAxNjMuY29t; Yiniu Cui, bjE1MjM0Njk4NzMxQDE2My5jb20=; Mengyao Guo, MTU5Njk0MjM1OTFAMTYzLmNvbQ==