 Yinghong Jiang1,2
 Duanqiang Zhai
- 1Shanghai Urban Construction Design and Research Institute (Group) Co., Ltd., Shanghai, China
- 2ZJU-STEC Urban Development and Planning Innovation Joint Research Center, Zhejiang University, Hangzhou, China
- 3College of Architecture and Urban Planning, Tongji University, Shanghai, China
- 4China Eco-city Academy Co., Ltd., Tianjin, China
Habitat quality (HQ) serves as a pivotal metric for assessing biodiversity and ecosystem health, with alterations in land use driven by human activities posing direct implications on HQ and ecological sustainability within river basins. Prior research on HQ has predominantly centered on historical land use changes, neglecting the comprehensive consideration of future land use transformations and ecological zoning strategies’ influence on HQ. Consequently, this investigation simulates potential land use shifts in the Min River Basin across various future scenarios, leveraging the integration of PLUS and InVEST models, quantitatively dissects HQ’s responsiveness to these changes and delves into the spatial differentiation dynamics underlying these responses, while also exploring the drivers behind such differentiation. Synergizing with the Human Footprint Index (HFI), the study devises a rational ecological zoning plan tailored to the region and outlines targeted control measures for each zone. The results of the study showed that: 1) the east-central part of the Min River Basin was subject to a greater degree of human interference, and the trend of interconversion between grassland, forest land, and cropland was relatively significant, with construction land mainly originating from the transfer of cropland; 2) from 2000 to 2020, average HQ scores for priority protected zones, priority recovery zones, and appropriate development zones stood at 0.9372, 0.2697, and 0.6098, respectively, accompanied by a rise in the proportion of low and moderate HQ areas to 15% and 17%; (3) DEM and Slope were the main drivers affecting HQ, and their explanatory power reached 0.519 and 0.426, respectively; (4) in comparison to a natural development scenario (ND), the planning protection scenario (PP) offers greater promise for ecological preservation and sustainable development within the Min River Basin. The research results can provide technical support for the ecological restoration of land resources and the development and protection of national land space in watershed areas.
1 Introduction
Habitat quality (HQ) refers to the ability of ecosystems to provide suitable conditions for the development and growth of species following the availability of natural resources. It is of great significance in maintaining the security of ecosystems and enhancing human welfare (Alaniz et al., 2021; Sun et al., 2019a). In recent years, with rapid population growth and rapid economic development, the demand for land resources has gradually increased, and many natural resources have been exploited and utilized; natural resources are being destroyed at an unprecedented rate and have led to the endangerment of millions of species (Ellis et al., 2019; Hou et al., 2022; Rands et al., 2010; Wang and Cheng, 2022). Changes in land use types can affect the flow of materials and information in ecosystems, which in turn affects the level of regional HQ and further leads to changes in the ecological security pattern of watersheds. In this context, the characteristics of HQ response to land use change and its evolution mechanism have gradually become a hotspot in related research fields (Bai et al., 2019; Sun et al., 2019b).
The pursuit of HQ research was initiated in the 1960s, with a primary research approach centered on acquiring regional HQ parameters for plants and animals through rigorous field surveys and constructing an indicator evaluation system to comprehensively assess the habitats of species such as oriental white stork, red-crowned crane, and snub-nosed monkey (Liu et al., 2006; Wang et al., 2010; Li et al., 2016). Nevertheless, this methodology entails substantial human resources and efforts in gathering biodiversity data, rendering it operationally challenging and often impeding the comparability and dissemination of assessment outcomes. At the dawn of the twenty-first century, the advancement of remote sensing technology has significantly transformed the landscape of HQ assessment. The utilization of ecological assessment models for HQ evaluation has gained widespread acceptance across diverse regional scales (Berta Aneseyee et al., 2020; Li et al., 2021; Zhang et al., 2022). Prominent among these models are the HIS model, SoLVES model, and InVEST model. Notably, the InVEST model has garnered considerable attention from researchers due to its broad applicability, streamlined data acquisition process, and exceptional spatial representation capabilities. For example, Wang et al. (2022) investigated how land type in the Altay area affected headquarters using the InVEST model and concluded that the increase in the area of cultivated land and build-up land would lead to a decrease in HQ, while woodland and grassland could play a role in improving HQ. Peng et al. (2023) examined how HQ changes over time and space in the Three Gorges reservoir area. They found that as human activities become more intense in the area, the degradation of HQ becomes more pronounced. Similarly, Xiao et al. (2022) examined the effects of topographic gradient on HQ in Hubei Province using GIS and InVEST models. They discovered that on average, HQ increases as the topographic grade increases.
The changes in land use have a direct influence on HQ, subsequently influencing levels of biodiversity. Therefore, land use change is an important factor that cannot be ignored in the dynamic process of evaluating HQ (Wohlfart et al., 2017; Yin et al., 2020). At present, the models commonly used in studies on land use change mainly include the CA-Markov model, CLUE-S model, FLUS model, etc. However, the Markov Model is a simulation method applicable to the quantitative changes in land type. Still, its influence on the spatial distribution is small (Yecui et al., 2013; Zheng and Hu, 2018), whereas the CLUE-S model, although it can strengthen the spatial analysis ability, does not take into account the conversion of non-dominant land use, and is unable to portray the land use changes in various regions accurately (Mei et al., 2018), and, the FLUS model also has certain limitations. The PLUS model is a nonlinear dynamic change simulation model, which combines the advantages of transformation analysis strategy and pattern analysis strategy. Compared with the traditional model, the model has the ability to simulate the change of multiple land use types, and it can better explore the internal mechanism of land use change, avoiding the defects of the exponential growth of transformation types with the increase of the categories, and retaining the ability of the model to explore the driving mechanism of the change of land use in a certain period of time. It has been widely used by scholars in land use research (Zhang et al., 2023; Zhang et al., 2023). For example, Liang et al. (2021) analyzed the driving factors of land type change and verified the accuracy and reliability of the PLUS model using Wuhan as an example. Han et al. (2022) utilized the PLUS model to analyze the spatiotemporal evolution characteristics of ecosystem service values in Shandong Province, China, under multiple scenario modes. Wang et al. (2022) employed the PLUS model to dynamically predict changes in land usage in Bortala Mongol Autonomous Prefecture in Xinjiang, based on different climate scenarios.
Ecological zoning planning is a planning method that divides areas into different ecological regions or ecological units and formulates corresponding management strategies and measures to achieve ecological protection, sustainable resource use and sustainable environmental development. It can help governments, planners and decision makers better understand and manage ecosystems in different regions, coordinate the use of various types of resources, promote the coordination of economic development and ecological environment, protect rare species and the integrity of ecosystems, reduce environmental damage and ecological disasters, and achieve the goals of ecological civilization and sustainable development.
The Min River Basin, as an eco-barrier for the green economic growth of the Upper Yangtze River Economic Belt, exhibits rich land use types, with forests and grasslands occupying a significant proportion. These land types play a crucial role in the ecological functions and water conservation within the basin (Rashid et al., 2021). However, in recent years, the rate of land usage pattern change in the Min River basin has accelerated significantly, and the interconversion between various land types and their area changes have caused a great impact on HQ (Zhai et al., 2022). Most previous studies have focused on the assessment of HQ under historical land-use change, and have not yet comprehensively explored the impacts of land-use change, ecological zoning planning, and future land-use change on HQ. Therefore, it is necessary to study the effects of land use change and ecological zoning planning on HQ. Researching the assessment of land-use change on HQ in a changing environment can better coordinate the relationship between land use and HQ enhancement, mitigate the degradation of HQ caused by human-land conflicts, better understand and manage ecosystems in different regions, and promote sustainable regional development.
In this study, the future land changes in the Min River basin were simulated by coupling the PLUS-InVEST model, and by establishing natural development scenarios (ND) and planning protection scenarios (PP), the geographical patterns of land use change and HQ dynamics were examined to determine the effects of land use change on HQ and the related HQ reaction. In addition, the Human Footprint Index (HFI) was combined to make a reasonable ecological zoning plan for the study area and propose control measures for different zones. The results of these studies provide important theoretical support for promoting the construction of ecological civilization and the realization of sustainable development goals in the Min River basin.
2 Materials and methods
2.1 Study area
The Min River (99°38′-105°51′E, 28°16′-33°39′N) is an important branch of the Yangtze River’s upper stages, and it originates near the southern base of Minshan Mountain in Sichuan Province. The main stream has a watershed area of 135,881 km2 and a total length of around 711 km (Figure 1). There is a tiny population and a typical highland hilly environment along the Min River upstream. There is also evident vertical heterogeneity in the climate. The upstream section of the Min River, which runs north of Dujiangyan, has a typical highland mountainous climate with obvious vertical differentiation and a relatively small population. The middle and downstream sections of the Min River, which run south of Dujiangyan to Yibin City, where the Yangtze River meets, are primarily plain basins with a large area of arable land, a sub-tropical monsoon climate with a hot period, a high level of urbanization, and rapid economic development. (Chao-nan et al., 2020; Huang et al., 2016).
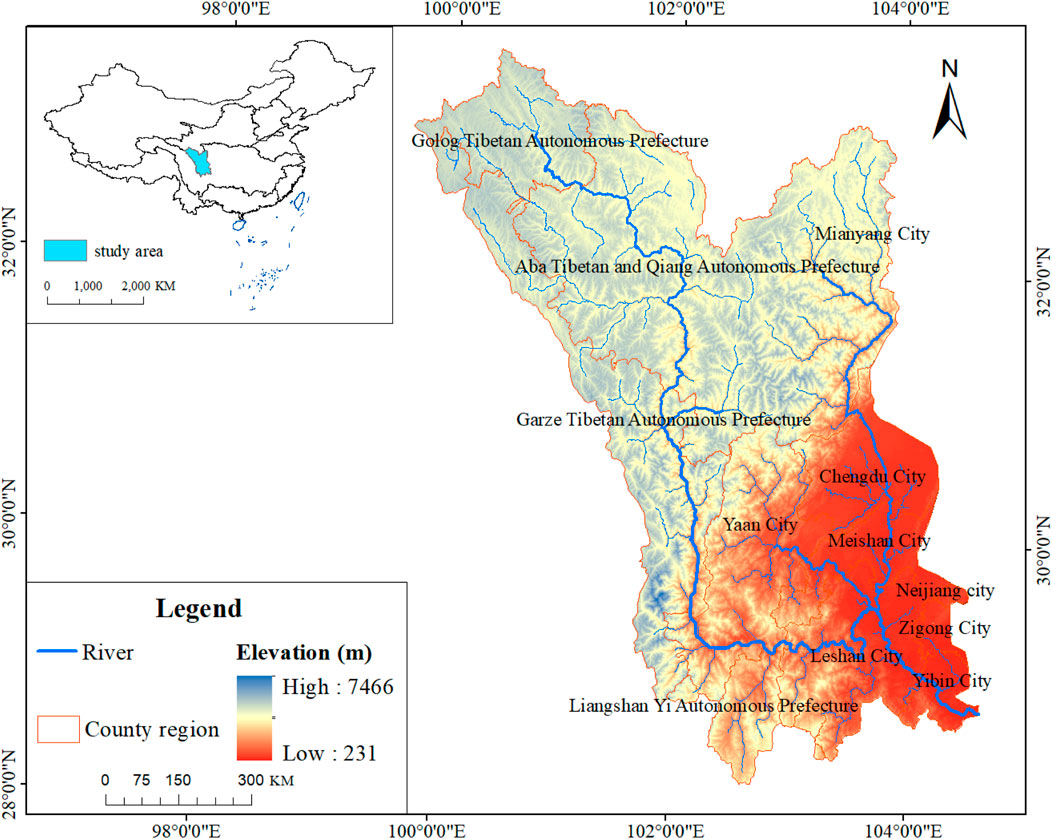
Figure 1. Overview of the min river basin.
2.2 Data Source
The land use data used in this study were obtained from the Resource and Environment Science Data Center (http://www.resdc.cn). The DEM data were obtained from the Geospatial Data Cloud (http://www.gscloud.cn) platform and the slope data were extracted on its basis. Distances from railways, highways, city centers, etc. Were calculated by using the Euclidean distance tool in ArcGIS software. Population and GDP were obtained from the Resource and Environment Science Data Centre of the Chinese Academy of Sciences (http://www.resdc.cn). The annual average temperature and rainfall data were obtained from the China Meteorological Data Network (http://data.cma.cn). Grazing data are from the Food and Agriculture Organization of the United Nations (https://data.apps.fao.org/). Night lighting data were obtained from the Earth Observation Organization (EOG) (https://eogdata.mines.edu/). All data were cropped using Min River Basin vector boundaries, uniform projection and resolution.
2.3 Research methodology
2.3.1 The InVEST model
HQ refers to the condition of various resources and conditions provided by the environment that are necessary for the survival and development of individuals or populations (Xie and Zhang, 2023). When HQ is good, resources and conditions are met and the development of biodiversity is ensured. The habitat quality module calculates a score for HQ by considering external threat factors and their intensities, as well as the sensitivity of each land use type to these threat factors, which can vary among land use types (Gong et al., 2019; Sun et al., 2019b). These assessment results can help us understand the differences in HQ in different regions or under different land use types and provide a scientific basis for ecological conservation, land planning, and sustainable development (Lei et al., 2022; Li et al., 2023). HQ is calculated by the following (Equation 1):
where Qxj denotes the HQ index of grid cell x of landscape type j; Hj denotes the habitat suitability score of landscape type j, ranging from 0 to 1; z is the scale constant, generally taken as 2.5; k is the half-saturation constant, we take 0.5; is the degree of habitat degradation, representing the level of habitat degradation of grid x in land use type j, which is calculated as follows (Equation 2):
where: r is the threat factor; R is the number of threat factors; ωr is the weight1 value of the threat factor; Yr is the number of rasters of the threat factor; ry is the coercion value of the threat factor; Sjr indicates the sensitivity of land use type j to the threat factor r, taking 0-1; irxy is the threat of raster y factor r to the disturbance level of habitat raster x, calculated as follows (Equations 3, 4):
where dxy is the linear distance between grid cells x and y, and dr max is the maximum effective distance of threat r in space.
When the model is run, not only land type data, but also threat factor data, threat source data and sensitivity of different habitat types to threats are required to be input. According to the above formula, and combining the previous related research and the practical conditions, woodland, grassland and water area were defined as habitats, and construction land, cultivated land and unused land were defined as non-habitats, and the maximum influence distance and weight of threat factors (Table 1) were set with references and relevant policies (Chu et al., 2018; Lei et al., 2022), as well as the habitat suitability of various land cover types on the threat factor sensitivity (Table 2).
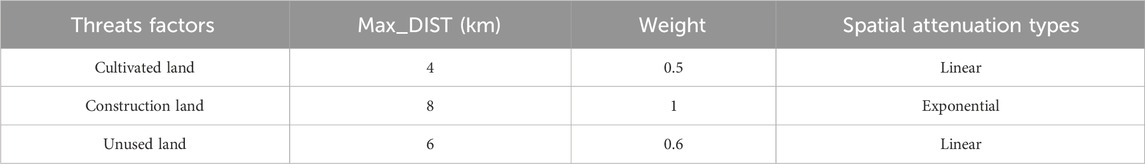
Table 1. Threats factors.
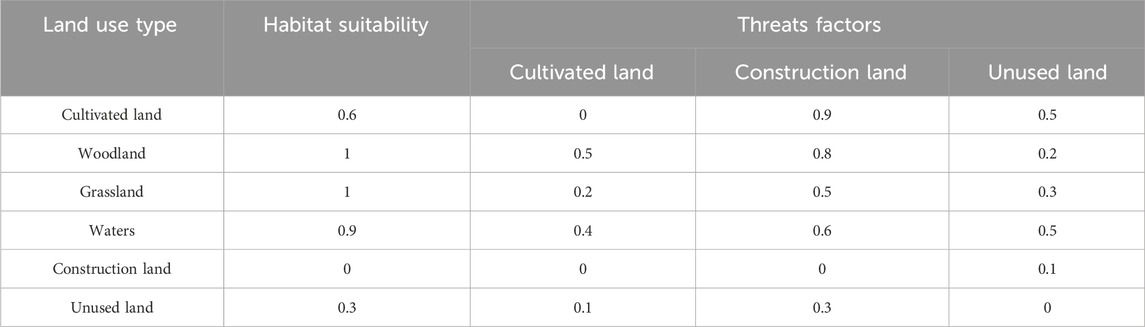
Table 2. Sensitivity parameters of habitat threat factors to different land types.
2.3.2 Geographical detector
Geographical detector is a means of revealing the internal drivers of spatial layers by detecting their heterogeneity, and it is a new technique that can reflect that the sum of the values of the internal differences of each layer is less than the total variation within the layer (Cao et al., 2023). In this study, we mainly used the two functions of factor detection and interaction detection to analyze the influence of different drivers of HQ. The influence of factor detection is expressed as q, which is calculated by the following (Equation 5):
where q represents the independent variable X’s explanatory power on the dependent variable Y; the greater the value, the greater the explanatory power, and vice versa the smaller; h is the stratification of the independent variable X or the dependent variable Y; Nh and N are the number of cells in the hth stratum and the whole region, respectively; and σh2 and Nσ2 are the variance in the hth stratum and the whole region. Table 3 lists the many kinds of interaction detection.
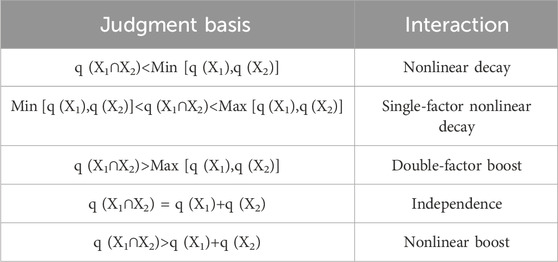
Table 3. Two-factor interaction types of geographical detectors.
In this study, based on the results of previous research, seven factors were selected from both the natural environment and socio-economic aspects to detect the influence of spatial distribution of HQ, and seven influencing factors, namely, DEM (X1), slope (X2), Temperature (X3), Precipitation (X4), GDP (X5), Population (X6), and Nighttime lighting index (X7) were used as the independent variables, which were reclassified using the natural breakpoint method for the treatment, and then geo-detectors were used to detect the possible causative relationship between the two variables (Guo et al., 2023; Cui et al., 2022).
2.3.3 The Human Footprint Index
The Human Footprint Index (HFI) is a measure of the influence of human activities over the natural environment (Sanderson et al., 2002). It is intended to assess the human influence on various aspects of the earth, including land use change, species loss, and carbon emissions. Considering the specific conditions and relevant studies of the Min River Basin, five human activity indicators were selected, including land usage, population, grazing intensity, nighttime-light index, and transportation accessibility, to calculate the HFI. These metrics can be used to gauge how much human activity has affected the Min River Basin. Specifically, higher HFI values indicate a greater degree of anthropogenic impact.
On this basis, the same age of use was maintained for all five types of data, which was 2020. And the various types of data were pre-processed, and the raster values were reassigned to a score of 1–10, with a higher score indicating a higher intensity of human influence. In this study, construction land is assigned to 10, cultivated land is assigned to 7, and the rest of land use types are assigned to 1. Since the grazing intensity dataset is only updated to 2015, trend extrapolation analysis is performed on the data based on previous studies to obtain grazing intensity data in 2020. Traffic accessibility mainly included both railroads and roads, which were assigned values based on the analysis of multiple buffers for both, respectively. Then the newly generated fractional layers of roads and railroads are mosaicked and the maximum value of the overlap is selected as the evaluation result of traffic accessibility (Liu et al., 2018; Duan and Luo, 2020). Population density, nighttime light index and processed grazing intensity data were reassigned to the data in a raster of 1–10 points using the natural breakpoint method. The processed factors were processed by overlay analysis, and the obtained HFI was classified into three levels, resulting in the HFI evaluation results of the Min River basin (Figure 2).
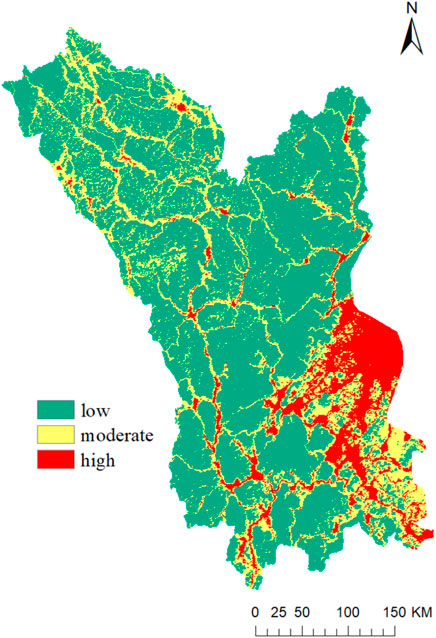
Figure 2. Min river basin HFI.
2.3.4 Spatial planning for ecological zoning
Ecological zoning is a spatial classification system that divides regions into areas with similar ecological characteristics and biodiversity. By dividing regions into different ecological partitions, we can better understand and manage biodiversity, protect ecosystem functions, and more accurately develop ecological conservation and sustainable natural resource management strategies (Jia et al., 2005; Xu et al., 2022). In this research, HQ was used to reflect the level of biodiversity. HFI was used to reflect the degree of impact of human activities on the Min River Basin. The results of HQ and HFI were classified as low (0-0.4), medium (0.4-08), and high (0.8-1) according to the natural breakpoint method (Figure 3), and overlay analyses were carried out in ArcGIS to obtain the spatial results of nine types of HQ-HFI (Figure 4).
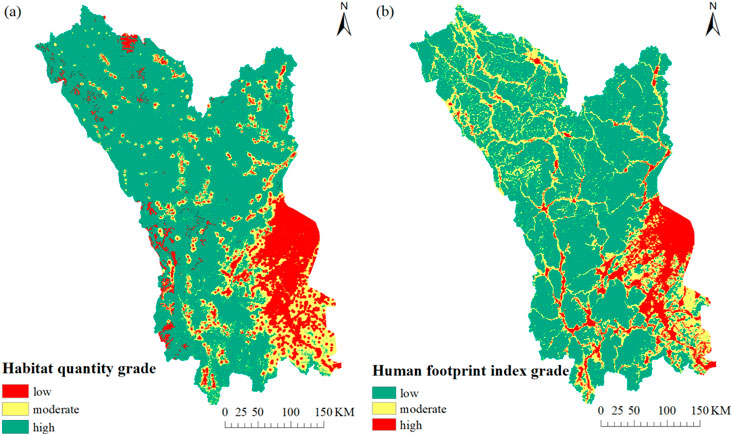
Figure 3. HQ and HFI grading. Note: (A) HQ; (B) HFI.
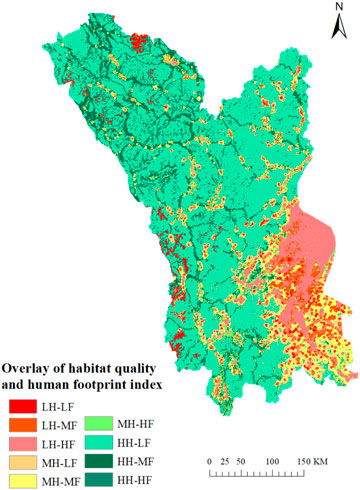
Figure 4. Results of HQ and HFI Superposition Analysis. LH indicates low HQ; MH indicates medium HQ; HH indicates high HQ; LF is low HFI; MF represents medium HFI; HF indicates high HFI.
On this basis, the nine spatial results were divided into three types of ecological control zones, namely, priority protected zones, priority recovery zones, and appropriate development zones, according to the degree of HQ and HFI impacts. Among them, priority protected zones are areas with good HQ and relatively few HFI, such as high HQ-low HFI, high HQ-medium HFI, and medium HQ-low HFI. Priority recovery zones are areas where the current HQ is poor due to the impact of unreasonable human development activities or changes in the natural environment, which cannot meet people’s needs for a high-quality habitat and need to be restored, such as low HQ-low HFI, low HQ-medium HFI, low HQ-high HFI, medium HQ-high HFI. Appropriate development zones are areas where economic construction can be carried out moderately while ensuring a balance between the quality of the habitat and the development needs of life, such as medium HQ-medium HFI, and high HQ-high HFI.
2.3.5 The PLUS model
The PLUS model was put out by Liang et al. (2021). The following is how it operates: The random forest technique is used to examine each form of land use individually and determine the development likelihood of each type of land use by spatially decomposing changes in land use across two periods; the modeling of various land usage is accomplished by combining the threshold descent methodology with random seed generation (Gao et al., 2022). Land use change is influenced by multiple driving factors and is not caused by a single factor. Therefore, the selection of driving factors has an important impact on the accuracy of land use spatial pattern simulation in the study area. Taking into account the unique characteristics of the region, the accessibility and coherence of information, as well as pertinent research findings, a total of 12 data points were meticulously chosen as driving factors for this study. These factors encompass a broad spectrum, including natural, social, transportation, and economic aspects, as depicted in Figure 5. This comprehensive selection ensures that the PLUS model is well-equipped to capture the intricate dynamics of land use change in the study area. Based on the two periods of land use data in 2010 and 2020, the 12 selected driving factors were inputted into the PLUS model, and it was ensured that all the driving factors and the row and column numbers of the land use were consistent, so as to obtain the probability of appropriateness of each land use type in the Min River Basin. The land use data in 2020 simulated by the model were compared with the actual ones (Figure 6), and the results indicated that the Kappa coefficient of the PLUS model simulation was 0.83 and the FOM coefficient was 0.13, which indicated that the results of the PLUS model simulation in this study were reliable and applicable, and could be used to carry out the prediction of the future land use changes in the simulation.
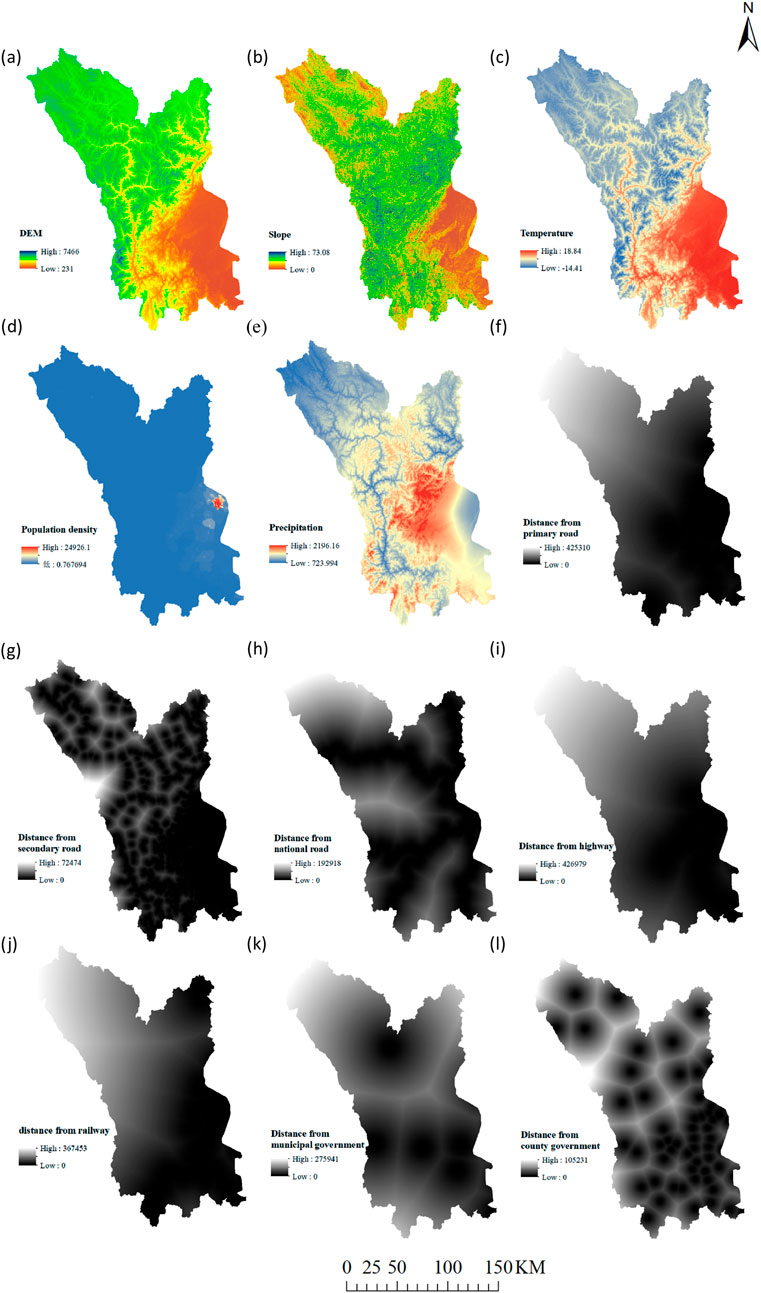
Figure 5. Driver factor data. Note: (A–I) are different driving factors.
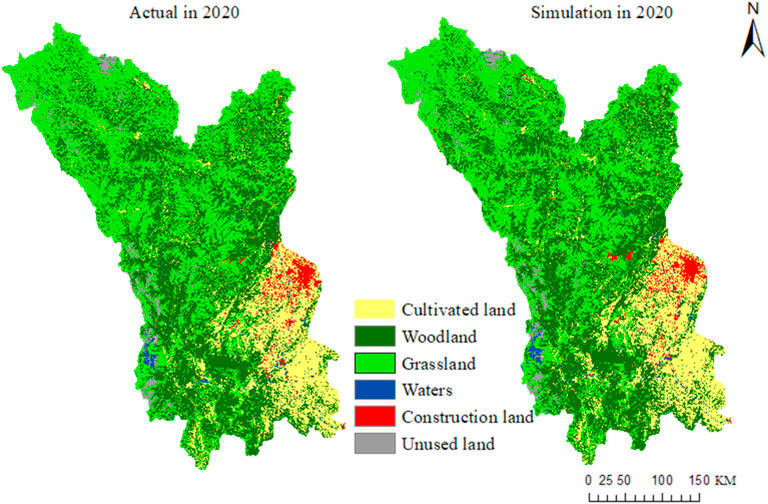
Figure 6. Model validation result.
2.3.6 Multi-scene setting
Changes in the demand for watershed development are important factors influencing the spatial use of land, and different demands for watershed development determine different spatial development orientations of land. The simulation and prediction of land use in watersheds under a variety of scenarios are set up in order to provide decision-makers with different decision-making perspectives and assist them in judging the development of the future spatial pattern of land use more scientifically, which is of great significance for the harmony of human-land relations and the stable development of the socio-economy (Nie et al., 2023; Li et al., 2022). Therefore, the following two scenarios were set up in this study:
(1) Natural development scenario (ND): This scenario uses a Markov model to predict the future size of each category based on the rate of land use change from 2010-2020 and the driving factors, regardless of policy and planning constraints. This scenario provides the basis for the other scenarios.
(2) Planning protection scenario (PP): The introduction of an integrated protection system for mountains, water, forests, fields, lakes and grasslands has promoted the concept of ecological civilization. Compared with the natural development scenario, the probability of forest land and grassland being converted to construction land is reduced by 50% under the PP scenario, and the probability of watersheds being converted to construction land is reduced by 30%. In addition, although arable land also has some ecological capacity, it is weaker compared to forest land. Therefore, under the PP scenario, the probability of conversion of arable land to construction land is reduced by 30%, and the reduced portion is used to increase the probability of conversion of arable land to grassland, and the priority protected zones obtained based on ecological zoning planning is set as a restrictive development area, which in turn simulates the land-use data in 2030.
3 Results
3.1 Characteristics of land-use change
The Min River Basin is made up mostly of arable land, forests, and grasslands, making up over 94% of the entire area. Of these, grasslands make up more over 40% of the basin (Figure 7). During the period from 1990 to 2000, cultivated land underwent significant conversions to forest, construction land, and grassland, with respective conversion areas of 1,047.19 km2, 529.36 km2, and 332.79 km2. Forest land experienced conversions of 2,311.96 km2 to grassland and 1,048.23 km2 to cultivated land. Grassland underwent conversions of 2,170.85 km2 to forest and 323.49 km2 to cultivated land. During this period, there were noticeable interchanges among these three land types, while construction land, waters, and unused land witnessed an increase in their respective areas. From 2000 to 2010, the land use change in the Min River Basin was mainly characterized by the conversion of cultivated land to build-up. Around 879.07 km2 of arable land underwent conversion to build-up land, resulting in a growth of 624.32 km2, representing a 45% increase. Forest and water body areas experienced slight increments, with an increase of 1,126.19 km2 and 157.63 km2, respectively. However, grassland and unused land decreased by 1,382.01 km2 and 51.82 km2, respectively. During this period, the population in the Min River Basin grew rapidly, with increasing demand for land for residential, industrial and other facilities, and the scope of towns and villages continued to expand outwards; on the other hand, with the rapid development of urbanization, the GDP of the central urban areas and counties within the Min River Basin increased substantially, and the improvement of infrastructure and transport networks in various areas took up a large amount of arable land, resulting in a continuous increase in the area of construction land and a significant reduction in the area of arable land. The area of land used for construction has increased continuously, and the area of arable land has decreased significantly. Between 2010 and 2020, the primary trend of land type change was the conversion of cropland to build-up and water bodies. Within cropland, 134.71 km2 was converted to water bodies, and 728.66 km2 was converted to build-up, resulting in a growth of 467.56 km2, approximately 23%. Forest and grassland experienced slight reductions, while unused land showed a slight increase. During this period, Sichuan Province formulated a provincial ecological security pattern of ‘one belt, six slices and eight corridors’, strictly protected arable land, prevented the continuous construction of cities and towns, and at the same time strengthened ecological economic development, coordinated the relationship between socio-economic development and resource protection, and gradually improved the ecological situation of the land.
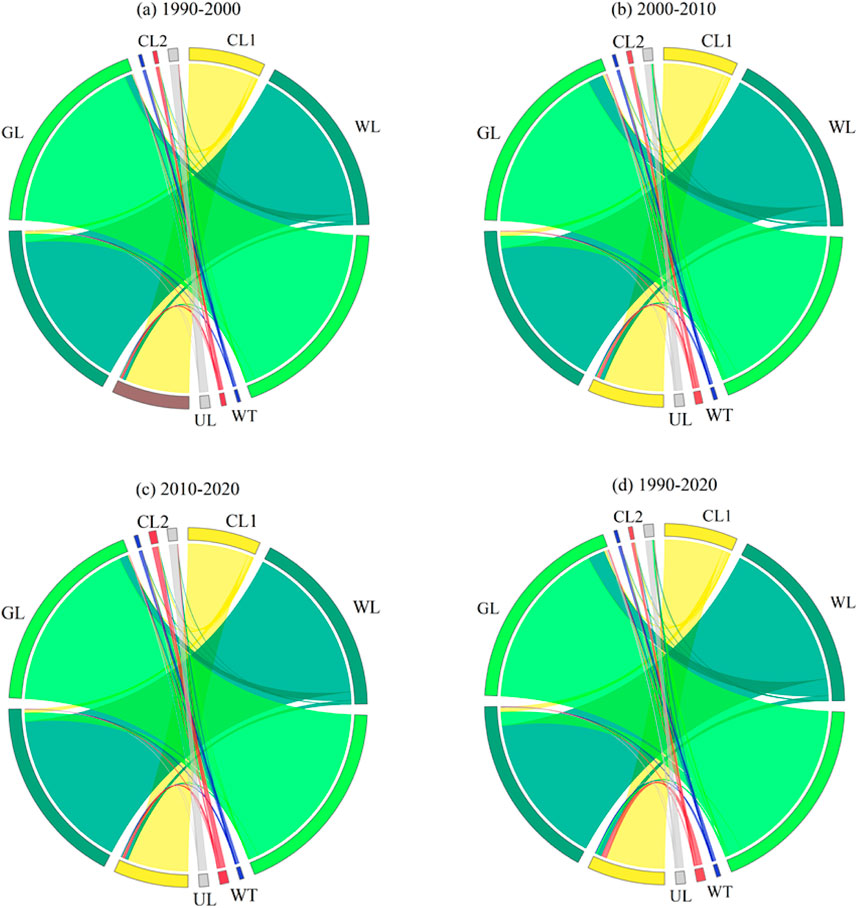
Figure 7. Land use transfer chord map of Min River basin from 1990 to 2020. CL1 represents cultivated land; GL represents grassland; WL represents woodland; WT represents waters; CL2 represents construction land; UL represents unused land. Note: (A–D) represent different years.
Overall, the most remarkable land usage changes during the period 1990-2020 are reflected in the growth of construction land and the reduction of cultivated land, with an increase of 1,350.76 km2 in construction land and a decrease of 1,212.93 km2 in cultivated land. The land area of grassland and unused land decreased by 1,276.23km2 and 53.17 km2 respectively.
3.2 Temporal and spatial variation of HQ
The InVEST model utilizes the Habitat Quality Index to represent the overall HQ in the study area. In the model, the HQ is represented by values ranging from 0 to 1, where values closer to 1 indicate better HQ. Using the natural breaks approach in ArcGIS, the HQ was categorized into three levels: low (0-0.4), medium (0.4-0.8), and high (0.8-1) taking into account the unique characteristics of the Min River Basin. Techniques for visualization were used to depict these HQ levels (Figure 8).
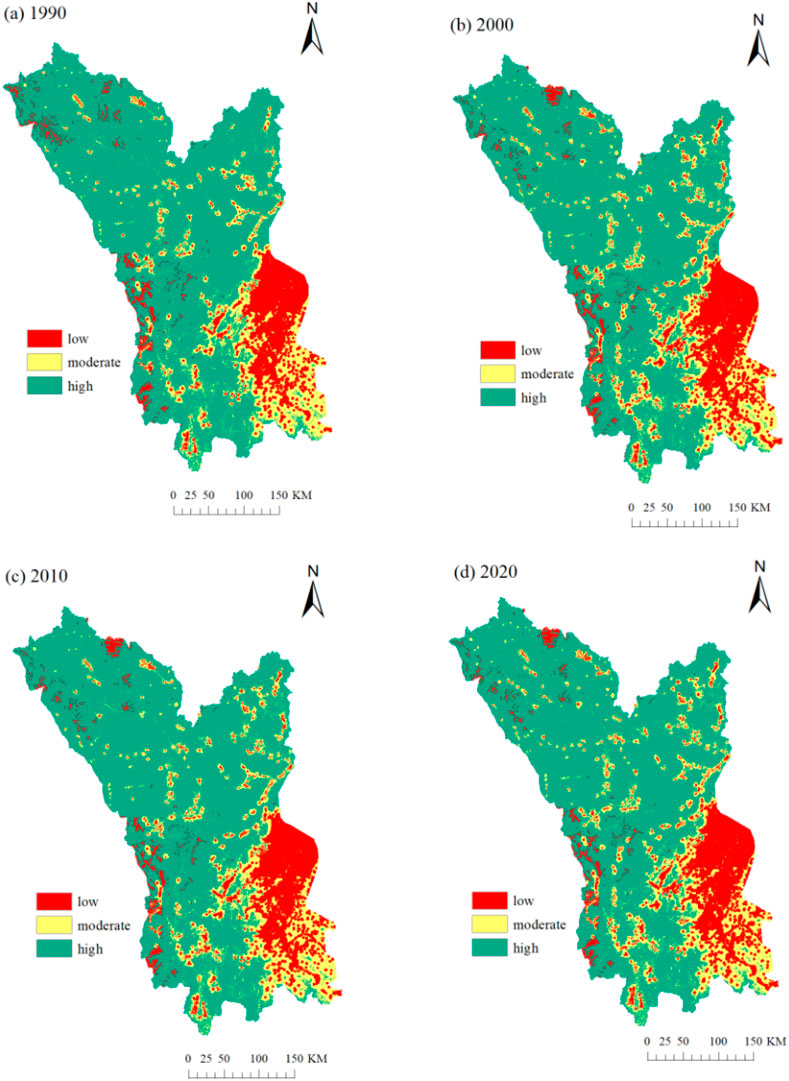
Figure 8. HQ patterns of spatial distribution. Note: (A–D) represent different years.
In terms of the time scale of HQ in the Min River Basin, from 1990 to 2020, the low HQ area increased from 17,810 km2 to 20,324.51 km2, and their percentage in the research region increased from 13% to 15%; the medium HQ area increased from 20,861.69 km2 to 22,769.66 km2, and their percentage increased from 15% to 17%; The high HQ area decreased from 97,535.23km2 to 93,112.75km2, and its proportion decreased from 72% to 68%. According to the calculation, the mean HQ of Min River Basin during 1990, 2000, 2010 and 2020 was 0.8203, 0.8188, 0.8074 and 0.7977, respectively, and the HQ showed a decreasing trend. As a whole, the overall HQ in the Min River basin is at high HQ, but the high HQ shows a decreasing trend and the low HQ shows an increasing trend between 1990 and 2020, which indicates a risk of habitat degradation.
On a spatial scale, the overall HQ of the Min River basin changes from 1990 to 2020 with a trend of gradual decrease from upstream to downstream. The upper reaches of Min River have high forest vegetation cover due to topography and soil conditions, and its land use types are mainly woodland and grassland, which are not conducive to cultivation and habitation, and are less affected by humans and have relatively high HQ. At the same time, with the accelerated urbanization and rapid expansion of build-up area, the area of forest and grassland is decreasing, which leads to the gradual deterioration of the ecological environment in this part of the region and has a great impact on the HQ. The high HQ areas are mainly located in the north and west of the study area, where there are more hills and mountains, and the forest coverage is higher, and the main land use types are woodlands, grasslands and lakes. Medium HQ areas are scattered, but mainly located in the southeast, where there are large areas of cultivated land and dense villages and towns, and the HQ is relatively low; low HQ areas are mainly located in the middle and east of the study area, where most of the areas are urban and human living areas, and most of the land usage in these areas are mainly cultivated land and build-up land, and urban transportation and other building land are expanding at a comparatively quick pace. The expansion rate of urban transportation and other construction land is relatively fast, which will have a certain threat to the habitat.
3.3 Analysis of HQ response to land-use change and its driving force
3.3.1 Response of HQ to land-use change
The inter-transformation between different land use types brought about different degrees of degradation and enhancement of HQ, resulting in changes in overall HQ. To further clarify the intrinsic connection between HQ and land use change, we calculated the transformation between different land use types that led to the change of HQ in the Min River Basin and their contribution rates (Figure 9; Table 4). The analysis shows that the factors leading to the improvement of HQ from 1990 to 2020 are mainly the conversion of reclaimed unused land to grassland, returning farmland to grassland, and returning farmland to forest, of which the conversion of unused land to grassland is the main factor, with a contribution rate of 29.45%, followed by conversion of cropland to grassland and forest land, with a contribution rate of 14.52% and 11.03%, respectively. The main factors leading to the deterioration of HQ in the region are that part of the grassland and forest land has been deserted as unused land, and part of it has been reclaimed as arable land, and construction land has been developed and occupied. The four most prominent land conversion types, namely, grassland to unused land, grassland to arable land, arable land to construction land, and forest land to construction land, account for a substantial proportion of the overall habitat degradation. These four types individually contribute 28.06%, 22.64%, 21.64%, and 20.32% respectively, collectively amassing a contribution rate exceeding 90% towards the overall degradation of HQ in the region.
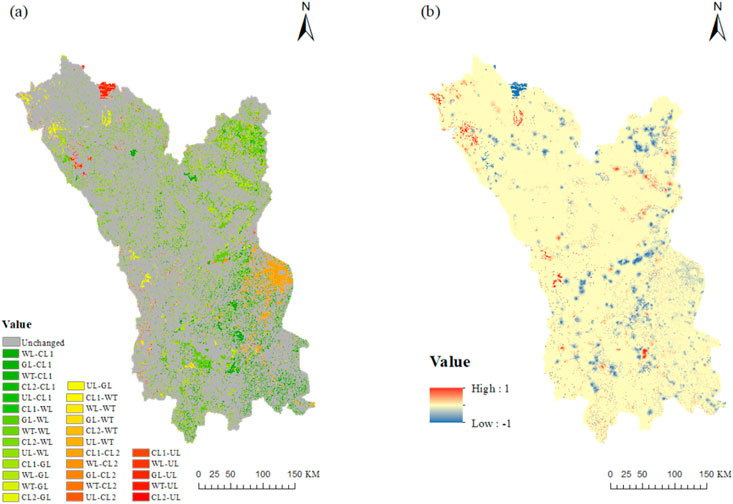
Figure 9. (A) Land use conversion mapping, 1990-2020; (B) HQ change mapping, 1990-2020.
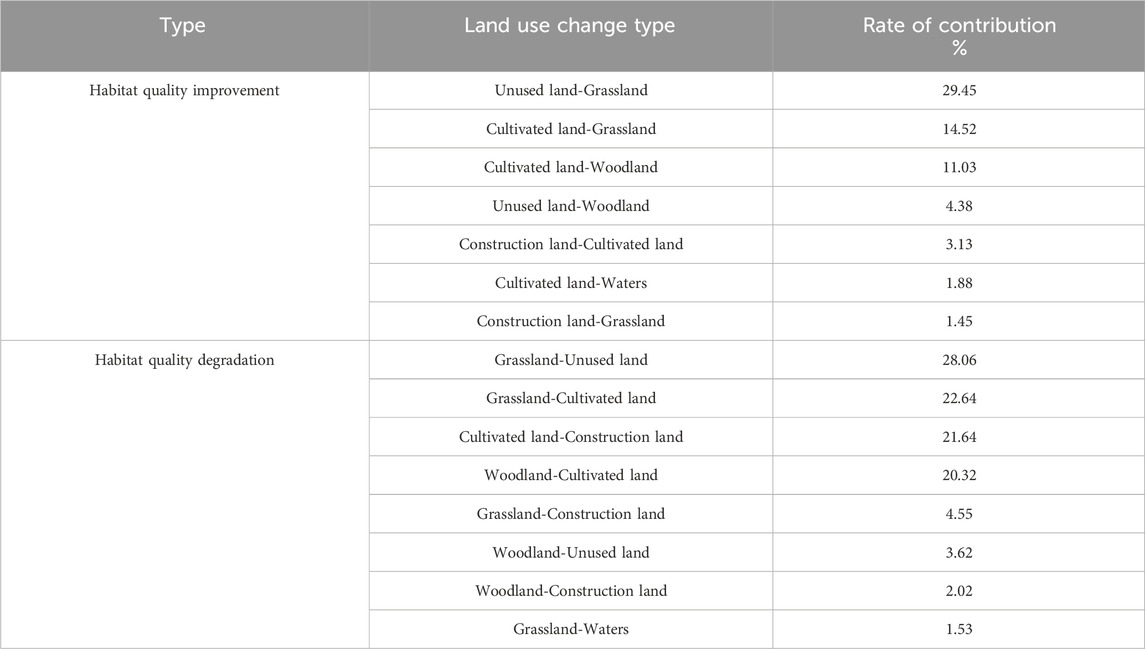
Table 4. Changes and contribution of major land types affecting HQ in the Min River Basin from 1990 to 2020.
Woodlands and grasslands have higher ecological suitability and have an improving effect on HQ, whereas the expansion of arable and built-up land can lead to the destruction and fragmentation of natural habitats, which in turn leads to the reduction of biodiversity and has a non-negligible negative effect on HQ. This is consistent with the findings of Fu et al. (2022) and Berta Aneseyee et al., 2020 whose studies found that the increase in the area of grasslands and forests along with the decrease in the growth rate of urban construction land is the main reason for the improvement of regional HQ. Meanwhile, Chen and Liu, 2024 also pointed out that urbanization has led to the occupation of a large amount of arable land, woodland, and grassland and the irreversible destruction of ecosystems.
3.4 Analysis of the driving force of HQ changes
From the results of the one-factor detection (Table 5), the one-factor explanatory power of natural environmental factors on HQ was much greater than that of socio-economic factors. Among them, X1 (DEM) and X2 (Slope), with 0.519 and 0.426 respectively, were the two factors with the greatest influence on the spatial variation of HQ. This was followed by X6 (Pop) at 0.298. DEM emerges as the strongest explanatory power of HQ across the Min River Basin, owing primarily to the basin’s topography. In this landscape, grasslands and woodlands prevail, with the steeper, higher-elevation areas boasting stronger vegetation cover and better-preserved ecological conditions, thereby inherently exhibiting superior HQ. Additionally, population dynamics play a significant explanatory role, as the intensity of human activities significantly modulates the regional habitat environment. Specifically, while urban development and construction endeavors tend to diminish habitat quality, environmentally focused initiatives spearheaded by humans contribute to the enhancement of the local environment.

Table 5. Results of single factor detection.
Single factor explanations of phenomena are often less robust than interactions of factors. To investigate the effects of factor interactions on HQ, this study explored the interactions of HQ at the watershed scale (Figure 10). The results showed that the degree of influence of each driver on the distribution pattern of HQ was not independent of each other, but mainly showed two-way enhancement or non-linear enhancement, suggesting that the interaction between the drivers was more effective in explaining the changes in the spatial distribution of HQ. Among them, X1 (DEM) and X6 (Pop) had the greatest explanatory power of 0.657, followed by X2 (Slope) and X1 (DEM), with a q-value of 0.633. Combining the above combinations with large q-values, it can be seen that the HQ of the Min River Basin is primarily influenced by the natural geographic elements (DEM and Slope), and that anthropogenic disturbances diminish with increasing elevation, and the ecological environment is improved.
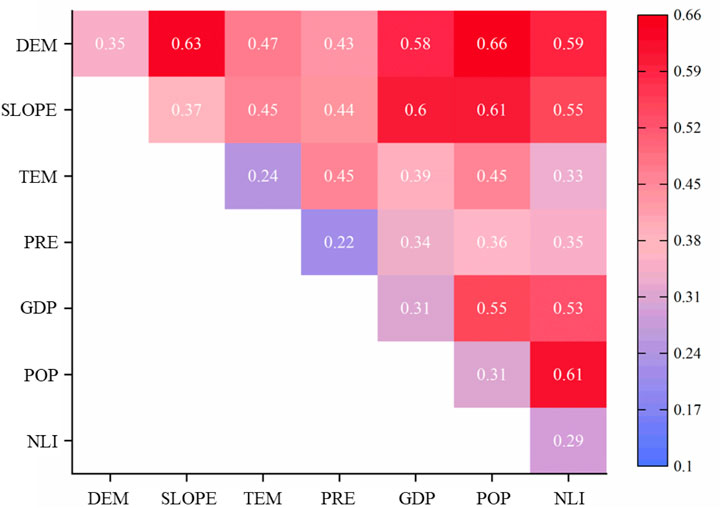
Figure 10. Explanatory power of interaction detection of each influence factor.
3.5 Ecological zoning plan
Figure 11 displays the ecological zoning outcomes. The priority protected zones cover a total area of 102,058.68 km2, making up 74.99% of the whole area. The area mainly consists of vast natural landscapes of native woodlands, grasslands, lakes, and wetlands with excellent ecological restoration functions and high HQ, and its average HQ is 0.9372, which is regarded as the ecological barrier of the Min River Basin. Within the key protected areas, strict control is required and any development activities that may threaten the habitat are generally prohibited to ensure the stability of the ecosystem. Such measures will help to protect and maintain the ecological integrity of the priority protected areas and safeguard biodiversity and the sustainable development of the ecosystem.
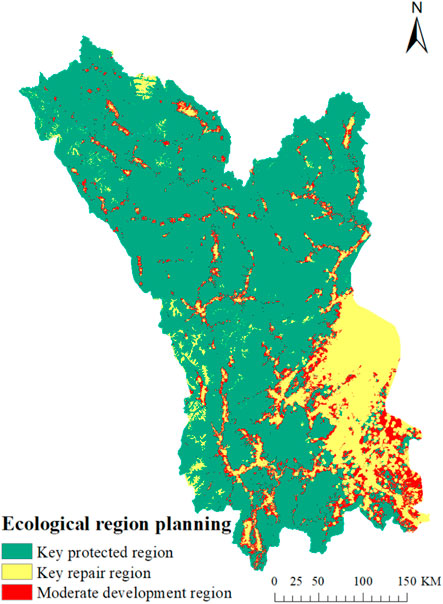
Figure 11. Ecological zoning planning results.
The priority recovery zones are 22,969.02 km2, making up 16.88% of the whole area, and the average HQ in the area is 0.2697. Under the premise of strictly abiding by the permanent basic farmland protection control line, we need to promote the protection and restoration of the overall ecological space in conjunction with the construction of important ecosystem protection and restoration projects. We should establish biodiversity reserves that symbiotically coexist with ecosystems such as forests, grasslands, wetlands, and water bodies to enhance the functions of ecosystems, improve the quality of habitats in the region and restore species diversity. Such measures will help protect and restore the ecological environment in priority areas and ensure the healthy development of ecosystems.
The appropriate development zones are 11,070.05 km2, making up 8.13% of the whole area. The distribution of this part of the area is more scattered, and its average HQ is 0.6098, but it is suitable for some development and construction activities. When formulating local policies, policymakers should reasonably promote the development and construction of moderate development zones. By realizing the synergistic development of industrial ecology and ecological industrialization, appropriate directions for green industry development can be selected according to the actual local situation. At the same time, a variety of measures are needed to promote the realization of ecological product values, transform ecological advantages into economic advantages, and provide support for promoting high-quality economic development.
3.6 Land use change analysis and HQ response under future scenarios
Based on the land use data in 2010 and 2020, the land use data of the ND scenario and the PP scenario under 2030 were simulated by combining the selected 13 driving factors (Figure 12). Based on the land use area in 2020, the area of each category and its degree of change in 2030 under the two scenarios were calculated (Table 6).
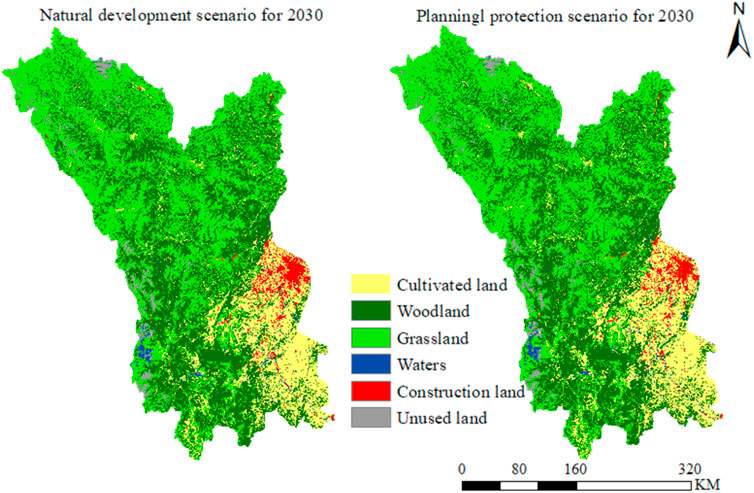
Figure 12. 2030 Spatial pattern of land use patterns in two scenarios.
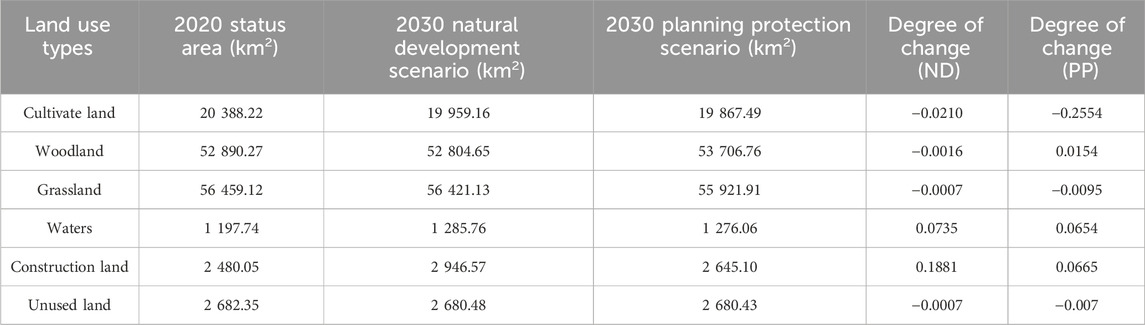
Table 6. Situation of 2020 and modeling of multiple scenarios for changing land use type in 2030.
Under the ND scenario, the area of cultivated land in the study area will decrease sharply, and the construction land will show a clear upward trend, and the area of cropland in the study area will reach 19,959.16 km2; the area of urban land will increase by 18.8% to 2,946.57 km2, indicating that under the condition of no conservation measures, the land for urban construction is expanding rapidly, and the cultivated land, grassland, and forest land become the main external input sources of land use.
In the PP scenario, the area of forest land is 53707.76 km2, which increases by 1.54% compared to the ND scenario, with a small increase. The water area is 1276.06 km2, which is increased by 6.53%. Despite the increase in the built-up land area, the increase is smaller than that of the ND scenario, which is only 6.65%. This indicates that there will be certain restrictions on the growth of built-up land under the PP scenario.
The HQ results for the two scenarios are shown in Figure 13. Under the ND and PP scenarios, the HQ was classified as high (0.8-1), medium (0.4-0.8) and low (0-0.4) (Figure 12). In the ND scenario, the area of high HQ was 92968.21 km2, the area of medium HQ was 22731.35 km2, and the area of low HQ was 20398.76 km2, whereas in the PP scenario, the area of high HQ was 93,468.17 km2, the area of medium HQ was 22,449.35 km2, and the area of low HQ was 20,398.76 km2. In the ND scenario, without the restriction of relevant policies, the construction land expands dramatically and erodes other land use types in the neighborhood, resulting in significant degradation of the HQ of the watershed and a decline in HQ. In the PP scenario, the conversion of forest land to other land use types is restricted by the relevant ecological protection policies, and the conversion of arable land to forest land significantly increases the area of forest land, while the area of grassland, watershed and other ecological land increases significantly, resulting in a significant increase in HQ under this scenario. Compared with the ND scenario, the area of high HQ area under the PP scenario increased by 499.96 km2, which indicates that the PP scenario can effectively improve the HQ of the Min River Basin.
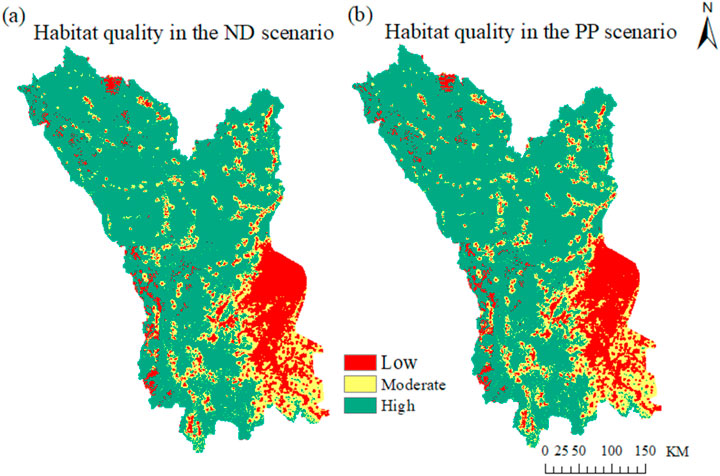
Figure 13. HQ changes under two land use scenarios in 2030.
4 Discussion
4.1 Drivers of land-use change
Numerous factors converge to drive changes in land types. The HFI highlights that the central-eastern portion of the region experiences heightened human disturbance, encompassing approximately 10% of the area, predominantly featuring plains and river basins with advantageous natural and geographic attributes. Conversely, regions with lower HFI values are predominantly situated in the northern and western fringes of the basin, accounting for about 66% of the total area. These areas are predominantly mountainous and hilly, characterized by more challenging natural conditions that hinder human development, thereby contributing to their lower HFI scores. The accelerated urbanization process and the continuous expansion of urban construction land have absorbed a large amount of rural population and farmland. The impact of urbanization on land use is mainly manifested in urban expansion, industrial park construction and transportation infrastructure construction. This phenomenon is especially prominent in the plain areas with better natural and locational conditions. In addition, population growth is also an important factor affecting land usage in the Min River Basin. As populations expand, so too does the demand for housing, industry, and infrastructure, necessitating increased land development and utilization. This often entails the conversion of significant areas of land, including woodlands and grasslands—vital ecological resources—into urban construction land to accommodate the growing populace. Woodlands and grasslands play a pivotal role in managing soil erosion and land degradation in ecologically vulnerable watershed regions, where their preservation is crucial. Watersheds are of paramount importance for maintaining regional water ecological balances. Recognizing this, local governments have implemented measures aimed at strengthening river and lake systems, coordinating water resource utilization, and enhancing water environment management and ecological protection. These efforts have culminated in the formation of various watershed wetlands, notably the Min River Source National Wetland Park, which effectively safeguard the integrity of the watershed area, contributing to the overall ecological health and sustainability of the region.
Under the ND scenario, which does not take into account policy and planning constraints, the importance of ecological land has been neglected to satisfy the demand for economic growth, and original arable land, forest land, and grassland have been converted into land for construction. This excessive pursuit of rapid urban economic development has led to the loss of originally good ecological land. The end effect is a reduction in the amount of grassland, woodland, and arable land, which is bad for ecological security and stability as well as long-term economic growth. The PP aggressively protects forests and waterways while controlling the rate at which the amount of land used for building expands. This allows for sensible development activities to occur while maintaining ecological preservation.
Further analysis of the contribution of each driver to the change of each land type reveals that (Figure 14), DEM has the greatest contribution to build-up land, grassland, waters and unused land, and the area of these land types tends to increase in areas with lower DEM values and closer to the river; The driving factor with the highest contribution to the area of woodland is slope, and its increasing areas are mostly scattered along the foothills and rivers; the distance from municipal government factor has the greatest influence on the expansion of build-up land area, and its increasing areas are mainly distributed around government sites with relatively flat terrain, low slope and frequent socio-economic activities.
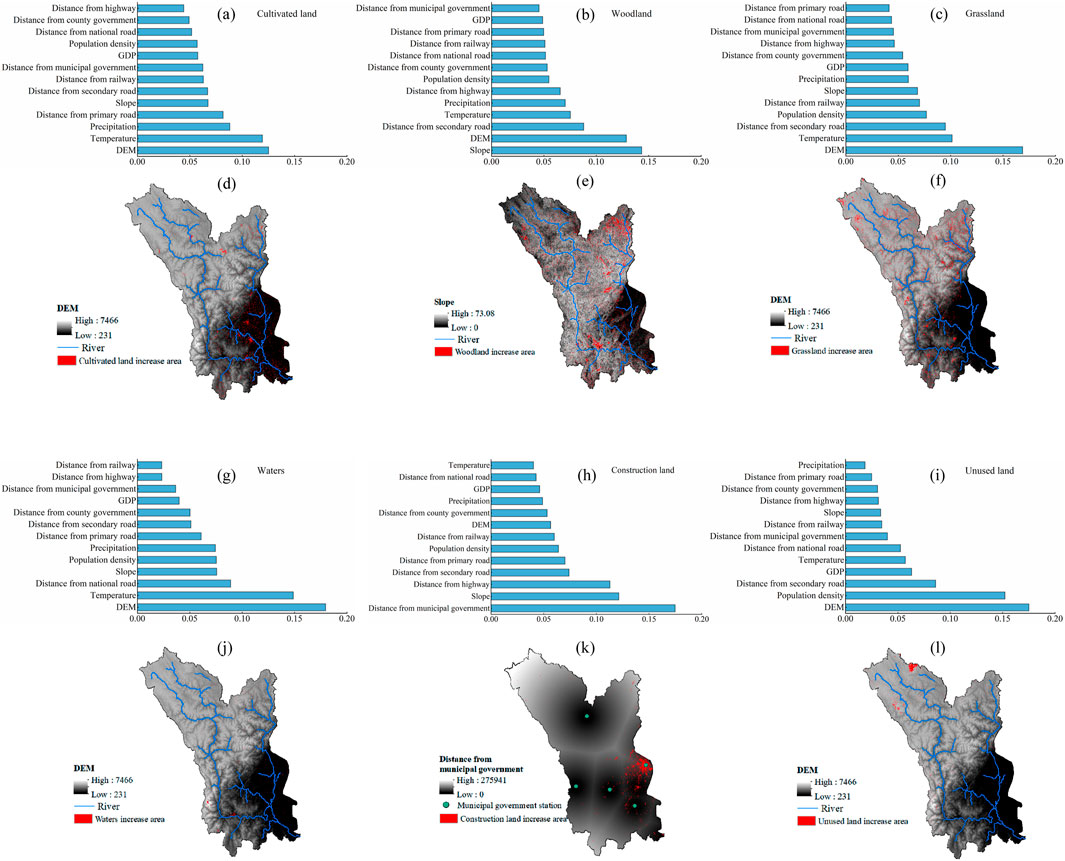
Figure 14. (A), (B), (C), (G), (H), and (I) are the driver contributions; (D), (E), (F), (J), (K), and (L) are the areas of increase in each category overlaid with their highest contributors.
4.2 Effects of land use change on HQ
HQ is inextricably linked to land use type, and the spatial and temporal variation of HQ is highly consistent with the regional land type status. In the upper portion of the Min River basin, grasslands and forests are the predominant plant types, which can provide water conservation and water purification for the whole watershed with less human disturbance, and the HQ is in excellent condition. In contrast, the middle and downstream parts of the Min River are dominated by arable land, with high population density, and the HQ of the Min River basin is greatly damaged by farming, fertilization, domestic sewage, and industrial wastewater (Zhao and Wu, 2022). At the same time, urbanization converts habitat directly into land for construction, leading to the loss of natural HQ. It can also have indirect effects on natural habitats by reducing HQ through disturbances (e.g., noise, air and water pollution, etc.) brought about by urban land expansion (Wang et al., 2021). Li et al. (2022) revealed the response of urban land use change on HQ using Tianjin as a study, and their findings found that the rapid growth of build-up land was the main cause of HQ decline in the area. Similarly, Ye et al. (2022) showed that the HQ in the Guanzhong Plain urban agglomeration was in high HQ during the period of 2000–2020, but with an overall decreasing trend, which was mainly because of the transformation of woodlands and meadows into construction land with the rapid process of urbanization, which resulted in the decline of HQ. These studies also show that land use change has a strong impact on HQ. Therefore, in order to maintain the biodiversity of the Min River Basin, it is necessary to manage the development and utilization of land in a scientific and legal manner, to strengthen the protection of grassland and forest land, to ensure the appropriate area of ecological land, and to focus on the structural composition and spatial allocation of land, so as to improve the overall quality of ecological land, and thus to improve the overall quality of the habitats in the basin.
4.3 Limitations
In this study, the PLUS-InVEST model was coupled with HFI for simulating and analyzing the changes in spatio-temporal patterns of land use and HQ in the Min River basin, providing a basis and reference for environmental protection and sustainable development of ecology in the Min River basin. However, there are some limitations in the study. First of all, the model parameters in the simulation process of PLUS model are set according to the existing research experience and continuous debugging, and there are certain subjectivity, such as the neighborhood weights, attenuation coefficient and other parameters, which increase the uncertainty of the simulation results. In addition, although the driving factors selected in this paper involve natural and socio-economic factors, it is difficult to fully explain the causes of land use change due to the influence of subjectivity and limited access to data. In the future, we should continue to deepen the research to improve the prediction accuracy of the PLUS model. In the InVEST model, the setting of some parameters is based on the results of previous studies and the experience of experts, and the setting of parameters such as threat factors and habitat suitability values is more subjective, and the model calculates the threat of coercive threats superimposed, resulting in the threat value of multiple threat factors being much higher than the sum of the individual threats, and the calculation of the quality of the habitat will result in a corresponding error. Therefore, in the future, how to scientifically integrate multiple ecosystem services in the watershed, analyze the complex relationship between different ecosystem services, and fully integrate local measurement data to obtain a more accurate calculation of services is the key direction for the study of HQ, to better reveal the development and evolution of HQ in the Min River basin.
The Min River Basin is an important ecological barrier in the upper reaches of the Yangtze River, and is of great significance to the realization of sustainable regional economic and social development. HQ assessment in the Min River Basin is an important element of future ecological environmental protection in the Min River Basin, and it is necessary to strictly observe the three zones and three lines, prevent the uncontrolled expansion of urban land use, and strictly implement land use control to ensure that the ecological environment is not damaged. Continuing to promote the consolidation and development of the return of farmland to forest projects, both natural and man-made ways should be used to improve damaged habitats and optimize the structure of forest stands. At the same time, the management and control of existing nature reserves with poor HQ should be strengthened, and the boundary survey of the reserves should be further improved. On this basis, ecological zoning and habitat protection and restoration should be combined through overall conservation management, and ecological compensation mechanisms between watersheds should be explored to achieve synergistic effects.
5 Conclusion
In this study, the HFI of the Min River Basin was evaluated using a multi-indicator superposition analysis method. Ecological zoning planning of the watershed was carried out through the superposition analysis. The combined PLUS and InVEST models were used to characterize how future land type might affect HQ under two scenarios. The study shows that:
(1) The mainland types in the Min River Basin are grassland, woodland, and cropland, accounting for more than 94% of the total area. By 2030, under the ND scenario, the area of cropland decreased by 2.1%, while the area of construction land increased significantly by 18.81%, the most significant change; in contrast, under the PP scenario, the area of forest land increased by a small amount of 1.54%, while the growth rate of construction land was significantly suppressed, with an increase of 6.65%.
(2) During the study period, although the HQ of the watershed as a whole was high, it showed a changing trend of decreasing areas of high HQ and increasing areas of low HQ. By 2030, the ND scenario continues the declining trend in HQ, while HQ is greatly improved in the PP scenario.
(3) HQ in the Min River Basin is affected by a combination of natural and socio-economic factors. Among them, dem, slope, and population contribute more to the spatial differentiation of HQ in the Min River Basin; dem and population have the strongest synergistic effect on the change of HQ.
(4) According to the ecological zoning plan, the watershed is divided into priority protected zones, priority recovery zones, and appropriate development zones. Among them, priority protected areas accounted for the largest proportion of the area (74.99%), followed by priority protected areas (16.88%) and moderate development areas (8.13%).
Data availability statement
The original contributions presented in the study are included in the article/Supplementary Material, further inquiries can be directed to the corresponding author.
Author contributions
YJ: Conceptualization, Data curation, Funding acquisition, Writing–original draft, Writing review and editing. JH: Funding acquisition, Investigation, Methodology, Resources, Writing–review and editing. DZ: Formal Analysis, Investigation, Methodology, Software, Validation, Writing–original draft, Writing review and editing. CH: Validation, Supervision, Conceptualization, Writing review and editing. LY: Methodology, Formal Analysis, Software, Visualization, Writing–original draft, Writing review and editing.
Funding
The author(s) declare that financial support was received for the research, authorship, and/or publication of this article. This research was funded by ZJU-STEC Urban Development and Planning Innovation Joint Research Center Project (Grant No. 513000-I5220A/001).
Conflict of interest
Authors YJ and JH were employed by Shanghai UrbanConstruction Design and Research Institute (Group) Co., Ltd. Author CH and LY were employed by company China Eco-city Academy Co.
The remaining author declares that the research was conducted in the absence of any commercial or financial relationships that could be construed as a potential conflict of interest.
Publisher’s note
All claims expressed in this article are solely those of the authors and do not necessarily represent those of their affiliated organizations, or those of the publisher, the editors and the reviewers. Any product that may be evaluated in this article, or claim that may be made by its manufacturer, is not guaranteed or endorsed by the publisher.
References
Alaniz, A. J., Carvajal, M. A., Fierro, A., Vergara-Rodríguez, V., Toledo, G., Ansaldo, D., et al. (2021). Remote-sensing estimates of forest structure and dynamics as indicators of habitat quality for Magellanic woodpeckers. Ecol. Indic. 126, 107634. doi:10.1016/j.ecolind.2021.107634
Bai, L., Xiu, C., Feng, X., and Liu, D. (2019). Influence of urbanization on regional habitat quality:a case study of Changchun City. Habitat Int. 93, 102042. doi:10.1016/j.habitatint.2019.102042
Berta Aneseyee, A., Noszczyk, T., Soromessa, T., and Elias, E. (2020). The InVEST habitat quality model associated with land use/cover changes: a qualitative case study of the winike watershed in the omo-gibe basin, southwest Ethiopia. Remote Sens. 12, 1103. doi:10.3390/rs12071103
Chao-nan, L., Zhong-wu, J. I. N., Mu-song, L. I. N., Qiu-li, L. I., and Yu-xuan, W. (2020). Impact of reservoir construction on water andSediment transport in minjiang River Basin. J. Yangtze River Sci. Res. Inst. 37, 9. doi:10.11988/ckyyb.20190573
Chen, S., and Liu, X. (2024). Spatio-temporal variations of habitat quality and its driving factors in the Yangtze River Delta region of China. Glob. Ecol. Conservation 52, e02978. doi:10.1016/j.gecco.2024.e02978
Chu, L., Sun, T., Wang, T., Li, Z., and Cai, C. (2018). Evolution and prediction of landscape pattern and habitat quality based on CA-markov and InVEST model in Hubei section of three Gorges reservoir area (TGRA). Sustainability 10, 3854. doi:10.3390/su10113854
Cui, G., Zhang, Y., Shi, F., Jia, W., Pan, B., Han, C., et al. (2022). Study of spatiotemporal changes and driving factors of habitat quality: a case study of the agro-pastoral ecotone in northern shaanxi, China. Sustainability 14, 5141. doi:10.3390/su14095141
Duan, Q., and Luo, L. (2020). 1990–2015 Qinghai Tibet Plateau human footprint data set section quntao. J. CSData 5. doi:10.11922/csdata.2019.0082.zh
Ellis, E. C., Pascual, U., and Mertz, O. (2019). Ecosystem services and nature’s contribution to people: negotiating diverse values and trade-offs in land systems. Curr. Opin. Environ. Sustain. Sustain. Gov. transformation 38, 86–94. doi:10.1016/j.cosust.2019.05.001
Gao, L., Tao, F., Liu, R., Wang, Z., Leng, H., and Zhou, T. (2022). Multi-scenario simulation and ecological risk analysis of land use based on the PLUS model: a case study of Nanjing. Sustain. Cities Soc. 85, 104055. doi:10.1016/j.scs.2022.104055
Gong, J., Xie, Y., Cao, E., Huang, Q., and Li, H. (2019). Integration of InVEST-habitat quality model with landscape pattern indexes to assess mountain plant biodiversity change: a case study of Bailongjiang watershed in Gansu Province. J. Geogr. Sci. 29, 1193–1210. doi:10.1007/s11442-019-1653-7
Guo, W., Yang, H., Zhou, H., and Wang, H. (2023). Synergistic changes in river-lake runoff systems in the Yangtze River basin and their driving force differences. Ecol. Inf. 75, 102069. doi:10.1016/j.ecoinf.2023.102069
Han, J., Hu, Z., Wang, P., Yan, Z., Li, G., Zhang, Y., et al. (2022). Spatio-temporal evolution and optimization analysis of ecosystem service value - a case study of coal resource-based city group in Shandong, China. J. Clean. Prod. 363, 132602. doi:10.1016/j.jclepro.2022.132602
Hou, Y., Chen, Y., Li, Z., Li, Y., Sun, F., Zhang, S., et al. (2022). Land use dynamic changes in an arid inland River Basin based on multi-scenario simulation. Remote Sens. 14, 2797. doi:10.3390/rs14122797
Huang, J., Yang, W., Huang, J., Yang, W., Yang, X., Deng, B., et al. (2016). The influence of eco-water retrieved by quantitative remote sensing on runoff in upper minjiang River Basin. Earth Sci. Res. J. 20, E1–E6. doi:10.15446/esrj.v20n3.55177
Jia, L.-Q., Ouyang, Z.-Y., Zhao, T.-Q., Wang, X.-K., Xiao, Y., Xiao, R.-B., et al. (2005). The ecological function regionalization of Anhui Province. Acta Ecol. Sin. 25, 254–260.
Lei, J., Chen, Y., Li, L., Chen, Z., Chen, X., Wu, T., et al. (2022). Spatiotemporal change of habitat quality in Hainan Island of China based on changes in land use. Ecol. Indic. 145, 109707. doi:10.1016/j.ecolind.2022.109707
Li, M., Zhou, Y., Xiao, P., Tian, Y., Huang, H., and Xiao, L. (2021). Evolution of habitat quality and its topographic gradient effect in northwest Hubei Province from 2000 to 2020 based on the InVEST model. Land 10, 857. doi:10.3390/land10080857
Li, T., Bao, R., Li, L., Tang, M., and Deng, H. (2023). Temporal and spatial changes of habitat quality and their potential driving factors in southwest China. Land 12, 346. doi:10.3390/land12020346
Li, X., Liu, Z., Li, S., and Li, Y. (2022). Multi-scenario simulation analysis of land use impacts on habitat quality in Tianjin based on the PLUS model coupled with the InVEST model. Sustainability 14, 6923. doi:10.3390/su14116923
Li, Y., Dong, X., and Liu, X. (2016). Habitat pattern dynamics of the golden snub—nosed monkey in Baihe Nature Reserve, Minshan Mountains, China, over the past 40 years. Acta Ecol. Sin. 36 (7), 1803–1814.
Li, Y., Yao, S., Jiang, H., Wang, H., Ran, Q., Gao, X., et al. (2022). Spatial-temporal evolution and prediction of carbon storage: an integrated framework based on the MOP-PLUS-InVEST model and an applied case study in Hangzhou, East China. Land 11, 2213. doi:10.3390/land11122213
Liang, X., Guan, Q., Clarke, K. C., Liu, S., Wang, B., and Yao, Y. (2021). Understanding the drivers of sustainable land expansion using a patch-generating land use simulation (PLUS) model: a case study in Wuhan, China. Comput. Environ. Urban Syst. 85, 101569. doi:10.1016/j.compenvurbsys.2020.101569
Liu, H., Li, Z., and Bai, Y. (2006). Landscape simulating of habitat quality change for oriental white stork in Naoli River Watershed. Acta Ecol. Sin. (12), 4007–4013.
Liu, S., Liu, L., Wu, X., Hou, X., Zhao, S., and Liu, G. (2018). Quantitative evaluation of human activity intensity on the regional ecological impact studies. Acta Ecol. Sin. 38 (19), 6797–6809. doi:10.5846/stxb201711172048
Mei, Z., Wu, H., and Li, S. (2018). Simulating land-use changes by incorporating spatial autocorrelation and self-organization in CLUE-S modeling: a case study in Zengcheng District, Guangzhou, China. Front. Earth Sci. 12, 299–310. doi:10.1007/s11707-017-0639-y
Nie, W., Bin Xu, B., Yang, F., Shi, Y., Liu, B., Wu, R., et al. (2023). Simulating future land use by coupling ecological security patterns and multiple scenarios. Sci. Total Environ. 859, 160262. doi:10.1016/j.scitotenv.2022.160262
Peng, C., Wang, Y., Dong, J., and Huang, C. (2023). Impact of land use change on the habitat quality evolution in three Gorges reservoir area, China. Int. J. Environ. Res. Public Health 20, 3138. doi:10.3390/ijerph20043138
Rands, M. R. W., Adams, W. M., Bennun, L., Butchart, S. H. M., Clements, A., Coomes, D., et al. (2010). Biodiversity conservation: challenges beyond 2010. Science 329, 1298–1303. doi:10.1126/science.1189138
Rashid, H., Yang, K., Zeng, A., Ju, S., Rashid, A., Guo, F., et al. (2021). The influence of landcover and climate change on the hydrology of the minjiang river watershed. Water 13, 3554. doi:10.3390/w13243554
Sanderson, E. W., Jaiteh, M., Levy, M. A., Redford, K. H., Wannebo, A. V., and Woolmer, G. (2002). The Human Footprint and the Last of the Wild: the human footprint is a global map of human influence on the land surface, which suggests that human beings are stewards of nature, whether we like it or not. BioScience 52, 891–904. doi:10.1641/0006-3568(2002)052[0891:THFATL]2.0.CO;2
Santini, L., Belmaker, J., Costello, M. J., Pereira, H. M., Rossberg, A. G., Schipper, A. M., et al. (2017). Assessing the suitability of diversity metrics to detect biodiversity change. Meas. Biodivers. 213, 341–350. doi:10.1016/j.biocon.2016.08.024
Schindler, S., von Wehrden, H., Poirazidis, K., Wrbka, T., and Kati, V. (2013). Multiscale performance of landscape metrics as indicators of species richness of plants, insects and vertebrates. Ecol. Indic. Link. Landsc. Struct. Biodivers. 31, 41–48. doi:10.1016/j.ecolind.2012.04.012
Sun, X., Jiang, Z., Liu, F., and Zhang, D. (2019a). Monitoring spatio-temporal dynamics of habitat quality in Nansihu Lake basin, eastern China, from 1980 to 2015. Ecol. Indic. 102, 716–723. doi:10.1016/j.ecolind.2019.03.041
Wang, B., and Cheng, W. (2022). Effects of land use/cover on regional habitat quality under different geomorphic types based on InVEST model. Remote Sens. 14, 1279. doi:10.3390/rs14051279
Wang, J., Yan, Y., Wang, J., Ying, L., and Tang, Q. (2021). Temporal-spatial variation characteristics and prediction of habitat quality in Min River Basin. Acta Ecol. Sin. 41 (14), 5837–5848. doi:10.5846/stxb202010142618
Wang, Z., Fu, J., Quan, B., Zhang, D., and Wang, F. (2010). Changes of reproduction habitat quality of red-crowned crane in Zhalong wetlands. Chin. J. Appl. Ecol. 21 (11), 2871–2875. doi:10.13287/j.1001-9332.2010.0401
Wang, Z., Li, X., Mao, Y., Li, L., Wang, X., and Lin, Q. (2022). Dynamic simulation of land use change and assessment of carbon storage based on climate change scenarios at the city level: a case study of Bortala, China. Ecol. Indic. 134, 108499. doi:10.1016/j.ecolind.2021.108499
Wohlfart, C., Mack, B., Liu, G., and Kuenzer, C. (2017). Multi-faceted land cover and land use change analyses in the Yellow River Basin based on dense Landsat time series: exemplary analysis in mining, agriculture, forest, and urban areas. Appl. Geogr. 85, 73–88. doi:10.1016/j.apgeog.2017.06.004
Xiao, P., Zhou, Y., Li, M., and Xu, J. (2022). Spatiotemporal patterns of habitat quality and its topographic gradient effects of Hubei Province based on the InVEST model. Environ. Dev. Sustain 25, 6419–6448. doi:10.1007/s10668-022-02310-w
Xie, B., and Zhang, M. (2023). Spatio-temporal evolution and driving forces of habitat quality in Guizhou Province. Sci. Rep. 13, 6908. doi:10.1038/s41598-023-33903-8
Xu, Z., Peng, J., Dong, J., Liu, Y., Liu, Q., Lyu, D., et al. (2022). Spatial correlation between the changes of ecosystem service supply and demand: an ecological zoning approach. Landsc. Urban Plan. 217, 104258. doi:10.1016/j.landurbplan.2021.104258
Ye, H., Song, Y., and Xue, D. (2022). Multi-scenario simulation of land use and habitat quality in the Guanzhong Plain urban agglomeration, China. Int. J. Environ. Res. Public Health 19, 8703. doi:10.3390/ijerph19148703
Yin, D., Li, X., Li, G., Zhang, J., and Yu, H. (2020). Spatio-temporal evolution of land use transition and its eco-environmental effects: a case study of the yellow River Basin, China. Land 9, 514. doi:10.3390/land9120514
Zhai, H., Wang, M., Shen, D., Hu, B., and Li, Y. (2022). Analysis of runoff variation and driving factors in the Minjiang River Basin over the last 60 years. J. Water Clim. Change 13, 3675–3691. doi:10.2166/wcc.2022.218
Zhang, H., Li, S., Liu, Y., and Xu, M. (2022). Assessment of the habitat quality of offshore area in tongzhou Bay, China: using benthic habitat suitability and the InVEST model. Water 14, 1574. doi:10.3390/w14101574
Zhang, S., Chen, C., Yang, Y., Huang, C., Wang, M., and Tan, W. (2023). Coordination of economic development and ecological conservation during spatiotemporal evolution of land use/cover in eco-fragile areas. CATENA 226, 107097. doi:10.1016/j.catena.2023.107097
Zhang, X., Zhou, Y., Long, L., Hu, P., Huang, M., Xie, W., et al. (2023). Simulation of land use trends and assessment of scale effects on ecosystem service values in the Huaihe River basin, China. Environ. Sci. Pollut. Res. 30, 58630–58653. doi:10.1007/s11356-023-26238-4
Zhao, Q., and Wu, X. (2022). Research on the impact of land use change on habitat quality in Minjiang river basin based on InVEST Model. Ecol. Sci. 41 (6), 1–10. doi:10.14108/j.cnki.1008-8873.2022.06.001
Keywords: habitat quality, the PLUS mode, driving factors, human footprint index, the min river basin
Citation: Jiang Y, He J, Zhai D, Hu C and Yu L (2024) Analysis of the evolution of watershed habitat quality and its drivers under the influence of the human footprint. Front. Environ. Sci. 12:1431295. doi: 10.3389/fenvs.2024.1431295
Received: 11 May 2024; Accepted: 27 August 2024;
Published: 06 September 2024.
Edited by:
Sérgio António Neves Lousada, University of Madeira, PortugalReviewed by:
Rongfang Lyu, Lanzhou University, ChinaWei Baojing, Central South University Forestry and Technology, China
Copyright © 2024 Jiang, He, Zhai, Hu and Yu. This is an open-access article distributed under the terms of the Creative Commons Attribution License (CC BY). The use, distribution or reproduction in other forums is permitted, provided the original author(s) and the copyright owner(s) are credited and that the original publication in this journal is cited, in accordance with accepted academic practice. No use, distribution or reproduction is permitted which does not comply with these terms.
*Correspondence: Duanqiang Zhai, emhhaWR1YW5xaWFuZ0B0b25namkuZWR1LmNu