 Ying-Juan Zheng
 Yi-Ping Chen1*
 Lorraine Maltby
- 1Chinese Research Academy of environmental science, Beijing, China
- 2State Key Laboratory of Loess and Quaternary Geology, Institute of Earth Environment, Chinese Academy of Sciences, Xi’an, China
- 3School of Biosciences, The University of Sheffield, Sheffield, United Kingdom
The giant panda (Ailuropoda melanoleuca) is recognized worldwide as an icon for wildlife conservation. The Qinling subspecies (Ailuropoda melanoleuca qinlingensis) inhabiting the Qinling Mountains is more endangered. Previous studies have indicated that Qinling pandas are potentially at risk from environmental pollutants, which they are exposed to via food and drinking water. However, there is little information about the surface water quality in the Qinling Mountains, and it is unknown whether drinking water is an important pollutant source for pandas. Water samples were collected from five different nature reserves in Qinling, each of which is home to a population of pandas. The samples were analyzed for five essential metals of copper (Cu), zinc (Zn), manganese (Mn), chromium (Cr), and nickel (Ni) and four non-essential metals of lead (Pb), cadmium (Cd), arsenic (As), and mercury (Hg). The concentrations of all heavy metals (HMs) were higher in buffer zones than in the core areas and were highest in Foping and Niuweihe nature reserves. The concentrations of mercury exceeded the water quality standard in the core zone of three reserves, suggesting that NWH (Niuweihe), THS (Tianhuashan), and PHL (Pingheliang) giant panda populations were at risk from mercury toxicity. The accumulation of other elements over time could also pose a serious risk to pandas. Three main sources of pollution were identified: coal combustion, waste incineration, and fertilizer use; traffic-related activities; and metal mining. Environmental pollution is compromising the efforts to conserve the giant panda, and measures need to be put in place to control pollution sources.
Introduction
The giant panda (Ailuropoda melanoleuca) is recognized worldwide as a symbol for conservation biology, but our previous research has indicated that conservation efforts are being compromised by the exposure of habitats to pollutants (Chen et al., 2016; Chen et al., 2017a). The Qinling subspecies (Ailuropoda melanoleuca qinlingensis) is one of the most endangered pandas, and therefore, understanding and addressing the reasons for its population change is of utmost importance (State Forestry Administration, 2015). In 1978, 13 conservation zones were established in the Qinling Mountains to protect the Qinling subspecies of giant panda. However, atmospheric transport and deposition of pollutants from urban and vehicle emissions have resulted in enhanced concentrations of heavy metals (HMs) and Persistent organic pollutants in panda habitats (Zheng et al., 2016; Chen et al., 2017a; Chen et al., 2017b; Chen et al., 2018). Pollutants in the atmosphere are removed via wet and dry deposition events (Amodio et al., 2014), resulting in elevated pollutant concentrations in vegetation (e.g., Zhou et al., 2019), soils (e.g., Zheng et al. (2016), and stormwaters (Gunawardena et al., 2013; Liu et al., 2018). Polluted soils are a source of contaminants for other environmental compartments (Sutherland, 2000), including nearby water bodies (Sansalone and Buchberger, 1997).
Pandas may be exposed to chemical pollutants via their food and by drinking contaminated water (Chen et al., 2016). Bamboo is the predominant food of giant pandas, comprising more than 99% of their diet (Edwards et al., 2006), and the wild pandas preferentially drink from flowing waters (Yong et al., 2012). There are no specific data on how much water wild pandas drink daily, but data from Qinling Giant Panda Research Center show that captive pandas consume approximately 5–7.5 L water every day. Little is known about whether surface waters in the Qinling Mountains are polluted, and if so, whether there is a potential environmental risk to pandas.
The total area of the Qinling giant panda habitat is 3,475 km2, but the influence of human activity has divided the habitat into six relatively isolated patches, each with its own panda population (SFA, 2015). The six populations are Xinglongling (XLL), Tianhuashan (THS), Niuweihe (NWH), Jinjiliang (JJL), Pingheliang (PHL), and Qingmuchuan (QMC) populations. The objectives of this study were to 1) explore the risk of HMs in the water body of the habitat of the giant panda, quantify spatial variation in the potential exposure of giant pandas to HMs via surface waters, and assess the risk this exposure poses to different populations and 2) classify HMs in surface waters in order to identify possible sources of contamination. The study focuses on four non-essential metals (lead [Pb], cadmium [Cd], arsenic [As], and mercury [Hg]), five essential metals (copper [Cu], zinc [Zn], manganese [Mn], chromium [Cr], and nickel [Ni]), and five of the six giant panda populations (i.e., the QMC population was excluded).
Materials and methods
Study area
Five nature reserves in the Qinling Mountains (105°29′29″–108°47′57″E, 32°50′18″–34°00′18″N), each home to a panda population, were investigated: Foping Nature Reserve (XLL population), Tianhuashan Nature Reserve (THS population), Niuweihe Nature Reserve (NWH population), Crown Mountain Provincial Nature Reserve (JJL population), and Pingheliang Provincial Nature Reserve (PHL population) (Figure 1). Each nature reserve is categorized into core and buffer zones. The core zones support rare and endangered wildlife, and access is strictly controlled. Access is only allowed for scientific research and, then, only if special approval is granted. Buffer zones surround the core zones, and their purpose is to mitigate external impacts on the core area. Again, access is restricted, and only scientific research and observation is allowed (Chen et al., 2018).
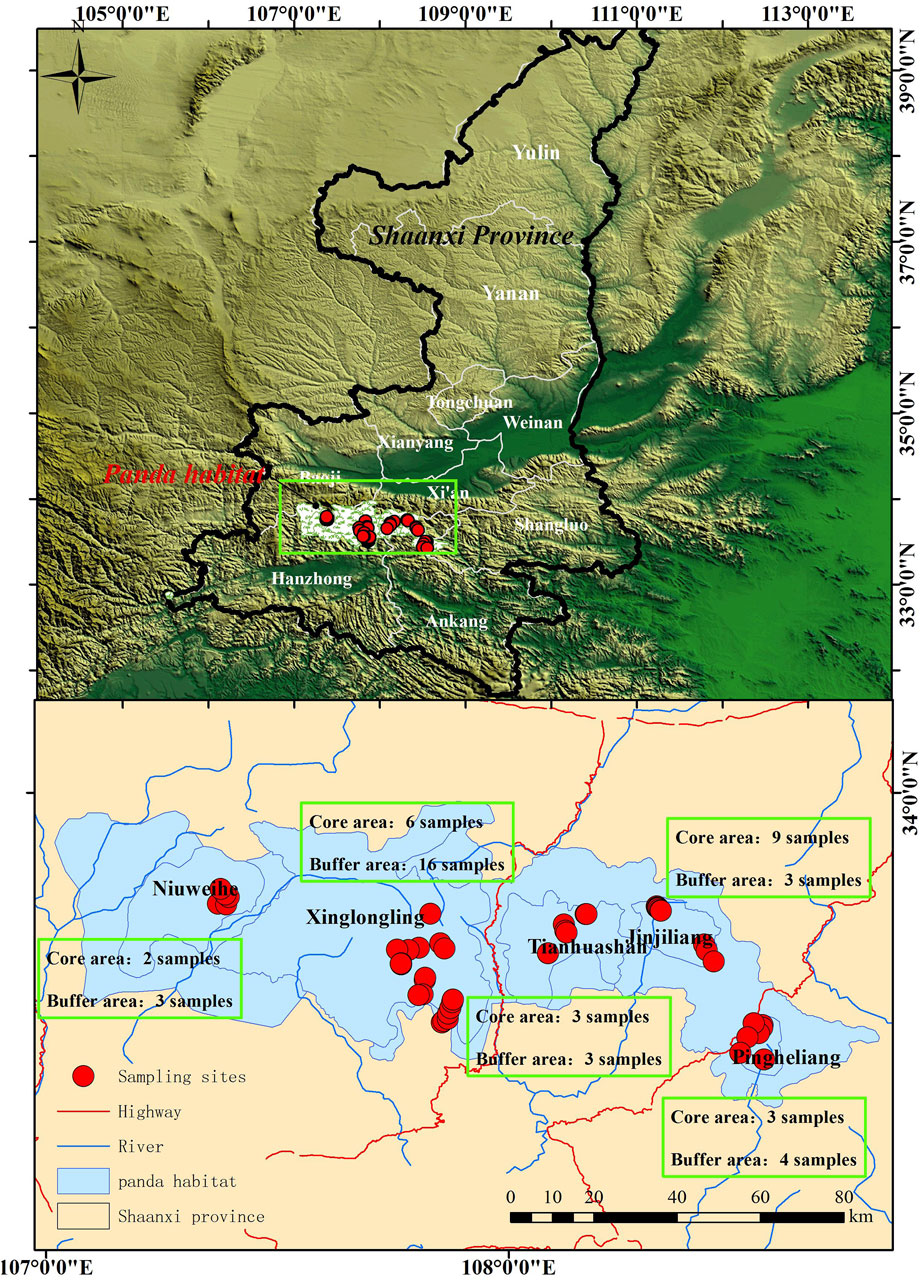
Figure 1. Water sample collection sites in five nature reserves in the Qinling Mountains. Each reserve supports a separate giant panda population: Niuweihe, Xinglongling, Tianhuashan, Jinjiliang, and Pingheliang. Samples were taken from the core protected area and surrounding buffer area of each reserve.
Sample collection, preparation, and analysis
A total of 52 water samples were collected from streams and rivers in core (n = 23) and buffer (n = 29) zones across the five nature reserves (Figure 1). Before collecting the samples, 150-mL polyethylene narrow-mouth bottles were washed with ultra-pure water and rinsed 2–3 times with stream or river water. After collection, 0.05–0.1 mol/L nitric acid was added to each sample before they were placed in a foam incubator with ice packs ready for transporting to the laboratory. The samples were processed by first filtering through a 0.45-µm-pore size filter using a Millipore filtration unit. Then, 100-mL samples were added to a 150-mL polytetrafluorethylene beaker, to which was added 5 mL GR-grade nitric acid. All 52 samples plus 4 blank controls were prepared and then digested using an electric hot plate at 90°C–95°C and evaporated to 15–20 mL. After digestion, the samples were diluted to 25 mL with ultra-pure water and stored at −4°C prior to analysis.
Metal concentrations were measured by atomic absorption spectroscopy (AAS; ZEEnit 700 P, Analytik Jena, Germany). As and Hg were measured using the HS55 Hydride System, and the other elements were measured by graphite furnace AAS. All concentrations of metals were expressed in micrograms per liter (μg/L). The standard reference material recoveries were within 10% of the certified values, and the standard reference materials were performed in triplicate for all analyses.
GIS spatial analysis
The spatial distributions of metal concentrations were visualized using a geographic information system (GIS) (Hou et al., 2017). The HM concentrations were normalized by logarithm and Box–Cox transformation before using the Geostatistical Analyst tool (ArcMap 10.5; ESRI Inc., United States). The concentration data for five metals (Pb, Cd, Cr, Ni, and As) were not normalized by these procedures, and therefore, the disjunctive kriging method was adopted for spatial interpolation (Supplementary Table S1). The appropriate statistical module was selected based on the distribution and prediction errors of the data. The optimal model was selected when the root mean square error was small and close to the average standard error, the mean standardized error was close to 0, and the root mean square standardized error was close to 1.
Ecological risk assessment
The measured concentrations of HMs were compared with the Chinese Environmental Quality Standards for Surface Water (GB3838-2002). Because the study areas were nature reserves, they were expected to be of the class-I standard for each metal in this study. The HM pollution index (HPI) and the comprehensive pollution index were calculated.
The HPI provides a composite measure for the influence of individual HMs on the overall water quality (Reza and singh, 2010). The HPI model (Mohan et al., 1996) is given by Equation 1, and this model was used in the evaluation of HMs in water at home and abroad (Mohan et al., 2008; Wanda and Gulula, 2012; Qu et al., 2018).
where i is the ith heavy-metal parameter; Qi is the sub-index of the ith heavy metal; Wi is the unit weight of the ith heavy metal, reflecting its relative importance; and n is the number of heavy metals considered. Qi is a function of the ratio of the measured concentration (Ci μg/L) to the maximum permissible standard (Hi μg/L) for each metal (i.e., class-I standard limit value of GB3838-2002; Equation 2). Wi is inversely proportional to the maximum permissible standard, and K is a proportionality constant, which takes the value 1 (Equation 3). The critical HPI for drinking water is 100 (Prasad and Bose, 2001), and HPI values greater than 100 indicate potential risk.
The comprehensive pollution index (R; Equation 4) is the average ratio of the measured concentration to the maximum permissible standard for each metal (Ri; Equation 5).
When R is less than 1, there is no risk from HM pollution. Values of R between 1 and 2 indicate mild HM pollution risk, values between 2 and 3 indicate moderate pollution risk, and values greater than 3 indicate very high pollution risk.
Multivariate statistical analysis
Data normality was assessed with Tukey’s test, two-way ANOVA was selected for data with a normal distribution, and Tukey’s test was selected for data that had a non-normal distribution (Li and Feng, 2012; Zheng et al., 2016). The statistical analyses were performed using the statistical package SPSS 20.0 (IBM SPSS Statistics, IBM Corp., United States).
PMF model
Positive matrix factorization (PMF), proposed by Paatero and Tapper (1994), is a receptor model that explicitly addresses non-optimal scaling in source apportionment for environmental variables. The PMF model has been used to identify source profiles for the HMs and polycyclic aromatic hydrocarbons in environmental samples (Huston et al., 2012; Taghvaee et al., 2018). Following the study by Zhao et al. (2020), we use the United States Environmental Protection Agency (USEPA) PMF 5.0 software program (REF) to calculate the source profiles for HMs in water sampled from the panda habitat.
Results
Heavy-metal concentrations
The descriptive statistics for Cu, Zn, Mn, Pd, Cr, Cd, Ni, As, and Hg in water samples are shown in Table 1. The relationship between the measured concentrations of HMs in surface waters and maximum permissible standards is shown in Figure 2. The maximum permissible water quality standard of HMs was compared to national guide values from the Ministry of Environmental Protection (MEPC) of the People’s Republic of China. Regarding HM concentrations in water, the mean values except for Hg (Cu: 2.36 μg/L; Zn: 4.05 μg/L; Mn: 3.26 μg/L; Pb: 3.16 μg/L; Cd: 0.02 μg/L; Cr: 1.96 μg/L; Ni: 1.33 μg/L; and As: 1.96 μg/L) were all below the surface water quality standards. Although not exceeding the standard, the concentrations of nine heavy metal were significantly higher in the buffer zones than those in the core zones (Cu: 3.75 times; Zn: 2.15 times; Mn: 5.18 times; Pb: 2.40 times; Cd: 3.00 times; Cr: 1.69; Ni: 5.36 times; As: 3.00 times; and Hg: 1.60 times) except cadmium (Table 1). The results of the study on the concentration of HMs in water are basically consistent with the results of other research studies (Zhao et al., 2020). Metal concentrations were higher in buffer areas than in core protected areas, which is consistent with the impact of human activities (Mondal et al., 2010). The mercury level exceeded the maximum permissible water quality standard of 0.05 μg/L, and this standard exceeded in the core zones of all the reserves studied except the Foping National Reserve (Figure 2).
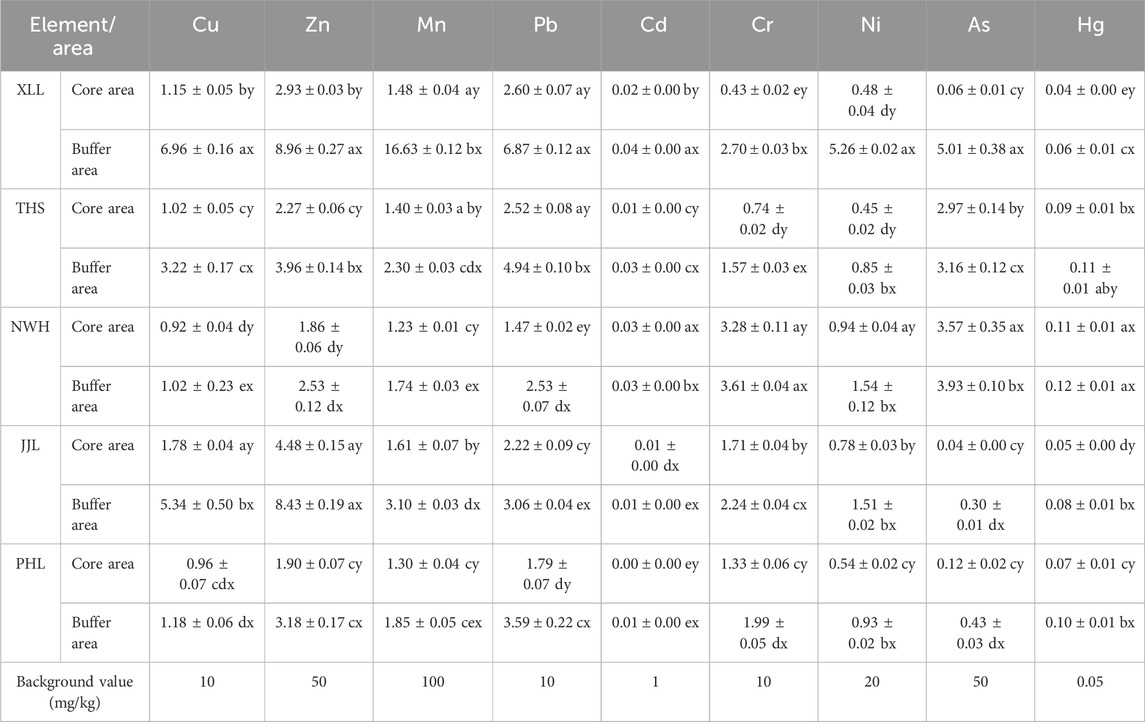
Table 1. Concentrations of Cu, Zn, Mn, Pb, Cd, Cr, Ni, As, and Hg in water samples collected from different population distribution areas of Qinling giant panda habitats. Data (mean ± standard error; µg/L) with lowercase letters (a–e) indicate significant differences at different core areas or different buffer areas, and with x and y indicate significant differences between the core and buffer areas according to Kolmogorov–Smirnov Z. All abbreviations are described in the table.
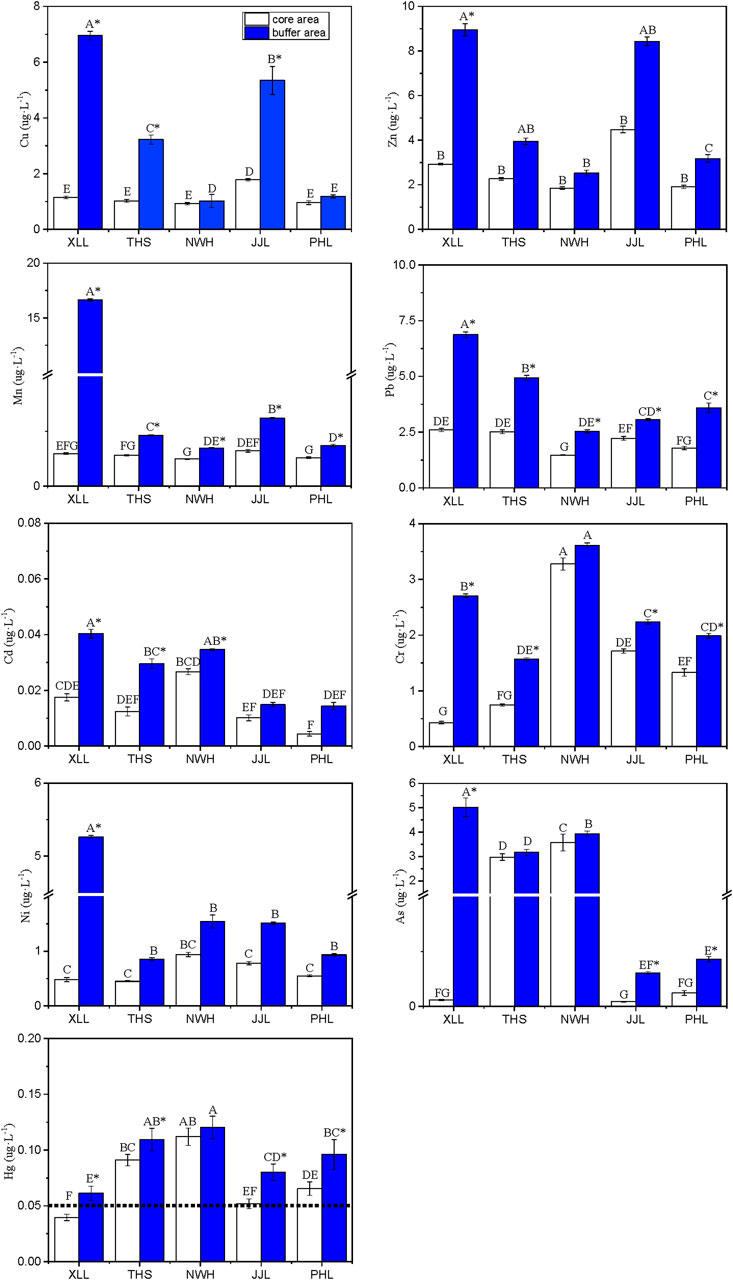
Figure 2. Concentrations (mean ± standard error; µg/L) of nine heavy metals in water samples collected from the habitats of five populations of the giant panda in the Qinling Mountains, Niuweihe (NWH), Xinglongling (XLL), Tianhuashan (THS), Jinjiliang (JJL), and Pingheliang (PHL). Water samples were taken from surface waters in the core protected area (white bars) and surrounding buffer area (blue bars). Different lowercase letters (a–e) over the blue bars indicate significant differences among core areas, and different uppercase letters (A–E) over red bars indicate significant differences among buffer areas. * indicates significant differences between core and buffer areas. The dotted horizontal line is the maximum permissible concentration for each metal.
Spatial variation in metal concentrations
There was significant spatial variation in the concentrations of HMs in surface waters (Figure 2). Overall, the concentrations of all HMs were significantly higher in surface water collected from buffer zones than in water collected from the core zones (two-way ANOVA: F1, 42 ≥ 9.21; p < 0.01) and significantly different between reserves (two-way ANOVA: F4, 42 ≥ 4.53; p < 0.01).
For all metals except Cr and Hg, the highest concentrations of metals measured were in surface water samples from the buffer zone of XLL and the highest concentrations of Cr and Hg in water samples from the buffer zone of HWH. Focusing on surface waters in the core zones, the highest concentrations of Cd, Cr, Ni, As, and Hg were from NWH; the highest concentrations of Cu, Zn, and Mn were from JJL; and the highest concentrations of Pb were from XLL (Figure 2).
The spatial distribution characteristics of different HMs are shown in Figure 3. The distribution characteristics of Cu, Zn, Mn, and Pb were similar, and the high-value area was found in the surrounding area of XLL. The distribution characteristics of Cr and Ni were also similar, and the high-value area was found in the buffer zone of XXL and NWH. The most serious zone of Hg was the buffer area of PHL.
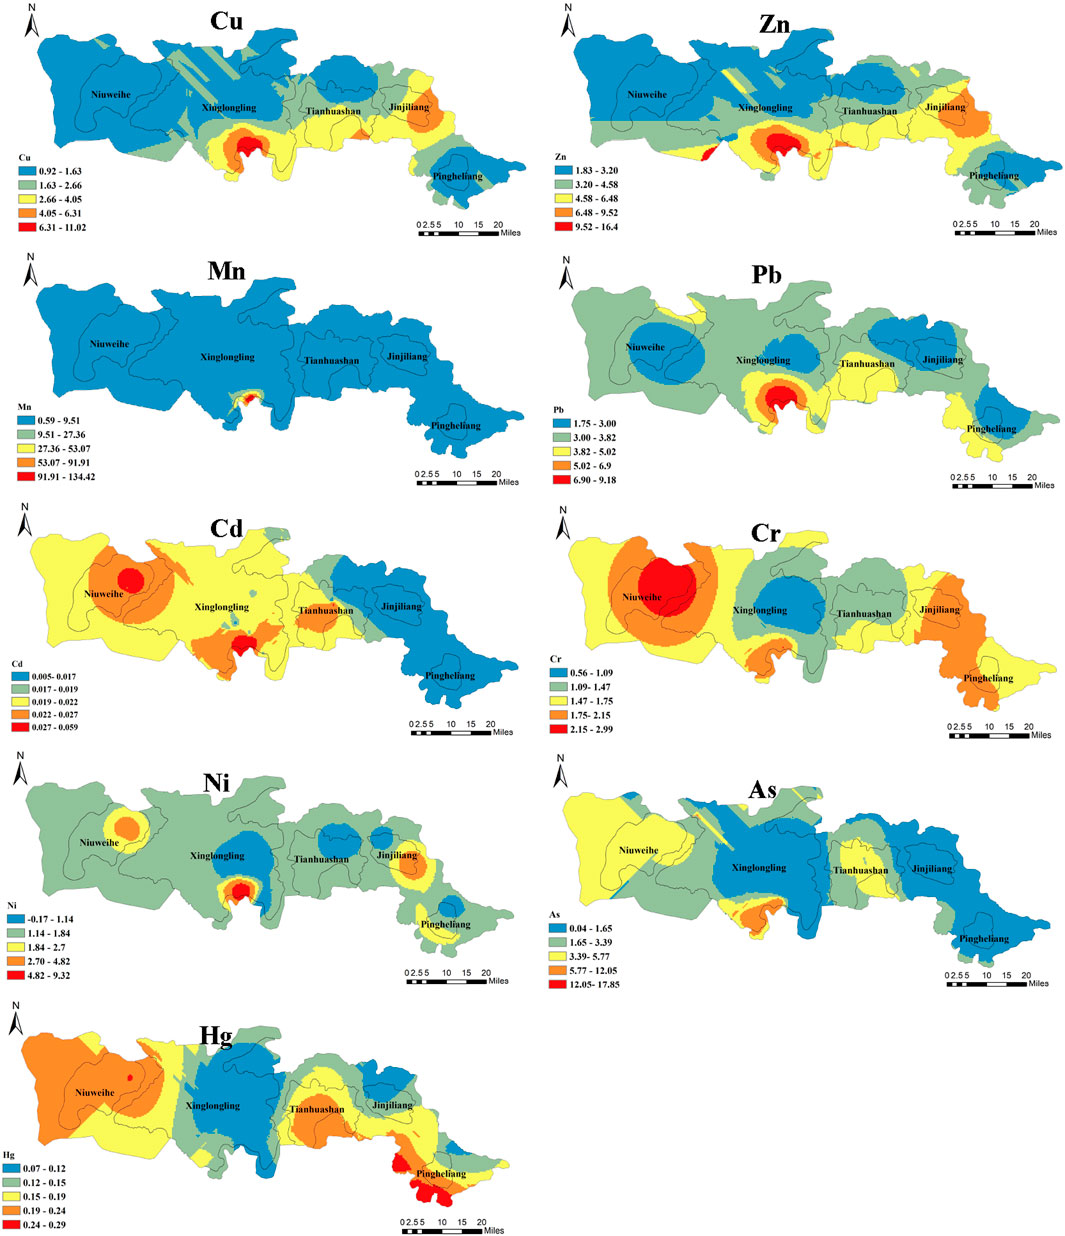
Figure 3. Spatial distribution of nine heavy metals in water samples collected from surface waters in the Qinling giant panda habitat.
Assessing ecological risks
The average HPI calculated using the concentrations of all nine heavy metals varies within and between nature reserves (Figure 4). The HPI results of the main stream of the Weihe River in Shaanxi and its branches in 2016 ranged from 29.2 to 40.8 (Wang et al., 2021), all of which were less than 100 and consistent with the results of our study. The index was significantly higher for buffer zones than core zones (two-way ANOVA: F1,42 ≥ 6.25; p < 0.01) and was highest for surface water samples from NWH (two-way ANOVA: F4,42 > 3.26; p < 0.01). However, in no case did the index exceed 100, and therefore, no unacceptable risk of HM pollution was detected.
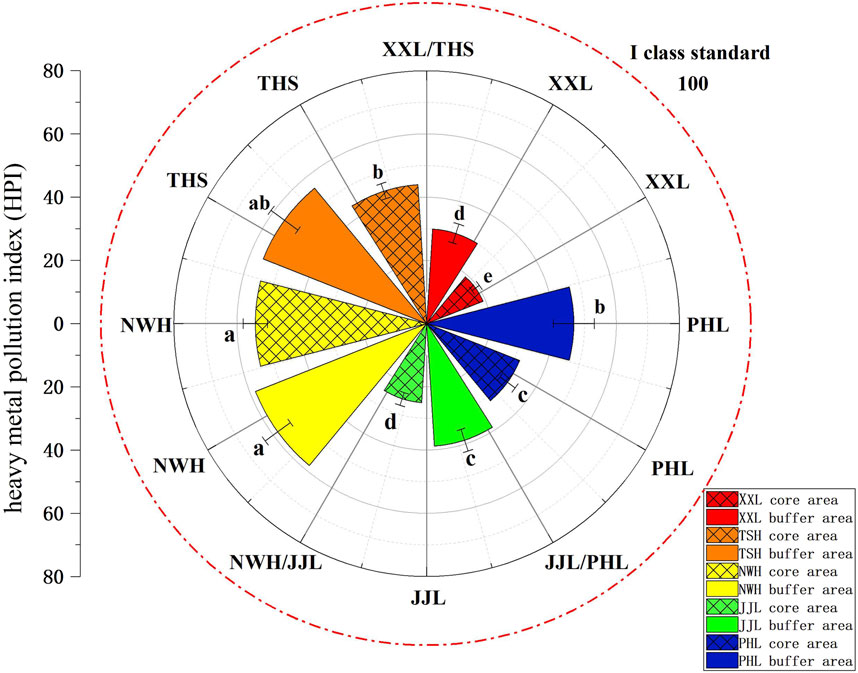
Figure 4. Heavy metal pollution index (HPI) for water samples collected from the core and buffer zones of five giant panda population habitats in the Qinling Mountains: NWH, XLL, THS, JJL, and PHL. Dotted line denotes class I standard. Data (µg/L) are presented as the mean ± standard error. All within-reserve core zone vs buffer zone comparisons were statistically significant. Different lowercase letters (a–e) indicate significant differences.
The analysis result of the comprehensive pollution index showed that the Ri values of the nine heavy metals in water bodies were all less than 1, suggesting that the water body in the research area was in a good state at the present stage, but mercury pollution, especially in the buffer areas, should raise concerns (Figure 5). Mercury, as a highly toxic and unnecessary element, could accumulate in the body after long-time exposure, causing tissue and organ lesions and canceration and then threaten the survival and health of rare wild pandas (Khazaee et al., 2016). In addition, it is worth noting that Ri values in the buffer zone of XLL are generally high, especially for Pb and Cu pollution (Figure 5), because the content of Cu and Pb in natural water was low, and the mode of migration was mainly attached to suspended solids. The comprehensive pollution index (R) also varied significantly within and between reserves (two-way ANOVA: F4,42 ≥ 7.49; p < 0.01; Figure 6) but in all cases was less than 1, indicating no unacceptable HM risk.
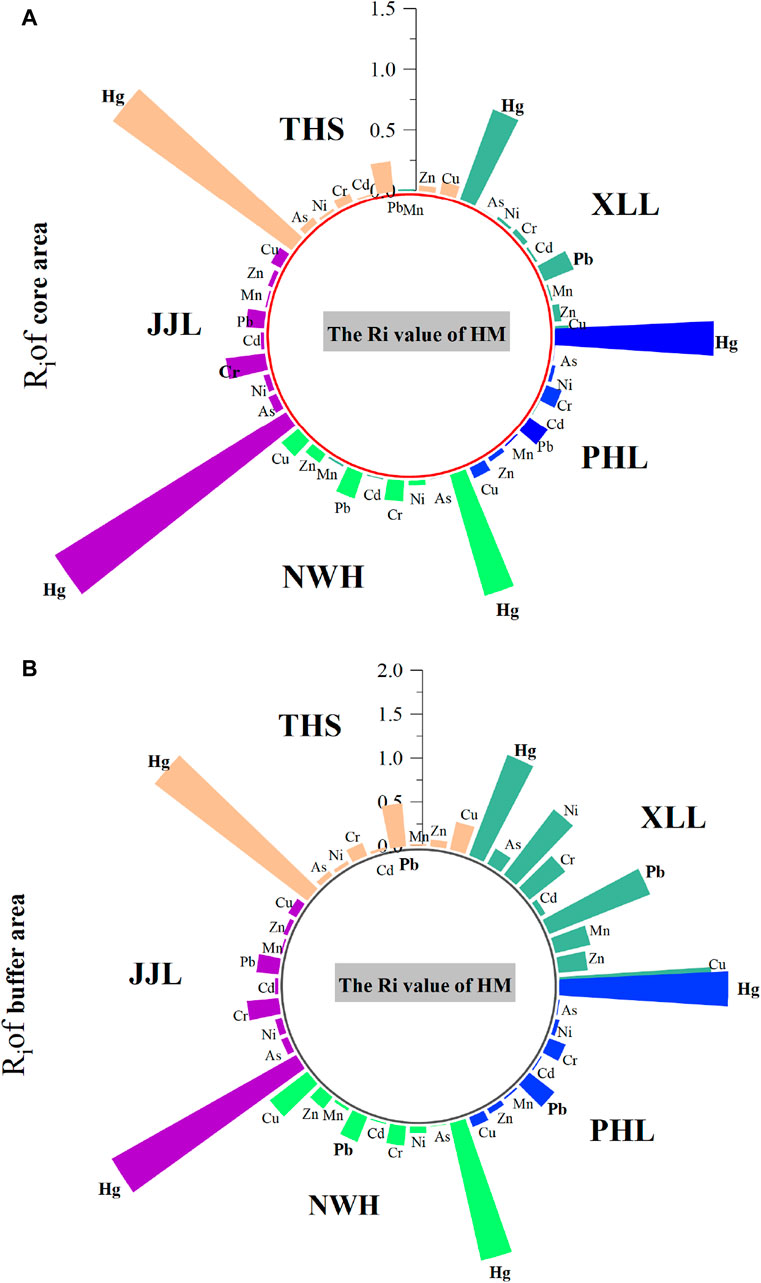
Figure 5. Ri value of heavy metals in water samples taken from five areas of Qinling giant panda habitats: NWH, XLL, THS, JJL, and PHL. (A) denotes core area, and (B) denotes buffer area.
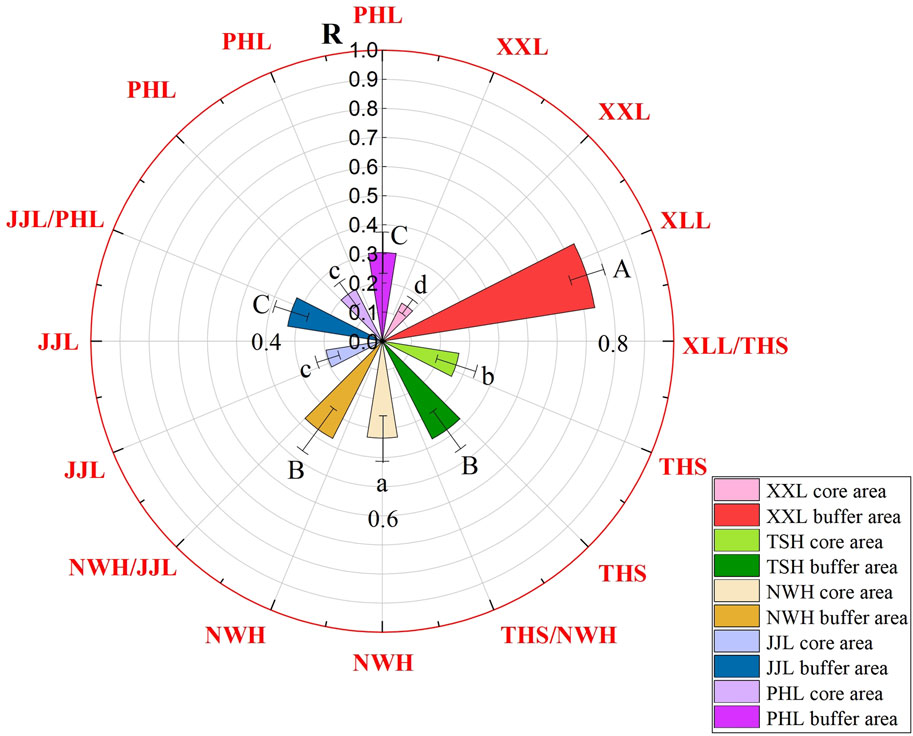
Figure 6. Comparison of the comprehensive heavy-metal pollution index (R) for surface water samples taken from five areas of Qinling panda habitats: NWH, XLL, THS, JJL, and PHL. Red line denotes class I standard. Data (µg/L) are presented as the mean ± standard error. Different lowercase letters (a–c) indicate significant differences among core areas, and different uppercase letters (A–C) indicate significant differences among buffer areas. All comparisons between core and buffer areas within the same area were significantly different.
Identifying potential heavy metal sources
The PMF model results showed that HMs present in surface water collected from the panda habitats were grouped into three main factors, implying three distinct sources of metal contamination (Figure 7). Factor 1 contributed 17% to the total HM concentrations and was characterized by high concentrations of Cd, Cr, As, and Hg. Factor 2 contributed 42% to the total heavy metal concentrations and was characterized by high concentrations of Cu, Zn, Pb, Cd, Cr, and Hg. Factor 3 accounted for 41% of the total HM concentrations and was characterized by high concentrations of Cu, Mn, and Ni.
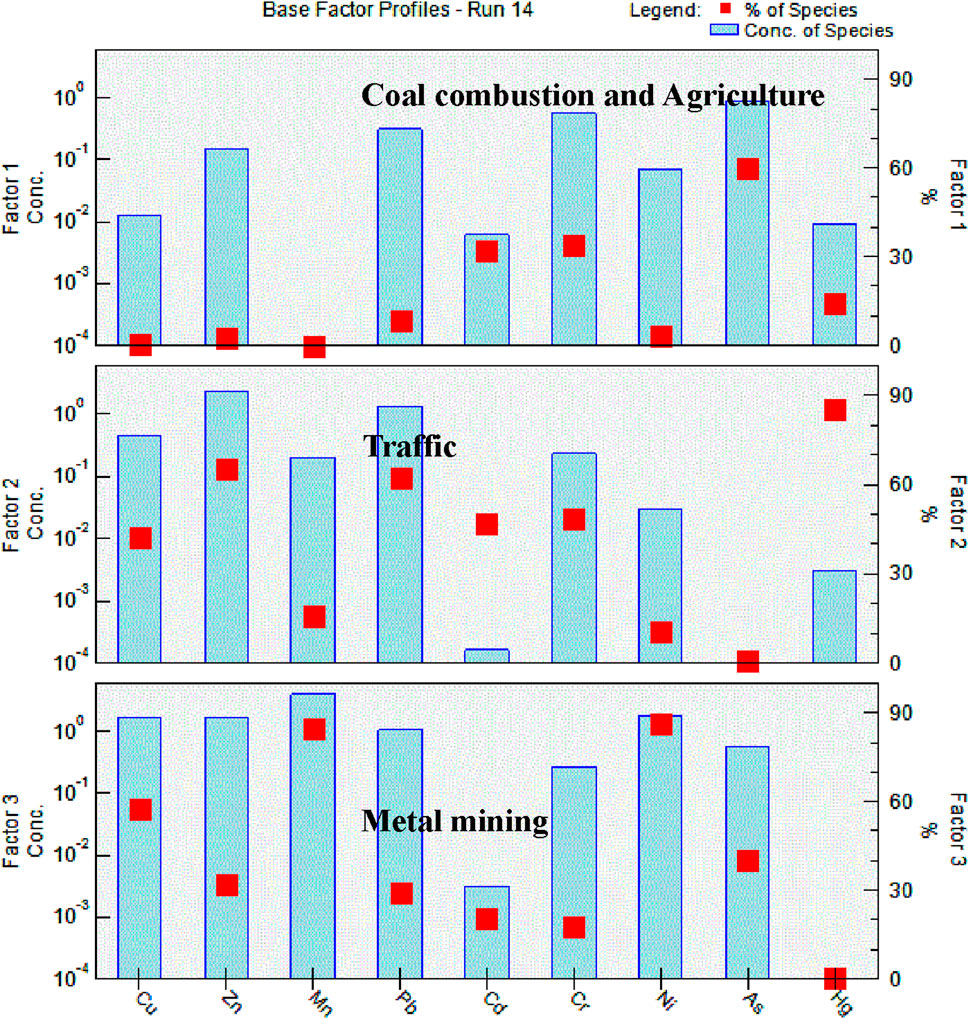
Figure 7. Source profiles of heavy metals and related pollutant sources obtained from the PMF analysis.
Discussion
The first objective of this study was to explore the potential exposure of giant pandas to HMs via surface water and to assess the risk to five different populations in the Qinling Mountains. The mercury level exceeded the maximum permissible standard; the most serious zones were the buffer areas of NWH, THS, and PHL, and the “hotspots” are shown in Figure 3. Mercury exposure has been linked with increased incidence of several illnesses. For example, mercury damages the central nervous system and endocrine system of animals; it causes immunotoxicity and can have transgenerational effects (Alvarez et al., 2006; Vieira et al., 2009; Khazaee et al., 2016). A classic example of mercury toxicity is Minamata disease (Kurland et al., 1960; Michelle et al., 2015). In addition, it is generally higher in the buffer zone of XLL, especially Cu and Pb. Even though the concentration of these elements did not exceed the standard (maximum concentration of Cu = 6.96 μg/L < 10 μg/L; maximum concentration of Pb = 6.87 μg/L < 10 μg/L), there is potential for adverse effects as these elements can accumulate in tissues and biomagnify along food chains (Burger, 2008; Brahmia et al., 2013; Tang et al., 2013; Tang et al., 2014). Lead is one of the five most toxic elements (Hg, Cr, Cd, As, and Pb), and Pb exposure has been linked with the increased incidence of reduced reproductive function (Brahmia et al., 2013; Neal and Guilarte, 2013; Uddh-Soderberg et al., 2015). Previous research has demonstrated that giant pandas are exposed to metals (e.g., cadmium, lead, arsenic, and mercury) via soil, food, and water, and that this may be linked to health risks (Fan et al., 2002; Mark and Robert, 2002; Filgueiras et al., 2004; Sundaray et al., 2011; Zheng, 2016). The HPI and R were used to assess the risk of multiple metal exposure. However, the results of HPI and R indicated an acceptable risk from metal contamination for any of the study reserves.
The second objective of this study was to identify the possible sources of HM contamination in the giant panda habitats. The PMF model identified three factors of metals. The first factor was characterized by high levels of Cr, As, Cd, and Hg and made a significant contribution (17%) to the total HM concentrations. High concentrations of Cr, As, and Hg are commonly considered to be indicators of coal combustion and waste incineration (Pirrone et al., 2010; Yang et al., 2011; Duan and Tan, 2013), and the concentrations of these metals were highest in NWH. This region has a larger rural population and agricultural land than the other reserves. Agricultural and domestic activities such as cooking with coal and incinerating rubbish are a likely source of local pollution (Huang et al., 2015). Previous research has shown that Cd in the environment is derived from the wear of automobile tires and car body parts (Johansson et al., 2009), as well as from agricultural activities, including the application of chemical fertilizers (Alloway, 1990; Yang et al., 2011). Factor-1 HM sources were therefore categorized as coal combustion and agriculture sources.
Factor 2, which contributed 42% of the total HM concentrations, featured high Cu, Zn Pb, Cd, Cr, and Hg loads. Vehicle emissions and oil pump wear are the important sources of lead (Lee et al., 2006; Yang et al., 2011). With the rapid increase in the number of vehicles and road infrastructure in China, pollution from traffic increases in severity and extent (Johansson et al., 2009; Feng et al., 2011; Zhang et al., 2015; Men et al., 2018). Although the majority of traffic-related pollution is generated in urban areas, rural highways are also an important source of vehicle emissions. Several highways cross giant panda habitats, and recent studies have shown that they are an important pollutant source (Zheng et al., 2016). Brake-pad wear is a source of Cu in the environment (Fujiwara et al., 2011), and tire wear is a major source of Zn (Block, 2005; Nabulo et al., 2006; Nabulo et al., 2010) Ygor et al. (2022) indicated that traffic was the main source of Hg contamination of road-side soils. Factor-2 HM sources were therefore categorized as intense traffic.
The third factor was metal mining sources, which accounted for 41% of the total HM concentrations. High concentrations of Cu, Mn, and Ni have been linked to metal mining, and the Qinling Mountains are rich in minerals including Cu, Mn, and Ni (Zhu et al., 1992). Metal mining, weathering of rocks, and soil erosion were therefore identified as important sources of factor-3 metals in this region.
Conclusion
This study demonstrated that surface waters in panda conservation areas are contaminated by HMs, and the mercury concentration exceed water quality standards in the core protected areas of three reserves, especially NWH. As shown in the results, the traceability of sources to regional risks has been greatly improved by coupling PMF models with calculated risks, and therefore, HM monitoring combined with risk source apportionment can serve as a basis for pollutants and risk controls aimed at achieving the better management of habitats and improving wildlife health. The results of the PMF analysis showed that coal combustion, waste incineration, and fertilizer use were potential sources of contamination by Hg, which is of particular concern in the agricultural area. Since the Qinling giant panda habitat is vast, it presents unusual conservation challenges. Environmental pollution compromises efforts to conserve the giant panda, and measures need to be put in place to control pollution sources, many of which may be some distance away from protected areas. Because of the spatial scale of the area to be protected and the potential pollution control measures, it is proposed that a special conservation zone such as the Giant Panda National Park that crosses administrative and geographic boundaries be established. In addition, long-term monitoring of pollution sources and risk assessment should be undertaken in order to effectively control and mitigate regional pollution.
Data availability statement
The raw data supporting the conclusion of this article will be made available by the authors, without undue reservation.
Author contributions
Y-JZ: conceptualization, data curation, formal analysis, funding acquisition, investigation, methodology, project administration, resources, software, supervision, validation, visualization, writing–original draft, and writing–review and editing. Y-PC: project administration and writing–review and editing. Y-Z: investigation and writing–review and editing. LM: software and writing–review and editing. W-GL: investigation and writing–review and editing.
Funding
The author(s) declare that no financial support was received for the research, authorship, and/or publication of this article. This research was supported by a project from State Key Laboratory of Loess and Quaternary Geology and Institute of Earth Environment, Chinese Academy of Sciences (ZZBS1303).
Acknowledgments
This research was supported by a project from the State Key Laboratory of Loess and the Quaternary Geology and Institute of Earth Environment, Chinese Academy of Sciences (ZZBS1303).
Conflict of interest
The authors declare that the research was conducted in the absence of any commercial or financial relationships that could be construed as a potential conflict of interest.
Publisher’s note
All claims expressed in this article are solely those of the authors and do not necessarily represent those of their affiliated organizations, or those of the publisher, the editors, and the reviewers. Any product that may be evaluated in this article, or claim that may be made by its manufacturer, is not guaranteed or endorsed by the publisher.
Supplementary material
The Supplementary Material for this article can be found online at: https://www.frontiersin.org/articles/10.3389/fenvs.2024.1430662/full#supplementary-material
References
Alloway, B. J., Jackson, A. P., and Morgan, H. (1990). The accumulation of cadmium by vegetables grown on soils contaminated from a variety of sources. Sci. Total Environ. 91, 223–236. doi:10.1016/0048-9697(90)90300-j
Alvarez, M. D. C., Murphy, C. A., Rose, K. A., McCarthy, I. D., and Fuiman, L. A. (2006). Maternal body burdens of methylmercury impair survival skills of offspring in Atlantic croaker (Micropogonias undulatus). Aquat. Toxicol. 80 (4), 329–337. doi:10.1016/j.aquatox.2006.09.010
Amodio, M., Catino, S., Dambruoso, P. R., de Gennaro, G., Di Gilio, A., Giungato, P., et al. (2014). Atmospheric deposition: sampling procedures, analytical methods, and main recent findings from the scientific literature. Adv. Meteorology 2014, 1–27. doi:10.1155/2014/161730
Block, J. (2005). Environmental exposure of road borders to zinc. Sci. Total Environ. 348 (1-3), 173–190. doi:10.1016/j.scitotenv.2004.12.073
Brahmia, Z., Scheifler, R., Crini, N., Maas, S., Giraudoux, P., and Benyacoub, S. (2013). Breeding performance of blue tits (Cyanistes cæruleus ultramarinus) in relation to lead pollution and nest failure rates in rural, intermediate, and urban sites in Algeria. Environ. Pollut. 174, 171–178. doi:10.1016/j.envpol.2012.11.028
Burger, J. (2008). Assessment and management of risk to wildlife from cadmium. Sci. Total Environ. 389, 37–45. doi:10.1016/j.scitotenv.2007.08.037
Chen, Y. P., Ellison, A. M., and Lu, Y. L. (2018). Establish a special conservation zone for the captive giant panda. Ecosyst. health Sustain. 4 (2096-4129), 29–33. doi:10.1080/20964129.2018.1455990
Chen, Y. P., Maltby, L., Liu, Q., Song, Y., Zheng, Y. J., Ellision, A. M., et al. (2016). Captive pandas are at risk from environmental toxins. Front. Ecol. Environ. 14 (7), 363–367. doi:10.1002/fee.1310
Chen, Y. P., Zheng, Y. J., Liu, Q., Ellison, A. M., Zhao, Y., and Ma, Q. Y. (2017a). PBDEs (polybrominated Diphenyl Ethers) pose a risk to captive giant pandas. Environ. Pollut. 226, 174–181. doi:10.1016/j.envpol.2017.04.023
Chen, Y. P., Zheng, Y. J., Liu, Q., Song, Y., An, Z. S., Ma, Q. Y., et al. (2017b). Atmospheric deposition exposes Qinling pandas to toxic pollutants. Ecol. Appl. 27, 343–348. doi:10.1002/eap.1494
Duan, J., and Tan, J. (2013). Atmospheric heavy metals and arsenic in China: situation, sources and control policies. Atmos. Environ. 74, 93–101. doi:10.1016/j.atmosenv.2013.03.031
Edwards, M. S., Zhang, G., Wei, R., and Liu, X. (2006). “Nutrition and dietary husbandry,” in Giant pandas: biology, veterinary medicine and management (Cambridge University Press), 101–158.
Fan, H. Y., Zhang, W., Lin, Y. X., and Lai, X. K. (2002). Speciation analysis for trace copper in Pearl River. J. Anal. Sci. 18 (6), 496–498. doi:10.1007/s11670-002-0022-7
Feng, J. F., Wang, Y. X., Zhao, J., Zhu, L. Q., Bian, X. M., and Zhang, W. J. (2011). Source attributions of heavy metals in rice plant along highway in Eastern China. J. Environ. Sci. 23 (7), 1158–1164. doi:10.1016/s1001-0742(10)60529-3
Filgueiras, A. V., Lavilla, I., and Bendicho, C. (2004). Evaluation of distribution, mobility and binding behaviour of heavy metals in surficial sediments of Louro River (Galicia, Spain) using chemometric analysis: a case study. Sci. Total Environ. 330, 115–129. doi:10.1016/j.scitotenv.2004.03.038
Fujiwara, F., Rebagliati, R. J., Marrero, J., Gómez, D., and Smichowski, P. (2011). Antimony as a traffic–related element in size–fractionated road dust samples collected in Buenos Aires. Microchem. J. 97 (1), 62–67. doi:10.1016/j.microc.2010.05.006
Gunawardena, J., Egodawatta, P., Ayoko, G. A., and Goonetilleke, A. (2013). Atmospheric deposition as a source of heavy metals in urban stormwater. Atmos. Environ. 68, 235–242. doi:10.1016/j.atmosenv.2012.11.062
Hou, D. Y., O’Connor, D., Nathanail, P., Tian, P., and Ma, Y. (2017). Integrated GIS and multivariate statistical analysis for regional scale assessment of heavy metal soil contamination: a critical review. Environ. Pollut. 231, 1188–1200. doi:10.1016/j.envpol.2017.07.021
Huang, Y., Li, T., Wu, C., He, Z., Japenga, J., Deng, M., et al. (2015). An integrated approach to assess heavy metal source apportionment in peri-urban agricultural soils. J. Hazard. Mater. 299, 540–549. doi:10.1016/j.jhazmat.2015.07.041
Huston, R., Chan, Y. C., Chapman, H., Gardner, T., and Shaw, G. (2012). Source apportionment of heavy metals and ionic contaminants in rainwater tanks in a subtropical urban area in Australia. Water Res. 46, 1121–1132. doi:10.1016/j.watres.2011.12.008
Johansson, C., Norman, M., and Burman, L. (2009). Road traffic emission factors for heavy metals. Atmos. Environ. 43, 4681–4688. doi:10.1016/j.atmosenv.2008.10.024
Khazaee, M., Hamidian, A., Alizadeh Shabani, A., Ashrafi, S., Mirjalili, S., and Esmaeilzadeh, E. (2016). Accumulation of heavy metals and as in liver, hair, femur, and lung of Persian jird (meriones persicus) in darreh zereshk copper mine, Iran. Environ. Sci. & Pollut. Res. 23, 3860–3870. doi:10.1007/s11356-015-5455-x
Kurland, L. T., Faro, S. N., and Siedler, H. (1960). The outbreak of a neurologic disorder in Minamata, Japan, and its relationship to the ingestio of seafood contaminated by mercuric compounds. World Neurol. 1, 70–95.
Lee, C. S., Li, X. D., Shi, W. Z., Cheung, S. C., and Thornton, I. (2006). Metal contamination in urban, suburban, and country park soils of Hong Kong: a study based on GIS and multivariate statistics. Sci. Total Environ. 356 (1-3), 45–61. doi:10.1016/j.scitotenv.2005.03.024
Li, X. P., and Feng, L. N. (2012). Multivariate and geostatistical analyzes of metals in urban soil of Weinan industrial areas, Northwest of China. Atmos. Environ. 47, 58–65. doi:10.1016/j.atmosenv.2011.11.041
Liu, A., Ma, Y. K., Gunawardena, J., Egodawatta, P., Ayoko, G. A., and Goonetilleke, A. (2018). Heavy metals transport pathways: the importance of atmospheric pollution contributing to stormwater pollution. Ecotoxicol. Environ. Saf. 164, 696–703. doi:10.1016/j.ecoenv.2018.08.072
Mark, P. T., and Robert, G. H. K. (2002). Heavy metal contamination of an arid river environment Gruben River, Namibia. Geomorphology 42 (3-4), 311–327. doi:10.1016/s0169-555x(01)00093-9
Men, C., Liu, R., Xu, F., Wang, Q., Guo, L., and Shen, Z. (2018). Pollution characteristics, risk as-sessment, and source apportionment of heavy metals in road dust in Beijing, China. Sci. Total Environ. 612, 138–147. doi:10.1016/j.scitotenv.2017.08.123
Michelle, S. M. O., Kathy, A., Townsend, M. B. B., Anthony, J. R., Daniel, F., Cesar, A. V., et al. (2015). Levels of arsenic, cadmium, lead and mercury in the branchial plate and muscle tissue of mobulid rays. Mar. Pollut. Bull. 94, 251–259. doi:10.1016/j.marpolbul.2015.02.005
Mohan, S., Nithila, P., and Reddy, S. (1996). Estimation of heavy metals in drinking water and development of heavy metal pollution index. J. Environ. Sci. Health Part A Environ. Sci. Eng. Toxicol. 31 (2), 283–289. doi:10.1080/10934529609376357
Mohan, S., Nithila, P., and Reddy, S. (2008). Estimation of heavy metals in drinking water and development of heavy metal pollution index. Environ. Res. Lett. 31, 283–289. doi:10.1080/10934529609376357
Mondal, N. C., Singh, V. P., Singh, V. S., and Saxena, V. (2010). Determining the interaction between groundwater and saline water through groundwater major ions chemistry. J. Hydrology 388 (1-2), 100–111. doi:10.1016/j.jhydrol.2010.04.032
Nabulo, G., Oryem-Origa, H., and Diamond, M. (2006). Assessment of lead, cadmium, and zinc contamination of roadside soils, surface films, and vegetables in Kampala City, Uganda. Environ. Res. 101 (1), 42–52. doi:10.1016/j.envres.2005.12.016
Nabulo, G., Young, S. D., and Black, C. R. (2010). Assessing risk to human health fromtropical leafy vegetables grown on contaminated urban soils. Sci. total Environ. 408 (22), 5338–5351. doi:10.1016/j.scitotenv.2010.06.034
Neal, A. P., and Guilarte, T. R. (2013). Mechanisms of lead and manganese neurotoxicity. Toxicol. Res. 2 (2), 99–114. doi:10.1039/c2tx20064c
Paatero, P., and Tapper, U. (1994). Positive Matrix Factorization: a nonnegative factor model with optimal utilization of error estimates of data values. Environmetrics 5, 111–126. doi:10.1002/env.3170050203
Pirrone, N., Cinnirella, S., Feng, X., Finkelman, R. B., Friedli, H. R., Leaner, J., et al. (2010). Global mercury emissions to the atmosphere from anthropogenic and natural sources. Atmos. Chem. Phys. 10 (2), 5951–5964. doi:10.5194/acp-10-5951-2010
Prasad, B., and Bose, J. (2001). Evaluation of the heavy metal pollution index for surface and spring water near a limestone mining area of the lower Himalayas. Environ. Geol. 41 (1/2), 183–188. doi:10.1007/s002540100380
Qu, L. Y., Huang, H., Xia, F., Liu, Y. Y., Dahlgren, R. A., Zhang, M. H., et al. (2018). Risk analysis of heavy metal concentration in surface waters across the rural-urban interface of the Wen-Rui Tang River, China. Environ. Pollut. 237, 639–649. doi:10.1016/j.envpol.2018.02.020
Reza, R., and Singh, G. (2010). Heavy metal contamination and its indexing approach for river water. Int. J. Environ. Sci. Technol. 7 (4), 785–792. doi:10.1007/bf03326187
Sansalone, J. J., and Buchberger, S. G. (1997). Partitioning and first flush of metals in urban roadway storm water. J. Environ. Eng. 123 (2), 134–143. doi:10.1061/(asce)0733-9372(1997)123:2(134)
SFA (State Forestry Administration) (2015). The 4th national survey report on giant panda in China. Beijing: Science Press.
Sundaray, S. K., Nayak, B. B., Lin, S., and Bhatta, D. (2011). Geochemical speciation and risk assessment of heavy metals in the river estuarine sediments-Acase study: mahanadi basin, India. J. Hazard. Mater. 186 (2-3), 1837–1846. doi:10.1016/j.jhazmat.2010.12.081
Sutherland, R. A. (2000). Depth variation in copper, lead, and zinc concentrations and mass enrichment ratios in soils of an urban watershed. J. Environ. Qual. 29, 1414–1422. doi:10.2134/jeq2000.00472425002900050007x
Taghvaee, S., Sowlat, M. H., Hassanvand, M. S., Yunesian, M., Naddafi, K., and Sioutas, C. (2018). Source-specific lung cancer risk assessment of ambient PM2.5-bound polycyclic aromatic hydrocarbons (PAHs) in central Tehran. Environ. Int. 120, 321–332. doi:10.1016/j.envint.2018.08.003
Tang, W. Z., Zhang, H., Shan, B. Q., and Li, S. (2014). Accumulation and risk assessment of sedimentary trace metals in response to industrialization from the tributaries of Fuyang River System. Environ. Earth Sci. 73, 1975–1982. doi:10.1007/s12665-014-3545-6
Tang, W. Z., Zhao, Y., Wang, C., Shan, B. Q., and Cui, J. G. (2013). Heavy metal contamination of overlying waters and bed sediments of Haihe Basin in China. Ecotoxicol. Environ. Saf. 98, 317–323. doi:10.1016/j.ecoenv.2013.09.038
Uddh-Soderberg, T. E., Gunnarsson, S. J., Hogmalm, K. J., Lindegard, M. J., Boel, G., and Augustsson, A. L. M. (2015). An assessment of health risks associated with arsenic exposure via consumption of homegrown vegetables near contaminated glassworks sites. Sci. total Environ. 536, 189–197. doi:10.1016/j.scitotenv.2015.07.018
Vieira, L. R., Gravato, C., Soares, A. M. C. M., Morgado, F., and Guilhermino, L. (2009). Acute effects of copper and mercury on the estuarine fish Pomatoschistus microps: linking biomarkers to behaviour. Chemosphere 76, 1416–1427. doi:10.1016/j.chemosphere.2009.06.005
Wanda, E. M. M., and Gulula, L. C. (2012). Determination of characteristics and drinking water quality index in Mzuzu City, Northern Malawi. Phys. Chem. Earth 50–52, 92–97. doi:10.1016/j.pce.2012.09.004
Wang, L., Yang, X. F., Guan, J. L., Zhou, C., Ren, J., Meng, R. L., et al. (2021). Distribution and health risk of heavy metals of Weihe River in Shaanxi region. Environ. Prot. Sci. 47 (4), 133–137.
Yang, Z. P., Lu, W. X., Long, Y. Q., Bao, X. H., and Yang, Q. C. (2011). Assessment of heavy metals contamination in urban topsoil from Changchun City, China. J. Geochem. Explor. 108 (1), 27–38. doi:10.1016/j.gexplo.2010.09.006
Ygor, O. S. R., José, G. D., Landim, P. M. B., José, V. E. B., Lucas, C. M., João, P. R. D. S., et al. (2022). Mercury spatiality and mobilization in roadside soils adjacent to a savannah ecological reserve. Environ. Res. 205, 112513. doi:10.1016/j.envres.2021.112513
Yong, L. J., Tang, X. C., and Yong, Y. G. (2012). Study on drinking behavior of wild giant panda in Qinling Mountains. Shanxi For. Sci. Technol. 1, 25–27.
Zhang, H., Wang, Z. F., Zhang, Y. L., Ding, M. J., and Li, L. H. (2015). Identification of traffic-related metals and the effects of different environments on their enrichment in roadside soils along the Qinghai-Tibet highway. Sci. Total Environ. 521-522, 160–172. doi:10.1016/j.scitotenv.2015.03.054
Zhao, Y., Chen, Y. P., Zheng, Y. J., Ma, Q. Y., and Jiang, Y. (2020). Quantifying the heavy metal risks from anthropogenic contributions in Sichuan panda (Ailuropoda melanoleuca melanoleuca) habitat. Sci. Total Environ. 745, 140941. doi:10.1016/j.scitotenv.2020.140941
Zheng, Y. J., Chen, Y. P., Maltby, L., and Jin, X. L. (2016). Highway increases concentrations of toxic metals in giant panda habitat. Environ. Sci. Pollut. Res. 23 (21), 21262–21272. doi:10.1007/s11356-016-7221-0
Zhou, J., Du, B. Y., Wang, Z. W., Zhang, W. T., Xu, L., Fan, X. J., et al. (2019). Distributions and pools of lead (Pb) in a terrestrial forest ecosystem with highly elevated atmospheric Pb deposition and ecological risks to insects. Sci. total Environ. 647, 932–941. doi:10.1016/j.scitotenv.2018.08.091
Keywords: giant panda, habitat conservation, heavy metal, water resource, risk assessment
Citation: Zheng Y-J, Chen Y-P, Zhao Y, Maltby L and Liu W-G (2024) Quantifying the potential health risk of surface waters in the Qinling giant panda habitat. Front. Environ. Sci. 12:1430662. doi: 10.3389/fenvs.2024.1430662
Received: 10 May 2024; Accepted: 08 August 2024;
Published: 27 August 2024.
Edited by:
Caiqing Qin, Xi’an Jiaotong University, ChinaCopyright © 2024 Zheng, Chen, Zhao, Maltby and Liu. This is an open-access article distributed under the terms of the Creative Commons Attribution License (CC BY). The use, distribution or reproduction in other forums is permitted, provided the original author(s) and the copyright owner(s) are credited and that the original publication in this journal is cited, in accordance with accepted academic practice. No use, distribution or reproduction is permitted which does not comply with these terms.
*Correspondence: Yi-Ping Chen, Y2hlbnlwQGllZWNhcy5jbg==