 Luyao Xu1
 Yunhai Guo2
 Limin Yang2Zengkui Li1Ming Kang1Xiaoling Han3Changjiang Chen4Shunfu He5Xiaoyu Hu1Yongcai He1Yuezhong Wang6Zhongyu Li7Jiyong Chen8Pengcheng Geng9Qiang Chen1Shuo Jiang1Jinghua Ma1Xiao Zhang1Ximei Tai1
 Ying Li1,10*
- 1State Key Laboratory of Plateau Ecology and Agriculture, Qinghai University, Xining, China
- 2National Institude of Parasitic Diseases, Chinese Center for Disease Control and Prevention, Shanghai, China
- 3Qinghai Provincial National Park Scientific Research Monitoring and Evaluation Center, Xining, China
- 4Huangyuan Animal Husbandry and Veterinary Station, Xining, China
- 5Xining Wildlife Park, Xining, China
- 6Huangnan Prefecture Animal Disease Prevention and Control Center, Tongren, China
- 7Xunhua County Agricultural, Rural and Science and Technology Bureau, Xunhua, China
- 8Yushu Animal Disease Prevention and Control Center, Yushu, China
- 9Guoluo Animal Disease Prevention and Control Center, Guoluo, China
- 10Qinghai Provincial Key Laboratory of Pathogen Diagnosis for Animal Diseases and Green Technical Research for Prevention and Control, Xining, China
Introduction: The Maximum Entropy models (MaxEnt) is commonly employed for early detection of disease transmission, particularly effective in assessing the risk zones and intensity of tick-borne disease transmission based on climatic factors.
Methods: Utilizing the diversity data of common ticks in Qinghai, along with surveillance statistics tick-borne pathogens of ticks and epidemiological information, we have charted and predicted the prevalence of tick and tick-borne pathogens across Qinghai province.
Results and Discussion: The findings indicate that the pivotal environmental factors influencing the distribution of ticks and tick-borne pathogens include land use and land cover (Lucc), elevation (Elev), annual precipitation (Bio12) and annual mean temperature (Bio1). Notably, for Dermacentor nuttalli, the significant environmental factors accounted for 35.2% for Lucc, 24.7% for Elev and 18.6% for Bio12. In the case of Dermacentor silvaru, the pivotal factors contributed 33.2% for Lucc, 23.7% for Elev and 22.6% for Bio1. For Haemaphysalis qinghaiensis, the key environmental variables were 45% for Elev, 30.9% for Lucc and 18.4% for Bio12. Regarding the pathogens, the environmental factors influencing Borrelia burgdorferi contributed 61.5% for Lucc, 13.3% for Elev and 11.9% for Bio1. For Piroplasmida, the contribution was 62.1% for Lucc, 16.7% for Bio1 and 9.9% for Bio12. Rickettsia was influenced by factors accounting for 34.2% for Lucc, 29.7% for Elev and 17.3% for Bio12, while Anaplasma variables contributed 38.2% for Bio1, 26.6% for Lucc and 18.9% for Bio12. The finding indicated that the three predominantly ticks species (D. nuttalli, D. silvaru, and H. qinghaiensis) and the primary tick-borne pathogens (B. burgdorferi, Piroplasmida, Rickettsia, and Anaplasma) are predominantly concentrated in the source regions of the Yellow River, the Yangtze River, the Lancang River, and the eastern part of the Haixi Autonomous Prefecture. Projected under the ssp245 scenario, there is a notable expansion trend in the risk areas for ticks and tick-borne pathogens These findings are consistent with previous epidemiological studies on major ticks and tick-borne diseases in Qinghai conducted by our laboratory, this suggests the feasibility of using the MaxEnt model to predict the distribution of tick-borne disease transmission and compensates for the paucity of research on the Maxent model in the Qinghai Province.
1 Introduction
Ticks, belonging to the Ixodida class of arachnids, subsist on the blood of humans and various animals. This parasitic species exhibits a wide range of diversity and has a broad distribution, occupying numerous habitats across the globe. They are notably significant as vectors for the transmission several major infectious diseases, as ranking among all arthropod vectors in terms of importance. It is worth mentioning that ticks feed on a variety of hosts, including birds, mammals, reptiles, and amphibians, and in the process, they transmit pathogens capable of inducing detrimental effects within the host organisms (Estrada-Peña et al., 2012). Such adverse reactions may manifest as skin lesions, allergic responses, edema, disorders of nerve conduction, and can potentially lead to sepsis, abortion, anorexia, metabolic disorders and other severe complications, posing risks to public health and significantly impeding the wellbeing and development of livestock (Han, 2018). The prevalence of ticks and tick-borne diseases is extensive throughout China, affecting public health security significantly due to the nation’s diverse climates, complex geographical landscapes, and expansive territories (Zhang, 2012). In recent years, the persistent trend of global warming, coupled with enhanced humidity, has precipitated significant alterations in climate conditions (Zhao et al., 2024). Concurrently, environmental degradation, exacerbated by soil erosion, the contraction of grassland areas, water pollution, and the detrimental effects of invasive alien species, has contributed to a marked decline in biodiversity (Li and Liu, 2002). As a Consequence, the structure and function of ecosystems have been modified, which has led to shifts in the density and distribution of vector species, as well as an escalation in the frequency and infection rate of tick-borne diseases across various Chinese provinces and cities. The ongoing reports of tick-borne diseases from Shandong, Henan, Hebei, and Anhui provinces bear witness to the increasing prevalence of these diseases within China (Zhao et al., 2012). Beyond the traditional spectrum of tick-borne illnesses, which includes forest encephalitis, Crimean-Congo hemorrhagic fever, Lyme disease, and spotted fever, a multitude of novel tick-borne infectious diseases have surfaced. Statistics indicate that nearly 40 new tick-borne pathogens have been documented in China since 1982, among which are B. brucei (a tick-carried pathogen), a newly identified Bunyavirus, the Alongshan virus (ALSV), and Human granulocytic anaplasmosis (HGA) (Fang et al., 2015). Tick-borne maladies are highly communicable and pose significant challenges in terms of prompt diagnose and treatment. This is primarily due to the propensity to occur in secluded regions (Shao, 2021). Current scholarly endeavors extensively concentrate on zoonotic pathogens such as Rickettsia, Anaplasma, B. burgdorferi, and Piriformis, with the discovery of additional pathogens being reported as research progresses. Beyond examining the impact of these pathogens on human and animal health, there is an intensifying focus on comprehending the interplay between ticks, the pathogens they carry, and their surrounding environment. Investigations have revealed that certain pathogens in a given area tend transported by specific tick species. For instance, Anaplasma is predominantly transmitted by the Amblyomma spp. and Ixodes spp. Ticks, Whereas the primary vectors of Francisella tularensis are D. reticulatus in Central Europe, and I. scapularis, D. nuttalli and D. marginatus in China (Parola et al., 2005; Gürcan et al., 2006). Research indicates that landforms plays a significant role in the redistribution of water and heat, which is influenced by elevation and slope orientation, consequently impacting the prevalence of ticks and their hosts (Bi et al., 1997). Materna et al. (2008) have demonstrated that altitude is a crucial factor affecting tick distribution density, with regions below 1,000 m above sea level proving more conducive to their proliferation. In a similar vein, Jacobsen (2014) noted that certain landforms on the southern slopes of Montana, United States, offer a particularly suitable environment for D. andersoni, likely due to variables such as light intensity, temperature, and snow accumulation. Moreover, temperature and humidity are pivotal in governing both the abundance and activity patterns of ticks (Mysterud et al., 2018). Additional studies have highlighted that variations in climate and environmental conditions can significantly influence tick distribution patterns (Liu, 2021; Liu et al., 2021; Yao et al., 2021).
Qinghai, one of China’s highest-altitude provinces, is situated in the northwestern part of country and the northeastern Tibetan Plateau. Characterized by a predominantly plateau landscape, it is interspersed with basins, mountains, and river valleys. The region experiences a continental climate on the plateau, marked by significant temperature fluctuations between day and night, frigid minimum temperatures, intense solar radiation, and sparse, concentrated precipitation. Dominated by animal husbandry, Qinghai is home to a multitude of domesticated and wild animals, along with a rich, which fosters the survival and proliferation of ticks and their associated pathogens. Moreover, being a key route for migratory birds, Qinghai plays a role in the transmission of tick-borne pathogens, when these birds roost and breed in the province during their migratory period, they act as carriers, potentially disseminating infected ticks and pathogens (Wang et al., 2022). The West Asia migratory route through West Asia, encompassing regions in China includes Qinghai, suggests that migratory birds may potentially serve as agents for the dispersal of ticks and tick-borne pathogens in these territories (Hu et al., 2023). Within the Qinghai region, three predominant tick species, namely, D. nuttalli, D. silvarum, and H. qinghaiensis, are prevalent, predominantly inhabiting grasslands with a primary concentration in the northern parts (Gui et al., 2021; Ma et al., 2023). Moreover, these species act as vectors for several significant pathogens, including Anaplasma, Rickettsia, Theileria spp., and Babesia spp. and others, posing a substantial risk to the livestock industry (Zhu et al., 2013; Guo et al., 2021). Thus, due to the above reasons, it is crucial to undertake surveillance efforts and collate data on tick populations and their spatial dissemination. This will enhance our comprehension of the dynamics underlying pathogen transmission, as well as the interplay between vector, pathogen, and the environment.
The ecological niche model discerns the ecological prerequisites of a species by intergrating distribution data with pertinent environmental variables through a specified algorithmic framework. It subsequently projects the findings across diverse spatial and temporal domains to forecast both the actual and potential ranges of the species (Mullins et al., 2011). In contemporary research, ecological niche models have gained extensive application in various fields, including the mapping of invasive species, wildlife conservation, evolutionary biology, assessing the impact of climate change on species distribution and genetic diversity, elucidating the non-random associations between epidemic transmission of infectious diseases and environmental factors, and disclosing transmission patterns as well forecasting transmission risks (Hu et al., 2020). Moreover, ecological niche modeling has been employed to anticipate the likelihood of transmission for zoonotic and parasitic diseases, facilitating the prediction of essential hosts or vectors in disease dissemination and categorizing risks according to the potential extent of distribution (Xing and Hao, 2011). Among the array of modeling tools available, MaxEnt stands out as the preferred choice of researchers due to its superior model precision, user-friendly operation, and straightforward interface (Manel et al., 2001a; Elith et al., 2010). Its independence from thresholds biases and the intuitive nature of its evaluation metric, the area under the curve (AUC) of the receiver operating characteristic (ROC), have contributed to its widespread adoption in model assessment (Liu et al., 2023). For instance, researchers have applied ecological niche modeling to evaluate the suitable habitats of Ornithodoros ticks in the Xinjiang Uygur Autonomous Region, identifying temperature as the predominant factor influencing their distribution and predicting an expansion of their suitable zone in the future (Sun et al., 2022). Similarly, ecological niche modeling has been employed to forecast the potential distributional attributes of H. longhornis. Findings indicate that factors such as vegetation coverage, precipitation, population density, temperature and animal abundance are picotal environmental elements influencing the geographical spread of H. longhornis (He et al., 2022). Beyond Hyalomma scupense, investigations utilizing the MaxEnt model suggest that suitable habitats within Xinjiang are likely to expand under diverse future climate scenarios (Hu et al., 2022). Concurrently, certain studied have emolyed MaxEnt to demonstrate that regions characterized by high levels of precipitation and cooler air temperature are particularly conducive to the habitation of D. nuttalli in Xinjiang (He, 2023). Regarding the transmission of zoonotic diseases, the geographical distribution of essential hosts and vectors in the disease’s life cycle significantly impacts transmission rates. Ecological demands, including environmental factors, play a crucial role in shaping the disease’s distribution. Researchers have applied ecological niche modeling to evaluate the environmental features of suitable habitats, accurately fitting the occurrence of the tick-borne Marpirosis of vector ticks and corroborating the association between H. anatolicum and tick-borne Marpirosis, and susceptible animal populations (Niu et al., 2022). These studies have elucidated the intimate connection between the intermediate host and the environment in the transmission of zoonotic disease, enabling a more holistic analysis by incorporating environmental variables. Nonetheless, such research remains inadequate within Qinghai province. There is a pressing need for further investigation into the interplay between ticks, tick-borne pathogens, and environmental factors. Accordingly, this study integrates data on tick-borne biodiversity, surveillance of tick-borne pathogens, and epidemiological information to delineate the distribution and predict the risk of pertinent ticks and tick-borne illnesses in the Sanjiangyuan regions. It aims to evaluate the risk areas and intensity of tick-borne disease transmission, thereby offering a valuable reference for risk analysis and the development of preventive strategies in extreme climate zones.
2 Materials and methods
2.1 Species distribution points
Species distribution data points utilized in the ecological niche modeling were derived from a compilation of extant survey records, specimen documentation, and databases that have been amassed over time. The dataset categorizes into two distinct types: “presence” data and “absence” data. Currently, the most extensively employed category is the “presence” data, as exemplified by the Global Biodiversity Information Facility (GBIF; www.gbif.org) databases (Manel et al., 2001b; Soberón, 2007). For this research, data on the distribution of ticks and tick-borne pathogens were sourced from our laboratory’s accumulated field survey data, published scientific literature, and pertinent databases, including the GBIF. In instances where records lacked detailed latitude and longitude information, Google Earth was employed to supplement these data points. To mitigate potential bias in sampling of species distribution data, this study resampled the records at a resolution of 30″within a raster to eliminate duplicates.
2.2 Environment variables and filtering
The selection of environmental variables was primarily informed by the factors that constrain the geographical distribution of ticks and tick-borne pathogens, as well as the intercorrelations among these variables. Access to pertinent variables was sourced from the databases including the China Meteorological Science Data Sharing Service Network (http://cdc.cma.gov.cn/home.do), USGS (the U.S. Geological Survey’s Hydro-K data set), Worldclim (http://www.worldclim.org), Resource and Environmental Science Data Platform (https://www.resdc.cn/). Identifying an appropriate subset of environmental variables from a multitude of datasets is crucial initial step in employing ecological niche models for predictive purposes, with the selection of variables directly influencing the precision of the ultimate predictive outcomes.
As shown in Table 1, in the present research, datasets from 21 species were utilized, derived from the bioclimatic data and elevation data provided by Worldclim and the data of Lucc provided by Resource and Environmental Science Data Platform. At the same time, the classification of Lucc and its meanings were explained in Table 2, Given that these variables are incorporated into the modeling software as geographic layers, their selection necessitates an evaluation of both their biological relevance and geographic patterns they represent (Fan et al., 2019). Variables primarily associated with temperature and precipitation, such as bio8 and bio9, bio18 and bio19 were initially excluded. Subsequently, the remaining 19 environmental variables were subjected to a correlation analysis using SDMToolbox (Swets, 1988). Ultimately, climate variables with a Pearson correlation value of less than 0.90 were chosen for spatial comparison and the construction of the model.
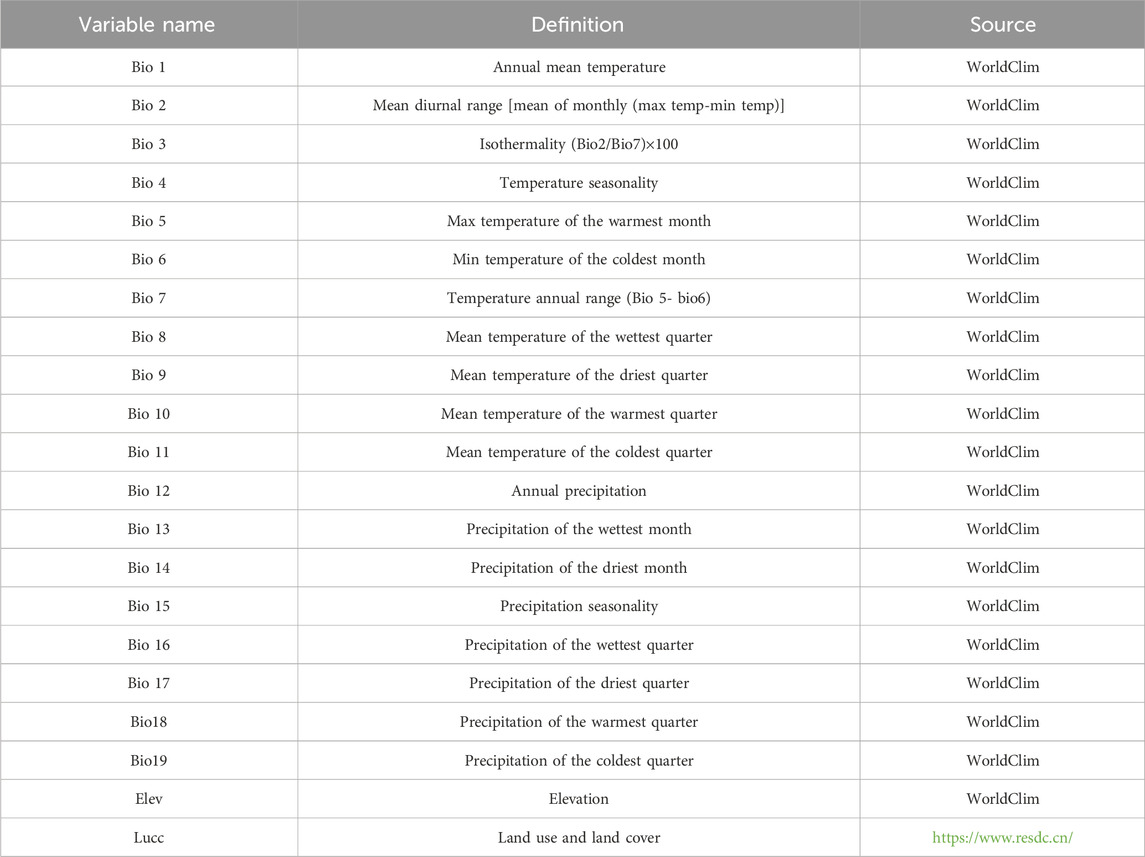
Table 1. Environmental variables and sources.
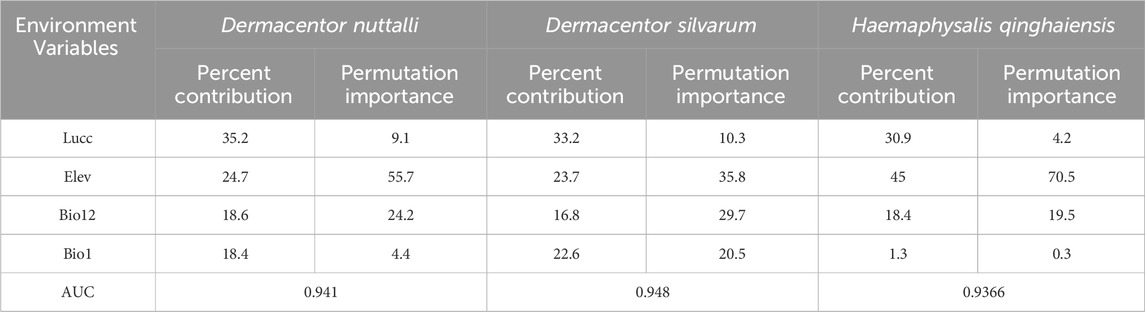
Table 2. Ranking the percentage contribution and importance of each environmental variable to the model of the three types of ticks (%).
2.3 Building the model
The map of China and Qinghai Province used in this study are from the Resource and Environmental Science Data Platform (www.resdc.cn/DOI), and this data is provided free of charge by the website, which is derived from “Xu, Xinliang”. Multi-Year Provincial Administrative Boundary Data in China. Resource and Environmental Science Data Registration and Publication System. doi:10.12078/2023010103. The objective underlying the creation of a model is to ascertain the manner in which influencing factors impact the distribution of species, drawing upon established data. This entails the application of mathematical models to generalize or simulate the ecological niche distribution of species based on their known distribution, followed by predictions for hitherto uncharted target areas as informed by the ecological niche requirements derived from training process. In the model’s execution phase, randomly selected distributed data is utilized, with a partition of 75% allocated for model construction, serving as the training dataset, while the remaining 25% reserved for the validation process, function as the test dataset. The training dataset is instrumental in delineating species distribution, whereas the test dataset is employed to verify the reliability of the predictive outcomes. Subsequently, the MaxEnt model incorporates distribution points of species presence and geographical backdrop data by selecting points where the species is anticipated to be absent within the model’s construction domain. Consequently, the chosen model construction (Zhu and Qiao, 2016).
2.4 Model evaluation
Model assessment and validation are pivotal step that ascertain the credibility of model predictions within the application process. Typically, evaluation metrics for models encompass accuracy, sensitivity, specificity, kappa statistic, True Skill Statistic (TSS), and the Area Under the Curve (AUC). Notably, the AUC is the sole metrics unaffected by the model’s prediction threshold, enabling an assessment of the model the need to define a threshold. MaxEnt models are developed with an analysis of the Receiver Operating Characteristic (ROC) curve, which serves to authenticate the model’s dependability, and this is conducted in tandem with the model construction. Additional validation can be achieved through the use of a completely independent dataset, subject to a secondary ROC analysis. The predictive outcomes were appraised using 25% of test data points, with model assessment conducted via the ROC curve. ROC curve analysis is extensively empolyed in evaluating the performance of medical diagnostic tests and, in recent times, has been extended to the assessment of species distribution prediction models. Its advantage lies in its ability to gauge the accuracy of the prediction model using AUC values, without being constrained by threshold settings (Liu et al., 2011). The area under the curve (AUC) serves as an index of the model’s predictive accuracy, with value ranging from 0 to 1. A higher AUC value signifies stronger model discrimination. Typically, AUC values between 0.5 and 0.7 are considered low, 0.7 to 0.9 as moderate, and values above 0.9 as high (Brown et al., 2017). In an ideal scenario, the model’s predicted range would coincide precisely with the species, resulting in an AUC of 1.
2.5 Predictor variable influence analysis
MaxEnt allows for simultaneous knife-cut analysis of the contribution of variables to the modeling process and build response curves for each variable, thus indirectly reflecting the influence of each variable on the species distribution. In addition, the above results can be further analyzed and projected in relation to future changes in environmental variables.
2.6 Classification of climate suitability
The habitat suitability index for ticks and their tick-borne pathogens was determined through the application of the MaxEnt model. A higher index value indicates a more profound environmental adaptation by the species, with the scale ranging from 0 to 1, also referred to as the risk value. In conjunction, the SDMTools module within the ArcGIS 10.8 software suite was utilized to delineate the extent of each suitable habitat area. The tick risk index was classified into five distinct risk levels by employing the “Jenks’ natural breaks” method for reclassification, distinguishing between high, medium, medium-low risk areas, and those free from risk.
2.7 Climate change impact analysis
In anticipation of future projections, we employed the CIMP6 annual dataset, which aligns with the Chinese future climate scenario and integrates crucial components such as atmospheric, land surface, oceanic, and sea ice models. Specifically, we focused on the spp245 scenario under the BCC-CSM2-MR model (Wu et al., 2019; Xin et al., 2019). This dataset was sourced from the WorldClim environmental database (https://www.worldclim.org/data/cmip6_clim30s). To assess prospective land use and land cover (Lucc) scenarios, we referred to Zhang’s investigation, which factors in the implications of future climate change and socio-economic evolution, alongside analogous simulations from the preceding year. Additionally, we selected the ssp 245 scenario model, recognized for its commendable simulation accuracy (Zhang et al., 2023).
3 Result
3.1 Risk assessment of the occurrence of three tick species in the Qinghai
Through the collation of the gathered data, we have secured original records of distribution of the D. nuttalli, D. silvarum and H. qinghaiensis in Qinghai and its surrounding regions (Supplementary Materials S1–S3). As depicted in Figures 1A–C, this data is displayed on the map. The geographical position of Qinghai in China is shown in Figure 1D. The eventual predictive outcomes are contingent upon the selection of environmental variables, making the choice of predictor variables a pivotal step in the application of ecological niche models. We conducted a correlation analysis to meticulously select climate variables with a Pearson correlation value below 0.90 for spatial evaluation and model construction, as illustrated in Figure 2. The MaxEnt algorithm employed a Jackknife procedure, systematically eliminating each variable to assess its contribution and importance to the model, ranking them as indicated in Table 3.
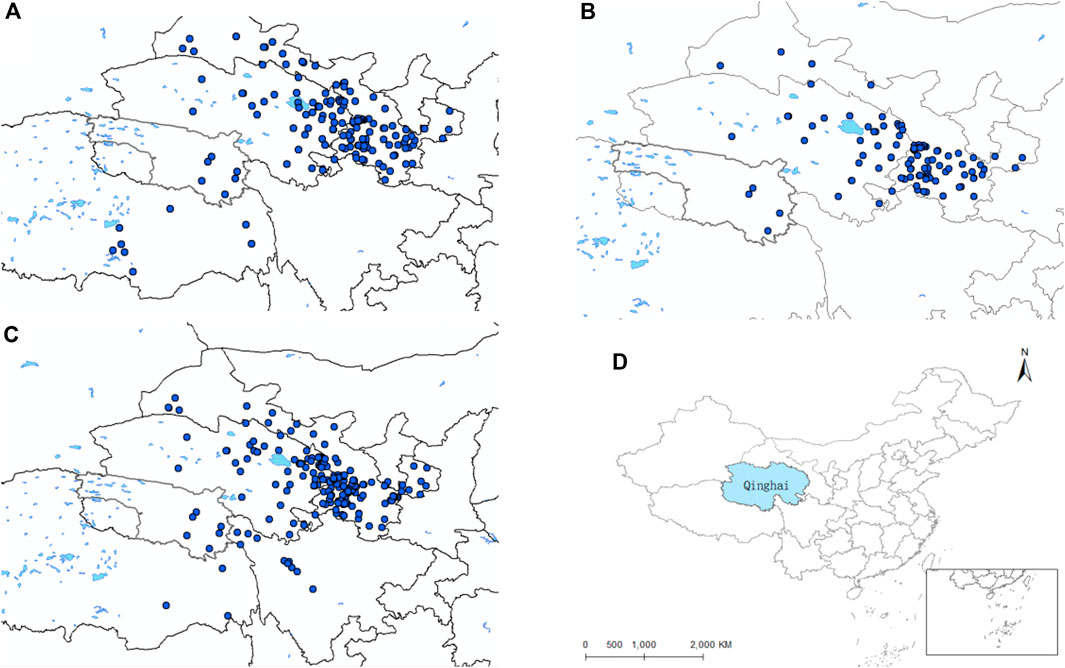
Figure 1. Distribution records of the three species of ticks in Qinghai and surrounding areas. (A) Distribution records of D. nuttalli in Qinghai and surrounding areas. (B) Distribution records of D. silvarum in Qinghai and surrounding areas. (C) Distribution records of the H. qinghaiensis Qinghai and surrounding areas. (D) Geographic location of Qinghai Province.
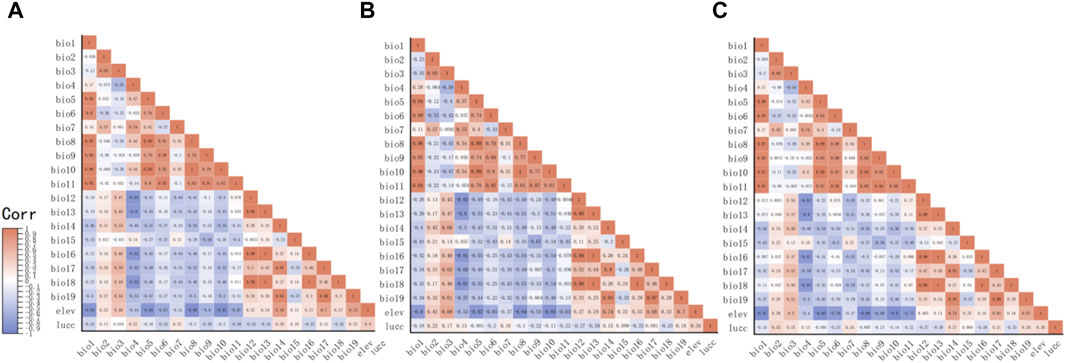
Figure 2. The diagram of correlation between environment variables. (A) The correlation between environment variables that affect D. nuttalli. (B) The correlation between environment variables that affect D. silvarum. (C) The correlation between environment variables that affet H. qinghaiensis.
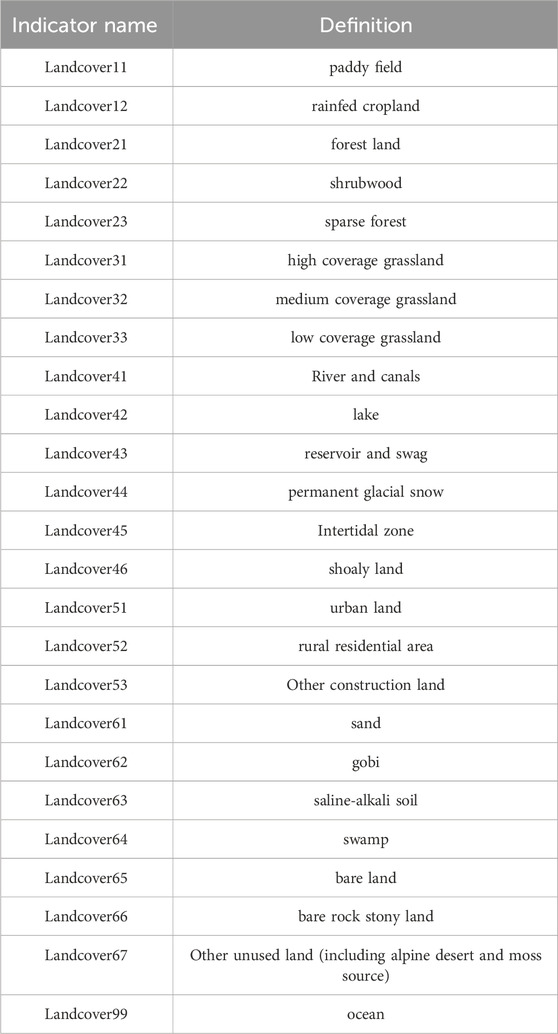
Table 3. Detail of land use types and definition.
Our observations from Table 3 reveal that the predominant factors influencing the distribution of the three tick species are Lucc, elevation, and bio12, each with varying degrees of importance as detailed in the table, The Jackknife test results, presented in Figure 3, quantify the contribution of each variable to the model. The blue bar represents the model’s efficacy when the variable is considered in isolation, while the green bar signified the model’s performance in the absence of that variable. Notably, Lucc emerges as the variable with the highest gain when utilized as the sole environmental factor in simulations (Figure 3).
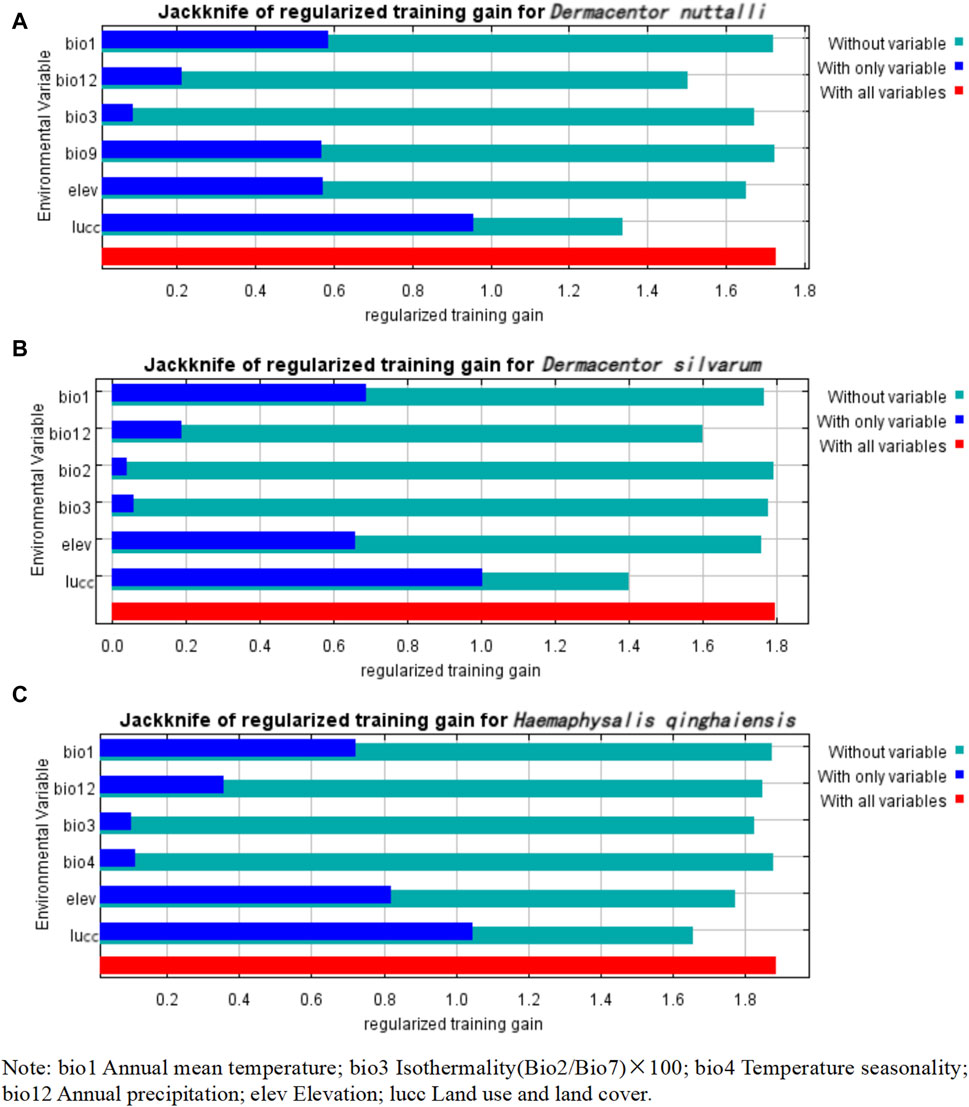
Figure 3. Jackknife test results of the environmental factors affecting the distribution of three species of ticks. (A) Jackknife test results of the environmental factors affecting the distribution of D. nuttalli. (B) Jackknife test results of the environmental factors affecting the distribution of D. silvarum. (C) Jackknife test results of the environmental factors affecting the distribution of H. qinghaiensis.
In the depicted response curve plot, the vertical axis represents the probability of occurrence, while the horizontal axis indicates the specific values of the environmental variable. As illustrated in Figure 4, a notable increase in the probability of occurrence is observed for the three tick types as the land use and land cover categories shift to types 51 and 67, succeeded by type 21. These categories correspond to urban land, other unused land, and forested land, respectively. Specifically, for H. qinghaiensis, a high likelihood of occurrence is evident in 41 and 65 land types, which are characterized as canals and bare land, respectively. Furthermore, the probability of occurrence for these tick types increases with elevation, reaching its peak at 2,500 m, 571.4–1,571 m, and 1258–1709.6 m, respectively. Regarding D. nuttalli and H. qinghaiensis, their occurrence probability also escalates with the rise in annual precipitation, with the highest likelihood observed at approximately 500 mm, as depicted in Figure 4.
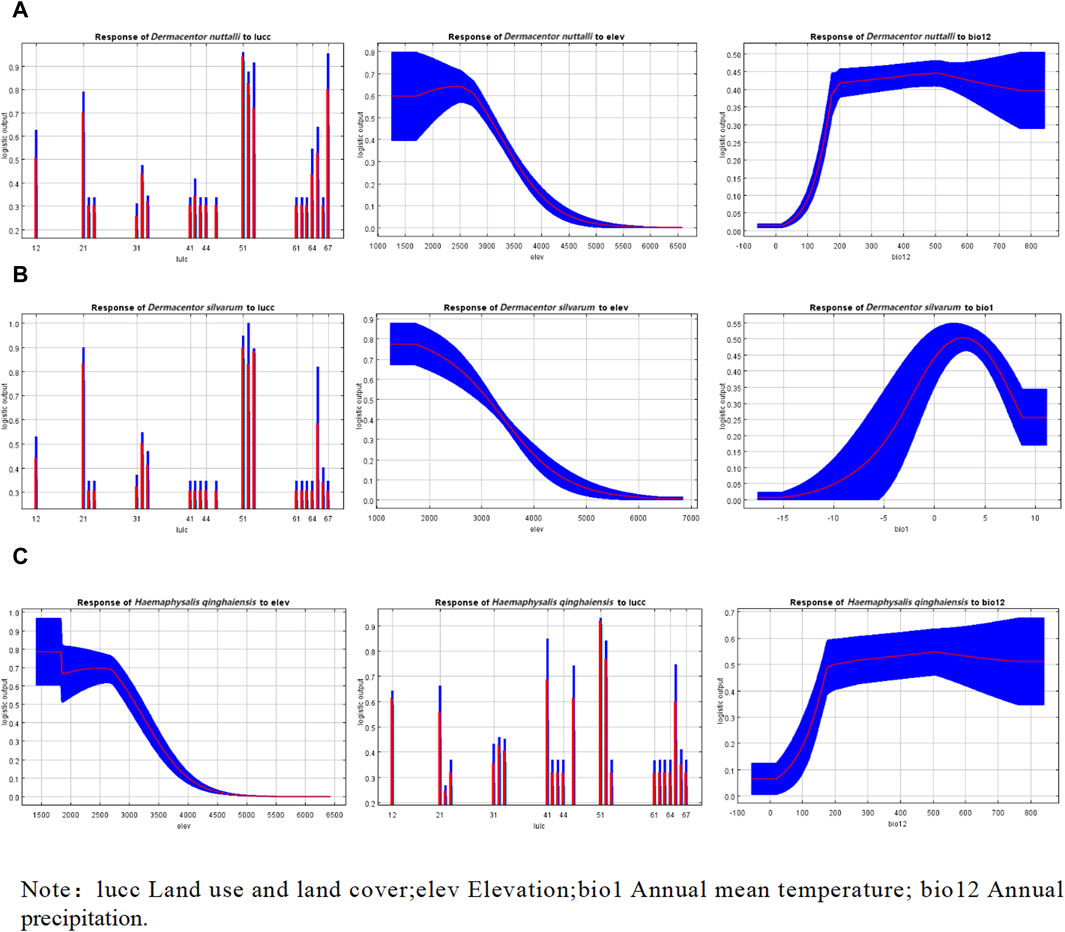
Figure 4. Response curves of effects of the main environmental variables on the distribution of three species of ticks. (A) Response curves of effects of the main environmental variables on the distribution of D. nuttalli. (B) Response curves of effects of the main environmental variables on the distribution of D. silvarum. (C) Response curves of effects of the main environmental variables on the distribution of H. qinghaiensis.
The map’s findings revealed that the regions highly conducive to the habitation of D. nuttalli are predominantly concentrated in the eastern portion of Qinghai, the Hainan Autonomous Prefecture, the Huangnan Autonomous Prefecture, the eastern sector of Haixi Autonomous Prefecture, as well as the river valleys of Yushu and Guoluo (refer to Figure 5). presently, under prevailing climatic conditions, the areas designated as high risk, medium risk, medium-low risk, low risk, and non-risk for D. nuttalli amount to 0.1762 × 10⁶, 0.3856 × 10⁶, 0.4868 × 10⁶, 0.4958 × 10⁶ and 5.3932 × 10⁶ km2, respectively. In the context of the ssp245 future scenario, a notable enhancement in the habitat suitability within the Hainan Autonomous Prefecture is predicted (refer to Figures 5B,C). Utilizing the ArcGIS 10.8 software, we calculated the extent of each suitability category, and the results indicated that by the year 2050, under the ssp245 scenario, there will be a 22% augmentation in the high-risk zone, a 33.4% enlargement in the medium-risk zone, a 7.6% reduction in the medium-low risk areas, a 4.9% decrease in the low-risk regions, and a 2% contraction in the non-suitable zones. In the climate projection for 2070, the high-risk area is expected to expand by 3.7%, with a substantial increase of 31.4% projected for the medium-risk zone.
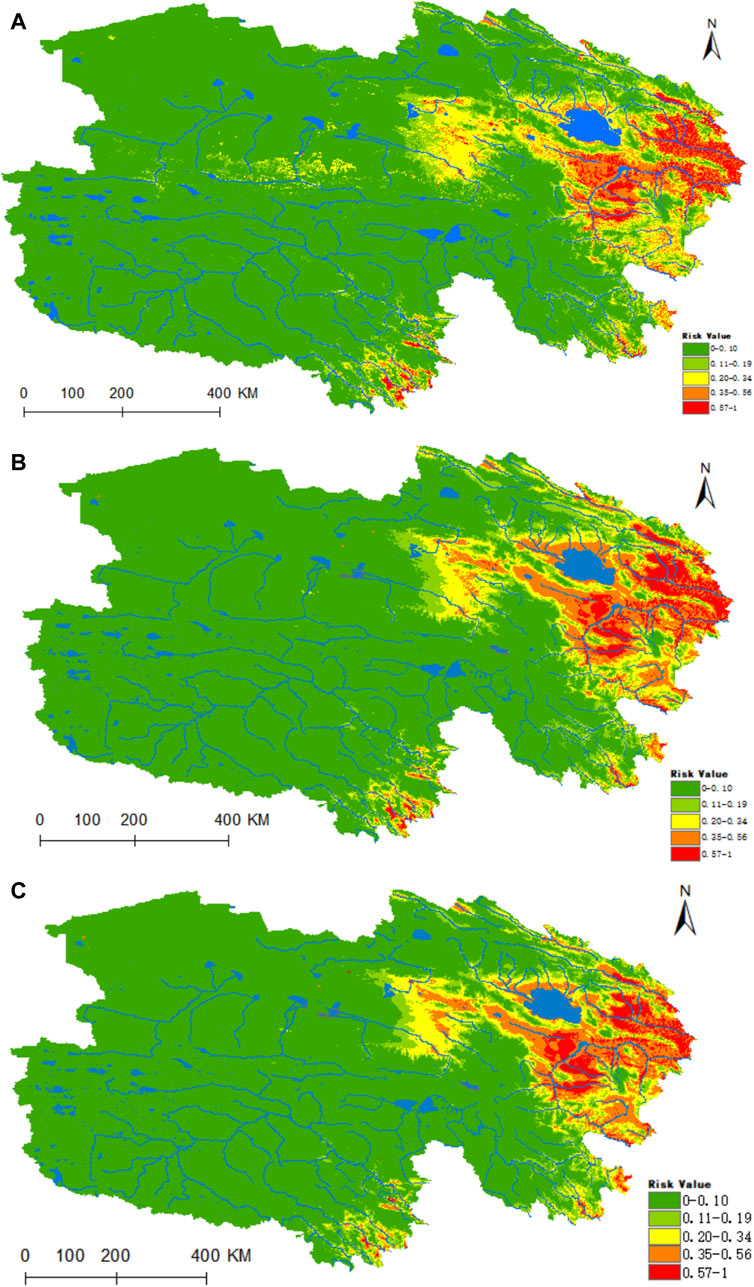
Figure 5. Predicted distribution and trends in distribution of D. nuttalli in Qinghai. (A) Current potential distribution of D. nuttalli in Qinghai. (B) Distribution of D. nuttalli in Qinghai under the ssp245-2050 scenarios. Distribution of D. nuttalli in Qinghai. (C) Distribution of D. nuttalli in Qinghai under the ssp245-2070 scenarios.
Figure 6 illustrates that the highly suitable zones for D. silvarum are predominantly situated in the eastern portion of Qinghai, with the eastern regions of Haixi and Hainan Autonomous Prefectures, Huangnan Autonomous Prefecture, as well as the river valleys of Yushu and Guoluo, being predominantly classified as moderately suitable (Figure 6A). Under the prevailing climatic conditions, the areas designated as high risk, medium risk, medium-low risk, low risk, and non-risk for D. silvarum amount to 0.0523 × 10⁶, 0.3538 × 10⁶, 0.4361 × 10⁶, 0.5911 × 10⁶ and 5.5044 × 10⁶ km2, respectively. According to the ssp245 scenario model, the distribution of D. silvarum is forecast to be primarily concentrated in the eastern Qinghai Province in both the years 2050 and 2070, with a notable increase in the high-risk zone, expanding by 13% and 21% respectively.
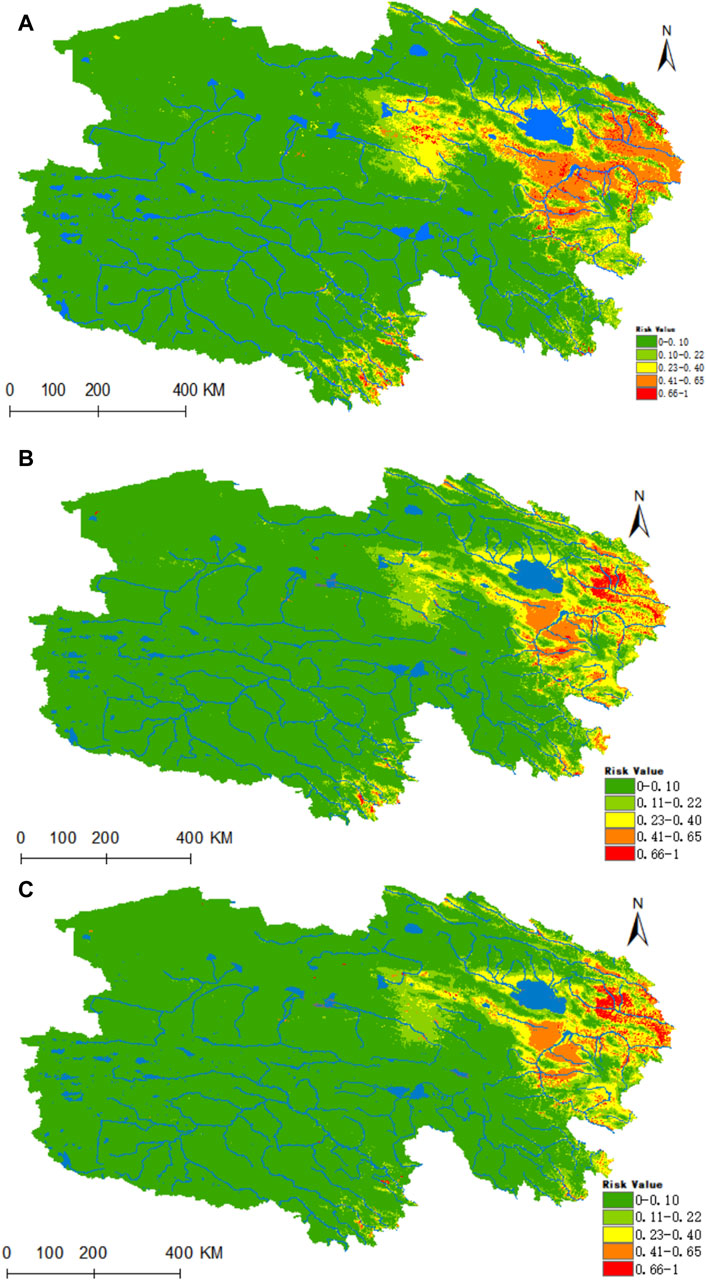
Figure 6. Predicted distribution and trends in the distribution of D. silvarum in Qinghai. (A) Current potential distribution of D. silvarum in Qinghai. (B) Distribution of D. silvarum in Qinghai under the ssp245-2050 scenarios. (C) Distribution of D. silvarum in Qinghai under the ssp245-2070.
Figure 7A reveals that H. qinghaiensis is predominantly distributed in the eastern part of Qinghai, with an elevated presence in the eastern Haixi Autonomous Prefecture, as well as in the Yushu and Guoluo River Valley. In the current climate, the regions classified as high risk, medium risk, medium-low risk, low risk, and non-risk for H. qinghaiensis are 0.101 × 10⁶, 0.2406 × 10⁶, 0.508 × 10⁶, 0.4837 × 10⁶ and 5.6044 × 10⁶ km2, respectively. Under the projected climate models, the high-risk zone for this tick species remains concentrated in the eastern Qinghai Province, while the medium-risk area experiences a notable increase of 16% in the 2050 period, as depicted in Figures 7B,C.
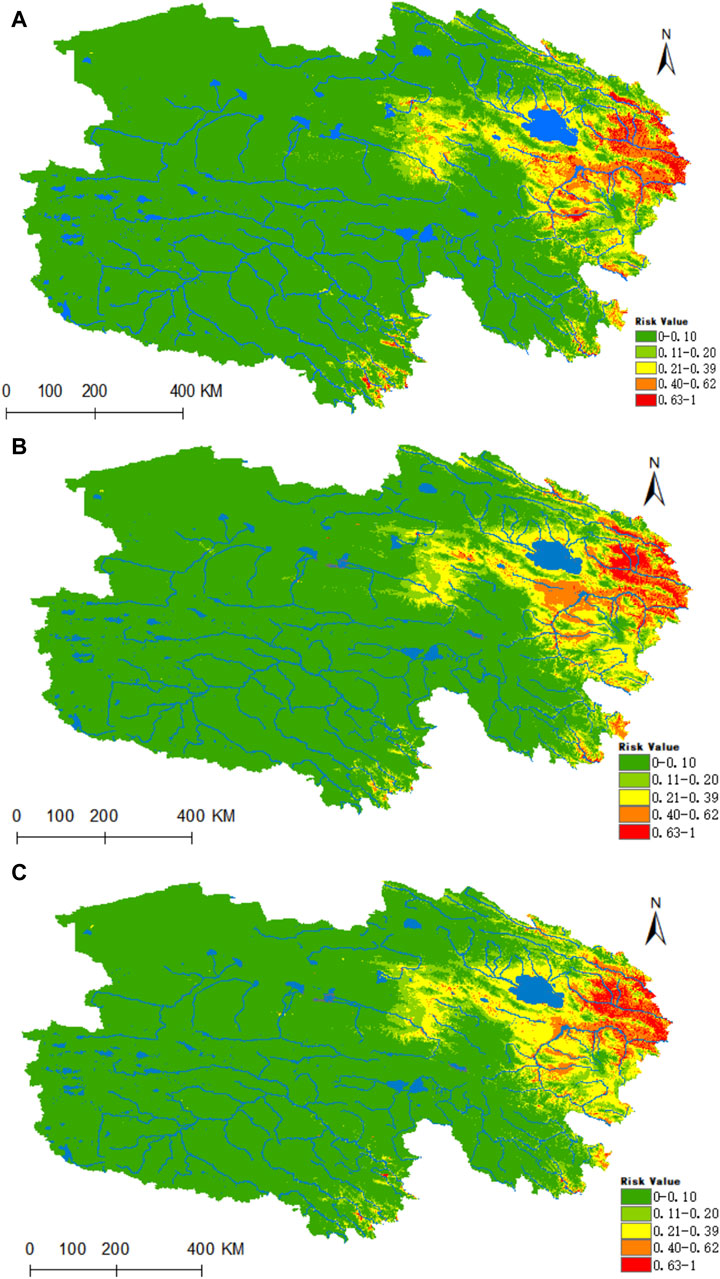
Figure 7. Predicted distribution and trends in the distribution of H. qinghaiensis in Qinghai. (A) Current potential distribution of H. qinghaiensis in Qinghai. (B) Distribution of H. qinghaiensis in Qinghai under the ssp245-2050 scenarios. (C) Distribution of H. qinghaiensis in Qinghai under the ssp245-2070.
3.2 Risk assessment of the occurrence of four tick-borne diseases in the Sanjiangyuan region of Qinghai
Figure 5 delineates the documented distribution of four tick-borne pathogens-B. burgdorferi, Piroplasmida, Rickettsia and Anaplasma-across Qinghai and its environs. This illustration is based on a comprehensive analysis of our laboratory’s years of survey data, augmented by a thorough literature review. Independently, we have gathered 52 distribution records for B. burgdorferi (Figure 8A), 52 for Piroplasmida (Figure 8B), 276 for Rickettsia, and 100 for Anaplasma within the Qinghai region and its periphery (Figures 8C,D). These original data as shown in Supplementary Materials S4–S7.
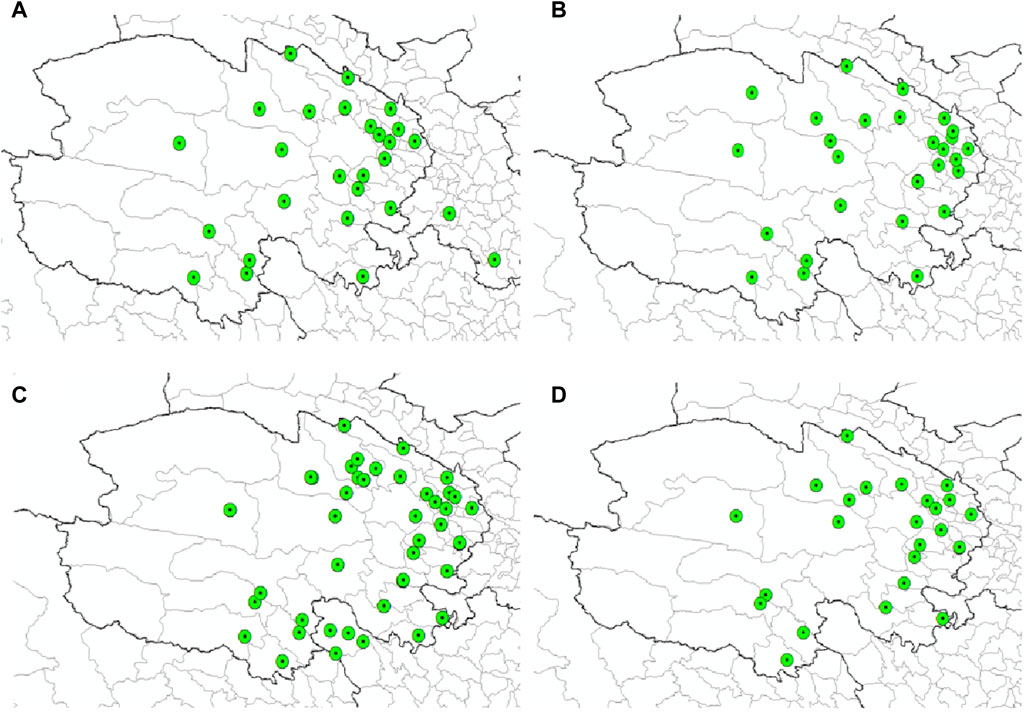
Figure 8. Distribution records of four types of pathogens in Qinghai. (A) Distribution records of (B) burgdorferi in Qinghai. (B) Distribution records of Piroplasmida in Qinghai. (C) Distribution records of Rickettsia in Qinghai. (D) Distribution records of Anaplasma in Qinghai.
According to Table 4, the principal factors influencing the distribution of these tick-borne pathogens are Land use and Land cover (Lucc), elevation (bio12), and bioclimatic variable bio1, each with varying degrees of importance as detailed in Table 4.
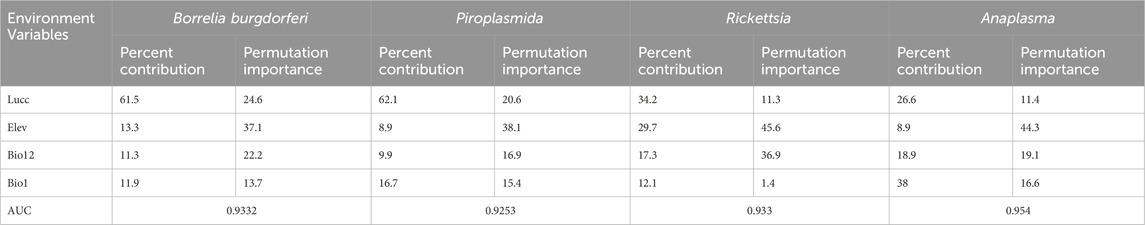
Table 4. Contribution and importance ranking of each environmental variable to the model (%).
Figure 9A reveals that the areas highly conducive to B. burgdorferi are concentrated in the eastern part of Qinghai, with the valleys of the Yellow River, Yangtze River source, and Lancang River source in southern Qinghai being of medium suitability. Presently, the areas designated as high, medium, medium-low, low, and non-risk for B. burgdorferi infection encompass 0.1095 × 10⁶, 0.2704 × 10⁶, 0.5227 × 10⁶, 0.8225 × 10⁶, and 5.212 × 10⁶ km2, respectively. Projecting into the future using climate models for the years 2050 and 2070, there is a notable increase in habitat suitability in the Haixi Autonomous Prefecture, as well as the Yangtze and Yellow River valleys in southern Qinghai (Figures 9B,C). In both scenarios, the high-risk areas for B. burgdorferi expand by 76% and 95%, while the medium-risk areas increase by 74% and 75%.
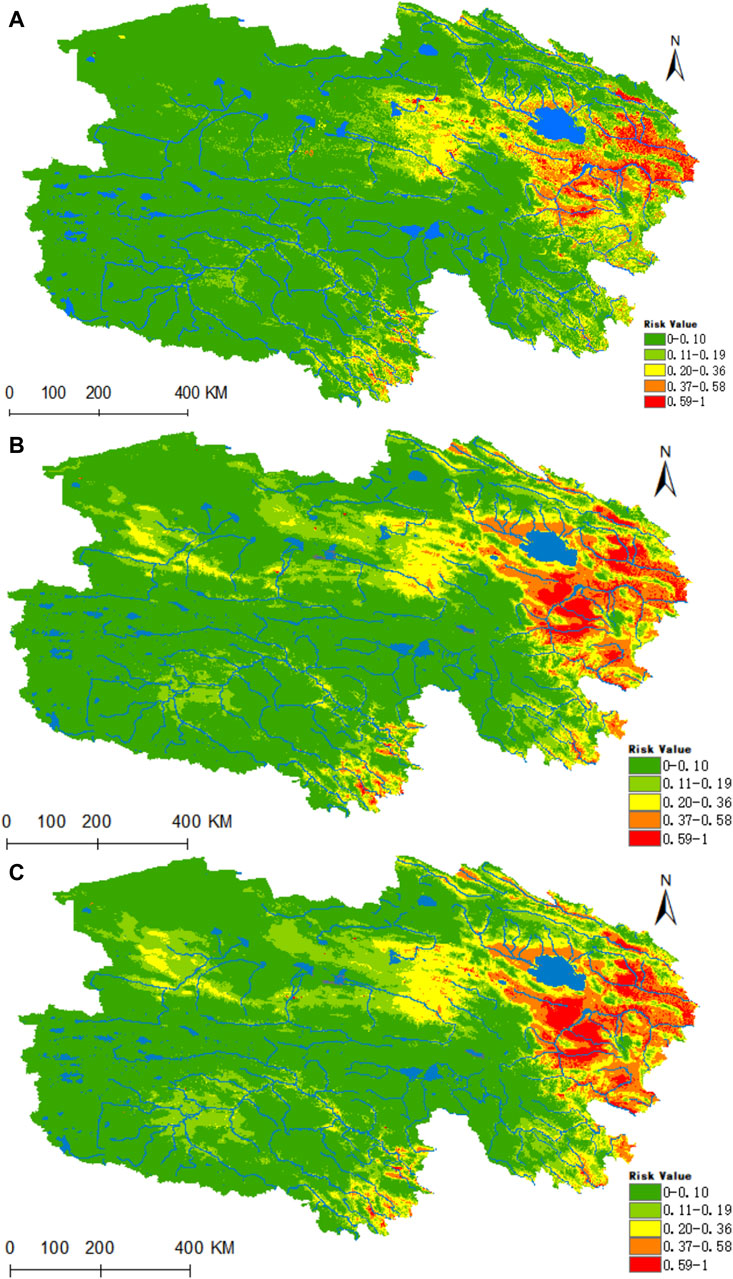
Figure 9. Analysis of the fitness zones and trends in the distribution of B. burgdorferi in Qinghai. (A) Current potential distribution of B. burgdorferi in Qinghai. (B) Distribution of B. burgdorferi in Qinghai under the ssp245-2050 scenarios. (C) Distribution of B. burgdorferi in Qinghai under the ssp245-2070.
Figure 10 illustrates that the regions highly conducive to Rickettsia are predominantly concentrated within the Haixi Autonomous Prefecture. The areas designated as high, medium, medium-low, low risk, and non-risk for Rickettsia were found to be 0.2178 × 10⁶, 0.3641 × 10⁶, 0.5132 × 10⁶, 0.6653 ×10⁶, and 5.1773 × 10⁶ km2, respectively. Projecting into the 2050 period under the ssp245 scenarios, a notable enhancement in habitat suitability is anticipated for the Yangtze River headwaters and Lancang River headwaters valley zones in the southern Qinghai region, marked by a substantial increase of 96% in the high-risk area and a moderate upsurge of 24% in the medium-risk zone.
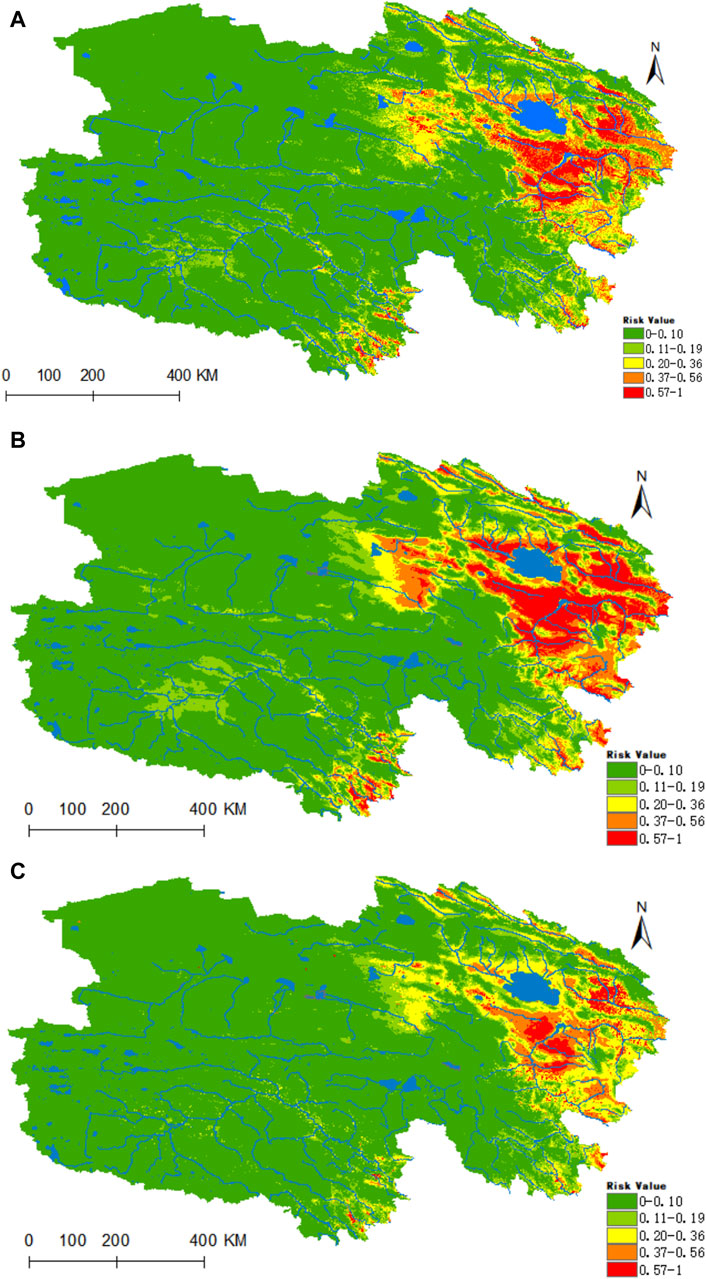
Figure 10. Analysis of the fitness zones and trends in the distribution of Rickettsia in Qinghai. (A) Current potential distribution of Rickettsia in Qinghai. (B) Distribution of Rickettsia in Qinghai under the ssp245-2050 scenarios. (C) Distribution of Rickettsia in Qinghai under the ssp245-2070.
Figure 11 reveals that the highly suitable habitat for Piroplasmida is primarily located in the eastern part of Qinghai, encompassing the source area of the Yellow River and the eastern sector of the Haixi Autonomous Prefecture, in contrast to the Yangtze River source area (Figure 10A). Within the prevailing climatic conditions, the areas of high, medium, medium-low, low risk, and non-risk for Piroplasmida were estimated to be 0.1296 × 10⁶, 0.3403 × 10⁶, 0.7389 × 10⁶, 0.111 × 10⁶, and 4.6186 × 10⁶ km2 respectively. Furthermore, under the future climate projections for the 2050 and 2070 periods based on the ssp245 scenarios, a significant expansion is expected in the suitability of the Yangtze River headwaters, Lancang River headwaters valley zones, and the Haixi Autonomous Prefecture in the eastern Qinghai region. By the 2070 period, the areas of high, medium, medium-low, and low suitability are projected to increase by 67.5%, 62.6%, 7.2%, and 5.4%, respectively.
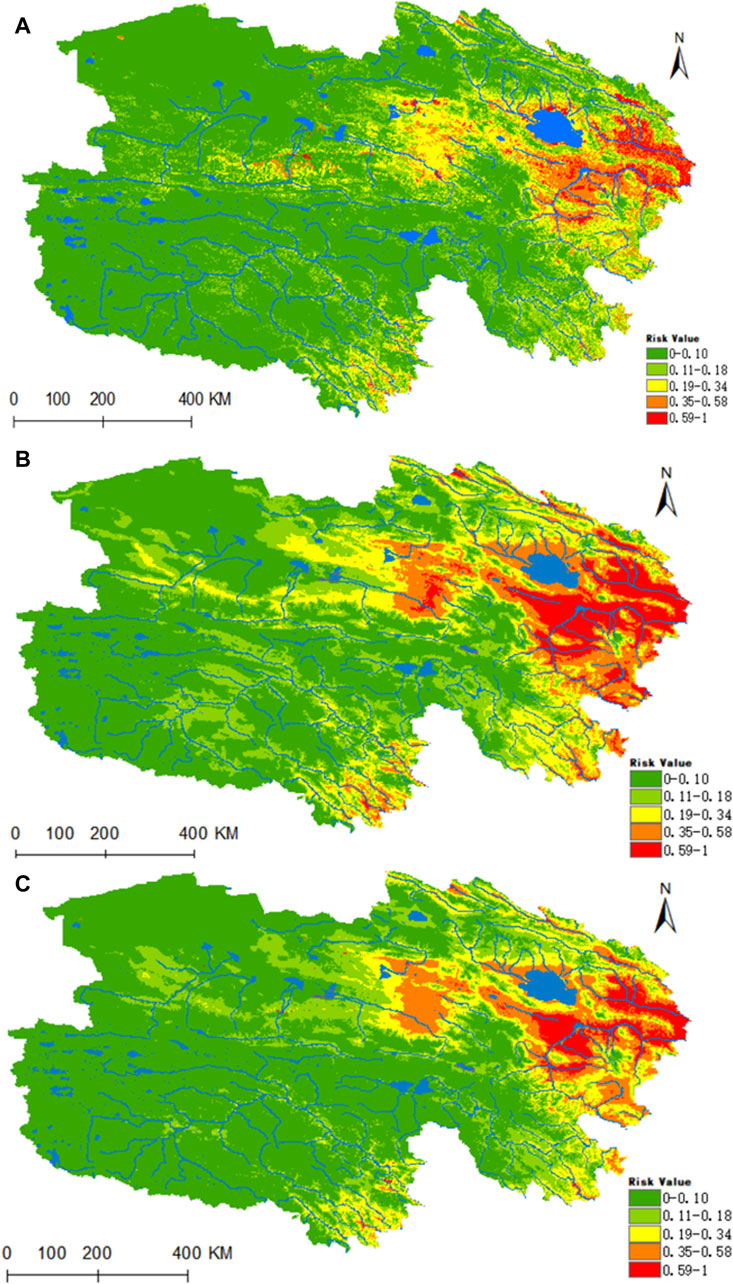
Figure 11. Analysis of the fitness zones and trends in the distribution of Piroplasmida in Qinghai climate change. (A) Current potential distribution of Piroplasmida in Qinghai. (B) Distribution of Piroplasmida Qinghai under the ssp245-2050 scenarios. (C) Distribution of Piroplasmida in Qinghai under the ssp245-2070.
Ultimately, the model depicted in Figure 12A identifies the highly suitable zone for Anaplasma as predominantly concentrated in the source region of the Yellow River, located in eastern Qinghai, and also distributed at the upper reaches of both the Yangtze and Yellow Rivers in southern Qinghai. Under the prevailing climatic conditions, the areas of high, medium, medium-low, low, and non-risk for Anaplasma are estimated at 0.2151 × 10⁶, 0.3475 × 10⁶, 0.5682 × 10⁶, 0.4554 × 10⁶, and 5.3515 × 10⁶ km2 respectively. In the time frames of 2050 and 2070, under the ssp245 scenarios, the habitat suitability for Anaplasma is projected to decrease substantially within Qinghai (as shown in Figures 12B,C). Nonetheless, a notable level of risk is expected to persist in the source areas of the Yellow River in eastern Qinghai, as well as in the headwaters of the Yangtze and Yellow Rivers in southern Qinghai.
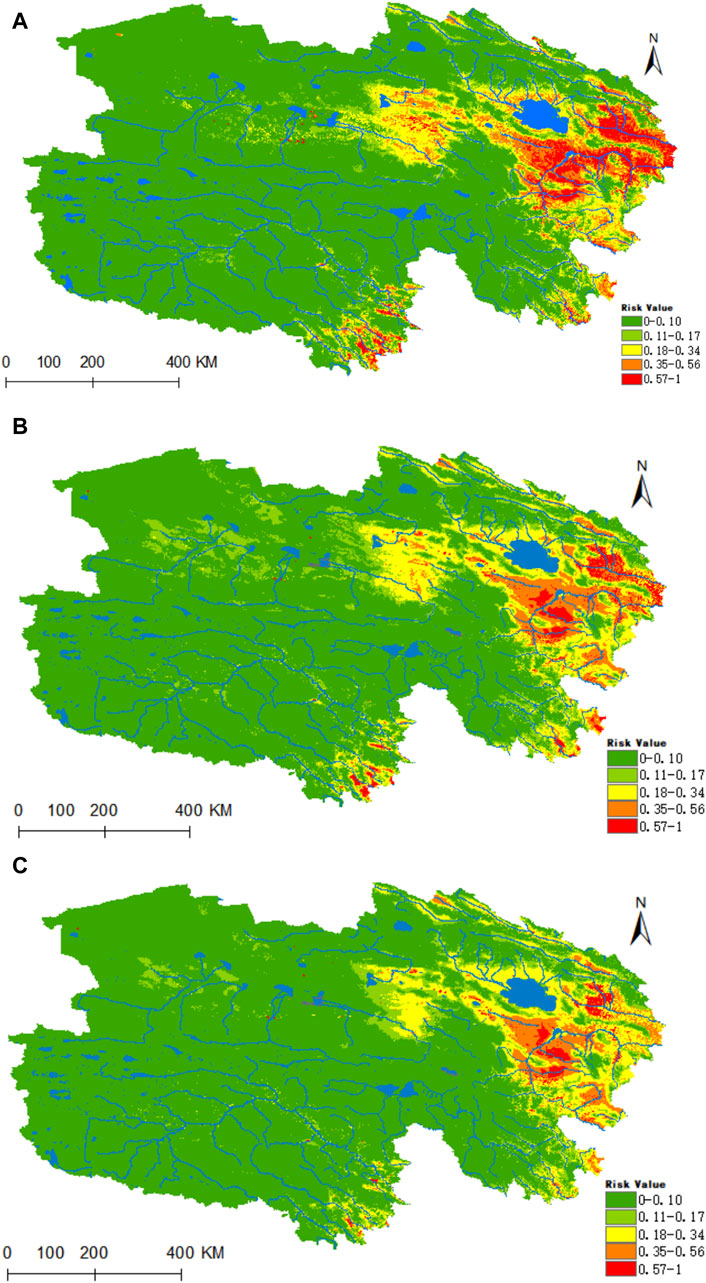
Figure 12. Analysis of the fitness zones and trends in the distribution of Anaplasma in Qinghai climate change. (A) Current potential distribution of Anaplasma in Qinghai. (B) Distribution of Anaplasma Qinghai under the ssp245-2050 scenarios. (C) Distribution of Anaplasma in Qinghai under the ssp245-2070.
4 Discussion
In this study, both ticks and tick-borne pathogens were subjected to a simulation of 10 iterations, with all model AUC values exceeding 0.9. It is particularly noteworthy that the MaxEnt model exhibited an exceptional simulated efficacy.The research findings suggest that the three varieties of ticks and their associated pathogens are predominantly distributed across the eastern and southern regions of Qinghai Province, which is the source of the Yellow River, the Yangtze River, and the Lancang River, collectively known as Sanjiangyuan. This distribution pattern enables the prediction of potential species distribution and forecasting of future distributions at the environmental level. Additionally, correlation analysis identified Lucc, elev, bio1, and bio12 as the most influential variables in the modeling process. Specifically, the infestations of the three tick species were found to be more prevalent in urban areas, rural habitations, barren land, riverine channels, and forested regions. Moreover, an inverse correlation was observed with increasing elevation beyond 2,500 m, resulting in a decreased likelihood of encountering ticks. This study employed SDMtools to delineate risk areas and to compare the ranges of suitable habitats under current environmental conditions with those projected for the years 2050 and 2070, within the ssp245 scenario. The outcomes indicate that, with the exception of Anaplasma, the suitable ranges for the three tick species and their tick-borne pathogens are generally trending towards expansion. It is pertinent to highlight that the outcomes of simulating various species using different climate and geographical datasets do exhibit variations (Ying et al., 2016). However, employing MaxEnt for simulating species’ geographical distribution remains a pivotal research methodology (Zhu et al., 2017).
Although ticks are specialized blood-sucking ectoparasites and serve as vector organisms, they lead a majority of their life cycle as free-living creatures in nature (de la Fuente et al., 2017; Liu, 2018). Consequently, variations in temperature and humidity significantly impact the life cycle of these ticks (Wardhana et al., 2014; Leal et al., 2020). Within a specific range, an increase in temperature and humidity can expedite the development process of ticks, thereby shortening their life cycle (Yao and Chen, 1981). In the model under consideration, the prolonged and frigid winters in Qinghai may explain the substantial influence of temperature on the distribution of tick species. At sub-zero temperatures, body fluids within ticks can crystallize into ice, causing damage (Dautel and Knülle, 1996; Dörr and Gothe, 2001). species such as D. nuttalli, D. silvarum, and H. qinghaiensis, which are all triple-hosted ticks, devote 90% of their life cycles to seeking a host (Bai et al., 1999; Yuan et al., 2002). Ticks typically position themselves atop vegetation to await a host, descending to the undergrowth periodically to absorb moisture, as the dry atmosphere can lead to dehydration and subsequent death (Lauterbach et al., 2013). However, within an optimal humidity range, ticks can remain for extended periods at the summit of plant, awaiting the passage of a potential host (Wright and Machin, 1990). Conversely, excessive humidity results in dew formation on plant surfaces, which hinders tick movement (Heath, 2016).Conversely, excessive humidity results in dew formation on plant surfaces, which hinders tick movement (Piao et al., 2004). Given that ticks must ascend to the heights of vegetation in search of a host and descend for moisture, land use and land cover emerge as critical factors influencing their distribution. Consequently, D. nuttalli, D. silvarum, and H. qinghaiensis are primarily distributed in regions of Qinghai Province with favorable temperature and humidity conditions.
The limitations of this investigation were demarcated as follows. Initially, the sites acquired do not comprehensively represent all potential locations. Secondly, beyond the direct transmission of pathogens among ticks, between ticks and hosts, and among hosts themselves, the possibility of indirect transmission between ticks and other vector species poses a formidable challenge. This complexity makes it difficult to accurately predict the risk of pathogen dissemination, a task that involves a multitude of variables. The spatial distribution forecasts of ticks and their associated tick-borne pathogens within at-risk zones, as provided by this study, are expected to enhance sampling strategies, reduce the incidence of random sampling, and thereby conserve both time and financial resources. Furthermore, these predictions stand to significantly contribute to the prophylactic measures and management of tick-borne diseases, while also enriching the research on the predominant tick species in Qinghai Province.
Data availability statement
The original contributions presented in the study are included in the article/Supplementary Material, further inquiries can be directed to the corresponding author.
Ethics statement
The animal study was approved by the institutional Animal Care and Use Committee of Qinghai University. The study was conducted in accordance with the local legislation and institutional requirements. Ethics approval number: SL-2023005.
Author contributions
LX: Conceptualization, Data curation, Investigation, Methodology, Software, Writing–original draft. YG: Conceptualization, Data curation, Investigation, Methodology, Resources, Software, Supervision, Writing–review and editing. LY: Data curation, Investigation, Methodology, Resources, Writing–review and editing. ZL: Investigation, Project administration, Resources, Supervision, Writing–review and editing. MK: Investigation, Project administration, Resources, Supervision, Writing–review and editing. XHa: Investigation, Resources, Supervision, Writing–review and editing. CC: Investigation, Resources, Supervision, Writing–review and editing. SH: Investigation, Resources, Supervision, Writing–review and editing. XHu: Investigation, Supervision, Writing–review and editing. YH: Investigation, Supervision, Writing–review and editing. YW: Investigation, Resources, Supervision, Writing–review and editing. ZL: Investigation, Resources, Supervision, Writing–review and editing. JC: Investigation, Resources, Writing–review and editing. PG: Supervision, Writing–review and editing. QC: Investigation, Supervision, Writing–review and editing. SJ: Investigation, Supervision, Writing–review and editing. JM: Investigation, Supervision, Writing–review and editing. XZ: Investigation, Supervision, Writing–review and editing. XT: Investigation, Supervision, Writing–review and editing. YL: Data curation, Funding acquisition, Investigation, Project administration, Resources, Supervision, Writing–review and editing.
Funding
The author(s) declare that financial support was received for the research, authorship, and/or publication of this article. This research was funded by the Special Project for Scientific and Technological International Cooperation of Science and Technology Department, Qinghai Province (2021-HZ-801).
Acknowledgments
We are very grateful for the cooperation of the local herdsmen and full assistance of the veterinary staff in huangnan, yushu, guoluo and other Qinghai region during the sample collection process.
Conflict of interest
The authors declare that the research was conducted in the absence of any commercial or financial relationships that could be construed as a potential conflict of interest.
Publisher’s note
All claims expressed in this article are solely those of the authors and do not necessarily represent those of their affiliated organizations, or those of the publisher, the editors and the reviewers. Any product that may be evaluated in this article, or claim that may be made by its manufacturer, is not guaranteed or endorsed by the publisher.
Supplementary material
The Supplementary Material for this article can be found online at: https://www.frontiersin.org/articles/10.3389/fenvs.2024.1429718/full#supplementary-material
References
Bai, Y. C. H., Wang, G. L., Xu, X. Z., Nu, E., and Nu, E. B. H. T. (1999). Morphology and life history of Dermacentor nuttalli. Grass-fed Livest. (04), 45–47. doi:10.16863/j.cnki.1003-6377.1999.04.016
Bi, W. M., Deng, H. P., and Bu, X. Y. (1997). A study on the natural source of forest encephalitis. J. Cap. Norm. Univ. Nat. Sci. Ed. (02), 100–107. doi:10.19789/j.1004-9398.1997.02.019
Brown, J. L., Bennett, J. R., and French, C. M. (2017). SDMtoolbox 2.0: the next generation python-based GIS toolkit for landscape genetic, biogeographic and species distribution model analyses. PeerJ (2017), 5:e4095. doi:10.7717/peerj.4095
Dautel, H., and Knülle, W. (1996). The supercooling ability of ticks (Acari, ixodoidea). J. Comp. Physiol. B 166 (8), 517–524. doi:10.1007/BF02338295
de la Fuente, J., Antunes, S., Bonnet, S., Cabezas-Cruz, A., Domingos, A. G., Estrada-Peña, A., et al. (2017). Tick-pathogen interactions and vector competence: identification of molecular drivers for tick-borne diseases. Front. Cell. Infect. Microbiol. 7, 114. doi:10.3389/fcimb.2017.00114
Dörr, B., and Gothe, R. (2001). Cold-hardiness of Dermacentor marginatus (Acari: ixodidae). Exp. Appl. Acarol. 25 (2), 151–169. doi:10.1023/a:1010691019471
Elith, J. H., Graham, C. P., Anderson, R., Dudík, M., Ferrier, S., Guisan, A., et al. (2010). Novel methods improve prediction of species' distributions from occurrence data. Ecography 29 (2), 129–151. doi:10.1111/j.2006.0906-7590.04596.x
Estrada-Peña, A., Ayllón, N., and de la, F. J. (2012). Impact of climate trends on tick-borne pathogen transmission. Front. Physiol. 3, 64. doi:10.3389/fphys.2012.00064
Fan, J. Y., Wu, G., Zhu, G. P., and Cai, B. (2019). Potential geograghic distributions of the quarantine pest Platypus parallelus (Coleoptera: platypodidae) in China. For. Sci. 55 (06), 81–85. doi:10.11707/j.1001-7488.20190610
Fang, L. Q., Liu, K., Li, X. L., Liang, S., Yang, Y., Yao, H. W., et al. (2015). Emerging tick-borne infections in mainland China: an increasing public health threat. Lancet Infect. Dis. 15 (12), 1467–1479. doi:10.1016/S1473-3099(15)00177-2
Gui, Z., Wu, L., Cai, H., Mu, L., Yu, J. F., Fu, S. Y., et al. (2021). Genetic diversity analysis of Dermacentor nuttalli within inner Mongolia, China. Parasit. Vectors 14 (1), 131. doi:10.1186/s13071-021-04625-5
Guo, W. B., Shi, W. Q., Wang, Q., Pan, Y. S., Chang, Q. C., Jiang, B. G., et al. (2021). Distribution of Dermacentor silvarum and associated pathogens: meta-analysis of global published data and a field survey in China. Int. J. Environ. Res. Public Health 18 (9), 4430. doi:10.3390/ijerph18094430
Gürcan, S., Eskiocak, M., Varol, G., Uzun, C., Tatman-Otkun, M., Sakru, N., et al. (2006). Tularemia Re-emerging in European part of Turkey after 60 years. Jpn. J. Infect. Dis. 59 (6), 391–393. PMID: 17186960.
Han, R. (2018). Studies on species diversity of ticks and gene polymorphism of tick-borne pathogens in Qinghai province. Lanzhou, Gansu: Chinese Academy of Agricultural Sciences. Doctoral dissertation.
He, W. W. (2023). Predicted distribution of ticks and evaluation of the anti-tick effect of FER1 the key protein of iron metabolism in Xinjiang. Dr. Diss. doi:10.27431/d.cnki.gxnyu.2023.000185
He, W. W., Wu, J., Wen, L. C., Shi, Q. Y., Gan, L., Zheng, H. Z., et al. (2022). Prediction to the habitat adaptability of Hyalomma scupense in Xinjiang by maxent model. China Anim. Quar. 39 (02), 45–51. doi:10.3969/j.issn.1005-944X.2022.02.009
Heath, A. (2016). Biology, ecology and distribution of the tick, Haemaphysalis longicornis neumann (Acari: ixodidae) in New Zealand. N. Z. Vet. J. 64 (1), 10–20. doi:10.1080/00480169.2015.1035769
Hu, X. K., Xia, S., Guo, Y. H., He, Y. W., Xue, J. B., Lv, S., et al. (2020). Ecological niche modeling and its application in the study of parasitic disease transmission risk. Chin. J. Parasitol. Parasit. Dis. 38 (02), 238–244. doi:10.12140/j.issn.1000-7423.2020.02.017
Hu, X. Y., Li, Z. k., Li, Z. Y., Geng, P. C., Zhang, S. Y., and Gao, D. (2023). Distribution of ticks and tick-borne diseases in selected regions of Asia and africa [J/OL]. Chin. J. Vector Biol. Control 1-12. doi:10.11853/j.issn.1003.8280.2023.03.025
Hu, Z. X., Nuo, M. D., Yu, Q. W., and Hu, E. C. (2022). MaxEnt distribution prediction of Dermacentor nuttalli in Xinjiang region of China. Ecol. Sci. 41 (4), 92–101. doi:10.14108/j.cnki.1008-8873.2022.04.012
Jacobsen, T. (2014). Topographical variables influencing Dermacentor andersoni distribution in Montana. Milwaukee, America: Carroll College. Doctoral dissertation.
Lauterbach, R., Wells, K., O'Hara, R. B., Kalko, E. K., and Renner, S. C. (2013). Variable strength of forest stand attributes and weather conditions on the questing activity of Ixodes ricinus ticks over years in managed forests. PLoS One 8 (1), e55365. doi:10.1371/journal.pone.0055365
Leal, B., Zamora, E., Fuentes, A., Thomas, D. B., and Dearth, R. K. (2020). Questing by tick larvae (Acari: ixodidae): a review of the influences that affect off-host survival. Ann. Entomol. Soc. Am. 113 (6), 425–438. doi:10.1093/aesa/saaa013
Liu, C., White, M., and Newell, G. (2011). Measuring and comparing the accuracy of species distribution models with presence–absence data. Ecography 34 (2), 232–243. doi:10.1111/j.1600-0587.2010.06354.x
Liu, H. B. (2018). “Isolation, identification and monitoring of tick-borne pathogens,” in Doctoral dissertation. Academy of military science (Beijing, China).
Liu, K., Yao, X. Y., Cun, D. J., Zhang, Y., and Li, L. H. (2021). Influence of climatic and environmental factors on the habitat of Dermacentor silvarum in China. Chin. J. Vector Biol. Control 32 (06), 732–735. doi:10.11853/j.issn.1003.8280.2021.06.015
Liu, M. M., Liu, D. D., Lu, X., Wang, S. Y., Liu, Y. T., Jiang, B. B., et al. (2023). A study on the distribution of Ornithodoros ticks in Xinjiang based on the MaxEnt model. Chin. J. Vector Biol. Control 34 (05), 671–678. doi:10.11853/j.issn.1003.8280.2023.05.015
Liu, Q. Y. (2021). Impact of climate change on vector-borne infectious diseases in China and countermeasures - major research findings and recommendations for future research. Chin. J. Vector Biol. Control 32 (01), 1–11. doi:10.11853/j.issn.1003.8280.2021.01.001
Ma, Y. M., Zhou, W. K., Yang, B., Han, W. X., He, H. K., Wang, Y., et al. (2023). Identification, captive rearing and life history observations of the grassland tick Ixodes leucocephalus in inner Mongolia. Northwest J. Agric. 32 (06), 835–843. doi:10.7606/j.issn.1004-1389.2023.06.002
Manel, S., Williams, H. C., and Ormerod, S. J. (2001a). Evaluating presence–absence models in ecology: the need to account for prevalence. J. Appl. Ecol. 38 (5), 921–931. doi:10.1046/j.1365-2664.2001.00647.x
Manel, S., Willianms, H. C., and Ormerod, S. J. (2001b). Evaluating presence-sbsence models in ecology: the need to account for prevalence. J. Appl. Ecol. 38 (5), 921–931.
Materna, J., Daniel, M., Metelka, L., and Harcarik, J. (2008). The vertical distribution, density and the development of the tick Ixodes ricinus in mountain areas influenced by climate changes (the krkonoše mts., Czech republic). Int. J. Med. Microbiol. 298, 25–37. doi:10.1016/j.ijmm.2008.05.004
Mullins, J., Lukhnova, L., Aikimbayev, A., Pazilov, Y., VanErt, M., and Blackburn, J. K. (2011). Ecological niche modelling of the Bacillus anthracis A1.a sub-lineage in Kazakhstan. BMC Ecol. 11, 32. doi:10.1186/1472-6785-11-32
Mysterud, A., Stigum, V. M., Seland, I. V., Herland, A., Easterday, W. R., Jore, S., et al. (2018). Tick abundance, pathogen prevalence, and disease incidence in two contrasting regions at the northern distribution range of Europe. Parasit. Vectors 11 (1), 309. doi:10.1186/s13071-018-2890-9
Niu, Q., Hao, R., Pan, Y., Liu, Z., Yang, J., Guan, G., et al. (2022). Molecular characterization and gene expression analysis of aquaporin in Haemaphysalis qinghaiensis. Front. Physiol. 13, 811628. doi:10.3389/fphys.2022.811628
Parola, P., Paddock, C. D., and Raoult, D. (2005). Tick-borne rickettsioses around the world: emerging diseases challenging old concepts. Clin. Microbiol. Rev. 18 (4), 719–756. doi:10.1128/CMR.18.4.719-756.2005
Piao, S. L., Yun, J., He, J. S., and Xiao, Y. (2004). Spatial distribution of grassland biomass in China. Acta Phytoecol. Sin. (04), 491–498.
Shao, Z. J. (2021). Overview of research on important tick-borne diseases and vectors in China. Chin. Health Insectic. 27 (04), 293–299. doi:10.19821/j.1671-2781.2021.04.001
Soberón, J. (2007). Grinnellian and eltonian niches and geographic distributions of species. Ecol. Lett. 10 (12), 1115–1123. doi:10.1111/j.1461-0248.2007.01107
Sun, Z., Huang, Y. R., Gao, X., Xiao, J. H., and Wang, H. B. (2022). Study on the potential distribution characteristics of the Haemaphysalis longhornis in China based on the Maximum entropy model. Adv. Anim. Med. 43 (10), 60–66. doi:10.16437/j.cnki.1007-5038.2022.10.020
Swets, J. A. (1988). Measuring the accuracy of diagnostic systems. Science 240 (4857), 1285–1293. doi:10.1126/science.3287615
Wang, Y., Han, S. Y., and He, H. X. (2022). Reaearch status of tick distribution and tick-borne diseases in Qinghai province. Adv. Anim. Med. 43 (03), 115–119. doi:10.16437/j.cnki.1007-5038.2022.03.025
Wardhana, A. H., Cecchi, G., Muharsini, S., Cameron, M. M., Ready, P. D., and Hall, M. J. (2014). Environmental and phylogeographical determinants of the distribution of the old world screwworm fly in Indonesia. Acta Trop. 138 (Suppl. l), S62–S68. doi:10.1016/j.actatropica.2014.06.001
Wright, J. C., and Machin, J. (1990). Water vapour absorption in terrestrial isopods. J. Exp. Biol. 154 (1), 13–30. doi:10.1242/jeb.154.1.13
Wu, T. W., Lu, T. X., Fang, T. J., Xin, X. G., Li, L., Li, W. P., et al. (2019). The Beijing Climate center climate system model (BCC-csm): the main progress from CMIP5 to CMIP6. Geosci. Model. Dev. 12 (4), 1573–1600. doi:10.5194/gmd-12-1573-2019
Xin, X. G., Wu, T. W., Zhang, J., Zhang, F., Li, W. P., Zhang, Y. W., et al. (2019). Introduction of BCC models and its participation in CMIP6. Clim. Change Res. 15 (05), 533–539. doi:10.12006/j.issn.1673-1719.2019.039
Xing, D. L., and Hao, Z. Q. (2011). Maximum entropy principle and its application in ecological research. Biodiversity 19 (03), 295–302. doi:10.3724/SP.J.1003.2011.08318
Yao, W. B., and Chen, G. D. (1981). Relationships between life history and temperature and humidity in the Dermacentor silvarum olenec. J. Entomol. (02), 233–236. doi:10.16380/j.kcxb.1981.02.022
Yao, X. Y., Tian, N., Ma, B., Zhang, Y., Cun, D. J., and Li, L. H. (2021). Impact of climate change on the distribution area of Rhipicephalus microplus in China. Chin. J. Schistosomiasis Control 33 (03), 267–273. doi:10.16250/j.32.1374.2020298
Ying, L. X., Liu, Y., Chen, S. T., and Shen, Z. H. (2016). Simulation of the potential range of Pistacia weinmannifolia in southwest China with climate change based on the maximum-entropy (maxent) model. Biodivers. Sci. 24 (04), 453–461. doi:10.17520/biods.2015246
Yuan, C. L., Yin, H., Luo, J. X., Guo, Y. H., Guan, G. Q., and Ma, M. L. (2002). Observations on the life history of Haemaphysalis qinghaiensis in Qinghai. Chin. Veterinary Sci. Technol. (04), 10–11. doi:10.16656/j.issn.1673-4696.2002.04.003
Zhang, S. H. (2012). The latest research progress of tick and the tick-borne diseases. Anhui J. Prev. Med. 18, 45–48.
Zhang, T., Cheng, C., and Wu, X. (2023). Mapping the spatial heterogeneity of global land use and land cover from 2020 to 2100 at a 1 km resolution. Sci. Data 10 (1), 748. PMID: 37898602; PMCID: PMC10613310. doi:10.1038/s41597-023-02637-7
Zhao, J. W., Wang, H. Y., and Wang, Y. (2012). Regional distribution profiles of tick-borne pathogens in China. Chin. J. Biol. Control 5, 445–447.
Zhao, Z. C., Luo, Y., and Huang, J. B. (2024). Global climate indicators, climatic-impact drivers and global warming. Clim. Change Res. 20 (3), 3384–3388. doi:10.12006/j.issn.1673-1719.2024.055
Zhu, G. P., Fan, J. Y., Wang, M. L., Chen, M., and Qiao, H. J. (2017). The importance of the shape of receiver operating characteristic (ROC) curve in ecological niche model evaluation - case study of Hlyphantria cunea. J. Biosaf. 26 (03), 184–190. doi:10.3969/j.issn.2095-1787.2017.03.002
Zhu, G. P., Liu, G. Q., Bu, W. J., and Gao, Y. B. (2013). Fundamentals of ecological niche model and its application in biodiversity conservation. Biodiversity. 21 (01), 90–98. doi:10.3724/SP.J.1003.2013.09106
Keywords: MaxEnt model, ticks and tick-borne diseases, latent distribution, transmission risk, environmental impact
Citation: Xu L, Guo Y, Yang L, Li Z, Kang M, Han X, Chen C, He S, Hu X, He Y, Wang Y, Li Z, Chen J, Geng P, Chen Q, Jiang S, Ma J, Zhang X, Tai X and Li Y (2024) Projected distribution and dispersal patterns of prevalent ticks and tick-borne pathogens in the Sanjiangyuan area of Qinghai province, China, under intense climatic conditions. Front. Environ. Sci. 12:1429718. doi: 10.3389/fenvs.2024.1429718
Received: 11 May 2024; Accepted: 26 July 2024;
Published: 16 August 2024.
Edited by:
Shahid Karim, University of Southern Mississippi, United StatesReviewed by:
Ze Chen, Hebei Normal University, ChinaNighat Perveen, United Arab Emirates University, United Arab Emirates
Copyright © 2024 Xu, Guo, Yang, Li, Kang, Han, Chen, He, Hu, He, Wang, Li, Chen, Geng, Chen, Jiang, Ma, Zhang, Tai and Li. This is an open-access article distributed under the terms of the Creative Commons Attribution License (CC BY). The use, distribution or reproduction in other forums is permitted, provided the original author(s) and the copyright owner(s) are credited and that the original publication in this journal is cited, in accordance with accepted academic practice. No use, distribution or reproduction is permitted which does not comply with these terms.
*Correspondence: Ying Li, eWluZ2xpQDEyNi5jb20=