
94% of researchers rate our articles as excellent or good
Learn more about the work of our research integrity team to safeguard the quality of each article we publish.
Find out more
ORIGINAL RESEARCH article
Front. Environ. Sci., 30 July 2024
Sec. Land Use Dynamics
Volume 12 - 2024 | https://doi.org/10.3389/fenvs.2024.1428197
This article is part of the Research TopicTerritorial Spatial Evolution Process and Its Ecological Resilience, volume IIView all 10 articles
 Jiaming Wei1
 Yi Jin1*
 Qilin Tan1Fei Liu1Chi Ding1Tiantian Li1Ji Luo2Chen Hu3Xiaohong Cui1Yuheng Liu1Xiaoyi Zheng1Guiwei Zhang1
This study selects Beijing from 1980 to 2020 as the research area, utilizing high temporal resolution land use data to analyze through the habitat quality module of the InVEST model. Unlike previous research, this study employs the Theil-Sen Median method and Mann-Kendall test to analyze the trend changes in habitat quality more accurately. This method has significant advantages in dealing with non-linear and non-normally distributed data over long time series, providing a more accurate and reliable analysis of habitat quality trends. Methodologically, the study first collects and organizes the land use type data of Beijing from 1980 to 2020, then uses the habitat quality module of the InVEST model to process and analyze the data of each year, assessing the impact of different land use types on habitat quality. Subsequently, the Theil-Sen Median method and Mann-Kendall test are used to analyze the time series trend of habitat quality, to identify and quantify the trend and significance of habitat quality changes. The results show that over the past 40 years, the area of construction land in Beijing has significantly expanded, leading to a compression of other types of land. The spatial distribution of habitat quality shows a clear difference between the two sides divided by a line connecting the northeast and southwest, with the west side being the area of good habitat quality and the east side being poorer. In the past 10 years, the overall habitat quality has improved, but most areas still show a decreasing trend, especially in the western and northern mountainous areas where habitat quality has significantly declined. Based on these findings, it is recommended that future urban planning and land management should pay more attention to the protection and improvement of habitat quality, especially the restoration work for areas with poor habitat quality.
As the process of urbanization accelerates, human activities increasingly impact natural habitats. Megacities, due to their unique agglomeration effect, exert tremendous pressure on the surrounding natural environment, posing a serious threat to biodiversity. Numerous studies have pointed out that urban expansion is one of the main drivers of biodiversity loss (Sala et al., 2000; Falcucci et al., 2007).
The process of urbanization is often accompanied by the loss of natural habitat and the degradation of ecosystem functions, which poses a serious threat to biodiversity. At the same time, the service functions provided by the ecosystem, such as water conservation, soil conservation and air purification, are directly related to human survival and health, and their loss will have a far-reaching impact on human wellbeing. First of all, rapid urbanization leads to fragmentation, islanding and artificialization of the natural environment, which not only limits the migration and reproduction of species, but also makes the ecosystem fragile and unstable. Coupled with environmental pollution and over-utilization of resources caused by human activities, many rare species are facing survival crisis, and the speed of biodiversity loss is accelerating day by day. Secondly, the loss of ecosystem services will have a serious impact on human life. For example, the decline of water conservation function will directly affect the safety of urban water supply; The loss of soil conservation function will aggravate soil erosion and land degradation; The weakening of air purification function will make urban air quality decline and threaten residents’ health. The loss of these ecosystem services will seriously restrict the sustainable development of cities. Therefore, under the background of rapid urbanization, it is particularly urgent to protect biodiversity and ecosystem services.
Currently, methods for assessing biodiversity loss or habitat quality mainly include model prediction methods and landscape analysis methods. Model prediction methods forecast the range and quality of habitats based on changes in habitat conditions or land use types, such as species distribution prediction based on the Maximum Entropy model (MaxEnt) (Phillips et al., 2013), and habitat quality assessment using the InVEST (Integrated Valuation of Environmental Services and Tradeoffs) model (Tallis et al., 2012). As an integrated evaluation tool, the InVEST model can assess habitat quality and analyze multiple ecosystem services such as water retention and water supply calculation. Due to its relatively low data requirements and strong result visualization, it has been widely applied in habitat and ecosystem service research (Wang et al., 2023).
Although there has been a lot of habitat quality analysis using the InVEST model, most studies focus on assessments in specific areas or over short time scales. For example, one study used the InVEST model combined with the topographic distribution index and Mann-Kendall test to analyze the impact of topographic gradients on habitat quality, proposing ecological management suggestions for different altitude areas (Xiang et al., 2023); another study focused on the changes in habitat quality in the Wuyi Mountain reserve over 40 years, highlighting the close connection between population density and habitat quality (Zhang et al., 2023a). These studies provide valuable insights into understanding the impact of specific factors on habitat quality, but there is still a research gap in how to comprehensively assess and manage habitat quality in urban and surrounding areas against the backdrop of rapid urbanization.
In terms of coupling different models (Tang et al., 2023), scholars have used the InVEST (SWESMI) toolkit, HQR, and HRA models for ecosystem service modeling at the sub-basin scale to perform ecological quality, rarity, and risk assessment analysis, emphasizing the importance of land conservation and protected areas in maintaining habitat quality and reducing risks related to habitat degradation and biodiversity (Wu et al., 2023).
Habitat quality is an important indicator, which is used to evaluate the ability to maintain biodiversity and ecological carrying capacity in a region (Gao et al., 2017). At present, the research on spatial pattern of land use mainly focuses on land use efficiency, land use structure and land use function. Studies have shown that with the increase of residential and industrial land, the habitat quality in coastal urban areas has decreased significantly (Zhang et al., 2020). Scholars have studied the correlation and influence of compact urban development on the habitat quality in ecosystem services, providing a basis for urban ecological landscape construction (Yu et al., 2023). Zhao et al. (2022) used InVEST model to evaluate the impact of land use change on the habitat quality of Xiaolangdi reservoir area in China for more than 30 years. Taking Fuzhou natural wetland as an example, quantitatively analyzed the temporal and spatial changes of ecosystem service value caused by urban land activities, and showed that the ecosystem service function decreased significantly due to large-scale urban land expansion (Cai et al., 2013). Hu et al. analyzed the factors such as habitat quality, biodiversity and landscape diversity in Pan ‘an Lake area of Xuzhou by using InVEST model, thus clarifying the ecological environment quality in this area (Hu and Xu, 2018). Jia et al.(2013) analyzed the land use and ecological changes in Xuzhou coal mining area, and found that the habitat quality in the study area continued to decline due to the increase of coal mining and urbanization.
In terms of characteristics and significance, this study adopts new technical means or integrates various methods to analyze habitat quality, such as combining remote sensing technology with ground survey data, which improves the accuracy and reliability of data; Compared with similar studies, this study may pay more attention to the collection and integration of long-time series data, and reveal the deep-seated laws and trends of habitat quality changes through big data analysis technology; The research area selected in this study may have special geographical, climatic or ecological characteristics, which makes the research results more targeted and practical for ecological protection and management in this area and even in a wider range. Compared with other research areas at home and abroad, this research area may face more unique habitat threats or protection challenges, so the research results are of great significance for formulating targeted ecological protection policies. This study may comprehensively evaluate the habitat quality from multiple dimensions, not only considering the traditional indicators such as biodiversity and habitat connectivity, but also including factors such as ecosystem services and human activities, making the evaluation results more comprehensive and closer to reality. At the same time, this study may pay more attention to the interaction and correlation between different habitat types, so as to reveal the complexity and comprehensiveness of habitat quality change more accurately. On the basis of revealing the trend of habitat quality change, it may further put forward operable policy suggestions and practical guidance, which provide scientific basis for ecological protection and management, and pay more attention to transforming research results into practical applications, and promote the continuous improvement of habitat quality through policy suggestions and specific practices.
As the capital of China and a megacity, the change of its habitat quality not only affects the quality of life of urban residents, but also directly affects the sustainable development of the city. With the rapid development of economy and the acceleration of urbanization, Beijing is facing many ecological and environmental problems, such as air pollution, water shortage and biodiversity reduction. Therefore, a long-time series trend analysis of Beijing’s habitat quality is helpful to reveal the development law and evolution trend of these problems and provide scientific basis for formulating effective ecological protection and management policies. Beijing also has a relatively complete ecological environment monitoring system and rich data resources. Over the years, the government and all walks of life have continuously paid attention to and monitored the ecological environment in Beijing, and accumulated a lot of data. These data not only cover air quality, water resources quality, biodiversity and other aspects, but also include data of different time scales, which enables us to comprehensively analyze habitat quality from the perspective of long time series. In addition, Beijing has made a series of remarkable achievements and experiences in ecological environment protection. In recent years, Beijing Municipal Government has attached great importance to ecological environment protection, increased investment and implemented a series of effective policies and measures. How to reflect the implementation effect of these measures on a long time scale is also a problem worthy of in-depth study. By analyzing the long-term trend of Beijing’s habitat quality, we can evaluate the effectiveness of these policies and measures, and provide experience and enlightenment for other cities. As an international metropolis, the change of habitat quality in Beijing is also of international significance. By analyzing the long-term trend of Beijing’s habitat quality, we can compare and communicate with similar research in the world and jointly promote the development of global ecological environmental protection. In 2022, Beijing’s population reached 21.843 million (Gao et al., 2017), and the city’s rapid expansion and development have led to a shortage of construction land, with human impact reaching the development of overall habitat quality. However, the long-term impact and its distribution are not yet clear. In light of this, this study aims to conduct an in-depth analysis of the long-term trend of habitat quality in Beijing from 1980 to 2020 by analyzing changes in land use types and utilizing the habitat quality module of the InVEST model, combined with the Theil-Sen Median method and Mann-Kendall test. Specifically, this study seeks to reveal how human activities affect the trend of habitat quality changes during the rapid urbanization process and how these changes further impact biodiversity. Through a comprehensive analysis of long time series, this study hopes to provide more accurate data support and scientific policy recommendations for urban planning and ecological protection. Especially for megacities like Beijing, the findings of this study will contribute to achieving a sustainable balance between urban development and ecological conservation.
Beijing is the capital of People’s Republic of China (PRC), a municipality directly under the Central Government, a national central city and a mega-city Figure 1. The State Council has approved China’s political center, cultural center, international exchange center and scientific and technological innovation center. By 2020, Beijing has 16 districts with a total area of 16,410.54 square kilometers. By the end of 2022, the permanent population of Beijing was 21.843 million. Located in the north of China and the north of North China Plain, Beijing is adjacent to Tianjin in the east and Hebei Province in the rest. Its center is located at 116 20′ east longitude and 39 56′ north latitude. It is a world-famous ancient capital and a modern international city.
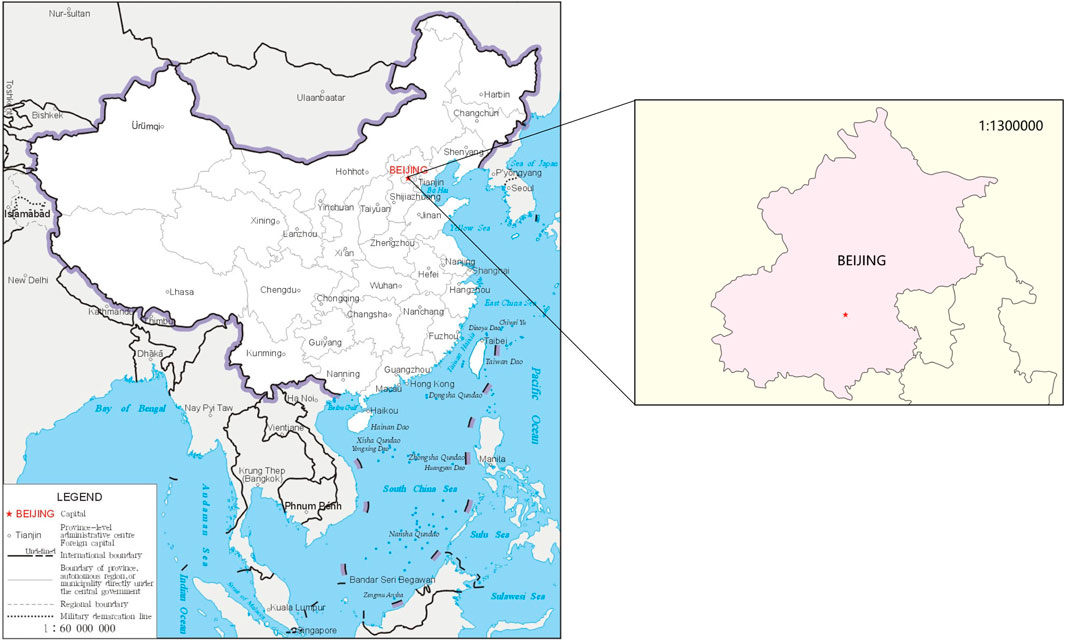
Figure 1. Regional location.
Beijing is high in the northwest and low in the southeast. The west, north and northeast are surrounded by mountains on three sides, and the southeast is a plain that slowly inclines to the Bohai Sea. The main rivers flowing through the territory are Yongding River, Chaobai River, North Canal, Juma River, etc. The climate of Beijing is warm temperate semi-humid semi-arid monsoon climate, with high temperature and rainy summer, cold and dry winter and short spring and autumn. Beijing was rated as the first-tier city in the world by the world urban research institute GaWC, and the United Nations report pointed out that Beijing ranked second in China in terms of human development index (Zhang et al., 2020).
The high-precision land type classification map from 1980 to 2020 is selected as the research basis of habitat quality change, which comes from the 30 m data of Beijing, Institute of Geographical Sciences and Resources and Environment, China Academy of Sciences (Zhang et al., 2020).
The data that support the findings of this study are available from Resources and environment science data registration and publishing system but restrictions apply to the availability of these data, which were used under license for the current study, and so are not publicly available. Data are however available from the authors upon reasonable request and with permission of Resources and environment science data registration and publishing system. The maps in the text are from the official maps on the Chinese government website and can be used freely without involving copyright issues. For more details, visit the website: http://bzdt.ch.mnr.gov.cn/.
In order to ensure the accuracy and reliability of remote sensing data, and then affect the application and research effect of remote sensing images, this study preprocesses remote sensing data, including geometric correction, image fusion, image mosaic, image cropping, cloud removal and shadow processing, and atmospheric correction. The purpose of these steps is to remove the noise and interference information in the original data and improve the data quality. In quality control, data verification evaluates the reliability and consistency of data by comparing with ground observation data; Data accuracy evaluation determines the accuracy of data through error analysis and verification test.
Land use transfer matrix shows the quantitative relationship between land cover types in two different periods in the form of matrix, which can fully reflect the value and transfer direction of a regional land cover type (Yu et al., 2023). Land use transfer matrix is the application of Markov model in land use change. Markov model can not only quantitatively show the transformation between different land use types, but also reveal the transfer rate between different land use types. The land use transfer matrix comes from the quantitative description of system state and state transfer in system analysis. In the usual land use transfer matrix, the row indicates the land use type at time T1, and the column indicates the land use type at time T2.
Habitat quality means that the ecological environment can provide the ability to adapt to natural ecological conditions, which has strong regionality (Zhao et al., 2022). InVEST model is a comprehensive evaluation tool of ecosystem services, which can simulate the changes of the quality and value of ecosystem services under different land cover scenarios and provide comprehensive information of ecosystem services for decision makers. Compared with the traditional literal abstract expression, InVEST model can provide a visual expression of the evaluation results, which makes the results more intuitive and easy to understand, and helps decision makers to better understand and use the evaluation results. The model is robust to the changes and abnormal values of input data, and its flexible parameter setting also enables it to adapt to different research scenarios.
The quality of habitat can reflect the fragmentation degree of regional habitat and its anti-interference ability to habitat degradation. The range of calculation results is 0–1, and the larger the value, the stronger the anti-interference ability of the study area to habitat degradation. The calculation formula is:
Where Qxj represents the habitat quality of grid X in land use type J; Hj represents the habitat suitability of land use type J; Dxj indicates the stress level of grid X in land use type J; Z represents a normalized constant; K is the scaling constant. Where Dxj is calculated as follows:
Where r is the number of stress factors; R is a stress factor; Y is the grid number of stress factor r; Yr is the number of grids occupied by stress factors; Wr is the weight of stress factor, with the range of 0–1; Irxy is the influence (exponential or linear) of stress factor R on each grid of habitat; βx is the anti-interference level of habitat; Sjr is the relative sensitivity of different habitats to each stress factor (Tallis et al., 2012).
The determination of threat factor and sensitivity coefficient in this paper comes from the recommendation of model instruction, related literature (Cai et al., 2013; Hu and Xu, 2018; Wang et al., 2023; Liu et al., 2021; Ying et al., 2022; Zhang et al., 2023b; Tables 1, 2).
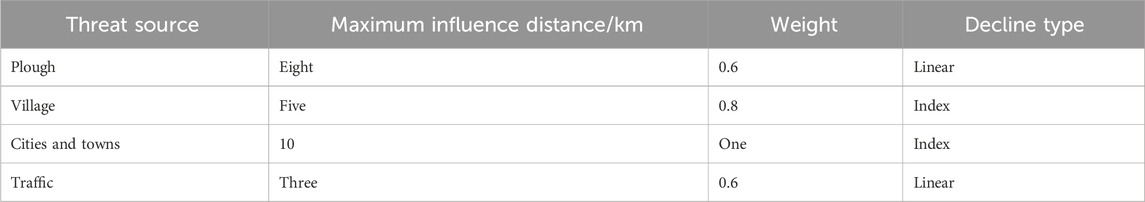
Table 1. Threat factors of habitat quality measurement of InVEST model.
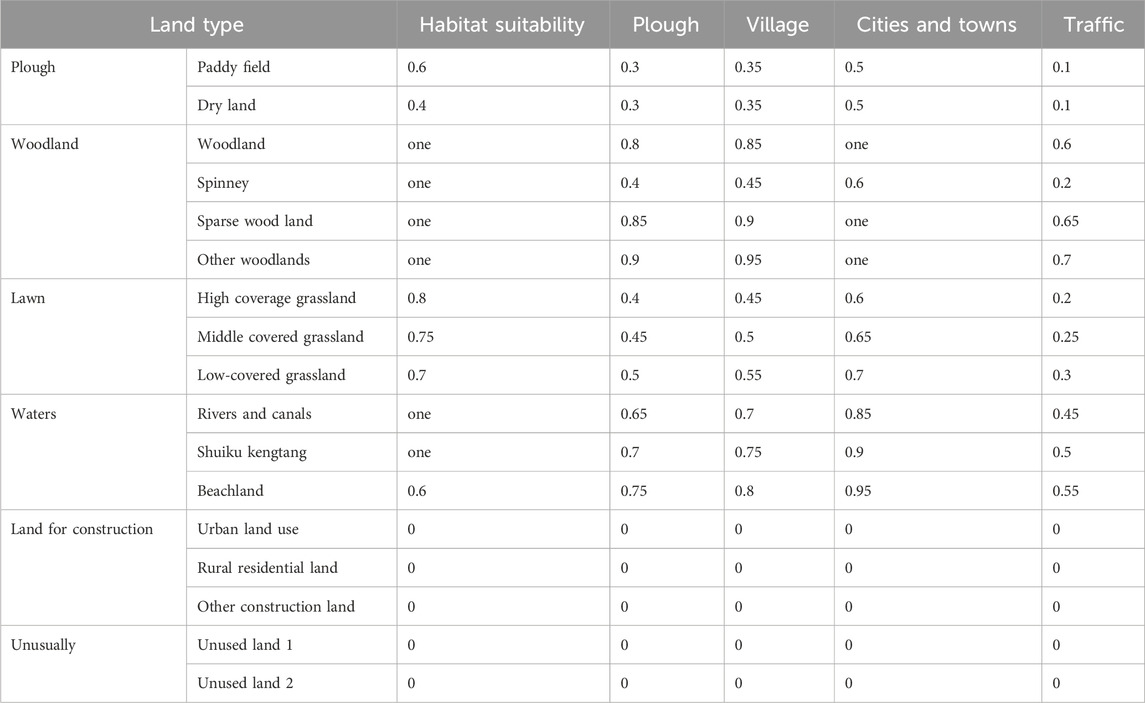
Table 2. Sensitivity coefficient of habitat quality measurement of InVEST model.
Theil-Sen Median method, also known as Sen slope estimation, is a robust nonparametric trend calculation method. This method has high calculation efficiency, is insensitive to measurement error and interest group data, and is suitable for trend analysis of long-time series data (Jia et al., 2013). Theil Sen Median method is a nonparametric statistical method, and there is no strict assumption for data distribution, so it is suitable for all kinds of data sets, including non-normal distribution or abnormal values (Vannest et al., 2012). This method has high calculation efficiency and is insensitive to measurement errors and outliers, especially suitable for trend analysis of long-time series data. By considering all possible point pairs in the data set and calculating the median slope, Theil Sen Median method can provide robust estimation of data trends, reduce the influence of outliers on the results, and the calculated slope can directly reflect the changing trend of data with time, which is helpful for researchers to quickly understand the dynamic characteristics of data. Its calculation formula is:
Where Median () stands for median, if β > 0, it indicates that habitat change is an increasing trend, and vice versa.
Mann-Kendall (MK) test is a nonparametric time series trend test method, which does not need the measured values to obey normal distribution and is not affected by missing values and abnormal values, and is suitable for the trend significance test of long time series data (Ban et al., 2023). Mann Kendall test is a nonparametric test method, which does not need to assume the data distribution and is not disturbed by a few abnormal values, so it has great flexibility and applicability for trend and catastrophe point analysis (Hamed and Rao, 1998). This method is especially suitable for analyzing the trend and catastrophe point of time series of precipitation, runoff, temperature and water quality, and is helpful to reveal the long-term change characteristics of ecosystems. By calculating the z value and carrying out significance test, Mann Kendall test can judge the significance level of the trend and provide reliable decision-making basis for researchers. The process is as follows: for the sequence XT = X1, X2, XN, first determine the size relationship between xi and xj in all dual values (xi, xj, j > i) (set as S). Make the following assumptions: H0, the data in the sequence are randomly arranged, that is, there is no significant trend; H1, the sequence has an upward or downward trend. The formula for calculating the test statistic S is (in the formula for calculating Z, when S > 0, the molecule is S-1)
Where sgn () is a symbolic function, and the calculation formula is:
Use the test statistic z for trend test, and the calculation method of z value is:
Among them, the calculation formula of Var is:
Where n is the number of data in the sequence, m is the number of repeated data groups, and ti is the number of repeated data in the I-th repeated data group.
The critical value Z1-α/2 is found in the normal distribution table under a given significance level by using the bilateral trend test. When | z | ≤ Z1-α/2, the original hypothesis is accepted, that is, the trend is not significant; If | z | > Z1-α/2, the original hypothesis is rejected, that is, the trend is significant.
Given the significance level α = 0.05, the critical value Z1-α/2 = 1.96. When the absolute value of Z is greater than 1.65, 1.96 and 2.58, it means that the trend has passed the significance test with 90%, 95% and 99% reliability respectively. Judgement method of trend significance.
When β > 0, the trend is characterized by an increasing trend; when Z > 2.58, it is characterized by an extremely significant increase; when 1.96 < Z ≤ 2.58, it is a significant increase; when 1.65 < Z ≤ 1.96, it is a slightly significant increase; when Z ≤ 1.65, it is a general increase.
When β = 0, the trend is characterized by no change.
When β < 0, the trend is characterized by decreasing trend; when Z > 2.58, it is characterized by extremely significant decrease; when 1.96 < Z ≤ 2.58, it is significantly decreased; when 1.65 < Z ≤ 1.96, it is slightly decreased; when Z ≤ 1.65, it is generally decreased.
Tread(i) = 3 was significantly increased; Slightly increased tread(i) = 2; Generally increase tread(i) = 1; Significantly reduce tread(i) = −3; Slightly decreased tread(i) = −2; Generally decreased tread(i) = −1; No change tread(i) = 0.
With the development of urban and rural areas, the change of land use types also presents a certain spatial and temporal change. The change map of land use types is shown in Figure 2. In addition to the obvious expansion of construction land in the central city, there is also a certain expansion of construction land in the northern mountainous areas. The area of paddy fields is decreasing year by year, but the land use such as reservoirs and ponds has changed little. Specific to the area change, as shown in Figure 3. Among them, cultivated land, woodland, grassland, water area and other areas have all been compressed to a certain extent, in which the area of cultivated land has the largest reduction rate, while the area of woodland has a certain decline, but it still has a high quantity. During 1990–2010, the slope of the image was the largest, and the change rate was the largest. After 2010, it tended to develop steadily, on the contrary, the area of construction land expanded. During 1990–2010, the average and standard deviation of different land use types in Beijing from 1980 to 2020 are analyzed. As shown in Figure 4, the area of cultivated land and forest land has been in a large proportion in the past 40 years, of which the proportion of forest land is the largest, and its standard deviation is also small, indicating that the range of change is not large, but the standard deviation of cultivated land and construction land is the largest, indicating that they have changed in the past 40 years.
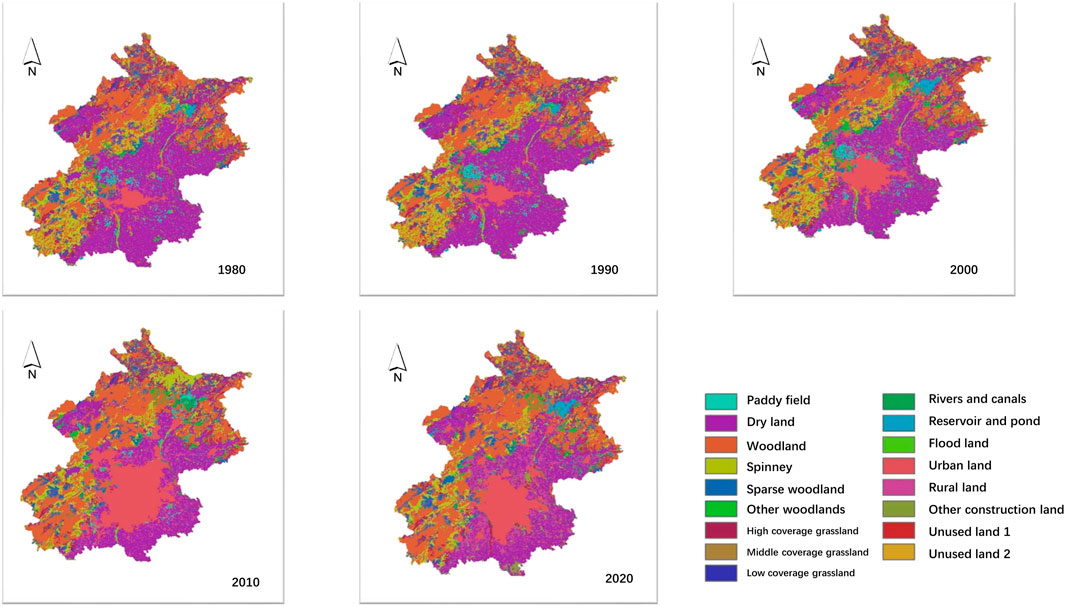
Figure 2. Distribution of land use types in Beijing in different periods.
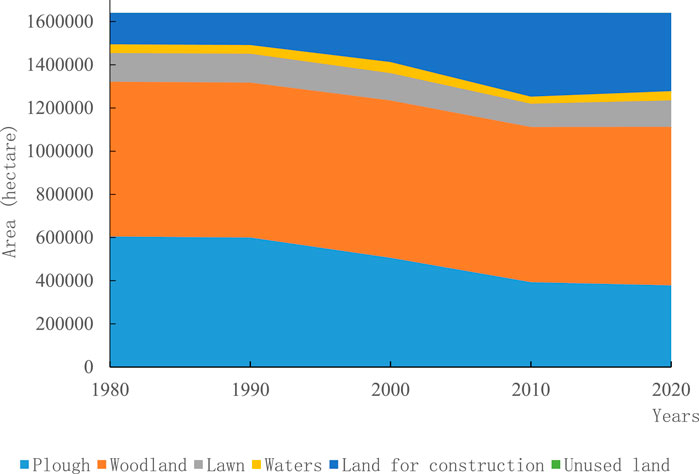
Figure 3. Area of land use types in Beijing in different periods.
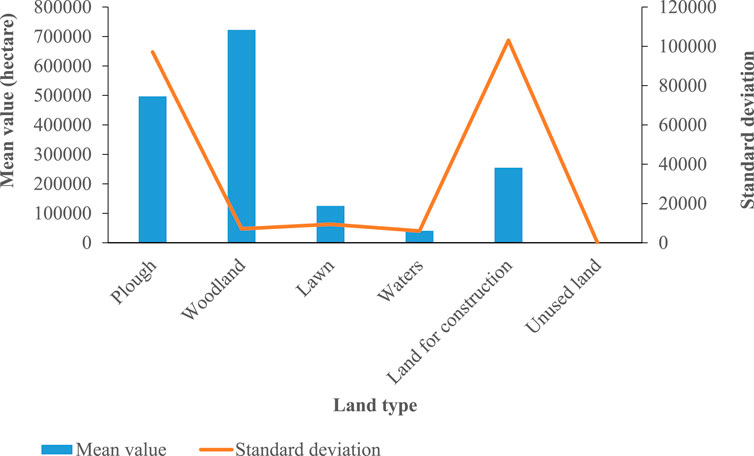
Figure 4. Analysis of mean and standard deviation of land use types in Beijing in different periods.
This paper analyzes the transfer of different land use types in Beijing from 1980 to 2020. As shown in Table 3, the land use transfer rate is 30.5%, with a total area of 499,982.98 hectares, of which the top five outflows are dry land, shrub land, high-coverage grassland, beach land and rural residential land. About 77% of dry land is converted into construction land (urban land, rural residential land and other construction land), about 83% of shrub land is converted into forested land, about 34% of high-coverage grassland is converted into forested land, about 72% of beach land flows out into natural land such as rivers, pits, grasslands and wooded land, 17% is converted into agricultural land such as dry land, and about 53% is used by rural residents.
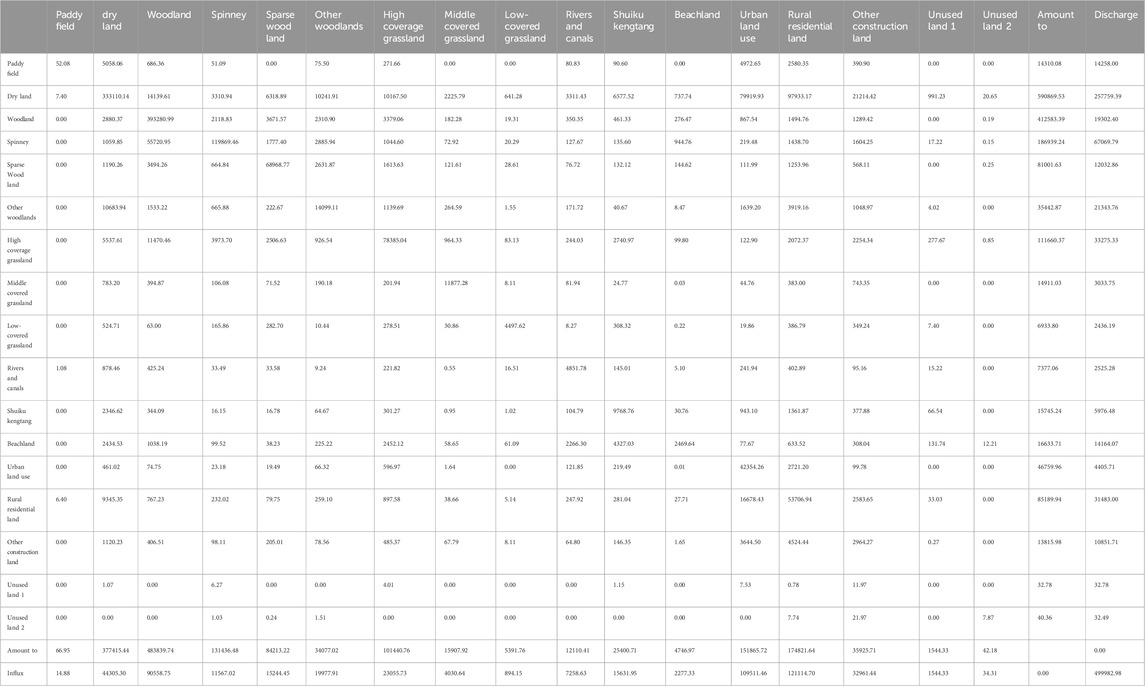
Table 3. Beijing land use transfer matrix.
Rural residential land, urban land, dry land, forested land and other construction land with the largest inflow. Among them, the main sources of urban land are dry land (73%) and rural residential land (15%); The main source of land for rural residents is dry land (81%); The main sources of dry land are other forest land (24%) and comprehensive improvement of rural residential land (21%); The main sources of forested land are dry land (16%), shrubbery (62%) and grassland (13%). The main source of other construction land is dry land (64%). There is a certain phenomenon of mutual conversion among dry land, woodland and grassland, and the conversion rate is high, while the change between reservoir pit and beach is small, and the sum of them only accounts for 4.5% of the total land transfer area.
This phenomenon reflects the emphasis on water resources and wetland conservation in the process of urbanization, as well as the recognition of the ecosystem services and biodiversity protection they offer. It also suggests the existence of natural, technical, and economic constraints that may be encountered in the process of land use planning and management.
The distribution of habitat quality during 1980–2020 is shown in Figure 5, which is generally divided by the connecting line between northeast and southwest, with good habitat quality areas on the west side and poor habitat quality areas on the east side of the dividing line. Similar to the type of land use, the low habitat quality in the central city is expanding rapidly and seriously, approaching zero, and its radiation range is gradually expanding. The habitat quality in most areas in the northern and western mountainous areas is approaching one from a high level. With the development of the northwest city, the habitat quality in this area is gradually decreasing in the area with good habitat quality, and it is also producing certain negative radiation effects.
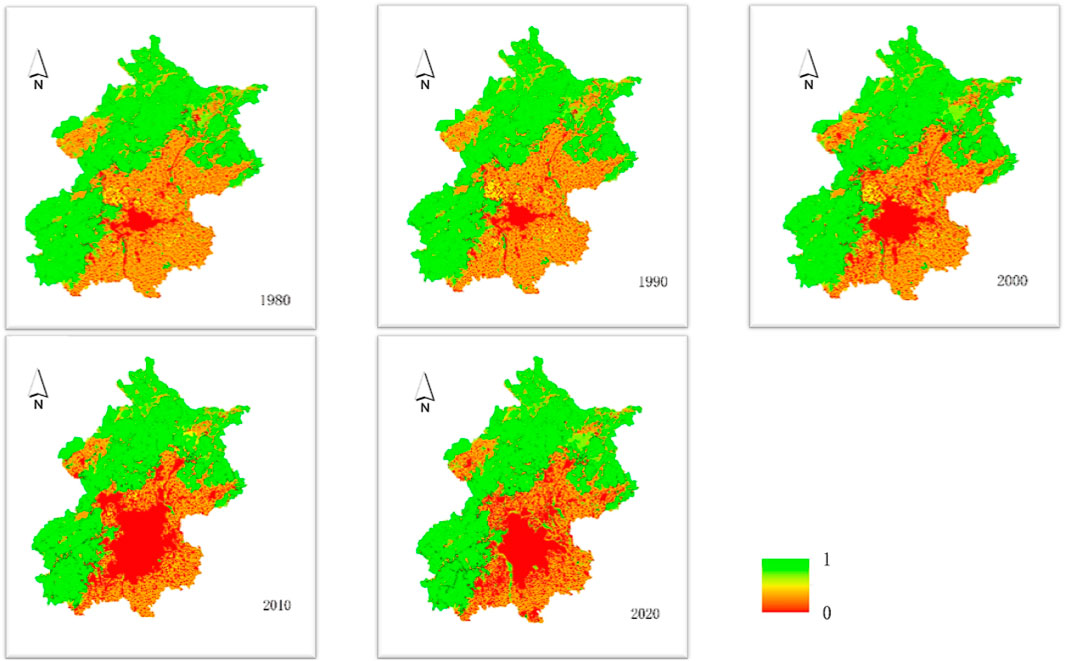
Figure 5. Habitat quality distribution.
The trend analysis chart of habitat quality based on long time series is shown in Figure 6. Although the habitat quality has improved in the past 10 years, from a long-term perspective, most areas are still in a trend of relatively low habitat quality, and the areas with more serious decline and better increase are all in the western and northern mountainous areas. Because of the strong human interference, the strong radiation effect of the central city makes the trend analysis of this area unchanged. With the outward development of the city, urbanization is more serious, and the original northwest mountain habitat quality is excellent, which is easily affected by human activities in urban development. Combined with the distribution of habitat quality from 2010 to 2020, the red spots in the northwest are gradually fading, indicating that the trend of habitat quality is gradually getting better, and the red spots in the central city are also shrinking, indicating that the impact of urbanization is gradually narrowing.
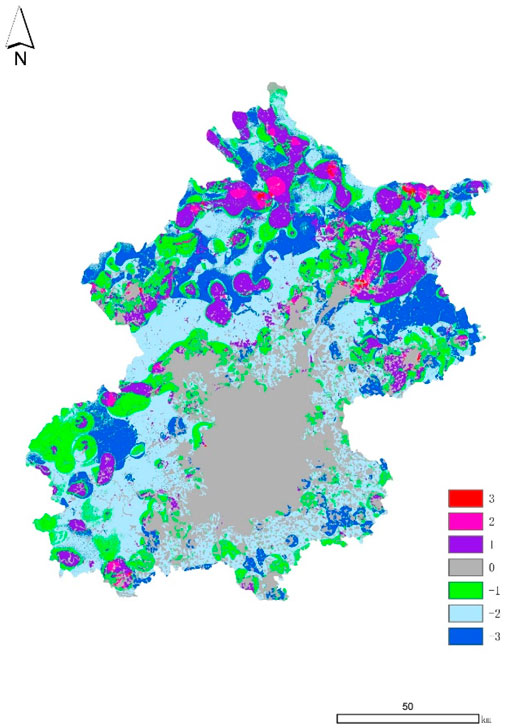
Figure 6. Trend analysis chart of habitat quality based on long time series.
With the advancement of reform and opening up in 1980s, Beijing has also entered a stage of rapid development. The internal road network of the Second Ring Road has been established. In 1990s, the permanent population of Beijing reached 10 million. In the process of promoting the regulatory detailed planning, a large number of construction land has been transformed from the original land types in an orderly manner. Until 2000, Beijing entered a stage of rapid expansion. The construction of the Fifth Ring Road and the gathering of a large number of migrants forced the construction land in northern Beijing to expand again, and almost all other types of land were compressed to supply construction land. In 2010, the city’s permanent population was 19.612 million, and the southern part of Beijing’s urban area gradually developed, and the scale of the urban area also formed a trend of maximization. In recent years, with the promotion of national land space planning, Beijing’s land planning and urban planning have been coordinated and unified, and Beijing’s cities have entered the stage of repair, upgrading and perfection. The state has gradually attached importance to environmental protection, and the northern mountainous areas and western mountainous areas have become ecological conservation areas in Beijing, which have undergone ecological protection-oriented restrictive development, and finally formed a large land-use type division with the northeast and southwest connecting lines as the division.
Land use types refer to the different ways and purposes of human use of land resources. Common land use types include agricultural land, urban land, industrial land, woodland and grassland. Each land use type will have different specific impacts on habitat quality, and these impact mechanisms are complex and diverse, which are not only related to the balance of natural ecosystems, but also closely related to the sustainable development of human society. First of all, as the main source of food for human beings, the expansion of agricultural land often means cutting down a large number of natural vegetation and destroying the ecosystem. In agricultural activities, the extensive use of chemical fertilizers and pesticides will lead to soil pollution and water pollution, which will further affect the health and stability of the ecosystem. In addition, over-exploitation and unreasonable utilization of agricultural land will also reduce biodiversity and reduce the service functions of ecosystems, such as soil conservation and water conservation. Urban land use is another important land use type. With the acceleration of urbanization, the area of urban land is expanding, which leads to the replacement of the original natural habitat by a large number of buildings. Urbanization not only changes the land cover, but also changes the structure and function of the ecosystem. For example, the heat island effect of urbanization will change the local climate and affect the survival and reproduction of animals and plants; Urban noise and light pollution can also cause interference and harm to living things. In addition, urban expansion is often accompanied by the fragmentation of biological habitats, which leads to the obstruction of species migration and gene exchange and further affects biodiversity. Industrial land is usually accompanied by emphasis on industrial activities and pollutant discharge, which has a particularly significant impact on the ecological environment. Waste gas, waste water and solid waste produced by industrial activities will directly or indirectly pollute soil, water and atmosphere, and cause serious damage to the quality of habitats. At the same time, the construction and operation of industrial land may also destroy the structure and function of ecosystem, such as destroying surface vegetation and changing hydrological cycle. These impacts not only damage the health of the ecosystem, but also pose a potential threat to human health and social well-being. In contrast, natural land use types such as woodland and grassland have positive effects on the maintenance of habitat quality. Woodland can provide rich biological habitats and maintain high biodiversity; At the same time, the forest also has the functions of regulating climate, conserving water and maintaining soil, which is very important for the stability of ecosystem and human survival. Grassland is also an important ecological barrier, which can slow down wind speed, prevent soil erosion and provide biological resources such as pasture. However, the protection and rational utilization of woodland and grassland also face many challenges. With the population growth and economic development, the demand for land resources is increasing, which leads to the continuous reduction of the area of woodland and grassland. In addition, unreasonable development and utilization will also destroy the structure and function of these natural ecosystems and reduce the quality of habitats.
For the transformation of land use types, the land use transfer rate in Beijing reached 30.5% from 1980 to 2020. In the 1980s and 1990s, the expansion of urban areas crowded out the original village cultivated land and transformed it into construction land and rural residential land. However, with the strengthening of urban planning and ecological attention, some shrubs and grasslands have become forested land due to manual intervention and natural succession, and about 30% of rural residential land has returned to cultivated land due to the national land comprehensive improvement policy. There is a certain phenomenon of mutual conversion among dry land, forest land and grassland, and the conversion rate is high, which shows that the conversion between natural land types is convenient and simple, with low cost and easy realization, and is suitable for comprehensive land improvement. In addition, Beijing, as an extremely water-deficient city, has been making great efforts to protect the reservoirs, ponds and beaches within its jurisdiction before the implementation of the South-to-North Water Transfer Project, so the changes of the two land types are small, and the sum of them only accounts for 4.5% of the total land transfer area.
InVEST model is based on the simulation and analysis of land use types, so there is a strong correlation between habitat quality and land use types, and it also shows the distribution of habitat quality divided by the connecting line between northeast and southwest, which is similar to the previous study of Beijing ecological pattern by Dr. Yu Kongjian (Kongjian et al., 2010; Xinliang et al., 2018). In addition, the annual expansion of low habitat quality in the urban area reflects the negative expansion of habitat quality, and the influence of human activities will cause the radiation change of habitat quality reduction, and its strong radiation effect makes the region unchanged in the trend analysis year by year. With the outward development of the city, urbanization is more serious, and the original northwest mountain habitat quality is excellent, which is easily affected by human activities in urban development. Combined with the distribution of habitat quality from 2010 to 2020, the red spots in the northwest are gradually fading, indicating that the trend of habitat quality is gradually getting better, and the red spots in the central city are also shrinking, indicating that the impact of urbanization is gradually narrowing. Therefore, in the process of urban construction, it is particularly important to build a certain isolation buffer zone. On the one hand, it can block the negative habitat radiation of urban development and reduce the negative impact on the construction of ecological conservation areas in northern and western mountainous areas. On the other hand, with the development of urban re-wilderness, a certain urban country ecosystem will be gradually established in the urban area. Together with the natural ecosystem in mountainous areas, the isolation zone will become a certain ecological ecotone, which can provide a different ecosystem with higher ecological quality for the response zone.
Compared with previous research on the ecological pattern of Beijing by Dr. Yu Kongjian and others, this study utilizes the InVEST model to provide a more specific and quantified perspective, confirming the spatial distribution characteristics of habitat quality in Beijing and its correlation with the urbanization process. Although similar in macro trends to previous research, this study specifically demonstrates the changes in habitat quality over time through quantitative analysis, as well as the details of the impact of different land use types on habitat quality, thereby offering more concrete guidance and basis for urban planning and ecological protection.
Studying the long-time series trend of habitat quality in Beijing is helpful to fully understand the evolution law of urban ecological environment. By collecting and analyzing the data for many years, we can reveal the changing trend and influencing factors of Beijing’s habitat quality in different periods, and then provide the basis for formulating scientific ecological protection policies and measures. At the same time, the study also helps to reveal the mechanism and path of urbanization affecting habitat quality, and provide scientific basis for urban planning and construction. In recent years, the Beijing Municipal Government has issued a series of ecological protection policies and measures, such as greening and beautification projects, wetland protection and ecological compensation, aiming at improving the quality of urban habitats. By evaluating the implementation effects of these policies and measures in a long time series, we can understand the improvement degree and existing problems of urban habitat quality, and then provide decision support for the optimization and perfection of policies. In addition, studying the long-term trend of habitat quality in Beijing is also helpful to improve the public’s understanding and participation in ecological environment protection. By revealing the changing trend and potential risks of urban ecological environment, we can guide the public to pay more attention to the ecological environment problems around them, actively participate in ecological protection actions, and form a good atmosphere of common concern and common protection for the whole society.
From the perspective of application value, studying the long-term trend of habitat quality in Beijing can provide scientific basis for ecological restoration and environmental governance. By analyzing the causes and mechanisms of the decline of habitat quality, we can formulate corresponding ecological restoration and environmental governance programs to improve the quality of urban habitats. At the same time, the study can also provide a basis for the division and management of ecological functional areas, and promote the healthy and sustainable development of urban ecosystems. In addition, studying the long-term trend of habitat quality in Beijing can also provide support and guidance for eco-tourism and green development. With people’s increasing attention to the ecological environment and healthy life, eco-tourism has become a new way of tourism. Through the research and evaluation of urban habitat quality, we can explore and popularize the eco-tourism resources in Beijing and promote the green and sustainable development of tourism. At the same time, the research can also provide decision support and direction guidance for the development of green industries, and promote the green transformation and upgrading of Beijing’s economy and society.
However, this study also faces certain limitations and challenges. Firstly, due to data constraints, the analysis in this paper mainly relies on macro data of land use conversion, lacking direct measurement of specific biodiversity indicators. This means that our assessment of habitat quality may not fully consider all dimensions of biodiversity. Secondly, although the InVEST model provides an effective tool for assessing habitat quality, the assumptions and parameter selections of the model itself may also affect the accuracy of the results. Moreover, urban development is a complex socio-economic process involving many factors and interventions, and the interactions of these factors may have complex effects on habitat quality, which this study did not fully cover.
Despite these challenges, the contributions of this paper to the knowledge field are still significant. This study not only provides a quantitative analysis of land use conversion and changes in habitat quality in Beijing over 40 years but also offers a new perspective on understanding the impact of urban development on habitat quality by linking it with the urbanization process. In particular, this study emphasizes the importance of establishing isolation buffer zones in urban planning to reduce the negative impact of urbanization on ecological conservation areas, while promoting urban rewilding, providing valuable insights for improving the quality of ecosystem services (Xiao et al., 2023).
Future research needs to further refine the relationship between land use types and biodiversity indicators, and explore more effective strategies for controlling the impact of urban development on the ecological environment, thereby providing more comprehensive and in-depth scientific support for achieving sustainable urban development.
Over the past few decades, the types and areas of land use in urban and rural areas have undergone significant changes. From 1990 to 2010, the expansion of construction land was the most noticeable, and this change was almost achieved by compressing other types of land, among which cultivated land and construction land have experienced certain changes in nearly 40 years. In Beijing, between 1980 and 2020, the land use type transfer rate reached 30.5%, involving a total area of 499,982.98 ha. During this process, the top five outflows were dry land, shrubland, high-cover grassland, beach land, and rural residential land, while the largest inflows were rural residential land, urban land, dry land, forested land, and other construction lands. In terms of habitat quality, the overall trend from 1980 to 2020 shows that the area west of the line connecting the northeast and southwest has good habitat quality, while the east side has poorer habitat quality. In the last decade, although the overall habitat quality has improved, most areas are still in a trend of declining habitat quality, especially in some areas of the western and northern mountains, where the decrease in habitat quality is more severe, and the areas with better improvement are also located in these mountains. Facing the ecological pressure brought by urban construction, it is recommended to introduce the concept of isolation buffer zones in urban construction. Such buffer zones can effectively block the negative impact of urban development on the surrounding habitat, while providing higher ecological quality and ecosystem services for the city. Through such measures, a balance can be found between urban development and ecological protection, thus promoting the realization of sustainable development.
The original contributions presented in the study are included in the article/Supplementary material, further inquiries can be directed to the corresponding author.
JW: Conceptualization, Data curation, Formal Analysis, Funding acquisition, Investigation, Methodology, Project administration, Resources, Software, Supervision, Validation, Visualization, Writing–original draft, Writing–review and editing. YJ: Conceptualization, Writing–original draft, Writing–review and editing. QT: Conceptualization, Writing–original draft, Writing–review and editing. FL: Conceptualization, Writing–original draft, Writing–review and editing. CD: Writing–original draft, Writing–review and editing. TL: Conceptualization, Writing–original draft, Writing–review and editing. JL: Supervision, Writing–original draft. CH: Supervision, Writing–review and editing. XC: Conceptualization, Writing–original draft, Writing–review and editing. YL: Conceptualization, Writing–original draft, Writing–review and editing. XZ: Conceptualization, Writing–original draft, Writing–review and editing. GZ: Conceptualization, Writing–original draft, Writing–review and editing.
The author(s) declare that no financial support was received for the research, authorship, and/or publication of this article.
Authors JW, YJ, QT, FL, CD, TL, XC, YL, XZ, and GZ were employed by PowerChina Beijing Engineering Corporation Limited. Author JL was employed by Anhui Province Jing County Niu Ling Reservoir Project Construction Management Division. Author CH was employed by Jing County Water Conservancy Bureau.
All claims expressed in this article are solely those of the authors and do not necessarily represent those of their affiliated organizations, or those of the publisher, the editors and the reviewers. Any product that may be evaluated in this article, or claim that may be made by its manufacturer, is not guaranteed or endorsed by the publisher.
Ban, Y., Liu, X., Yin, Z., Li, X., Yin, L., and Zheng, W. (2023). Effect of urbanization on aerosol optical depth over Beijing: Land use and surface temperature analysis. Urban Clim. 51, 101655. doi:10.1016/j.uclim.2023.101655
Cai, Y. B., Zhang, H., Pan, W. B., Chen, Y. H., and Wang, X. R. (2013). Land use pattern, socio-economic development, and assessment of their impacts on ecosystem service value: study on natural wetlands distribution area (NWDA) in Fuzhou city, southeastern China. Environ. Monit. Assess. 185, 5111–5123. doi:10.1007/s10661-012-2929-x
Falcucci, A., Maiorano, L., and Boitani, L. (2007). Changes in land-use/land-cover patterns in Italy and their implications for biodiversity conservation. Landsc. Ecol. 22 (4), 617–631. doi:10.1007/s10980-006-9056-4
Gao, Y., Ma, L., Liu, J., Zhuang, Z., and Huang, Q. (2017). Constructing ecological networks based on habitat quality assessment: a case study of Changzhou, China. Sci. Rep. 7 (1), 46073. doi:10.1038/srep46073
Hamed, K. H., and Rao, A. R. (1998). A modified Mann-Kendall trend test for autocorrelated data. J. hydrology 204 (1). doi:10.1016/s0022-1694(97)00125-x
Hu, X., and Xu, H. (2018). A new remote sensing index for assessing the spatial heterogeneity in urban ecological quality: a case from Fuzhou City, China. Ecol. Indic. 89, 11–21. doi:10.1016/j.ecolind.2018.02.006
Jia, X., Li, G., and Zhao, H. (2013). Study on the change of landscape ecological quality based on land use: a case study in resource-exhausted mining area. Prog. Environ. Prot. Process. Resour. Pts 1–4 (295–298), 2679–2683.
Kongjian, Y., Sisi, W., Dihua, L., et al. (2010). The ecological bottom line of Beijing's urban expansion-basic ecosystem services and its security pattern. Urban Plan. (2), 19–24.
Liu, M., Zhang, H., Wang, Y., et al. (2021). Study on habitat quality of farming-pastoral ecotone in northern China based on land use. Res. Soil Water Conservation 28 (3), 156–162.
Phillips, S. J., Anderson, R. P., Schapire, R. E., Phillips, S. J., Anderson, R. P., and Schapire, R. E. (2013). Maximum entropy modeling of species geographic distributions. Ecol. Model. 190, 231–259. doi:10.1016/j.ecolmodel.2005.03.026
Sala, O. E., Iii, F. S. C., Armesto, J. J., Berlow, E., Bloomfield, J., et al. (2000). Biodiversity: global biodiversity scenarios for the year 2100. Science 287 (5459), 1770–1774. doi:10.1126/science.287.5459.1770
Tallis, H. T., Ricketts, T., Guerry, A. D., et al. (2012). InVEST 2.4.4 user's guide [EB/OL]. Available at: http://ncp-dev.stanford.edu/∼dataportal/invest-releasesfdocumentation/InVEST_2.4.4_Documentation.pdf.
Tang, J., Zhou, L., Dang, X., Hu, F., Yuan, B., Yuan, Z., et al. (2023). Impacts and predictions of urban expansion on habitat quality in the densely populated areas: a case study of the Yellow River Basin, China. Ecol. Indic. 151, 110320. doi:10.1016/j.ecolind.2023.110320
Vannest, K. J., Parker, R. I., Davis, J. L., Soares, D. A., and Smith, S. L. (2012). The Theil–Sen slope for high-stakes decisions from progress monitoring. Behav. Disord. 37 (4), 271–280. doi:10.1177/019874291203700406
Wang, A., Zhang, M., Kafy, A. A., Tong, B., Hao, D., and Feng, Y. (2023). Predicting the impacts of urban land change on LST and carbon storage using InVEST, CA-ANN and WOA-LSTM models in Guangzhou, China. Earth Sci. Inf. 16.1, 437–454. doi:10.1007/s12145-022-00875-8
Wu, W., Xu, L., Zheng, H., and Zhang, X. (2023). How much carbon storage will the ecological space leave in a rapid urbanization area? Scenario analysis from Beijing-Tianjin-Hebei Urban Agglomeration. Resour. Conservation Recycl. 189, 106774. doi:10.1016/j.resconrec.2022.106774
Xiang, Q., Kan, A., Yu, X., Liu, F., Huang, H., Li, W., et al. (2023). Assessment of topographic effect on habitat quality in mountainous area using InVEST model. Land 12 (1), 186. doi:10.3390/land12010186
Xiao, P., Zhou, Y., Li, M., and Xu, J. (2023). Spatiotemporal patterns of habitat quality and its topographic gradient effects of Hubei Province based on the InVEST model. Environ. Dev. Sustain. 25, 6419–6448. doi:10.1007/s10668-022-02310-w
Xinliang, X., Liu, J., Shuwen, Z., Rendong, L., Changzhen, Y., and Wu, S. (2018). Multi-period remote sensing monitoring data set of land use in China (CNLUCC). Resour. Environ. Sci. data registration Publ. Syst. doi:10.12078/2018
Ying, X., Zhang, Y., and Enhua, L. (2022). Temporal and spatial evolution and prediction of habitat quality in the four-lake basin of Jianghan Plain. Resour. Environ. Yangtze River Basin 31 (7), 1616–1626.
Yu, P., Zhang, S., Yung, E. H. K., Chan, E. H., Luan, B., and Chen, Y. (2023). On the urban compactness to ecosystem services in a rapidly urbanising metropolitan area: highlighting scale effects and spatial non–stationary. Environ. Impact Assess. Rev. 98, 106975. doi:10.1016/j.eiar.2022.106975
Zhang, M., Wang, J., Zhang, Y., and Wang, J. (2023b). Ecological response of land use change in a large opencast coal mine area of China. Resour. Policy 82, 103551. doi:10.1016/j.resourpol.2023.103551
Zhang, X., Liao, L., Huang, Y., Fang, Q., and Lan, S. (2023a). Conservation outcome assessment of Wuyishan protected areas based on InVEST and propensity score matching. Glob. Ecol. Conservation 45, e02516. doi:10.1016/j.gecco.2023.e02516
Zhang, X., Song, W., Lang, Y., Feng, X., Yuan, Q., and Wang, J. (2020). Land use changes in the coastal zone of China’s Hebei Province and the corresponding impacts on habitat quality. Land use policy 99, 104957. doi:10.1016/j.landusepol.2020.104957
Keywords: Beijing, long time series, habitat quality, InVEST, Theil-Sen median
Citation: Wei J, Jin Y, Tan Q, Liu F, Ding C, Li T, Luo J, Hu C, Cui X, Liu Y, Zheng X and Zhang G (2024) Trend analysis of long-time series habitat quality in Beijing based on multiple models. Front. Environ. Sci. 12:1428197. doi: 10.3389/fenvs.2024.1428197
Received: 05 May 2024; Accepted: 15 July 2024;
Published: 30 July 2024.
Edited by:
Xiao Ouyang, Hunan University of Finance and Economics, ChinaReviewed by:
Siyun Chen, Hunan University of Finance and Economics, ChinaCopyright © 2024 Wei, Jin, Tan, Liu, Ding, Li, Luo, Hu, Cui, Liu, Zheng and Zhang. This is an open-access article distributed under the terms of the Creative Commons Attribution License (CC BY). The use, distribution or reproduction in other forums is permitted, provided the original author(s) and the copyright owner(s) are credited and that the original publication in this journal is cited, in accordance with accepted academic practice. No use, distribution or reproduction is permitted which does not comply with these terms.
*Correspondence: Yi Jin, Mzc4NTY4MTEzQHFxLmNvbQ==
Disclaimer: All claims expressed in this article are solely those of the authors and do not necessarily represent those of their affiliated organizations, or those of the publisher, the editors and the reviewers. Any product that may be evaluated in this article or claim that may be made by its manufacturer is not guaranteed or endorsed by the publisher.
Research integrity at Frontiers
Learn more about the work of our research integrity team to safeguard the quality of each article we publish.