 Li Qi*
 Yanan Li
- Institute of Land Engineering and Technology, Shaanxi Provincial Land Engineering Construction Group Co., Ltd., Xi’an, China
The irrational application of chemical fertilizers in wheat cultivation not only threatens the agricultural ecosystem but also significantly contributes to carbon emissions, impeding the achievement of “carbon peaking” and “carbon neutrality” goals. The objective of this research is to assess the efficiency of chemical fertilizer use in wheat production across ten major wheat-producing provinces in China from 2004 to 2020. We employed a stochastic frontier production function to evaluate the technical efficiency of fertilizer use, determining feasible reduction levels. The Gini coefficient, kernel density estimation, and Markov chain analysis were further utilized to dissect the spatio-temporal dynamics of carbon emission reduction potential. Our findings provide a detailed analysis of the carbon emission reduction potential in wheat chemical fertilizer use across China’s ten major wheat-producing provinces from 2004 to 2020. The average carbon emission reduction potential is significant, at 251.1 kg CE/hm2, with considerable variation observed among regions. The western region, in particular, stands out with the highest potential, reaching up to 336.51 kg CE/hm2, which is notably higher compared to the eastern (230.05 kg CE/hm2) and central regions (158.28 kg CE/hm2). The spatial distribution of this potential is uneven, and the disparities are progressively increasing, primarily due to inter-regional differences. Despite a general decline in carbon reduction potential, the spatial distribution remains relatively consistent. To foster sustainable wheat production, it is imperative to prioritize the western region for targeted chemical fertilizer carbon reduction initiatives. Attention must also be given to the issue of regional disparities in low-carbon wheat production. Enhancing the role of soil testing and fertilizer recommendations is essential to increase the effectiveness of carbon reduction efforts. Additionally, a multi-faceted approach that incorporates various alternative measures is necessary to drive further reductions in chemical fertilizer-related carbon emissions.
1 Introduction
The extensive use of chemical fertilizers has been a cornerstone of modern agriculture, significantly enhancing crop yields to meet the growing global food demand (Wang et al., 2022). However, this practice has not come without environmental consequences, particularly in terms of greenhouse gas emissions, which are critically linked to climate change. The urgency of addressing this issue is echoed by the Paris Agreement and the global commitment to sustainable development goals, highlighting the need for innovative agricultural practices that balance productivity with environmental stewardship.
China, being the world’s largest consumer and producer of chemical fertilizers, presents a unique case study in the quest for sustainable agricultural practices (Liao and Mi, 2022; Wei et al., 2022; Liu et al., 2023). While the country has seen a rapid increase in fertilizer use since the 1990s, contributing to impressive gains in crop production, this has also led to concerns over soil health and environmental sustainability (Wu et al., 2021; Guo et al., 2022; Saeed et al., 2022). The situation in China mirrors global trends, where the excessive use of chemical fertilizers has raised alarm bells in agricultural communities and policy circles worldwide.
International studies have underscored the negative environmental impacts of chemical fertilizers, including soil degradation, groundwater pollution, and the emission of greenhouse gases (Guo et al., 2021; Oyetunji et al., 2022). Moreover, research from the Indo-Gangetic Plains to the agricultural heartlands of Europe has consistently pointed towards the significant potential for carbon reduction through more efficient fertilizer use (Higgins et al., 2023).
This study aims to contribute to the global discourse by focusing on the carbon emission reduction potential in wheat chemical fertilizer use in China. Wheat, being a staple food for billions, makes it a focal point for sustainable agricultural practices. By employing a stochastic frontier production function and advanced analytical methods (Higgins et al., 2023; Jordan-Meille et al., 2023; Micha et al., 2023), this research quantifies the efficiency of chemical fertilizer use and its carbon reduction potential in wheat cultivation across China’s major wheat-producing provinces. The findings are expected to provide actionable insights for policymakers and stakeholders, not only in China but also offer a reference for other regions grappling with similar challenges.
The research outlines a study that utilizes panel data from 10 major wheat-producing provinces in China from 2004 to 2020 to measure the efficiency of chemical fertilizer input in wheat production and the proportion of fertilizer that can be reduced, thereby delving into the potential for carbon emission reduction from wheat chemical fertilizer use. The study innovates and expands upon previous research in the following two aspects:
(1) It takes into account the constraints of economic and social factors, employing the Stochastic Frontier Analysis (SFA) method, which has advantages in dealing with random errors and statistical disturbances, to measure the technical efficiency of wheat production. Consequently, this method yields the efficiency of chemical fertilizer input for wheat, establishing the proportion of fertilizer that can be reduced per unit area (the extent to which actual fertilizer application deviates from the economically optimal amount) as a basis for carbon emission reduction, thus assessing the potential for carbon reduction from wheat chemical fertilizer.
(2) The study employs the Gini coefficient, Kernel density estimation, and Markov chain analysis methods to delineate the spatial disparities and dynamic evolution characteristics of the carbon emission reduction potential of wheat chemical fertilizer. It analyzes and summarizes the spatiotemporal evolution patterns of this potential.
2 Research methods and data
The research frame diagram is as follows:
2.1 Stochastic frontier analysis (SFA) model
The paper employs the Stochastic Frontier Analysis (SFA) method to measure the efficiency of chemical fertilizer input in wheat production in China (Song and Chen, 2019). The chemical fertilizer input efficiency is defined as the ratio of the minimum possible amount of chemical fertilizer application to the actual amount applied, given a certain level of output and other input factors. Building upon the measurement of agricultural production technical efficiency, to avoid the potential issue of multicollinearity in the transcendental log production function model, the stochastic frontier function is set as the conventional Cobb-Douglas function form widely used in the measurement of agricultural production technical efficiency. The stochastic frontier production function model for wheat is defined as follows:
Where:
By substituting the minimum feasible amount of chemical fertilizer application
Since the output values of Eqs 1, 3 are equal, subtracting the latter from the former and deriving (Pei et al., 2023) it leads to the chemical fertilizer input efficiency
Given that chemical fertilizer input efficiency
2.2 Fertilizer carbon emission reduction potential estimation method
The paper refers to the calculation methods for agricultural carbon emissions in existing studies (Chen et al., 2020; Koondhar et al., 2021) and constructs a formula for carbon emission reduction potential based on the reduction of wheat fertilizer application according to the research topic, See Eq. 6 for details:
In the formula,
2.3 Dagum gini coefficient
The paper utilizes the Gini coefficient group decomposition method proposed by Zhang et al. (2022) to calculate the spatial distribution Gini coefficient of the carbon emission reduction potential of wheat fertilizer from 2004 to 2020 and to conduct regional decomposition. The Eq. 7 for the Gini coefficient is as follows:
Where
The calculation Eq. 8 for the within-group Gini coefficient
The calculation Eq. 9 (Wang et al., 2022) for the contribution of within-group differences
The calculation Eq. 10 for the between-group Gini (Meng et al., 2023) coefficient
The calculation Eq. 11 for the contribution of between-group (Sinha and Chaudhury, 2021) differences
Where
Where
The calculation Eq. 13 for the contribution (Wang et al., 2022) of super variance
2.4 Kernel density estimation
Assuming random variables
Where N is the sample size; h is the bandwidth;
2.5 Markov chain analysis method
The paper constructs a Markov transition matrix to reflect the dynamic evolution characteristics of the distribution of wheat chemical fertilizer carbon emission reduction potential (Wu et al., 2022). The Markov chain method is represented as a stochastic process
Where:
2.6 Data sources
The paper uses the Stochastic Frontier Analysis (SFA) method to measure the technical efficiency of wheat production, thereby obtaining the efficiency of chemical fertilizer input for wheat, and subsequently determining the proportion of chemical fertilizer that can be reduced as the basis for carbon emission reduction. To this end, data from 10 major wheat-producing provinces for the years 2004–2020 were selected (including Henan Province, Shandong Province, Anhui Province, Hebei Province, Jiangsu Province, Xinjiang Uygur Autonomous Region, Shaanxi Province, Hubei Province, Gansu Province, and Sichuan Province. The wheat output of these provinces accounted for 94.4% of the total national wheat production in 2020), resulting in a sample size of 170.
For the estimation of the stochastic frontier production function, based on existing research [14,20,21], the following input variables were selected: chemical fertilizer application per unit area (hm2) (kg), labor input (days), seed usage (kg), and machinery costs (CNY). The output variable was wheat yield (kg). The input and output data for wheat were derived from the “National Agricultural Product Cost and Benefit Data Compilation” for the years 2005–2021. To ensure comparability over time, the machinery costs were deflated using the Agricultural Production Materials Price Index, with 2004 as the base year. The chemical fertilizer inputs for wheat include nitrogen, phosphorus, and potassium fertilizers, as well as compound fertilizers (diammonium phosphate, triple superphosphate, blended fertilizers, etc.). The other fertilizer components contained in compound fertilizers were also converted into their corresponding amounts of nitrogen, phosphorus, and potassium fertilizers. The specific conversion standards are shown in Table 1.
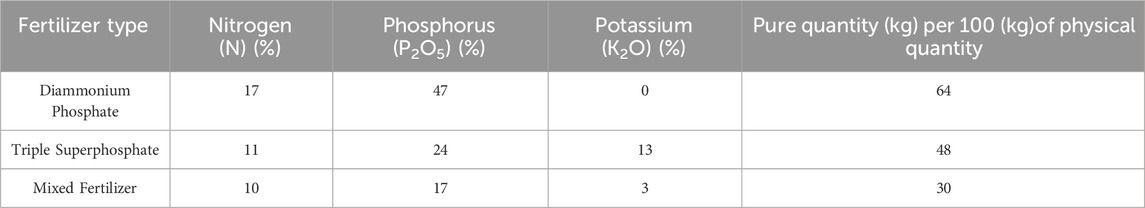
Table 1. Methods of conversion for nitrogen, phosphorus, and potassium fertilizers in compound fertilizers.
3 Result and analysis
3.1 Results of the measurement of wheat fertilizer input efficiency and carbon emission reduction potential
The Frontier Analyst 4.1 software was used to perform the maximum likelihood estimation on model (1), and the results are presented in Table 2. The coefficients of the variables were all significant at the 1% level, and the one-sided likelihood ratio (LR) test rejected the null hypothesis of no technical inefficiency (u = 0), demonstrating that there is indeed technical inefficiency in China’s wheat production. This confirms the effectiveness of the SFA model setting. Additionally, the gamma (γ) value reached 0.866 and was significant at the 1% level, indicating that 86.6% of the error in the stochastic frontier production function is attributed to technical inefficiency, with only 13.4% due to uncontrollable random factors (statistical errors, weather, etc.). This suggests that the SFA model estimation is effective, and the use of the stochastic frontier function analysis method is appropriate.
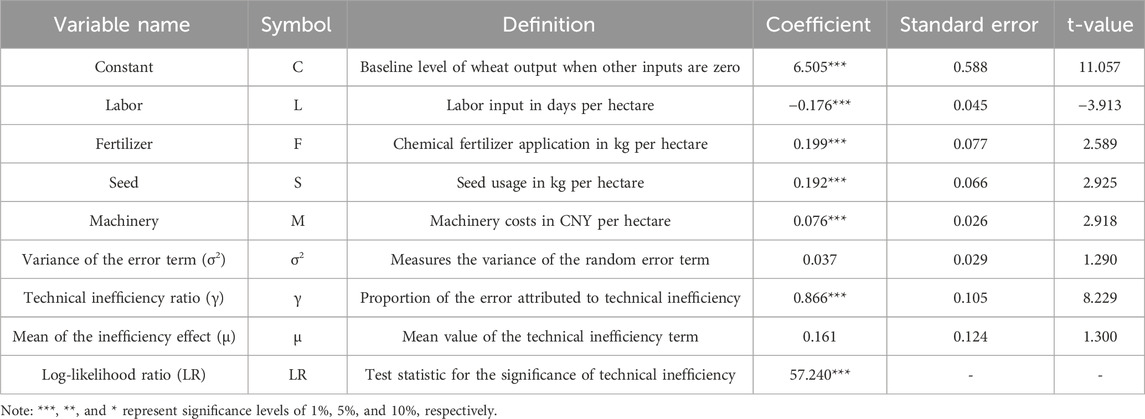
Table 2. Estimation results of the stochastic frontier production function model.
From the model estimation results, among the four input factors, the output elasticity of chemical fertilizer is the highest, indicating that increasing chemical fertilizer input can further enhance wheat yield under current production conditions. The output elasticity for seeds and machinery is also positive, suggesting that increasing the input of quality seeds and promoting mechanization can effectively improve wheat yield. The negative output elasticity for the labor factor indicates that there is a serious issue of labor involution in the current wheat production process. Using formulas (2), (4), and (6), the technical efficiency of wheat production, the efficiency of chemical fertilizer input, and the carbon emission reduction potential were calculated, respectively. The results are categorized by the three major economic zones and presented in Table 3.
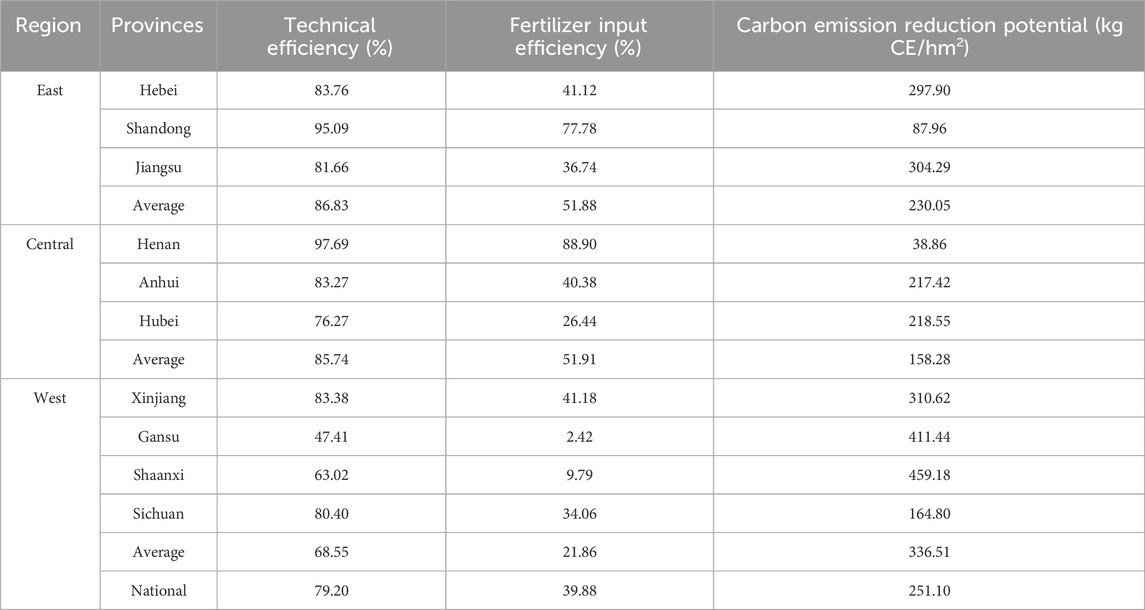
Table 3. Average values of fertilizer carbon emission reduction potential in major wheat-producing provinces by region, 2004-2020.
Overall, for the 17-year period, the average technical efficiency of wheat production across the 10 major wheat-producing provinces reached 79.20%. However, the efficiency of chemical fertilizer input was relatively low, at only 39.88%. The average carbon emission reduction potential was 251.1 kg CE/hm2, a result that is close to existing studies [14] and thus considered to be relatively reliable. When examining the differences between provinces, there is a significant variation in carbon emission reduction potential, with the highest reaching 459.18 kg CE/hm2 (Shaanxi Province) and the lowest at 38.86 kg CE/hm2 (Henan Province). Half of the provinces have a carbon emission reduction potential greater than the average value of 251.1 kg CE/hm2.
Looking at the regions, the eastern and central parts of the country do not show a large difference in technical efficiency and chemical fertilizer input efficiency, which are 86.83% and 85.74%, and 51.88% and 51.91%, respectively. However, the eastern region has a greater carbon emission reduction potential than the central region. The western region has lower technical efficiency compared to the central and eastern regions, with a chemical fertilizer input efficiency that is significantly lower at only 21.86%. The carbon emission reduction potential in the western region is much higher than that in the central and eastern regions, reaching 336.51 kg CE/hm2. Overall, the carbon emission reduction potential shows a pattern of decreasing from the eastern to the western regions and then increasing again, with significant differences in carbon emission reduction potential both within and between regions. It is therefore necessary to conduct an in-depth analysis of the spatial differences in the carbon emission reduction potential of the major wheat-producing provinces in China to identify the patterns of spatial differences and to propose targeted recommendations.
3.2 Regional differences in wheat fertilizer carbon emission reduction potential and its decomposition
By calculating the Gini coefficient using formula (7), the paper measured the spatial distribution of the carbon emission reduction potential of wheat fertilizer. Following the group decomposition method of the Gini coefficient proposed by Dagum, and referring to existing research [22], the paper decomposed the regional disparities in the distribution of the carbon emission reduction potential of wheat fertilizer according to the three major regions of East, Central, and West, with the results shown in Table 4.
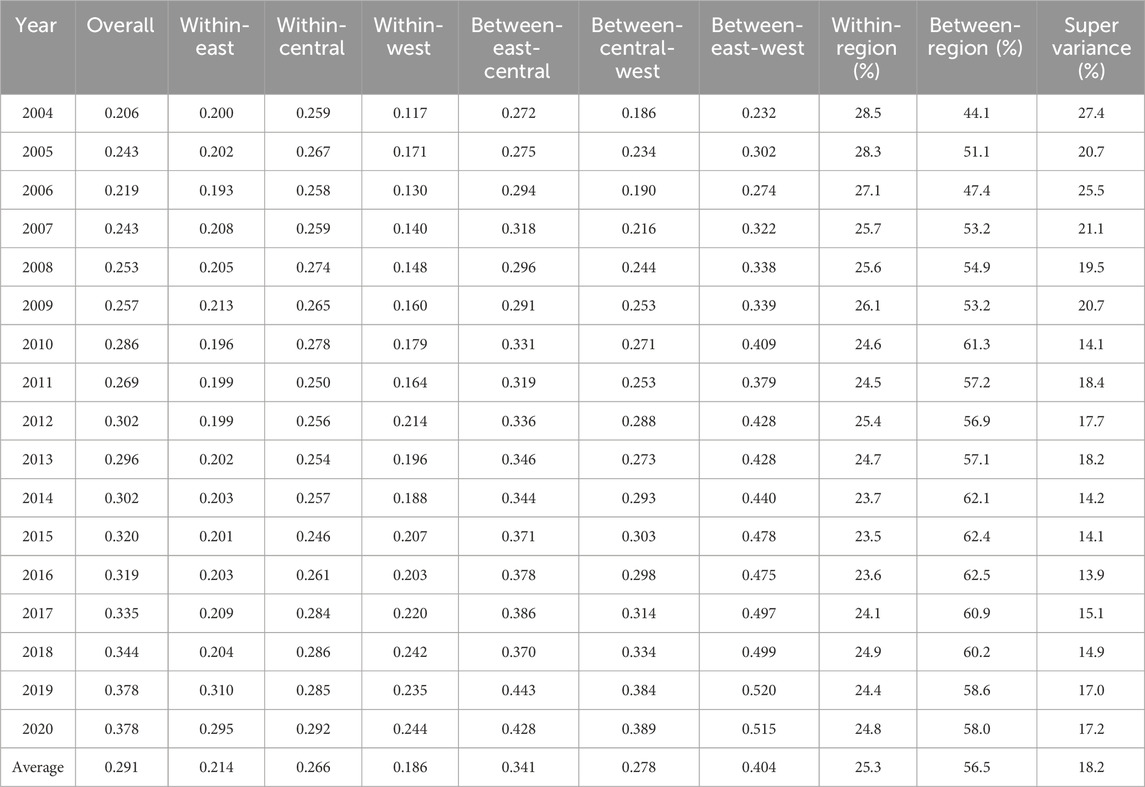
Table 4. Gini coefficients for the distribution of fertilizer carbon emission reduction potential in major wheat-producing provinces and by region, 2004-2020.
From the overall trend of the Gini coefficient, it can be seen that from 2004 to 2020, the overall Gini coefficient for the carbon emission reduction potential of wheat fertilizer in the main producing areas showed an increasing trend. It started from a minimum value of 0.206 in 2004 and reached the highest value of 0.378 in 2019, marking an increase of 83.5% over the 17 years, with an average annual increase of nearly 5%. This indicates that the spatial distribution disparity of the carbon emission reduction potential of wheat fertilizer in the main producing areas is gradually expanding.
3.2.1 Intra-regional disparities
Upon analyzing the Gini coefficients for intra-regional disparities, it was found that over the 17 sampled years, the disparities within the Eastern and Central regions fluctuated mildly, while the Gini coefficient for the Western region’s intra-regional disparities increased by 40% from 0.117 to 0.164, indicating a significant expansion of disparities within the region.
In the second phase, spanning from 2012 to 2018, only the Eastern region’s intra-regional disparities remained relatively stable, whereas both the Central and Western regions experienced an expansion in their intra-regional disparities. In the third phase, from 2018 to 2020, the intra-regional disparities in all three regions continued to expand, with the Eastern region’s disparities exceeding those of the Central and Western regions, showing an average annual growth rate of over 20%.
Over the entire sample period, the intra-regional disparities in the Eastern, Central, and Western regions all exhibited a gradually increasing trend, with the average annual growth rates of the Gini coefficients being 3%, 0.8%, and 6.78%, respectively. This suggests that the Western region has the fastest growth rate in the expansion of intra-regional disparities in the carbon emission reduction potential of wheat fertilizer, while the Central region has the slowest.
3.2.2 Inter-regional disparities
Upon analyzing the Gini coefficients for inter-regional disparities, it was observed that over the 17 sampled years, the Gini coefficients for the disparities between the three major regions—Eastern, Central, and Western—have all shown an upward trend, with the Eastern-Central, Central-Western, and Eastern-Western inter-regional disparities increasing annually by 3.6%, 6.8%, and 7.6%, respectively. This indicates that the spatial distribution disparities in the carbon emission reduction potential of wheat fertilizer between the three regions are progressively widening, with the Eastern and Western regions having the largest disparity and the fastest growth rate. The disparity between the Central and Eastern regions is the next largest, and the disparity between the Central and Western regions is the smallest.
3.2.3 Gini coefficient contribution rate
Upon analysis of the contribution rates of the Gini coefficients, it was found that over the 17 sampled years, the contribution rate of inter-regional disparities has always been the highest, rising from 44.1% in 2004 to 58% in 2020, with an average annual increase of nearly 2%. The contribution rate of super variability decreased from 27.4% in 2004 to 17% in 2020, remaining at a relatively low level throughout the sample period. On average, the contribution of inter-regional disparities was the greatest at 56.5%, followed by intra-regional disparities and super variability, averaging at 25.3% and 18.2%, respectively. This suggests that inter-regional disparities are the primary cause of the emergence and expansion of regional disparities in the carbon emission reduction potential of wheat fertilizer.
3.3 Kernel density estimation of wheat fertilizer carbon emission reduction potential
The paper employs Eviews software to calculate the Kernel density estimation as per formula (15) and to illustrate the distribution state differences and dynamic evolution patterns of the carbon emission reduction potential of wheat fertilizer. Figures 1–4 depict the overall and regional dynamic evolution of the carbon emission reduction potential distribution for the major wheat-producing provinces from 2004 to 2020.
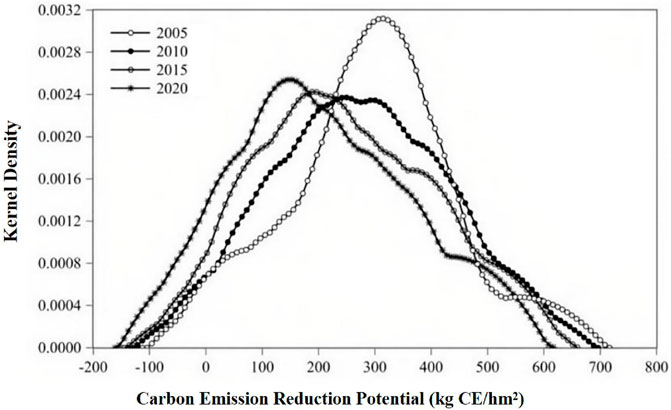
Figure 1. The dynamic evolution of the overall fertilizer carbon emission reduction potential in wheat-producing provinces from 2004 to 2020.
Figure 2 provides a comprehensive description of the evolution of the carbon emission reduction potential for the 10 major wheat-producing provinces during the sample period. Firstly, the Kernel density curve of the carbon emission reduction potential consistently shifts to the left, with the main peak of carbon emission reduction potential at 310 kg CE/hm2 in 2005, which then declines to around 120 kg CE/hm2 by 2020. This indicates that the overall carbon emission reduction potential is on a downward trend. Secondly, the Kernel density curves for the four sample years all exhibit a unimodal shape, with the peaks becoming flatter, suggesting that the spatial disparity in carbon emission reduction potential is progressively widening.
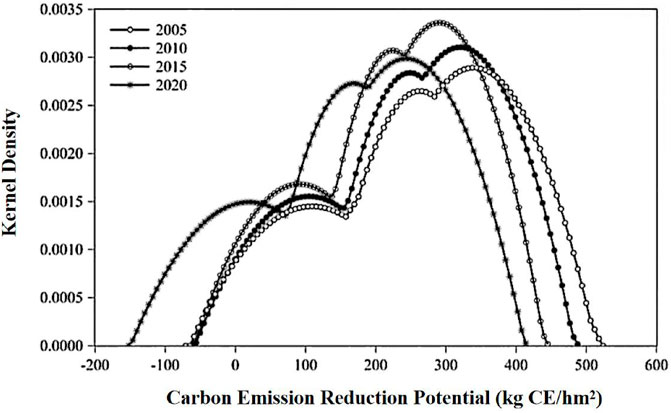
Figure 2. Dynamic evolution of carbon emission reduction potential of fertilizer in wheat production in the eastern region of China.
Figures 3, 4 describe the evolution of the carbon emission reduction potential distribution for the wheat-producing provinces in the Eastern, Central, and Western regions, respectively. Firstly, the Kernel density curves for both the Eastern and Central regions shift to the left, indicating a downward trend in the carbon emission reduction potential for these regions. In contrast, the main peak of the Kernel density curve for the Western region first moves to the right and then to the left, with the rightward shift being greater than the leftward shift, resulting in an overall increasing trend in the carbon emission reduction potential. Secondly, the Kernel density curves for the three regions at the four sample years mostly present a multimodal shape, with the Eastern region’s curves showing minimal change in the main and side peaks, indicating a relatively stable disparity in carbon emission reduction potential. The Central region’s curves show a rising and sharpening peak, suggesting a continuous reduction in the disparity of carbon emission reduction potential. The Western region’s curves transition from a unimodal to a multimodal shape, with the peaks becoming broader over time, indicating an expansion of the variation range, which signifies that while the carbon emission reduction potential in the Western region is increasing, the intra-regional disparities are also expanding.
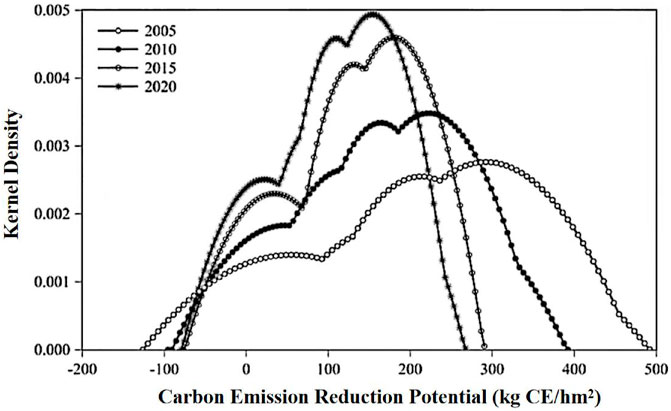
Figure 3. Dynamic evolution of carbon emission reduction potential of fertilizer in wheat production in the central region of China.
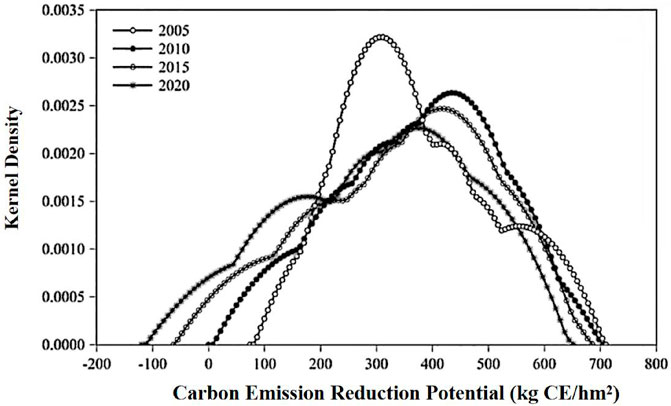
Figure 4. Dynamic evolution of carbon emission reduction potential of fertilizer in wheat production in the western region of China.
3.4 Markov chain analysis of wheat fertilizer carbon emission reduction potential
The paper utilizes the measured data on the carbon emission reduction potential of wheat-producing regions to set the time span as 1, 2, 3, 4, and 5 years. It categorizes the carbon emission reduction potential of each province into four levels: low, medium-low, medium-high, and high. By employing the Markov chain analysis method, a Markov transition probability matrix is constructed, as shown in Table 5.
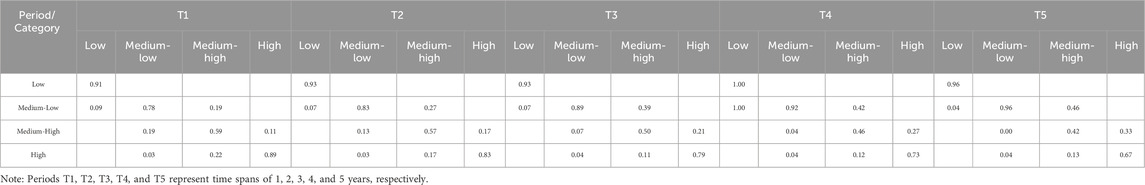
Table 5. Markov transition probability matrix of wheat fertilizer carbon emission reduction potential.
From the transition trends, it is observed that from 2004 to 2020, among the 10 major wheat-producing provinces, as the transfer time T increases, the probability for regions at the low, medium-low, and medium-high levels of carbon emission reduction potential to move up to a higher level gradually decreases. Conversely, the probability for regions at the high, medium-high, and medium-low levels to transfer down to a lower level increases, indicating a trend of the carbon emission reduction potential moving from higher levels to lower levels.
In terms of stability, the probability for the carbon emission reduction potential to remain in its original state ranges from 42% to 100%. The diagonal probabilities in the transition probability matrix are significantly larger than the off-diagonal probabilities, indicating that there is low mobility between different levels of carbon emission reduction potential, which suggests a certain degree of stability in the spatial distribution of the carbon emission reduction potential of the major wheat-producing provinces in China.
4 Discussion
The findings of our study on the spatial-temporal analysis of carbon emission reduction potential in wheat chemical fertilizer use contribute to the body of literature focused on sustainable agricultural practices and the pursuit of carbon neutrality. Our results indicate a significant average carbon emission reduction potential of 251.1 kg CE/hm2 across China’s ten major wheat-producing provinces from 2004 to 2020. This figure is particularly noteworthy when juxtaposed with findings from other regions and studies. For instance, a comparative analysis with the Indo-Gangetic Plains, as reported by Chandel et al. (2022), reveals a similar trend in the potential for carbon reduction through efficient fertilizer use. However, the specific potential we identified in the western region of China, reaching up to 336.51 kg CE/hm2, surpasses the averages reported in other geographical contexts, underscoring the regional disparities in agricultural practices and their environmental impacts. Our results also resonate with the global concerns highlighted by the Paris Agreement, emphasizing the need for innovative agricultural methods that balance productivity with environmental sustainability. When compared with studies such as those by Guo et al. (2021) and Higgins et al. (2023), our research aligns with the growing recognition of the environmental consequences of chemical fertilizer use, including soil degradation and greenhouse gas emissions. The regional differences in carbon emission reduction potential that we observed, with the western region showing the highest potential, invite a comparison with studies like that of Liu and Yang (2021), which discussed spatial patterns in agricultural carbon emissions. The disparities we noted may be attributed to differences in agricultural practices, soil types, climate conditions, and the level of technological adoption in fertilizer application. Our study’s findings on the technical efficiency of fertilizer use, with an average of 39.88%, provide a benchmark for comparison with other regions and underscore the need for targeted interventions to improve fertilizer use efficiency. This aligns with the recommendations by Jordan-Meille et al. (2023) for a more harmonized approach to fertilization across Europe. The downward trend in carbon emission reduction potential that we observed, particularly in the eastern and central regions, contrasts with the growing potential in the western region. This could be indicative of the evolving agricultural practices and the need for adaptive management strategies. It also suggests that while some regions may be reaching a plateau in terms of carbon emission reduction potential, others still have significant room for improvement. In light of these comparisons, our study emphasizes the importance of regional-specific strategies for reducing chemical fertilizer use and enhancing its efficiency. The promotion of soil testing and targeted fertilization, as well as the adoption of alternative measures such as mechanization and water-saving irrigation technologies, are highlighted as critical steps towards achieving carbon neutrality in wheat cultivation.
5 Conclusion and suggestion
5.1 Conclusion
The study on the temporal and spatial differentiation characteristics of the carbon emission reduction potential of wheat fertilizer reduction can provide an objective basis for formulating region-specific policies to reduce the use of chemical fertilizers and increase their efficiency. This is crucial for improving the utilization efficiency of wheat chemical fertilizers, reducing the disparities in fertilization efficiency among different regions, decreasing chemical fertilizer carbon emissions, and promoting the achievement of agricultural “dual carbon” targets. Using panel data from 10 major wheat-producing provinces in China from 2004 to 2020, this study constructs a stochastic frontier function model to measure the input efficiency of wheat chemical fertilizer. This measurement is then used to determine the proportion of chemical fertilizer that can be reduced, which serves as the basis for calculating the carbon reduction potential. Through the use of the Gini coefficient and decomposition methods, the study reveals the trends in the overall and regional disparities in the carbon emission reduction potential of wheat chemical fertilizer. Additionally, the Kernel density estimation and spatial Markov chain analysis methods are employed to uncover the dynamic evolution characteristics of this potential. The study concludes the following:
(1) The average carbon emission reduction potential of wheat chemical fertilizer in the 10 major producing provinces is 251.1 kg CE/hm2, with the highest potential found in the western region, reaching 336.51 kg CE/hm2, which is significantly higher than that of the eastern (230.05 kg CE/hm2) and central regions (158.28 kg CE/hm2). Moreover, only the western region shows a growing trend in carbon emission reduction potential, while the eastern and central regions exhibit a downward trend. Overall, the spatial distribution of carbon emission reduction potential decreases from the eastern region, increases in the central region, and peaks again in the western region, indicating a pattern of initial decrease followed by an increase from east to west. This suggests that wheat fertilizer use in the western region is more extensive compared to other regions, and the issue of excessive carbon emissions is becoming more severe over time.
(2) The spatial distribution of wheat chemical fertilizer carbon emission reduction potential shows a distinct imbalance, with both intra-regional and inter-regional disparities widening. The inter-regional disparity contributes the most to the overall regional disparity. The western region experiences the fastest growth in the rate of intra-regional disparities, and the disparity between the eastern and western regions is the largest and growing the fastest. The western region is key to wheat chemical fertilizer carbon emission reduction efforts. To promote the overall reduction of wheat chemical fertilizer carbon emissions and achieve coordinated regional development in wheat production, it is essential to focus on the western region and address the excessive use of chemical fertilizers, particularly in Gansu and Shaanxi provinces, where the fertilizer use efficiency is significantly below the national average. The extensive fertilization practices not only damage the fragile local ecology but also result in substantial carbon emissions. It is necessary to improve the utilization efficiency of chemical fertilizers through measures such as promoting soil testing and targeted fertilization techniques, tailored to the actual production conditions of each province in the western region.
(3) The Markov chain analysis indicates that, overall, there is a downward trend in the carbon emission reduction potential of wheat chemical fertilizer. There is a general trend towards lower and medium-low levels. However, the inter-group mobility between different levels of carbon emission reduction potential is low, which shows that the carbon emission reduction potential of the major wheat-producing provinces in China has a certain degree of stability in its spatial distribution. Although current policies and measures have played a role in promoting the reduction of chemical fertilizer use and emissions, they have not changed the current situation of uneven utilization efficiency of wheat chemical fertilizers and the regional distribution of carbon emissions. This has restricted the green and coordinated regional development of agriculture.
5.2 Suggestion
(1) The western region should be identified as a key area of focus for wheat chemical fertilizer carbon reduction. It is essential to pay attention to the issue of excessive chemical fertilizer application in the western region, especially in Gansu and Shaanxi provinces, where the fertilizer utilization rate is significantly lower than the national average. There is a substantial space for increasing the efficiency of fertilizer use and reducing carbon emissions. The extensive use of fertilizers not only damages the fragile local ecological environment but also leads to significant carbon emissions. It is necessary to improve the efficiency of chemical fertilizer use through the promotion of soil testing and formula fertilization techniques, tailored to the actual production conditions of each province in the western region.
(2) The issue of regional development disparities in the context of wheat’s low-carbon production process should be taken seriously. Policies should be adjusted according to the carbon emission reduction potential of different regions, and differentiated measures should be adopted based on the actual wheat production conditions of different regions and provinces. Instead of a “one-size-fits-all” approach, efforts should be concentrated on enhancing the fertilizer use efficiency in regions with lower levels and reducing the carbon emissions from provinces with higher potential, thereby narrowing the spatial disparities and addressing the weaknesses to promote an overall reduction in the carbon emissions from wheat fertilizer use.
(3) The direct role of soil testing and formula fertilization in promoting the carbon reduction of wheat chemical fertilizers should be leveraged. The focus of policy promotion should be on the western region to increase the targeting of soil testing and formula fertilization policies. Due to constraints such as socio-economic conditions and natural factors, the construction of grassroots agricultural technology in the western region is weak. It is necessary for relevant departments to actively allocate funds, personnel, and technical resources to strengthen the construction of grassroots agricultural technology stations in the western region, enhancing the implementation and effectiveness of soil testing and formula fertilization techniques.
(4) The use of factor substitution to promote the carbon reduction of wheat chemical fertilizers should be employed. The overuse of chemical fertilizers is mainly due to the substitution of fertilizers for labor Studies have shown that promoting mechanization and the use of socialized fertilization services can reduce this substitution opportunity. Similarly, strengthening the construction of agricultural water conservancy infrastructure, applying new water-saving irrigation technologies, and providing fertilization knowledge training to farmers to change extensive fertilization practices can all serve as substitutes for labor and chemical fertilizer inputs, thereby reducing the excessive use of chemical fertilizers and achieving carbon reduction in wheat chemical fertilizers.
Data availability statement
The original contributions presented in the study are included in the article/Supplementary Material, further inquiries can be directed to the corresponding author.
Author contributions
LQ: Conceptualization, Data curation, Formal Analysis, Funding acquisition, Methodology, Writing–original draft, Writing–review and editing. YL: Investigation, Methodology, Project administration, Resources, Software, Supervision, Validation, Visualization, Writing–original draft, Writing–review and editing.
Funding
The author(s) declare that financial support was received for the research, authorship, and/or publication of this article. This study was supported by the Key industrial chain Project of Shaanxi Province: Research on ecological evolution mechanism and coping technology of the Shaanxi Section of the Yellow River Basin under Climate Change (2022ZDLSF06-04) and the project of Shaanxi Provence Land Engineering Construction Group (DJNY 2024-37) and Shaanxi Province key research and development project (2023-YBSF-454).
Conflict of interest
Authors LQ and YL were employed by Shaanxi Provincial Land Engineering Construction Group Co., Ltd.
Publisher’s note
All claims expressed in this article are solely those of the authors and do not necessarily represent those of their affiliated organizations, or those of the publisher, the editors and the reviewers. Any product that may be evaluated in this article, or claim that may be made by its manufacturer, is not guaranteed or endorsed by the publisher.
References
Chen, X., Shuai, C., Wu, Y., and Zhang, Y. (2020). Analysis on the carbon emission peaks of China’s industrial, building, transport, and agricultural sectors. Sci. Total Environ. 709, 135768. doi:10.1016/j.scitotenv.2019.135768
Guo, C., Liu, X., and He, X. (2022). A global meta-analysis of crop yield and agricultural greenhouse gas emissions under nitrogen fertilizer application. Sci. Total Environ. 831, 154982. doi:10.1016/j.scitotenv.2022.154982
Guo, L., Li, H., Cao, X., Cao, A., and Huang, M. (2021). Effect of agricultural subsidies on the use of chemical fertilizer. J. Environ. Manag. 299, 113621. doi:10.1016/j.jenvman.2021.113621
Higgins, S., Keesstra, S. D., Kadziuliene, Ž., Jordan-Meille, L., Wall, D., Trinchera, A., et al. (2023). Stocktake study of current fertilisation recommendations across Europe and discussion towards a more harmonised approach. Eur. J. Soil Sci. 74, e13422. doi:10.1111/ejss.13422
Jordan-Meille, L., Denoroy, P., Dittert, K., Cugnon, T., Quemada, M., Wall, D., et al. (2023). Comparison of nitrogen fertilisation recommendations of West European Countries. Eur. J. Soil Sci. 74, e13436. doi:10.1111/ejss.13436
Koondhar, M. A., Tan, Z., Alam, G. M., Khan, Z. A., Wang, L., and Kong, R. (2021). Bioenergy consumption, carbon emissions, and agricultural bioeconomic growth: a systematic approach to carbon neutrality in China. J. Environ. Manag. 296, 113242. doi:10.1016/j.jenvman.2021.113242
Li, M., Liu, X., and Yang, M. (2024). Analyzing the regional inequality of renewable energy consumption and its driving factors: evidence from China. Renew. Energy 223, 120043. doi:10.1016/j.renene.2024.120043
Liao, H., and Mi, Z. (2022). Guest editorial: agricultural and rural development under the goal of carbon neutrality. China Agric. Econ. Rev. 14, 661–663. doi:10.1108/CAER-11-2022-306
Liu, J., Ouyang, X., Shen, J., Li, Y., Sun, W., Jiang, W., et al. (2020). Nitrogen and phosphorus runoff losses were influenced by chemical fertilization but not by pesticide application in a double rice-cropping system in the subtropical hilly region of China. Sci. Total Environ. 715, 136852. doi:10.1016/j.scitotenv.2020.136852
Liu, L., Wang, X., and Wang, Z. (2023). Recent progress and emerging strategies for carbon peak and carbon neutrality in China. Greenh. Gases Sci. Technol. 13, 732–759. doi:10.1002/ghg.2235
Liu, M., and Yang, L. (2021). Spatial pattern of China’s agricultural carbon emission performance. Ecol. Indic. 133, 108345. doi:10.1016/j.ecolind.2021.108345
Lv, C., Bian, B., Lee, C.-C., and He, Z. (2021). Regional gap and the trend of green finance development in China. Energy Econ. 102, 105476. doi:10.1016/j.eneco.2021.105476
Meng, F., Zhao, D., and Zhang, X. (2023). A fair consensus adjustment mechanism for large-scale group decision making in term of Gini coefficient. Eng. Appl. Artif. Intell. 126, 106962. doi:10.1016/j.engappai.2023.106962
Micha, E., Tsakiridis, A., Ragkos, A., and Buckley, C. (2023). Assessing the effect of soil testing on chemical fertilizer use intensity: an empirical analysis of phosphorus fertilizer demand by Irish dairy farmers. J. Rural Stud. 97, 186–191. doi:10.1016/j.jrurstud.2022.12.018
Oyetunji, O., Bolan, N., and Hancock, G. (2022). A comprehensive review on enhancing nutrient use efficiency and productivity of broadacre (arable) crops with the combined utilization of compost and fertilizers. J. Environ. Manag. 317, 115395. doi:10.1016/j.jenvman.2022.115395
Pei, Y., Chen, X., Niu, Z., Su, X., Wang, Y., and Wang, X. (2023). Effects of nitrogen fertilizer substitution by cow manure on yield, net GHG emissions, carbon and nitrogen footprints in sweet maize farmland in the Pearl River Delta in China. J. Clean. Prod. 399, 136676. doi:10.1016/j.jclepro.2023.136676
Pérez, A., Larrañaga, P., and Inza, I. (2009). Bayesian classifiers based on kernel density estimation: flexible classifiers. Int. J. Approx. Reason. 50, 341–362. doi:10.1016/j.ijar.2008.08.008
Saeed, Q., Zhang, A., Mustafa, A., Sun, B., Zhang, S., and Yang, X. (2022). Effect of long-term fertilization on greenhouse gas emissions and carbon footprints in northwest China: a field scale investigation using wheat-maize-fallow rotation cycles. J. Clean. Prod. 332, 130075. doi:10.1016/j.jclepro.2021.130075
Sinha, M., and Chaudhury, A. R. (2021). Assessing the between-group inequality through alternative measures of grouping: an Indian evidence. Soc. Indic. Res. 157, 1021–1045. doi:10.1007/s11205-021-02683-x
Song, J., and Chen, X. (2019). Eco-efficiency of grain production in China based on water footprints: a stochastic frontier approach. J. Clean. Prod. 236, 117685. doi:10.1016/j.jclepro.2019.117685
Sueyoshi, T., Qu, J., Li, A., and Liu, X. (2021). A new approach for evaluating technology inequality and diffusion barriers: the concept of efficiency Gini coefficient and its application in Chinese provinces. Energy 235, 121256. doi:10.1016/j.energy.2021.121256
Wang, D., Hou, Y., Li, X., and Xu, Y. (2022). Developing a functional index to dynamically examine the spatio-temporal disparities of China’s inclusive green growth. Ecol. Indic. 139, 108861. doi:10.1016/j.ecolind.2022.108861
Wei, Y.-M., Chen, K., Kang, J.-N., Chen, W., Wang, X.-Y., and Zhang, X. (2022). Policy and management of carbon peaking and carbon neutrality: a literature review. Engineering 14, 52–63. doi:10.1016/j.eng.2021.12.018
Wu, H., Huang, H., Chen, W., and Meng, Y. (2022). Estimation and spatiotemporal analysis of the carbon-emission efficiency of crop production in China. J. Clean. Prod. 371, 133516. doi:10.1016/j.jclepro.2022.133516
Wu, H., MacDonald, G. K., Galloway, J. N., Zhang, L., Gao, L., Yang, L., et al. (2021). The influence of crop and chemical fertilizer combinations on greenhouse gas emissions: a partial life-cycle assessment of fertilizer production and use in China. Resour. Conservation Recycl. 168, 105303. doi:10.1016/j.resconrec.2020.105303
Zhai, L., Wang, Z., Zhai, Y., Zhang, L., Zheng, M., Yao, H., et al. (2022). Partial substitution of chemical fertilizer by organic fertilizer benefits grain yield, water use efficiency, and economic return of summer maize. Soil Tillage Res. 217, 105287. doi:10.1016/j.still.2021.105287
Zhang, L., Ma, X., Ock, Y. S., and Qing, L. (2022). Research on regional differences and influencing factors of Chinese industrial green technology innovation efficiency based on Dagum Gini coefficient decomposition. Land 11, 122. doi:10.3390/land11010122
Keywords: chemical fertilizer, wheat, carbon emission, sfa, soil testing and fertilizer recommendation
Citation: Qi L and Li Y (2024) Balancing productivity and carbon emissions: the potential for carbon reduction in wheat fertilization practices in China. Front. Environ. Sci. 12:1427250. doi: 10.3389/fenvs.2024.1427250
Received: 03 May 2024; Accepted: 08 July 2024;
Published: 19 July 2024.
Edited by:
Sérgio António Neves Lousada, University of Madeira, PortugalReviewed by:
Martina Zelenakova, Technical University of Košice, SlovakiaCanel Eke, Akdeniz University, Türkiye
Copyright © 2024 Qi and Li. This is an open-access article distributed under the terms of the Creative Commons Attribution License (CC BY). The use, distribution or reproduction in other forums is permitted, provided the original author(s) and the copyright owner(s) are credited and that the original publication in this journal is cited, in accordance with accepted academic practice. No use, distribution or reproduction is permitted which does not comply with these terms.
*Correspondence: Li Qi, NDIwNzc4Mjk1QHFxLmNvbQ==