 Flipos Engdaw
 Tadesse Fetahi3
- 1African Center of Excellence for Water Management, Addis Ababa University, Addis Ababa, Ethiopia
- 2Department of Biology, University of Gondar, Gondar, Ethiopia
- 3Department of Zoological Sciences, Addis Ababa University, Addis Ababa, Ethiopia
Rapid population growth-induced urbanization, industrialization, deforestation, settlement expansion and habitat destruction are significant drivers of LU/LC change at global scale. The uncontrolled LU/LC change, specifically in developing countries like Ethiopia, poses significant environmental threats to water quality, biodiversity, and ecosystem services. This study, therefore, examined LU/LC trends in the Lake Tana catchment, Ethiopia from 1993 to 2022, analyzed the impact of changes on water quality and identified major driving factors for policy input. ArcGIS software and Landsat imagery were employed toproduce maps for 10 years. Water quality data were obtained from primary and secondary sources from 2002 to 2022. The relationship between LU/LC changes and water quality was examined using Pearson’s correlation and principal component analysis (PCA). Results revealed significant (p < 0.05) spatio-temporal variations in water quality parameters, with almost all parameters showing a substantial increase from 2002 to 2012 and some declined in 2022. LU/LC changes were categorized into six classes with an overall accuracy and Kappa coefficient of 92.2% and 0.86%, respectively. Various LU/LC classes were highly correlated with a particular water quality parameter. Settlement and crop land expansion were positively correlated with nutrients such as (NH3− + NH4+-N), NO3-N, SRP, and TP. Forestation was positively correlated with good water quality such as DO and pH, while they were negatively correlated with temperature, EC, SRP, and NO3-N demonstrating a strong linkage between LU/LC and water quality. These findings therefore, validate the significance of prioritizing LU/LC changes for sustainable water quality and ecosystem service improvement in the Lake Tana catchment.
Introduction
A study on land use/land cover (LU/LC) is crucial for understanding global environmental patterns and ecological trends in natural landscapes (Wolde-Yohannes et al., 2018; Matlhodi et al., 2019; Gashaye et al., 2023). It serves as a foundation for sustainable natural resource management through the development of evidence-based environmental monitoring policies (Lu et al., 2004; Mengistie et al., 2013; Cotter et al., 2014; Gashaw and Fentahun, 2014). Rapid population growth-induced urbanization, industrialization, deforestation, soil erosion, desertification, shortage of arable land, and habitat destruction are significant drivers of LU/LC change at global scale (Muriuki et al., 2011; Biazin and Sterk, 2013; Mengistie et al., 2015; Beyene and Minale, 2023). The intricate and dynamic alterations in LU/LC at various spatial and temporal scales have implications on environmental and ecosystem services (Gashaw et al., 2018; Bufebo and Elias, 2021; Gashaye et al., 2023). For example, LU/LC alteration significantly affects the landscape, ecological imbalance and ecosystem services (Hassen and Assen, 2017).
During the last 30 years, significant global LU/LC change has been observed with the vast expansion of pastureland and cropland at the expense of forest and grassland (Lambin et al., 2003; Hassen and Assen, 2017). However, the direction and magnitude of the change is not uniform across the world. For instance, global rate of deforestation from 1990–2005 was estimated at about 13 million ha/yr (FAO, 2005; Garedew et al., 2009). In the temperate regions forested areas increased by 3 × 10⁶ ha/yr, while in the tropics, forest cover and grassland declined by 12 × 106 ha/yr (Gashaw et al., 2018). Between 2015 and 2020, an estimated 6 million hectares of natural forest area was degraded globally, with the majority occurring in tropical regions (Matlhodi et al., 2019; FAO, 2020; Gashaye et al., 2023). Deforestation remains a primary pressure on LU/LC that substantially affecting global environmental change. Similarly, population growth-induced higher urbanization rate has been reported in many developing countries than developed nations (Beyene and Minale, 2023). Only 28.8% of world’s population lived in urban centers in 1950 compared to 56% in 2020, and projected to 70% in 2050 (Avis, 2016; Fitawok et al., 2020). Hence, unplanned and uncontrolled LU/LC changes particularly in sub-Saharan Africa remains a primary pressure that affect water quality and ecosystem service (Beyene and Minale, 2023).
Ethiopia has one of Africa’s fastest growing populations, with the total number of inhabitants expected to reach 133.5 million by 2030 (UN, 2018). LU/LC change is manifested in the expansion of deforestation, settlement and croplands (Garedew et al., 2009; Ariti et al., 2015; Hassen and Assen, 2017; Gashaw et al., 2018; Bogale, 2020; Bufebo and Elias, 2021; Getachew et al., 2021; Gashaye et al., 2023). The country had the second-highest rate of deforestation in Africa, with rates of 0.94% for 1990–2000 and 0.97% for 2000–2005 (Garedew et al., 2009). Cultivated land has expanded in the Andassa watershed of the Blue Nile basin between 1985–2015 resulting in decline of forest, shrub-land and grassland (Gashaw et al., 2018). However, opposing trends of LU/LC changes have also been reported (Wolde-Yohannes et al., 2018). For example, natural forest regrowth has been reported in the uplands of Bela-Welleh catchment (Nyssen et al., 2009). A similar extent of LU/LC change has been reported from the Lake Tana area, which is the focus of the current study. Recently, an increase in settlement by 22% and a substantial decline in cropland coverage by 11% were also reported from the north-eastern catchment of Lake Tana (Gashaye et al., 2023). Further expansion of grassland and riparian vegetation cover in Gish Abbay watershed was also recorded (Bewuketu and Solomon, 2013). LU/LC change cause regional water quality deterioration, habitat destruction, biodiversity loss and a decline in ecosystem integrity (Bewuketu and Solomon, 2013; Kindu et al., 2013; Ariti et al., 2015; Minta et al., 2018; Matlhodi et al., 2019; Gashaye et al., 2023).
Though Ethiopia is endowed with large inland freshwater bodies that provide ecological and ecosystem services essential to the livelihoods and economic revenue to the region (Goshu and Aynalem, 2017; Gebremedhin et al., 2018; Wondie, 2018; Assefa et al., 2021; Wubneh et al., 2022), the lakes and the ecosystems within their catchment are under stress from severe LU/LC change (Alemu et al., 2017; Hassen and Assen, 2017; Moisa et al., 2022). The interdependence between LU/LC, water quality and the health of aquatic ecosystems is reported in many parts of Ethiopia (Hassen and Assen, 2017; Gashaw et al., 2018; Serur and Adi, 2022; Gashaye et al., 2023; Gule et al., 2023; Muche et al., 2023). Correspondingly, the water quality of several lakes is deteriorating ranging from eutrophic to hyper-eutrophic condition due to degraded catchment areas (Fetahi, 2019). Lake Tana, Ethiopia is not exceptional. Recent study indicated substantial LU/LC change in the northern Lake Tana catchment, such as conversion of natural land cover to settlement and agricultural land (Gashaw et al., 2018; Abuhay et al., 2023). Agricultural expansion, charcoal production, firewood harvesting and real-state construction have rapidly increased significantly affecting the forest and grazing lands (Gebremichael et al., 2013; Woldesenbet et al., 2017; Muche et al., 2023). These human-induced change in LU/LC leads to water quality deterioration and biodiversity impoverishment (Muriuki et al., 2011; Gashaw et al., 2018; Abuhay et al., 2023).
Lake Tana is the largest lake in Ethiopia, and the source of Blue Nile River, which sustains Ethiopia, Sudan and Egypt (Fenta et al., 2018; Minale, 2019; Yasuda et al., 2022). Thus, the quantity and quality of its water is critical for millions of people and peaceful neighborhood. However, these aquatic ecosystems are heavily affected by LU/LC change (Hassen and Assen, 2017; Abuhay et al., 2023).
To reverse deforestation, land degradation, water quality deterioration and biodiversity impoverishment triggered by the severe LU/LC modifications, the Ethiopian government has recently launched a green legacy initiative through reforestation and sustainable forest management programs (Lambert and Deyganto, 2023; Muche et al., 2023). With an emphasis on sustainable development and combating drought-induced desertification, the initiative aimed to restore degraded lands, conserve and improve water resource management (ECRGE, 2015). The northern watershed of Lake Tana, where crop-lands and Afromontane forest have been converted as a result of settlement, is known for having mosaic of various LU/LC types. Despite the concerted efforts being made to avert the situation, there is paucity of information revealing the trend of LU/LC dynamics and its impact on water quality of northern Lake Tana watershed. Therefore, this study examined the trends in LU/LC changes in the Lake Tana catchment between 1993 and 2022. The study also documented the historical water quality parameters and compare with the contemporary data. We analyzed the impact of LU/LC change on water quality and pinpoint the major driving factors on the catchment. We hypothesized that better LU/LC improves the water quality and ecosystem services. The study will also aims to identify the major driving factors affecting water quality within the catchment for policy and decision makers.
Materials and methods
Study area
Lake Tana, the main source of Blue Nile River and Grand Ethiopian Renascence Dam (GERD), is the largest lake in Ethiopia, which accounts for 50% of the freshwater lake area of the country without considering the recently built reservoirs (Goshu and Aynalem, 2017; Wolde-Yohannes et al., 2018; Wondie, 2018). The lake is located on the basaltic plateau of north-western highlands of Ethiopia, between 12°10′N and 37°23′E and at an altitude of 1800 m a.s.l. (Figure 1). Lake Tana is among Africa’s top 32, with global rank of 250 for conservation priority (Teshome et al., 2021). The total surface area of the lake during dry and wet seasons ranged from 3,050 to 3,200 km2 with maximum and mean depths of 14 and 8 m respectively (Wondim, 2016; Goshu and Aynalem, 2017). Lake Tana is a vital component of the environment and biodiversity heritage, where the livelihood of local people is highly dependent on its numerous ecosystem services (Derseh et al., 2019). Furthermore, the lake plays a crucial role in local climate regulation and was designated as a UNESCO-biosphere reserve in 2015 for its extended ecological and socioeconomic services (Teshome et al., 2021; Sewunet et al., 2022).
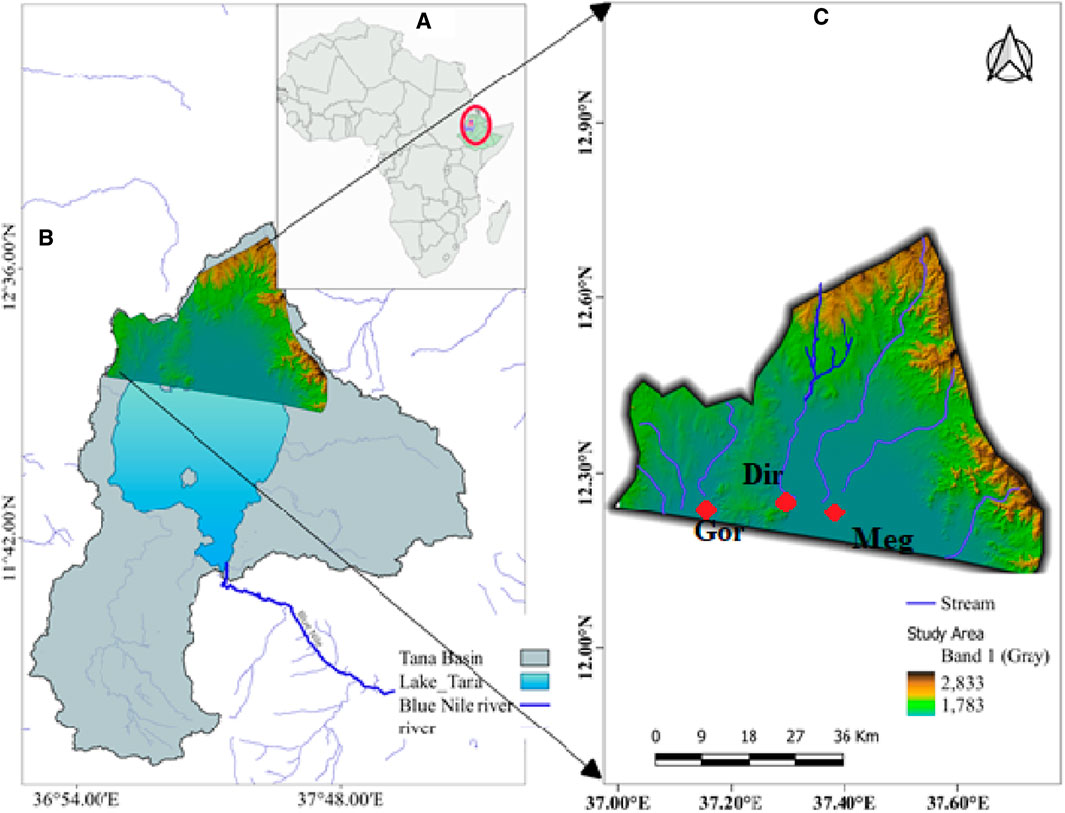
Figure 1. Location map showing (A), Lake Tana catchment; (B) the northern Lake Tana study area, (C) sampling sites with increasing elevation (green to red) and streams and major tributaries (Gor = Gorgora; Dir = Dirma, Meg = Megech).
Lake Tana’s northern watershed is typical of Ethiopian highlands with mountainous topography and extensive agriculture. It is part of the north and central Gondar zone of the Amhara regional state (Figure 1). The watershed extends up to Simen mountain national park, with an altitude of 3,500 to 4,000 m a.s.l. (Alemu et al., 2017). The study area consists of varying topographic features including high plateau, hills, plains and valleys. According to the Ethiopian National Meteorological Service Agency (NMA, 2024), the study area had monthly rain-falls ranged between 89 and 343 mm, with mean monthly maximum temperature of 23.4°C–32.5°C and mean monthly minimum temperature of 12.2°C–14.5°C. The region’s climate is “tropical highland monsoon” with a major rainy season between June and September and minor rainy season from March to April. Maximum monthly rainfall is recorded during July/August where it reaches 250–330 mm, while mean annual rainfall of the region is above 1,280 mm (Uhlenbrook et al., 2010; Abebe et al., 2017). Mean annual humidity and evapotranspiration ranged from 44 to 80 g/m3 and 773 mm, respectively. The catchment includes the head waters of Angereb, Megech and Dirma Rivers that drain through Dembia plain before they flow into Lake Tana. These rivers are also listed among the lake’s major tributaries and primary water sources for Gondar city and surrounding areas (Abebe and Kebede, 2017).
Currently, Lake Tana watershed is facing multiple stressors to continue as a resilient ecosystem. The recent government-led green legacy initiative that endorses forestation, conservation and restoration of water resource has emerged as the main land cover driver. Furthermore, rapid population growth-induced agricultural expansion towards lake shore, river banks, wetlands and preserved forests has caused alarming land cover change (Wubie et al., 2016). Consequently, accelerated soil erosion attributed to steep slopes and poor soil conservation practices, has resulted in loss of vegetation cover and hence occurrence of deforestation (Nyssen et al., 2009). Moreover, population triggered built-up and settlement, urbanization, climate alteration and small scale extensive agriculture make the region vulnerable to severe environmental degradation (Sewunet et al., 2022). Siltation resulted from poor soil conservation and farming practices, habitat and shoreline modification due to hotel and resort construction, river continuum disruption due to dam construction (Engdaw et al., 2022), proliferation of exotic macrophytes such as water hyacinth (Derseh et al., 2019), excessive agrochemical application to improve yield (Akale et al., 2018), improper waste discharge and water abstraction have become significant problems hampering sustainable lake watershed management and led to water quality deterioration (Goshu and Aynalem, 2017; Gebremedhin et al., 2018; Sewunet et al., 2022).
Water quality data collection and analysis
Despite the lack of regularly collected consistent historical data on the watershed and surface water of Lake Tana, an attempt was made to acquire data of more than 2 decades from primary and secondary sources. Abbay basin water quality laboratory (ABWQL), an organization concerned with the monitoring of Lake Tana and its major tributaries provided a monthly water quality data on Dirma and Megech Rivers, which are among the major tributaries of the northern gulf of the lake and Lake Tana basin. The data was collected at monitoring (gauging) stations located near the river mouth (before the confluence point) and data for the Gorgora site was collected at the gulf station which is closer to the old port. For the missing dataset (for the months of December to March of 2003 and 2004), additional secondary data were obtained from published articles (Goshu et al., 2017; Womber et al., 2022), unpublished thesis, government reports of Ethiopian (central statistical agency, 2017) (CSA) and environmental protection agency (EPA). Appraisals of secondary data sources were associated with seasonal representations focusing on the northern gulf of the lake and consideration of our parameters of interest (physico-chemical). Temperature (Temp), pH, dissolved oxygen (DO), turbidity, total dissolved solids (TDS), total suspended solids (TSS), alkalinity, electrical conductivity (EC), total hardness, sulphate (SO4−), ammonia (NH3 +NH4-N), nitrate (NO3-N), nitrite (NO2-N), soluble reactive phosphate-phosphorus (SRP) and total phosphorus (TP) were our parameters of interest, which were assumed to adequately describe the lake’s physico-chemical water quality.
Data for the year 2023 was obtained through field measurements and laboratory analysis. In situ measurements of some parameters including Temp (°C), DO (mg L−1) and EC (K25, µS cm−1) were made using a multi-meter probe (HQ40d, model10115 HACH). pH was recorded using a portable probe (HANNA, HI991301), while turbidity (NTU) was measured using a turbidity meter (Wag-WT3020). TDS (mg L−1) was measured using a water proof TDS meter (HANNA, HI98130). For nutrient analysis, a composite sample was produced from replicated water samples collected across the width of Megech and Dirma river mouths, 30 cm away from the left and right bank of the river (Engdaw et al., 2022). Furthermore, water samples in the lake basin were collected from three sampling points at each of the three different sampling sites. All the collected water samples of a site were mixed in a single container to produce one composite sample. The composite water samples were filtered using 0.47 μm pore size glass fiber filter paper (GF/F), and used for the analyses of SRP, NO3-N, NO2-N, NH3 + NH4+ -N and SO4−. Unfiltered water samples were used for the analysis of total alkalinity, total hardness and TP. All samples were processed and analyzed according to the methods outlined in APHA, 1999.
Soluble reactive phosphate-phosphorus (SRP) was analyzed using the ascorbic acid method, while TP was determined by the ascorbic Acid method after persulfate digestion. Nitrate-nitrogen was determined using the sodium-salicylate method, while NO2-N was quantified colorimetrically as reddish purple azo dye by coupling diazotized sulfanilamide with N-Naphthyl-(1)-ethylendiamine-dihydrochloride. Ammonia nitrogen was measured by the phenate method, while sulfate was estimated using turbidimetric method. Iron was determined using ICPOES. Total alkalinity was estimated by titrating 100 mL of unfiltered water sample using 0.1 N HCl as a titrant and a bromocresol green-methyl red mixed indicator, and calculated according to Wetzel and Likens (2001). Total hardness was determined by titrating 25 mL of sample using EDTA and buffer solution (APHA, 1999).
Data acquisition and pre-processing
LU/LC dynamics analysis involved the collection of primary and secondary data. In order to have a better understanding of the primary land use inside cities and towns, an exploratory field survey was conducted in search of ground truth data on the northern watershed of Lake Tana and riparian towns such as Gondar, Gorgora, Koladiba and Chuahit. All land cover classes were identified and documented across each town and watershed. Each sampling site’s GPS coordinates were also noted and recorded. The land cover data for this study were classified using satellite information on the years 1993–2022, which was acquired and processed using Google earth Engine, a platform for online pre-processing of satellite imagery, enhancement and classification based on machine learning algorithms (Gorelick et al., 2017; Gule et al., 2023). To minimize visual clutter and reduce the effect of cloud cover, we obtained images taken during the dry season of the watershed, which ran from November to January. Images used to map and identify the various land cover classes were obtained for the years 1993, 2002, 2013 and 2022. Landsat data used for mapping land cover, which were selected based on their constant temporal coverage and geographical resolution, are indicated in Table 1.
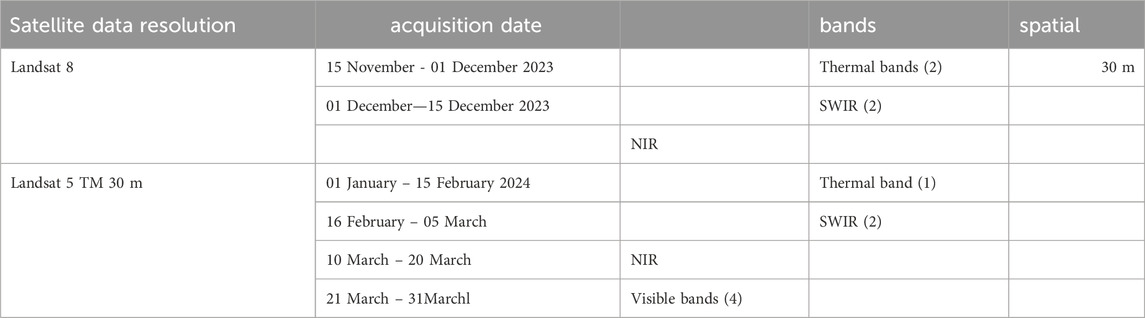
Table 1. Description of spatial dataset used for mapping land cover.
Image processing and land cover change
Satellite image processing was used to extract attributes of the target images at several phases, such as image correction, enhancement, cloud removal, subset/masking and band composition/stacking using ENVI software version 5.3. To evade significant distortion of image statistics and overall accuracy, image pre-processing involved setting background pixel values using ENVIROI tool and masking cloud cover using (QA) band were performed. Seamless techniques were also implemented to mosaic images and color correction was applied based on histogram matching technique. Processed composite satellite images for the years 1993, 2002, 2013, and 2022 were classified independently using ArcGIS 10.5′s Random Trees classification algorithm. Thus, LU/LC time series maps were produced. Classes were demarcated based on FAO’s land cover classification system (LCCS) (FAO, 2016), as illustrated in Table 2.

Table 2. Descriptions of LU/LC classes identified in the Northern watershed of Lake Tana.
Geometric compatibility of images from different time classes is crucial for determining temporal changes and hence, ENVI SPEAR, Ortho-rectification Wizard was used to rectify the images. A topographical map at 1:50,000 scale was used to geometrically correct the images using the WGS-84 spatial coordinate system. Following the identification of Ground control point (GCPs) using satellite image and topography maps, the linear geometric correction function was applied.
Image classification and accuracy assessment
Accurate data on LU/LC change can be obtained from multiband raster satellite images, which are valuable for monitoring LU/LC change and its impact on environmental alterations (Li et al., 2014; Obubu et al., 2022). Thus, several core principles including radiometric, spectral, spatial differentiation and digital band combinations were applied for image analysis and interpretation. In the present study, pixel based supervised classification technique that provides better extraction of LU/LC features based on Random Forest classifier was adopted (Obubu et al., 2022).
The accuracy of LU/LC classification was assessed using error matrices and Kappa analysis (Congalton, 1991; Gule et al., 2023; Muche et al., 2023). The Landsat 8 image of 2022 was used to build the error matrix for the land cover classification, using 30% of the ground truth data points collected from the field as a reference data in 2022. Various land cover types were verified using Google Earth data points from previous years. The accuracy of each land cover class was appraised by comparing the results of the land cover classification to the ground observation using confusion matrix. The confusion matrix was then used to compute producer and user accuracy and the Kappa statistics for each class (Congalton, 1991).
To ensure the accuracy of the classification, 40 sampling points were created for each LU/LC class employing a stratified random sampling technique; hence, 240 sampling points were generated. Therefore, essential components of accuracy assessment including user accuracy (errors of commission), producer accuracy (errors of omission), total accuracy and Kappa index were obtained (Congalton, 1991; Obubu et al., 2022). Total accuracy was computed by dividing the number of correctly identified pixels in the image by the total number of pixels used throughout the classification process.
Where Xii = diagonal elements in the error matrix; X = total number of samples in the error matrix.
User accuracy was determined by dividing the number of samples of each class in the map by the number of correctly classified points in each class image (Matlhodi et al., 2019).
Where, CaU is total number of correct classifications of a particular map; Ca + U is total number of pixels classified in a particular map class.
Kappa coefficient of the raster layer of the study area were determined using the statistical equation
Where, r = number of rows in the error matrix; Xii = number of observations in row i and column i; Xi+ and X + i = marginal totals of row i and column i respectively; and n = total number of observations (sample/pixels).
When compared to a random classification, the Kappa statistic indicates how much superior one classification is over another (Gule et al., 2023). After the evaluation of the accuracy of LU/LC maps, magnitudes and pattern of the LU/LC changes were assessed by computing percent and rate of change between 1992 and 2002; 2002 and 2012; and 2012 and 2022 (Gashaw et al., 2018; Abuhay et al., 2023).
Where, A = recent area of the LU/LC class (Km2); B = earlier area of coverage of the LU/LC class (km2); C = the time interval between A and B years.
Data analysis
Using IBM SPSS Version 25 and R-studio, the data recorded from both field and laboratory analyses were summarized using descriptive statistics such as mean and standard deviation. After the data was checked for normality using Shapiro-Wilk test, both parametric and non-parametric (Kruskal-Wallis ANOVA) tests were made to compare the temporal variations in water quality parameters and LU/LC changes. To determine the association between LU/LC change and water quality parameters, Pearson correlation coefficient was used. Principal component analysis (PCA) using Spearman’s correlation coefficient was performed to identify the most important variable in determining the temporal variations between water quality variable and various LU/LC types.
Results
Water quality
The overall spatial and temporal physico-chemical water quality parameters for the northern gulf of Lake Tana and its main northern tributaries obtained from various sources are summarized in Table 3. Results indicate that there were significant (p < 0.05) spatio-temporal variations in several water quality parameters from 2002 to 2022.
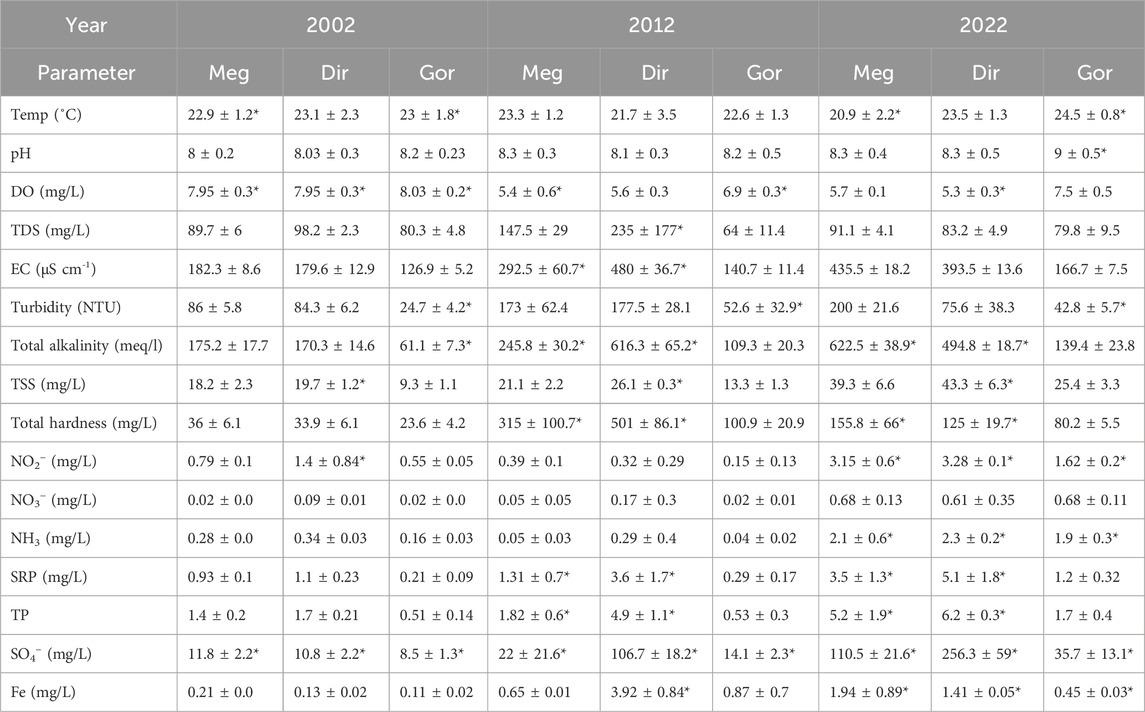
Table 3. Mean ± SD (n = 36; i.e. 12 per year) of water quality parameters of northern Lake Tana and tributaries (* = Significantly different (p < 0.05) temporally).
Mean surface water temperature ranged from 20.9°C in 2002 to 24.5°C in 2022, with the lowest value recorded at Megech River mouth in 2002 and the highest at Gorgora gulf in 2022. Throughout the study period, pH level measured in the northern gulf of Lake Tana was slightly alkaline ranging from 8.0 at Megech in 2002 to 9.0 at Gorgora in 2022. The Kruskal-Wallis non-parametric ANOVA showed that concentrations of DO have significantly declined (p < 0.05) over the course of the study from 8.03 at Gorgora in 2002 to 5.3 mg/L at Dirma in 2022.
EC, turbidity, TDS, total alkalinity and total hardness fluctuated considerably and rose significantly (p < 0.05) at all sites from their levels in 2002 to those in 2012 (Table3; Figure 2). The same parameters declined in 2022 at one or more sites although TDS and Total alkalinity increased to levels higher than those recorded in 2012 at Gorgora gulf. Apparently, significant spatial variations were observed between sites. For example, the highest EC was measured at Dirma River mouth (480 μS cm−1) followed by those at Megech (435.5 μS cm−1) and Gorgora gulf (189.7 μS cm−1). Turbidity, which is a measure of water clarity showed a wide range of values varying from 24.7 to 200 NTU and differed significantly (p < 0.05) between sites. The highest turbidity was measured during the rainy seasons in Megech (200 ± 21.6 NTU) and Dirma (177.5 ± 28.1 NTU) river mouths while lowest values (24.7 ± 4.2 NTU) were recorded during dry months at Gorgora gulf.
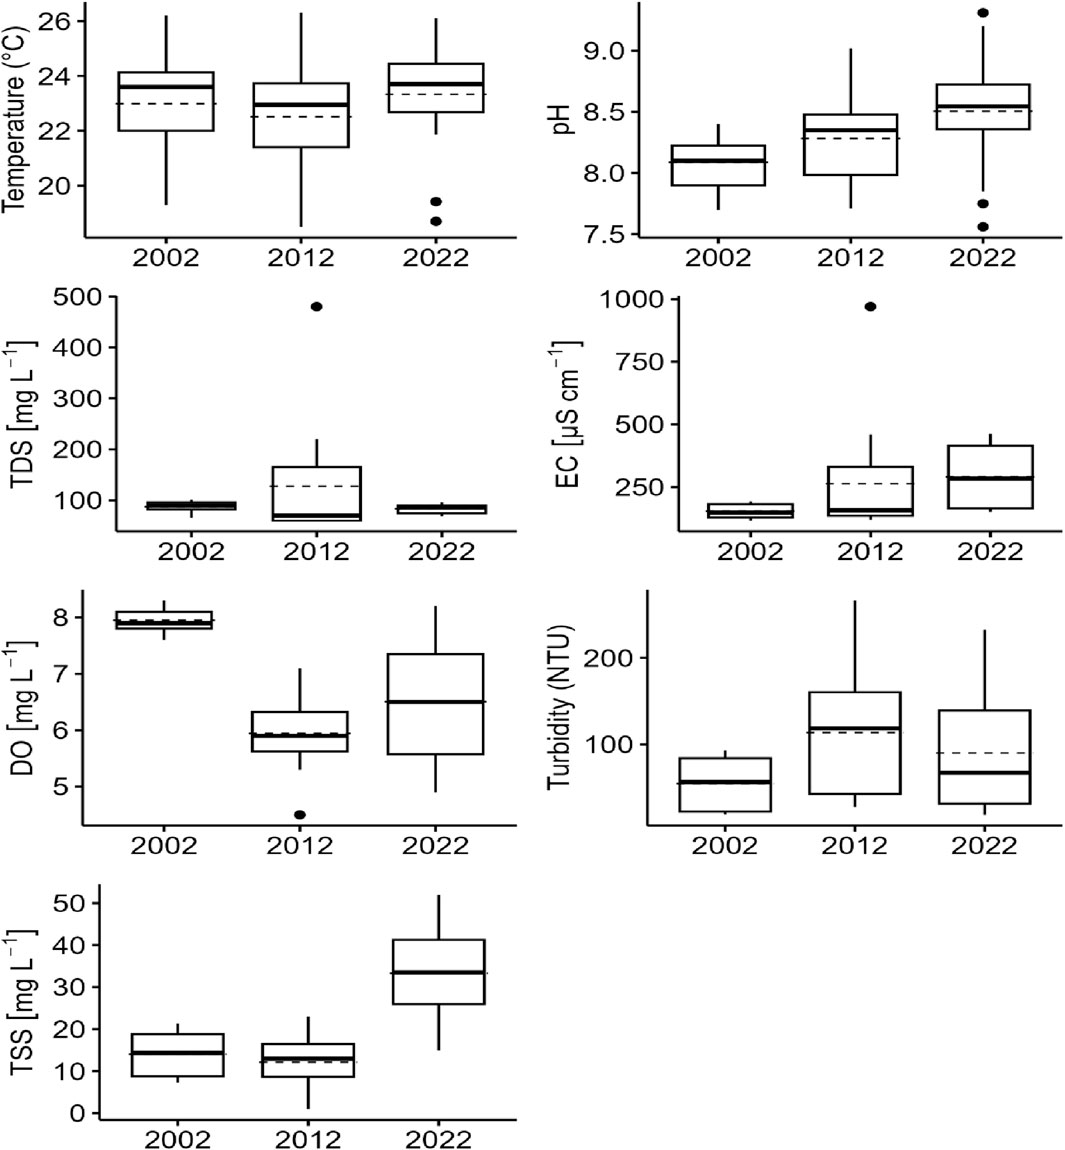
Figure 2. Temporal variations in water quality parameters of the Northern gulf of Lake Tana and its tributaries Megech and Dirma Rivers (n = 36, dots represent outlier data).
Concentrations of nutrients measured in the water samples of the study sites are indicated in Table 3 and Figure 3. Concentrations of TP, SRP, ammonia and NO2-N were significantly different both spatially and temporally, whereby higher concentrations were recorded during the rainy seasons. Compared with tributary rivers, relatively lower concentrations of nutrients were measured at Gorgora gulf and littoral region of Lake Tana.
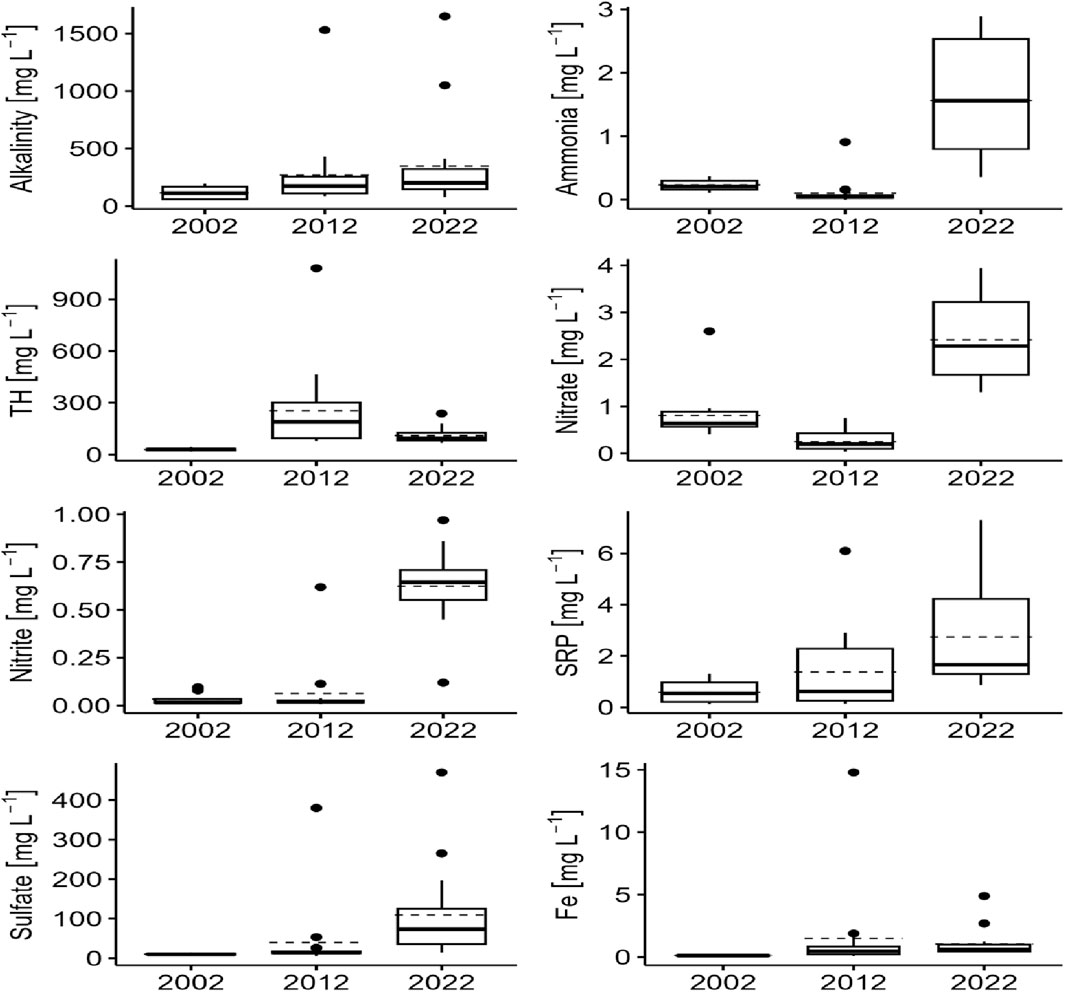
Figure 3. Temporal variations in levels of nutrients, total alkalinity and total hardness measured in the Northern gulf of Lake Tana and its tributaries (n = 36, dots represent outlier data).
Land use/land cover maps, and changes
Land cover maps obtained from the image classification indicated a remarkable change over the past 3 decades (Figure 4). Six different land cover classes (bare land, crop land, forest, grass land, settlement and water body) were identified. For the years 1993, 2002, 2013, and 2022, the classification results verified remarkable overall accuracy of 95.7%, 92.2%, 93.1%, and 93% respectively. Accuracy values for the individual land cover classes shown in Table 4 revealed that, the maps are sufficiently accurate for further analysis. The accuracy of land cover classification was determined using error matrices, overall accuracy and Kappa statistics. The overall Kappa statistics ranged from 0.86% to 0.91%, while producer accuracy ranged from 87.5% to 100%. Significant variation (p < 0.05) was observed between accuracy of users and producers. Supervised classification had the highest accuracy. In 2022, the overall accuracy was 92.2% with Kappa statistic of 0.861%. Accuracy among users and producers was consistently high ranging from 80% to 100%.

Figure 4. Land use land cover changes of Northern Lake Tana catchment from 1993 to 2022.
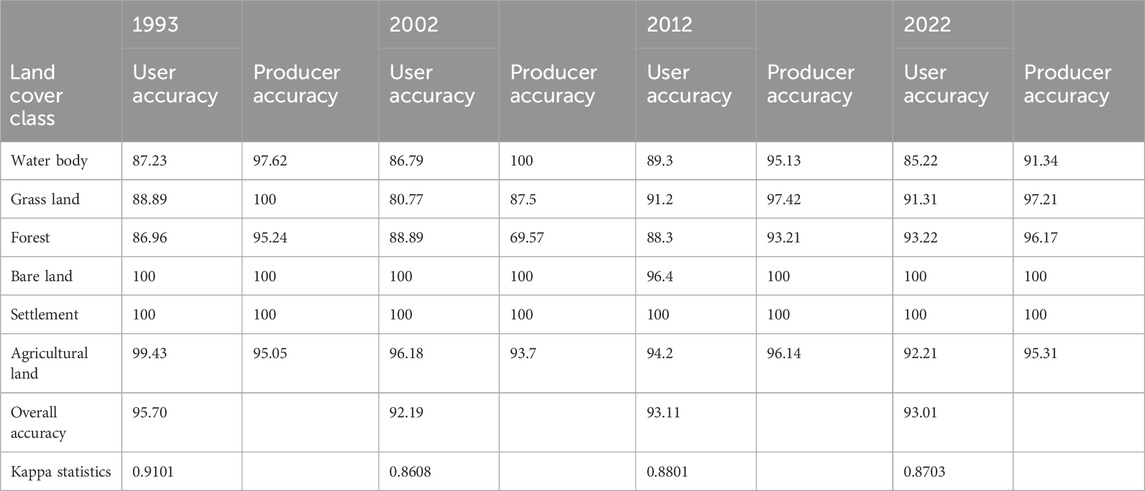
Table 4. Accuracy assessment results.
At the beginning of the study period, the landscape was dominated principally by cropland that accounted for 71.4% of the total area (315672 ha), followed by water body 16.3% (72187.8 ha), forest 8.2% (36148.6 ha) and grassland 3.04% (13453.3 ha), whereas settlement (0.8%) and bare-land (0.3%) accounted for very low land cover areas. The LU/LC analysis revealed that between 1993 and 2002, cropland declined considerably by 46.6% and the area of water body remained more or less constant. However, other land cover classes such as forest, grassland and settlement showed progressive expansion by 0.9%, 0.16%, and 0.224% respectively (Table 5).
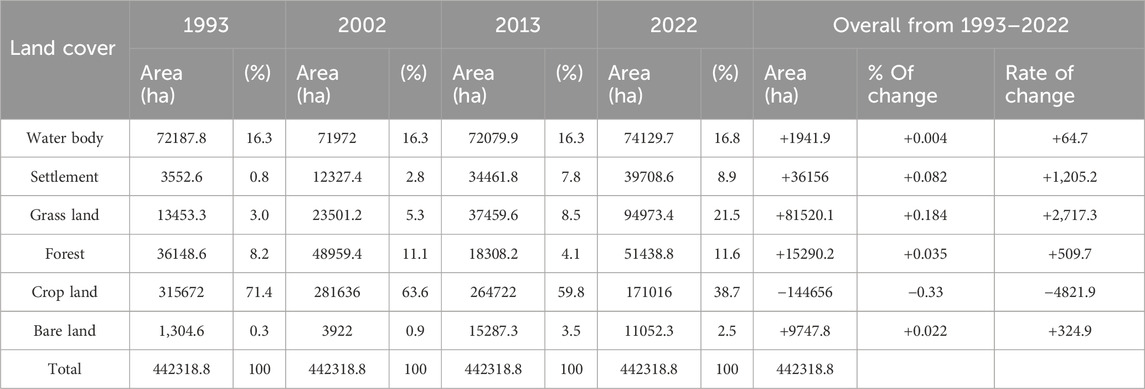
Table 5. Area per land covers class of Northern Lake Tana catchment in 1993, 2002, 2013 and 2022.
The trends and rates of change in land use types varied markedly through the study period intervals. For instance, in the year between 2002 and 2013, grassland, settlement and bare land expanded significantly (p < 0.05) with 0.6%, 1.8%, and 2.9% respectively. Conversely, other land cover types such as crop land and forest cover declined by 38% and 0.45%, respectively (Table 5). Furthermore, forest cover declined from 11.1% in 2002 to 4.1% in 2013 at a rate of −0.63% due to anthropogenic pressure, while settlement expansion accelerated dramatically since 2002 and reached 7.8% (34461.8 ha) of the total area in 2013.
In the study period between 2013 and 2022, a substantial decline in crop land cover (by 23.1%) was observed, while a large increase in grass land from 8.5% (37459.6 ha) to 21.5% (94973.4 ha), in settlement from 7.8% (34461.8 ha) to 8.9% (39708.6) and in forest from 4.1% (18308.2 ha) to 11.6% (51438 ha) was recorded. Despite the fact that there was conversion of land cover from one use to another, the image classification clearly indicated conversion of crop land cover into grass-land, forest and settlement (Figure 4).
The analysis of various LULC changes indicated a sharp decline in crop-land cover from 71.4% to 38.7%, while grass land and forest showed a steady but significant rise in total area coverage from 3% to 21.5%, and 8.2%–11.6%, respectively. However, settlement increased remarkably from 0.8% to 8.9%.
Impacts of LU/LC change on water quality of Northern Lake Tana gulf
All the crucial water quality parameters obtained from historical data, field and laboratory measurements were correlated with the identified land cover classes using Pearson correlation (Table 6). A correlation coefficient greater than ±0.68 represented strong positive or negative correlation between variables (Schober et al., 2018). Highly significant association was observed between various water quality parameters and land cover changes. For instance, settlement expansion has substantial positive association with turbidity, alkalinity and nutrients such as NO3-N, NO2-N, SRP, TP and NH3-N + NH4+-N. This implies that, as the amount of settlement and built-up area increased, nutrient enrichment, turbidity and other water quality parameters led to gradual water quality deterioration. Conversely, substantial decline in cropland cover showed a strong negative correlation with various water quality parameters including pH (−0.928), EC (−0.956), turbidity (−0.755), TSS (−0.975), NH3-N (−0.98), SRP (−0.97) and TP (−0.961).
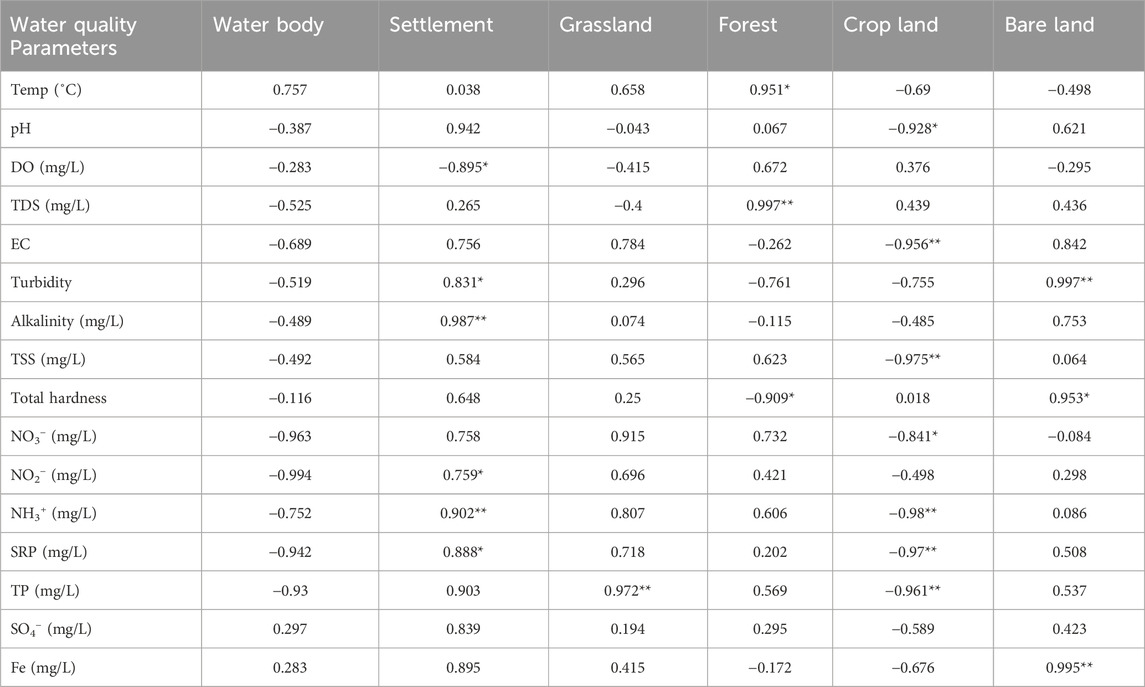
Table 6. Correlation matrix of LULC change and water quality parameters.
Principal component analysis (PCA) was conducted to identify the variables of overriding importance to the observed variations. The output of PCA depicted that, the first two components (PC1 and PC2) together explained about 81.2% of the total variations with PC1 contributing 53.4% and PC2 contributing 27.8% to the total variation. The loading plot (Figure 5) indicated that water quality parameters such as turbidity, hardness and Fe were impacted by bare land; while most parameters including EC, alkalinity, SO4−, TP, SRP and pH were highly impacted by settlement.
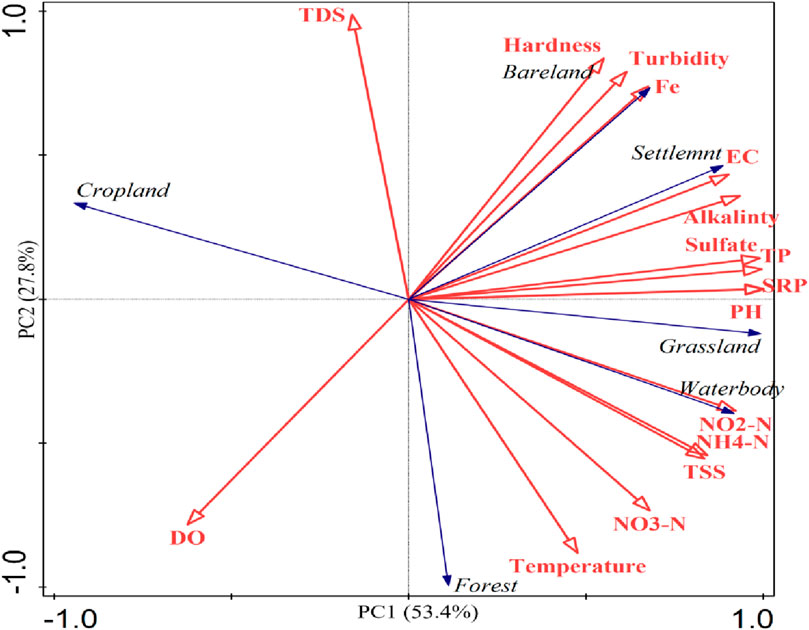
Figure 5. Principal component analysis biplot indicating the relationship between water quality parameters and LULC classes.
Discussion
Water quality parameters
Change in water quality parameters such as temperature, DO, EC, pH and nutrients influence the ecological, biogeochemical and integrity of aquatic systems (Alemu et al., 2017; Engdaw et al., 2022). Hence, health of aquatic systems is dependent on physico-chemical parameters. Consequently, the recent LU/LC modification particularly settlement expansion and increased socio-economic developments impacted water quality (Matlala, 2023).
In the present study, mean surface water temperature varied from 20.9 to 24.5°C with increasing trend from 2002 to 2022. In shallow lakes like Lake Tana, surface water temperature corresponds to air temperature (Shah et al., 2019). Thus, values reported during the study period were within the normal environmental temperature range of 21–27°C in the area and below the permissible upper limit of WHO (30°C; Abebe and Kebede, 2017; WHO, 2017; Gobezie et al., 2023). Similarly, the recorded maximum temperature fell within the normal range of 25–35°C for natural inland water bodies in the tropics (Egun and Ogiesoba-Eguakun, 2018). The observed spatio-temporal variations could be associated with the time of sampling, drought-induced climate change and canopy cover of vegetation (Abebe et al., 2017; Engdaw et al., 2022).
The pH level measured in the northern gulf of Lake Tana was slightly alkaline, but is still within the tolerable limits set in various guidelines for drinking (6.5–9.2), irrigation and livestock watering (6.5–9.0) purposes (DWAF, 1996; USEPA, 2011; WHO, 2017). Higher pH values of the tributaries and the lake indicate the dissociation of HCO3− and CO32− and production of OH− at equilibrium (Toufeek and Korium, 2009; Gobezie et al., 2023). Furthermore, pH in aquatic systems is highly associated with corrosive nature of the water and is highly impacted by various biological processes such as photosynthesis and respiration (Shah et al., 2019; Rahman et al., 2021). Higher pH is ultimately caused by increased photosynthetic removal of carbon dioxide. The current results are broadly similar to those previously reported by Goshu and Aynalem (2017; 8.2) and Engdaw et al. (2022; 8.7); for the littoral area of Lake Tana.
DO in the present study significantly varied between 5.3 and 8.03 mg/L among the 10 years intervals of the study period. The gradual decline in DO particularly from that of the river mouth of Megech to that of Dirma could be attributed to the severe anthropogenic activity in the catchment, which probably resulted in the introduction of oxygen-demanding domestic and industrial wastes and surface runoffs from agriculture lands that promoted microbial decomposition (Alemu et al., 2017; Engdaw et al., 2022; Gobezie et al., 2023). Lower anthropogenic pollution from point and diffuse sources may have contributed to the higher concentrations of DO recorded in the early 2000 s (Akale et al., 2018). Moreover, the recent enormous proliferation of the macrophyte water hyacinth, which forms a dense mat in the littoral regions of Gorgora gulf blocking light penetration, may have caused decreased submerged growth and cessation of underwater photosynthesis by phytoplankton leading to oxygen-depleted condition (Dersseh et al., 2019; Sewunet et al., 2022). The DO measured in the present study is slightly lower than the earlier records of 6.6–8.2 mg/L (Akoma and Imoobe, 2008; Wondim, 2016; Kassa et al., 2020). It is also below WHO’s acceptable lower limit of 6.5–8.5 for aquatic life survival (WHO, 2017) at Dirma and Megech sites.
Elevated level of EC recorded in this study is ascribed to the raised levels of dissolved solids and metallic ions originating from improper domestic and industrial waste discharge (Akale et al., 2018). Similarly, activities associated with agriculture, excavation and sand mining practices that dissolve the uppermost clay particles in the catchment are linked to greater EC (Gobezie et al., 2023). The lower EC level recorded in the littoral region of Lake Tana is possibly due to absorption and filtration capacity of water hyacinth and other aquatic macrophytes (Ratan and Verma, 2014; Dersseh et al., 2019; Kassa et al., 2020). EC values recorded in the present study fall below the limit of 2,500 μS cm−1 for freshwater (WHO, 2017). The higher turbidity values of the present study may possibly be due to runoff from agricultural lands with poor farming practice and meager soil conservation measures that promote uppermost soil erosion (Akinbile and Omoniyi, 2018; Engdaw et al., 2022; Gobezie et al., 2023). Further, dissolved solids, suspended organic matter, algal bloom, dense assemblage of microbial communities and minerals contribute to higher turbidity, resulting in declined light penetration through the water column (Mekuria et al., 2021; Gule et al., 2023). Thus, higher turbidity values recorded in this study may seriously impact effectiveness of disinfection through enhanced pathogenic bacteria growth and could impose health risk (Daghara et al., 2019). The lowest turbidity value measured at the littoral region of Lake Tana gulf at Gorgora seems to be associated with dilution by the huge volume of lake water and filtration by riparian macrophytes. Turbidity measured in this study is consistent with the reports of Wondim (2016) and Kassa et al. (2020). However, it does not conform to WHO, 2017 standard of 5 NTU for drinking water.
Higher values of algal growth limiting nutrients recorded in this study are associated with the severe anthropogenic activities including sewage and industrial effluents from the nearby highly populated and urbanized cities of Gondar, Azezo, Koladiba and Chuahit; which have poor wastewater drainage systems (Alemu et al., 2017; Engdaw et al., 2022). The strong associations of domestic wastewater and industrial effluents with nutrient enrichment were also reported by several studies (Marti et al., 2006; Akale et al., 2018; Kassa et al., 2020). In Ethiopia, more than 80% of wastewater generated from household and industries is directly discharged into nearby aquatic systems without treatment (Mekonnen, 2012). Correspondingly, Megech and Dirma Rivers and their tributaries are also used as waste dumping sites.
Moreover, point and non-point sources of pollutants originating from animal fattening and husbandry, phosphate containing detergents used for washing and bathing, runoff from intensive agriculture in the Dembia plain substantially may have contributed to nutrient enrichment (Li et al., 2014; Alemu et al., 2017; Fetahi, 2019). For instance, in the northern catchment of Lake Tana, farmers apply excessive amounts of fertilizers and pesticides on farm lands to improve yield and alleviate food insecurity. Incidently, annual fertilizer consumption of the country grew alarmingly from 3500 ton in 1970 to1.92 million tons in 2020 (Akale et al., 2018; Fetahi, 2019; CSA, 2021; Assegide et al., 2022). However, the poor soil conservation measures coupled with traditional farming technique resulted in the fertilizer to be washed away eventually entering aquatic systems through runoffs.
The lower concentrations of nutrients measured at Gorgora gulf and littoral region of Lake Tana might be due to uptake by algal communities, bacteria and by the highly proliferating macrophyte water hyacinth; or adsorbed onto the sediment (Gerhardt et al., 2010). The current mean values are higher than those reported previously by Wondim (2016), Alemu et al. (2017) and Derseh et al. (2019). The increasing trend in concentration can probably be ascribed to nutrient enrichment by domestic, industrial and agricultural activities. In general, freshwater systems respond to excess nutrient enrichment in various ways. According to Tibebe et al. (2019), TP above 0.01 mg/L is enough to cause eutrophication. Hence, nutrient enrichment had an inevitable contribution to the recent infestation of water hyacinth and eutrophication of Lake Tana.
Land use land cover map change
In the present study, the overall accuracy, which varied between 92.2% and 95.7% and Kappa coefficient of 0.86%–0.91%, revealed highest level of reliability. A very good Kappa coefficient value should be between 0.70% and 0.85% (Franklin and Wulder, 2002; Garedew et al., 2009). Hence, the classified images in this study exhibited a mean Kappa coefficient of 0.88%, indicating a strong association between ground truth data and categorized images (Fitawok et al., 2020; Muche et al., 2023). The finding of this study is in line with the above standard and results of other studies (Gashaye et al., 2023; Gule et al., 2023). Over all accuracy of LU/LC study could be affected by post-classification correction and difference in the quality of images.
During the last 30 years, significant LU/LC modification was observed in the study area as a result of settlement and forest expansion. At the beginning of this study, the landscape was dominated by crop land and gradually declined from 71.4% to 38.7%. The observed conversion of crop land in to other land cover types is a common phenomenon in central and northern Ethiopian highlands (Amha et al., 2013). The primary driver of these changes was the rise in local population which necessitated the availability of more land for settlement and grazing (Table 5; Ariti et al., 2015; Minta et al., 2018). During the last 3 decades, fourfold population increase was recorded in the region escalating expansion of formal and informal built-up at the expense of cropland (Fitawok et al., 2020). Similarly, substantial conversion of crop land to grass land to improve soil fertility was also reported in the northwest of Lake Tana (Gashaye et al., 2023).
In the second 10-year period of the study (2002–2013), considerable expansion of settlement, bare land and grass land at the expense of forest land was recorded. The observed expansion of settlement was associated with rapid population growth and government-favored urbanization (Garedew et al., 2009; Gashaye et al., 2023), while the expansion in grass land cover was attributed to animal husbandry, grazing, rehabilitation, soil fertility and biodiversity conservation measures (Minta et al., 2018; Beyene and Minale, 2023). Similar findings were also reported from Somado catchment and the northwestern watershed of Lake Tana (Fasika et al., 2019; Gashaye et al., 2023). Apparently, the sharp decline in forest cover from 11.1% in 2002 to 4.1% in 2013 at a rate of −0.63% could be associated with human-induced destruction of woodlands and shrub lands for various purposes including charcoal production, construction, timber and animal grazing (Minta et al., 2018; Obubu et al., 2022). Similar findings of declining forest land cover during the same period have been reported from various parts of the country (Kindu et al., 2013; Minta et al., 2018; Muche et al., 2023). These studies elucidated the fact that alarming population growth and subsequent urbanization have led to the expansion of settlement at the expense of forest causing resource overexploitation. Expansion of bare land was however, associated with drought, increase in built-up and urbanization. Moreover, throughout the study period, the irregularities observed in the trend of dynamic settlement could be due to the reduced backyard used for other purposes such as grazing and crop production. Rapid population growth-induced urbanization and settlement were also reported for many parts of the country between 2002 and 2013 (Minta et al., 2018; Gule et al., 2023).
From 1993 to 2022, large-scale crop land conversion to pasture, forest or grassland was recorded, and this is related to the medium-long term fallow practice applied to replenish soil fertility. Another crucial element in the change in LU/LC is rapid conversion of crop land into forest land (Table 5; Figure 6). The increased interest of smallholder farmers in withdrawing massive farmland area and allocating it for plantation could be linked to the expansion of eucalyptus plantation in response to rapid population growth that caused lack of wood for fuel and housing (Minta et al., 2018). Furthermore, eucalyptus plantation became a viable economic alternative due to dwindling agronomic productivity brought on by inadequate soil-water conservation measures and low production, even in the face of massive agro-chemical application to farmlands.
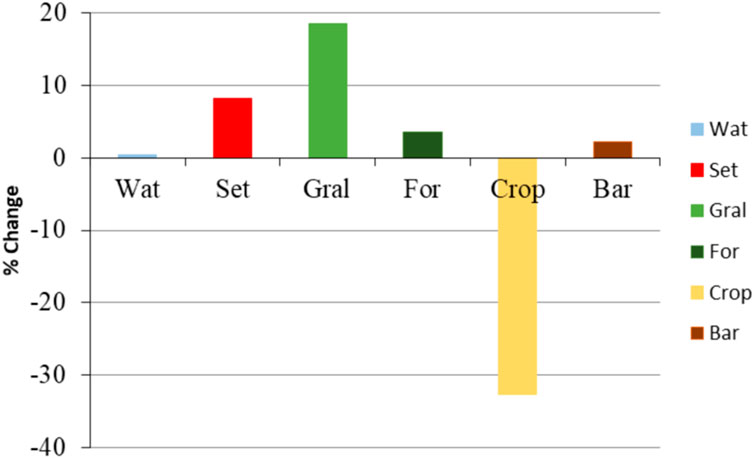
Figure 6. Percent of change in LU/LC of northern Lake Tana catchment from 1993–2022.
The recent significant expansion of forest particularly during the period of 2013–2022 could be associated with the recent nationwide green legacy campaign to combat environmental degradation, deforestation, soil erosion and climate variability (Beyene and Shumetie, 2023; Lambert and Deyganto, 2023). This finding agrees well with the reports of Hamad (2022), and Razzaq et al. (2023), that evidenced the positive impact of green legacy in mitigating climate change, averting land cover change through ecosystem restoration, and fostering environmental stewardship across the world. Subsequently, the role of green legacy initiative in promoting healthy environment in Ethiopia is significant (Fentaw et al., 2022).
Impact of LU/LC change on water quality
LU/LC change has a significant impact on water quality. The results of the present study also elucidated the strong association of water quality deterioration and increased urbanization, and built-up area and decreased agricultural land in the northern watershed of Lake Tana. This is attributable to the fact that expansion of settlement is a response to rapid population growth, urbanization and industrialization that led to increased quantity and reduced quality of domestic and industrial effluents (Assegide et al., 2022; Gule et al., 2023). The present results are well in line with several studies that reported exacerbation of water pollution due to increased domestic and industrial discharge quantity (Akale et al., 2018; Fetahi, 2019; Angassa et al., 2020). Furthermore, Tibebe et al. (2019) and Engdaw et al. (2022) pointed out that free-style waste dumping activities, i.e., about 80% of waste is dumped and discharged into nearby aquatic systems without treatment.
Increase in the expansion of forest and grassland was positively associated with water quality improvement. This could be ascribed to nutrient absorption and uptake by macrophytes, grasslands and forest vegetation (Gerhardt et al., 2010; Kassa et al., 2020). Conversely, decline in cropland showed a strong negative correlation with various water quality parameters. Hence, decrease in cropland expansion considerably increases point and nonpoint sources of pollutants through intensified use of agrochemicals, which hampered water quality. Numerous studies have disclosed that excessive applications of fertilizers accelerate water quality deterioration. For example, in the northern catchment of Lake Tana, farmers apply 100 kg of fertilizer (Urea or DAP) per hectare of crop land, which is above the recommended amount of 30–40 kg/ha (Akale et al., 2018; Fetahi, 2019; Getachew et al., 2021). Conversely, expansion of grassland and forest showed a negative correlation with temperature, EC, TDS turbidity, hardness, NH3-N + NH4-N, and others. This finding indicates the considerable role of vegetation cover in regulating local microclimate, improving water quality and mitigating pollution (Dersseh et al., 2019; Sewunet et al., 2022).
Conclusion
These results of the present study demonstrated the strong linkage between LULC changes and water quality. Over the study period, water quality in the northern gulf of Lake Tana was exacerbated due to rapid population growth and urbanization-driven settlement. Point and diffuse sources of pollutants emanating from cropland, settlement and other allochthonous sources have increased nutrient concentrations in the water. However, the recent green legacy campaign has significantly changed the land cover of the catchment, with increased forest and grassland cover at the expense of cropland. Integrated LU/LC change management, shoreline protection, modernized agronomic activity and strengthening the forestation program will improve the water quality, ecology and climate of the catchment.
Data availability statement
The raw data supporting the conclusions of this article will be made available by the authors, without undue reservation.
Author contributions
FE: Conceptualization, Data curation, Formal Analysis, Investigation, Methodology, Validation, Writing–original draft, Writing–review and editing. TF: Conceptualization, Funding acquisition, Supervision, Visualization, Writing–review and editing. DK: Conceptualization, Supervision, Validation, Visualization, Writing–review and editing.
Funding
The author(s) declare that financial support was received for the research, authorship, and/or publication of this article. The project was partially funded by the World Bank under African Center of Excellence for Water Management (ACEWM), Addis Ababa University, and Grant number: GSR/5582/14.
Acknowledgments
We acknowledge Ms. Alemtsehay of Abay Basin Central Water Quality Laboratory officer for providing us historical data.
Conflict of interest
The authors declare that the research was conducted in the absence of any commercial or financial relationships that could be construed as a potential conflict of interest.
Publisher’s note
All claims expressed in this article are solely those of the authors and do not necessarily represent those of their affiliated organizations, or those of the publisher, the editors and the reviewers. Any product that may be evaluated in this article, or claim that may be made by its manufacturer, is not guaranteed or endorsed by the publisher.
References
Abebe, E., and Kebede, A. (2017). Assessment of climate change impacts on the water resources of Megech River catchment, Abbay basin, Ethiopia. Open J. Mod. Hydrology 7, 141–152. doi:10.4236/ojmh.2017.72008
Abebe, W. B., G/Michael, T., Leggesse, E. S., Beyene, B. S., and Nigate, F. (2017). “Climate of Lake Tana basin,” in Social & ecol. Sys. Dynamics. Editors K. Stave, G. Goshu, and S. Aynalem (AESS Interdisciplinary Environ. Studies & Sci. Series), 51–58. doi:10.1007/978-3-319-45755-0_5
Abuhay, W., Gashaw, T., and Tsegaye, L. (2023). Assessing impacts of land use/land cover changes on the hydrology of Upper Gilgel Abbay watershed using the SWAT model. J. Agric. Food Res. 12, 100535. doi:10.1016/j.jafr.2023.100535
Akale, A. T., Moges, M. A., Dagnew, D. C., Tilahun, S. A., and Steenhuis, T. S. (2018). Assessment of nitrate in wells and springs in the north central Ethiopian highlands. Water 10, 476. doi:10.3390/w10040476
Akinbile, C. O., and Omonivi, O. (2018). Quality assessment and classification of Ogbese River using water quality index (WQI) tool. Sustain. Water Resour. Manag. 4 (4), 1023–1030. doi:10.1007/s40899-018-0226-8
Akoma, O. C., and Imoobe, T. O. T. (2008). Limnological and phytoplankton survey of Bahir Dar gulf of Lake Tana, Ethiopia. Afri. J. Sci. Tech. 10 (2), 91–98.
Alemu, M. L., Geset, M., Mosa, H. M., Zemale, F. A., Moges, M. A., Giri, S. K., et al. (2017). Spatial and temporal trends of recent dissolved phosphorus concentrations in Lake Tana and its four main tributaries. Land Degrad. Dev. 28, 1742–1751. doi:10.1002/ldr.2705
Amha, Y., Bekele, K., and Alebachew, M. (2013). Innovation platform for establishment and management of community nurseries in the central highlands of Ethiopia. Afr. Crop. Sci. J. 21, 693–703.
Angassa, K., Leta, S., Mulat, W., and Kloos, H. (2020). Seasonal characterization of municipal wastewater and performance evaluation of a constructed wetland system in Addis Ababa, Ethiopia. Int. J. Energy Water Res. 4, 127–138. doi:10.1007/s42108-019-00054-4
APHA (1999). American public health association (APHA), American water works association, and water pollution control federation. Stand. methods Exam. water wastewater. Washington, DC.
Ariti, A. T., van Vliet, J., and Verburg, P. H. (2015). Land-use and land-cover changes in the Central Rift Valley of Ethiopia: assessment of perception and adaptation of stakeholders. Appl. Geogr. 65, 28–37. doi:10.1016/j.apgeog.2015.10.002
Assefa, W. W., Eneyewa, B. G., and Wondie, A. (2021). The impacts of land-use and land-cover change on wetland ecosystem service values in peri-urban and urban area of Bahir Dar City, Upper Blue Nile Basin, Northwestern Ethiopia. Ecol. Process. 10, 39. doi:10.1186/s13717-021-00310-8
Assegide, E., Alamirew, T., Dile, Y. T., Bayabil, H., Tessema, B., and Zeleke, G. (2022). A synthesis of surface water quality in Awash basin, Ethiopia. Front. Water 4, 782124. doi:10.3389/frwa.2022.782124
Bewuket, W., and Solomon, A. (2013). Land use and land cover change and its environmental implications in a tropical highland watershed, Ethiopia. Int. J. Environ. Stud. 70, 126–139. doi:10.1080/00207233.2012.755765
Beyene, A. D., and Shumetie, A. (2023). Green legacy initiative for sustainable development of Ethiopia. Econ. Asso. Rep. 09, 1–5.
Beyene, E., and Minale, A. S. (2023). Modeling urban land use dynamics using Markov-chain and cellular automata in Gondar City, Northwest Ethiopia. Chin. J. Pop. Res. Environ. 21, 111–120. doi:10.1016/j.cjpre.2023.06.007
Biazin, B., and Sterk, G. (2013). Drought vulnerability drives land use and land cover changes in the Rift Valley dry-lands of Ethiopia. Agric. Ecosyst. Environ. 164, 100–113. doi:10.1016/j.agee.2012.09.012
Bogale, A. (2020). Review, impact of land use/cover change on soil erosion in the Lake Tana Basin, Upper Blue Nile, Ethiopia. Appl. Water Sci. 10, 235. doi:10.1007/s13201-020-01325-w
Bufebo, B., and Elias, E. (2021). Land use/land cover change and its driving forces in Shenkolla watershed, south central Ethiopia. Sci. World J. 2021, 1–13. doi:10.1155/2021/9470918
Central Statistical Agency (2017). Ethiopian population and housing census. Data capturing and processing implementation strategy. Available at: http://www.csa.gov.et/component/phocadownload/category/301-census-tables.
Congalton, R. G. (1991). A review of assessing the accuracy of classifications of remotely sensed data. Rem. Sens. Environ. 37 (1), 35–46. doi:10.1016/0034-4257(91)90048-B
Cotter, M., Berkhoff, K., Gibreel, T., Ghorbani, A., Golbon, R., Nuppenau, E. A., et al. (2014). Designing a sustainable land use scenario based on a combination of ecological assessments and economic optimization. Ecol. Indic. 36, 779–787. doi:10.1016/j.ecolind.2013.01.017
CSA (2021). The federal Democratic Republic of Ethiopia, Central statistical agency Agricultural Sample survey. 3, 534.
Daghara, A., Al-Khatib, I. A., and Al-Jabari, M. (2019). Quality of drinking water in Palestine: west bank as a case study. J. Environ. Publ. Health 2, 1–8. doi:10.1155/2019/8631732
Dersseh, M. G., Kibret, A. A., Tilahun, S. A., Worqlul, A. W., Moges, M. A., Dagnew, D. C., et al. (2019). Potential of water hyacinth infestation on Lake Tana, Ethiopia: a prediction using a GIS-based multi-criteria technique. Water 11, 1921. doi:10.3390/w11091921
DWAF (1996). South African water quality guidelines. 1: domestic uses. 2nd edn. Pretoria: Department of Water Affairs & Forestry.
ECRGE (2015). Ethiopia’s Climate Resilient Green Economy: climate resilient strategy agriculture and forestry. Fed. Democr. Repub Ethiop. Available at: https://gggi.org/wp-content/uploads/2017/11/2015-08-Sectoral-Climate-Resilience-Strategies-for-Ethiopia-1-Agriculture-and-Forestry-Climate-Resilience-Strategy.pdf.
Egun, N. K., and Ogiesoba-Eguakun, C. U. (2018). Physico-chemical and water quality index analysis of the okhuaihe river, edo state, Nigeria. Afr. J. Aquat. Sci. 43, 345–351. doi:10.2989/16085914.2018.1518214
Engdaw, F., Hein, T., and Beneberu, G. (2022). Heavy metal distribution in surface water and sediment of Megech River, a tributary of Lake Tana, Ethiopia. Sustainability 14, 2791. doi:10.3390/su14052791
FAO (2005). Global forest resource assessment: progress towards sustainable forest management. Available at: https://www.fao.org/forestry/fra2005/en/.
FAO (2016). Land cover classification system (LCCS): classification concepts and user manual. Rome, 36.
FAO (2020). Global forest assessment resources (No. 163). For. Pap. Rome, Italy. doi:10.4060/ca9825en
Fasika, A., Motuma, T., and Gizaw, T. (2019). Land use land cover change trend and its drivers in somodo watershed south western, Ethiopia. Afr. J. Agri. Res. 14, 102–117. doi:10.5897/AJAR2018.13672
Fenta, A. A., Yasuda, H., Shimizu, K., Ibaraki, Y., Haregeweyn, N., Kawai, T., et al. (2018). Evaluation of satellite rainfall estimates over the Lake Tana basin at the source region of the Blue Nile River. Atmos. Res. 212, 43–53. doi:10.1016/j.atmosres.2018.05.009
Fentaw, G., Mezgebu, A., Wondie, A., and Getnet, B. (2022). Ecological health assessment of Ethiopian wetlands: review and synthesis. Environ. Sus. Indic. 15, 100194. doi:10.1016/j.indic.2022.100194
Fetahi, T. (2019). Eutrophication of Ethiopian water bodies: a serious threat to water quality, biodiversity and public health. Afr. J. Aquat. Sci. 44 (4), 303–312. doi:10.2989/16085914.2019.1663722
Fitawok, M. B., Derudder, B., Minale, A. S., Passel, S. V., Adgo, E., and Nyssen, J. (2020). Modeling the impact of urbanization on land use change in Bahir-Dar city, Ethiopia: an integrated cellular automata-Markov chain approach. Land 9 (4), 115–117. doi:10.3390/land9040115
Franklin, H. E., and Wulder, M. A. (2002). Remote sensing methods in medium spatial resolution satellite data land cover classification of large areas. Prog. Phys. Geor. 26, 173–205. doi:10.1191/0309133302pp332ra
Garedew, E., Sandewall, M., Söderberg, U., and Campbell, B. M. (2009). Land use and land cover dynamics in the central rift valley of Ethiopia. Environ. Manag. 44, 683–694. doi:10.1007/s00267-009-9355-z
Gashaw, T., and Fentahun, T. (2014). Evaluation of land use/land cover changes in east of Lake Tana, Ethiopia. J. Environ. Earth Sci. 4 (11), 49–54. doi:10.12983/IJSRES-2014-P0199-0208
Gashaw, T., Tulu, T., Argaw, M., and Worqlul, W. (2018). Modeling the hydrological impacts of land use/land cover changes in the Andassa watershed, Blue Nile Basin, Ethiopia. Sci. Total Environ. 620, 1394–1408. doi:10.1016/j.scitotenv.2017.11.191
Gashaye, D., Woldu, Z., Nemomissa, S., and Adgo, E. (2023). The land-use and land-cover changes in the este district, south gondar zone, northwestern Ethiopia, in the last four decades (the 1980s to 2020s). Land 12, 1655. doi:10.3390/land12091655
Gebremedhin, S., Getahun, A., Anteneh, W., Bruneel, S., and Goethals, P. (2018). A Drivers-Pressure-State-Impact-Responses framework to support the sustainability of fish and fisheries in Lake Tana, Ethiopia. Sustainability 10, 2957. doi:10.3390/su10082957
Gebremicael, T. G., Mohamed, T. A., Betrie, G. D., van der Zaag, P., and Teferi, E. (2013). Trend analysis of runoff and sediment fluxes in the upper Blue Nile basin: a combined analysis of statistical tests, physically based models and land use maps. J. Hydrol. 482, 57–68. doi:10.1016/j.jhydrol.2012.12.023
Gerhardt, S., Boos, K., and Schink, B. (2010). Uptake and release of phosphate by littoral sediment of a freshwater lake under the influence of light or mechanical perturbation. J. Limnol. 69 (1), 54–63. doi:10.4081/jlimnol.2010.54
Getachew, B., Manjunatha, B. R., and Bhat, H. G. (2021). Modeling projected impacts of climate and land use/land cover changes on hydrological responses in the Lake Tana Basin, upper Blue Nile River Basin, Ethiopia. J. Hydrol. 595, 125974. doi:10.1016/j.jhydrol.2021.125974
Gobezie, A., Kaba, T., Tefera, M., Lijalem, T., Legesse, M., Engdaw, F., et al. (2023). Evaluation of water quality of Angereb reservoir: a chemometrics approach. App. Water Sci. 13, 103. doi:10.1007/s13201-023-01909-2
Gorelick, N., Hancher, M., Dixon, M., Ilyushchenko, S., Thau, D., and Moore, R. (2017). Google earth engine: planetary-scale geospatial analysis for everyone. Rem. Sens. Environ. 202, 18–27. doi:10.1016/j.rse.2017.06.031
Goshu, G., and Aynalem, S. (2017). Problem overview of the Lake Tana basin. Soc. Ecol. Syst. Dyn. 9 (23), 9–23. doi:10.1007/978-3-319-45755-0_2
Goshu, G., Koelmans, A. A., and de Klein, J. J. M. (2017). “Water quality of Lake Tana basin, upper Blue Nile, Ethiopia. A review of available data,” in Soc. And ecol. Sys. Dynamics. Editors K. Stave, G. Goshu, and S. Aynalem (Germany: Elsevier). doi:10.1007/978-3-319-45755-0_10
Gule, T. T., Lemma, B., and Hailu, B. T. (2023). Implications of land use/land cover dynamics on urban water quality: case of Addis Ababa city, Ethiopia. Heliyon 9, e15665. doi:10.1016/j.heliyon.2023.e15665
Hamad, K. J. (2022). Green economy and sustainable development concepts, principles and requirements for transformation in Iraq. J. STEPS Humanit. Soc. Sci. 1 (3), 1–14. doi:10.55384/2790-4237.1089
Hassen, E. E., and Assen, M. (2017). Land use/cover dynamics and its drivers in Gelda catchment, Lake Tana watershed, Ethiopia. Environ. Syst. Res. 6 (4), 4–13. doi:10.1186/s40068-017-0081-x
Kassa, Y., Mengistu, S., Wondie, A., and Tibebe, D. (2020). Distribution of macrophytes in relation to physico-chemical characters in the south western littoral zone of Lake Tana, Ethiopia. Aqu. Bot. 170, 103351. doi:10.1016/j.aquabot.2020.103351
Kindu, M., Schneider, T., Teketay, D., and Knoke, T. (2013). Land use/land cover change analysis using object-based classification approach in munessa-shashemene landscape of the Ethiopian highlands. Remote Sens. 5, 2411–2435. doi:10.3390/rs5052411
Lambert, E., and Deyganto, K. O. (2023). The impact of green legacy on climate change in Ethiopia. Green Low-Carbon Econ. 00 (00), 97–105. doi:10.47852/bonviewGLCE32021372
Lambin, E. F., Geist, H. J., and Lepers, E. (2003). Dynamics of land use and land cover change in tropical regions. Annu. Rev. Environ. Res. 20 (28), 49205–49241. doi:10.1146/annurev.energy.28.050302.105459
Li, M., Zang, S., Zhang, B., Li, S., and Wu, C. (2014). A review of remote sensing image classification techniques: the role of spatio-contextual information. Eur. J. remote Sens. 47, 389–411. doi:10.5721/EuJRS20144723
Lu, D., mausel, P., Brondizio, E., and Moran, E. (2004). Change detection techniques. Int. J. Remote Sens. 25 (12), 2365–2401. doi:10.1080/0143116031000139863
Martí, E., Sabater, F., Riera, J. L., Merseburger, G. C., von Schiller, D., Argerich, A., et al. (2006). Fluvial nutrient dynamics in a humanized landscape. Insights from a hierarchical perspective. Limnetica 25 (1-2), 513–526. doi:10.23818/limn.25.35
Matlala, M. D. (2023). Multivariate analysis of the dynamics in water quality and trophic status of the Crocodile River and Hartbeespoort dam. Environ. Ecol. Res. 11 (1), 42–64. doi:10.13189/eer.2023.110104
Matlhodi, B., Kenabatho, P. K., Parida, B. P., and Maphanyane, J. G. (2019). Evaluating land use and land cover change in the Gaborone dam catchment, Botswana, from 1984-2015 using GIS and remote sensing. Sustainability 11, 5174. doi:10.3390/su11195174
Mekonnen, F. H. (2012). Liquid waste management: the case of Bahir-Dar, Ethiopia. Ethiop. J. Health Dev. 26 (1), 49–53.
Mekuria, D. M., Kassegne, A. B., and Asfaw, S. L. (2021). Assessing pollution profiles along Little Akaki River receiving municipal and industrial wastewaters, Central Ethiopia: implications for environmental and public health safety. Heliyon 7 (7), e07526. doi:10.1016/j.heliyon.2021.e07526
Mengistie, K., Schneider, T., Demel, T., and Knoke, T. (2013). Land use/land cover change analysis using object-based classification approach in munessa-shashemene landscape of the Ethiopian highlands. Remote Sens. 5, 2411–2435. doi:10.3390/rs5052411
Mengistie, K., Schneider, T., Demel, T., and Knoke, T. (2015). Drivers of land use/land cover changes in Munessa-Shashemene landscape of the south-central highlands of Ethiopia. Environ. Monit. Assess. 187, 452. doi:10.1007/s10661-015-4671-7
Minale, A. S. (2019). Water level fluctuations of Lake Tana and its implication on local communities livelihood, northwestern Ethiopia. Int. J. River Basin Manag. 18 (4), 503–510. doi:10.1080/15715124.2019.1700512
Minta, M., Kibret, K., Thorne, P., Nigussie, T., and Nigatu, L. (2018). Land use and land cover dynamics in Dendi-Jeldu hilly-mountainous areas in the central Ethiopian highlands. Geoderma 314, 27–36. doi:10.1016/j.geoderma.2017.10.035
Moisa, M. B., Dejene, I. N., Roba, Z. R., and Gemed, D. O. (2022). Impact of urban land use and land cover change onurban heat island and urban thermal comfort level: a case study of Addis Ababa city, Ethiopia. Environ. Monit. Assess. 194, 736. doi:10.1007/s10661-022-10414-z
Muche, M., Yemata, G., Molla, E., Adnew, W., and Muasya, A. M. (2023). Land use and land cover changes and their impact on ecosystem service values in the north-eastern highlands of Ethiopia. PLoS ONE 18 (9), e0289962. doi:10.1371/journal.pone.0289962
Muriuki, G., Seabrook, L., McAlpine, C., Jacobson, C., Price, B., and Baxter, G. (2011). Land cover change under unplanned human settlements: a study of the Chyulu Hills squatters, Kenya. Landsc. Urban Plan. 99 (2), 154–165. doi:10.1016/j.landurbplan.2010.10.002
NMA (2024). National meteorology agency of Ethiopia. Available at: http://www.ethiomet.gov.et/stations/information.
Nyssen, J., Simegn, G., and Taha, N. (2009). An upland farming system under transformation: proximate causes of land use change in Bela-Welleh catchment (Wag, Northern Ethiopian Highlands). Soil Tillage Res. 103, 231–238. doi:10.1016/j.still.2008.05.020
Obubu, J. P., Mengistou, S., Odong, R., Fetahi, T., and Alamirew, T. (2022). Determination of the connectedness of Land use land cover change to water quality status of a shallow lake: a case of Lake Kyoga basin, Uganda. Sustainability 14, 372. doi:10.3390/su14010372
Rahman, A., jahanara, I., and Jolly, Y. N. (2021). Assessment of physicochemical properties of water and their seasonal variation in an urban river in Bangladesh. Water Sci. Eng. 14 (2), 139–148. doi:10.1016/j.wse.2021.06.006
Ratan, A., and Verma, V. N. (2014). Photochemical studies of Eichhornia crassipes (water hyacinth). Int. Lett. Chem. Phy. Astro. 11 (3), 214–222. doi:10.18052/ILCPA.30.214
Razzaq, A., Sharif, A., Ozturk, I., and Afshan, S. (2023). Dynamic and threshold effects of energy transition and environmental governance on green growth in COP26 framework. Renew. Sus.Energy Revi. 179, 113296. doi:10.1016/J.rser.2023.113296
Schober, P., Boer, C., and Schwarte, L. A. (2018). Correlation coefficients: appropriate use and interpretation. Anesth. Analgesia 126 (5), 1763–1768. doi:10.1213/ane.0000000000002864
Serur, A. B., and Adi, K. A. (2022). Multi-site calibration of hydrological model and the response of water balance components to land use land cover change in a rift valley Lake Basin in Ethiopia. Sci. Afri. 15, e01093. doi:10.1016/jsciaf.2022.e01093
Sewunet, B., Girma, H., Debela, S. A., Luke, A. O., and Gebrehiwot, M. (2022). Participatory management of weed infestation in Lake Tana: setting better future in the front mirror. Front. Ecol. Evol. 10, 1029170. doi:10.3389/fevo.2022.1029170
Shah, J. A., Pandit, A. K., and Shah, G. M. (2019). Physico-chemical limnology of a shallow lake in the floodplains of western Himalaya from last four decades: present status. Environ. Syst. Res. 8, 9. doi:10.1186/s40068-019-0136-2
Teshome, G., Getahun, A., Mengist, M., Wilson, G., and Anteneh, W. (2021). Influence of irrigation infrastructures and water quality on fish assemblages in Lake Tana tributaries, north-west Ethiopia. Environ. Biol. Fish. 104, 653–673. doi:10.1007/s10641-021-01101-y
Tibebe, D., Kassa, Y., Melaku, A., and Lakew, S. (2019). Investigation of spatio-temporal variations of selected water quality parameters and trophic status of Lake Tana for sustainable management, Ethiopia. Micro Chem. J. 148, 374–384. doi:10.1016/j.microc.2019.04.085
Uhlenbrook, S., Mohamed, Y., and Gragne, A. S. (2010). Analyzing catchment behavior throughcatchment modeling in the Gilgel Abay, Upper Blue Nile River basin, Ethiopia. Hydrol. Earth Syst. Sci. 14, 2153–2165. doi:10.5194/hess-14-2153-2010
USEPA (2011). United States Environmental Protection Authority: Drinking water standards and health advisories. http://www.epa.gov/waterscience/.
WHO (2017). World health organization: Guidelines for drinking water quality, 4th edi, incorporating the 1st addendum. https://www.who.int/publications/i/item/9789241549950.
Woldesenbet, T. A., Elagib, N. A., Ribbe, L., and Heinrich, J. (2017). Hydrological responses to land use/cover changes in the source region of the Upper Blue Nile Basin, Ethiopia. Sci. Total Environ. 575, 724–741. doi:10.1016/j.scitotenv.2016.09.124
Wolde-Yohannes, A., Cotter, M., Kelboro, G., and Dessalegn, W. (2018). Land use and land cover changes and their effects on the landscape of abaya-chamo basin, southern Ethiopia. Land 7, 2. doi:10.3390/land7010002
Womber, Z. R., Zimale, F. A., Kebedew, M. G., Assefa, M. L., and Ayalew, D. W. (2022). Assessment of spatiotemporal variation of water quality of Lake Tana, Ethiopia. PJET 1 (1), 1–21. doi:10.20372/pjet.v1i1.1271
Wondie, A. (2018). Ecological conditions and ecosystem services of wetlands in the Lake Tana area, Ethiopia. Ecohyrol. Hydrobiol. 18, 231–244. doi:10.1016/j.ecohyd.2018.02.002
Wubie, M. A., Assen, M., and Nicolau, M. D. (2016). Patterns, causes and consequences of land use/cover dynamics in the Gumara watershed of Lake Tana basin, Northwestern Ethiopia. Environ. Syst. Res. 5, 8. doi:10.1186/s40068-016-0058-1
Wubneh, B. A., Seifu, A. T., Michael, M. M., Ayalew, W., Minychl, G. D., and Michael, E. M. (2022). Environmental flow assessment and implications on sustainability of aquatic ecosystems in Ethiopia: a literature review on global and national evidences. Environ. Dev. 44, 100758. doi:10.1016/jenvdev.2022.100758
Keywords: green legacy, land use/land cove, population growth, settlement, water quality
Citation: Engdaw F, Fetahi T and Kifle D (2024) Land use/land cover dynamics in the northern watershed of lake Tana: implications for water quality. Front. Environ. Sci. 12:1426789. doi: 10.3389/fenvs.2024.1426789
Received: 02 May 2024; Accepted: 21 June 2024;
Published: 10 July 2024.
Edited by:
Salvador García-Ayllón Veintimilla, Polytechnic University of Cartagena, SpainReviewed by:
Xiankun Yang, Guangzhou University, ChinaStephen Opiyo, North-West University, South Africa
Copyright © 2024 Engdaw, Fetahi and Kifle. This is an open-access article distributed under the terms of the Creative Commons Attribution License (CC BY). The use, distribution or reproduction in other forums is permitted, provided the original author(s) and the copyright owner(s) are credited and that the original publication in this journal is cited, in accordance with accepted academic practice. No use, distribution or reproduction is permitted which does not comply with these terms.
*Correspondence: Flipos Engdaw, ZmxpcG9zLmVuZ2Rhd0BhYXUuZWR1LmV0