 Danelle Agnew
 Kirstie Fryirs
 Michelle R. Leishman
94% of researchers rate our articles as excellent or good
Learn more about the work of our research integrity team to safeguard the quality of each article we publish.
Find out more
ORIGINAL RESEARCH article
Front. Environ. Sci., 25 September 2024
Sec. Freshwater Science
Volume 12 - 2024 | https://doi.org/10.3389/fenvs.2024.1425668
This article is part of the Research TopicAdvances in Fluvial, Coastal, Wastewater and Hydro-Environment Systems, Volume IIView all 4 articles
With the impact and cost of continued river degradation and climate change-induced extreme rainfall and floods, there is growing urgency to achieve and maintain good river health to meet global sustainable development goals. Up-scaling and working with nature-based solutions at regional, catchment and fluvial corridor scales is critical. One way to achieve this is to work within a recovery-enhanced approach to river rehabilitation, incorporating processes of geomorphic and vegetative recovery to build fluvial corridors in areas where they have become fragmented. Geomorphologically-informed cost-benefit analysis has not previously been applied in a riverine or riparian context, at the catchment or regional scale needed. We applied Marxan in a novel manner to undertake the first cost-benefit analysis for geomorphologically-informed rehabilitation of river systems. We estimated that to rehabilitate 75,500 km of streams in coastal catchments of NSW will cost $8.2 billion, comparing favourably to recent single flood event insurance losses, and projected future losses. We developed Marxan scenarios based on three broad approaches to river management: ad hoc and reactive, working with recovery and corridors, across current and future time periods. We found there are considerable current and flow-on future financial and non-financial benefits, and lower initial total and per-hectare rehabilitation costs, by fully adopting working with recovery or corridors approaches and moving away from the ad hoc and reactive approaches which dominate current practice. Implementing targeted rehabilitation based on a rolling sequence over time of corridors scenarios provides optimal holistic solutions to improve geomorphic condition and enhance recovery potential at landscape-scale. Our study demonstrates the use of Marxan as an accessible tool to address prioritisation complexity, and to run and cost landscape-scale rehabilitation scenarios over time. Our study also demonstrates the positive offsite feedbacks that occur through multiplier effects, as recovery occurs, and corridors are built. Geomorphologically-informed decision making becomes more robust, transparent, cost-effective, consistent across catchments, and adaptive to local situations and evolving river management priorities.
Both the UN’s Sustainable Development Goals and Decade on Ecosystem Restoration contain targets to restore freshwater ecosystem habitat and improve riverine and riparian biodiversity (Perry, 2023; UN DESA, 2023; United Nations, 2023). With weather-related disasters costing the global economy an estimated US$258 billion (∼A$348 billion) in 2020 (AON, 2021; Naughtin et al., 2022), and continued biodiversity degradation, there is a sense of global urgency to meet these goals (European Commission, 2022b).
Globally there is recognition of the potential of nature-based solutions to mitigate impacts of climate change and land use change, secure ecosystem services and support biodiversity (Seddon et al., 2020; Tickner et al., 2020). Nature-based solutions use naturally occurring features and processes to sustainably rehabilitate and manage ecosystems for socio-biodiversity benefits (Cohen-Shacham et al., 2016). Nature-based solutions can be instrumental in planning for rehabilitation of fluvial corridors to meet diverse challenges such as biodiversity protection, flood mitigation and climate adaptation (Beyer et al., 2018; Albert et al., 2021). For freshwater ecosystems, valuing the benefits of river rehabilitation and working with nature-based solutions at regional, catchment and fluvial corridor scales is critical to achieve Sustainable Development Goals (Szałkiewicz et al., 2018; Cohen-Shacham et al., 2019; Basak et al., 2021). However, with large catchments and resource allocation constraints, one challenge river managers and decision-makers face is how to systematically and strategically prioritise river rehabilitation efforts to get the best environmental return on investment (Perry, 2023). As elsewhere in nature, river conservation and rehabilitation efforts need to be focussed where sustainable, cost-effective environmental solutions can be implemented (Bergstrom and Loomis, 2017; Vörösmarty et al., 2018; Kroeger et al., 2019; Hartig et al., 2020).
Healthy fluvial corridors, at catchment and landscape scales, including riparian zones, act as critical natural infrastructure (Tickner et al., 2020; Skidmore and Wheaton, 2022), and allow for natural ecosystem functioning and connectivity (Pittock et al., 2018; Hermoso and Filipe, 2021). Anthropogenic disturbances that reduce geomorphic diversity and complexity, or “structural starvation”, have been identified as key drivers of biodiversity loss (Tickner et al., 2020; Skidmore and Wheaton, 2022). As a result, fluvial corridors have become fragmented, resulting in “poor quality” sections of river in between “good quality” sections. Identifying where this fragmentation has occurred and whether it can be repaired is critical to river management (Agnew and Fryirs, 2022; Agnew et al., 2022).
In a global context there are essentially three approaches to river management in operation.
First, the ad hoc and reactive (AHR) approach tends to focus on rehabilitation of individual river reaches at the local scale. It is a reactive, opportunistic approach that addresses “problems” in isolation (Hermoso et al., 2012; Robins, 2023; Friberg et al., 2016). It often occurs despite recognition that reach-scale rehabilitation projects should be placed within a catchment-scale context and reach selection should be based on an evidence-based prioritisation framework (Koehn et al., 2001; Beechie et al., 2010; Speed et al., 2016; Robins, 2023). In many cases, societal and financial values override environmental values in project and reach selection (Anderson et al., 2019), sometimes the result of necessity, with rehabilitation occurring where possible rather than where most needed. The ad hoc and reactive approach results in projects being implemented in poorer condition reaches, at great cost, and with a much lower chance of success (Guimarães et al., 2021). Increasingly, this approach to river management is unable to respond to catchment-scale challenges (Speed et al., 2016).
Second, a working with recovery (WWR) approach, as a nature-based solution, adopts a working with the river ethos (Fryirs and Brierley, 2021; Burgess-Gamble et al., 2017). River recovery reflects the ability of a river system to repair, either via assisted and strategic intervention or by “leaving the river alone” (Fryirs and Brierley, 2016). River recovery in this context is defined as geomorphic, where there is noticeable improvement in a river’s physical structure and function (Fryirs and Brierley, 2016; Mabbott and Fryirs, 2022) vegetative, where there is noticeable improvement in instream and riparian vegetation cover and quality (O'Donnell et al., 2016; Fryirs et al., 2018; Mabbott and Fryirs, 2022), and hydrologic, where increased vegetative roughness results in longer flood peak travel times and reduced flood wave celerity (Fryirs et al., 2023). Working with recovery as an approach means identifying where in a catchment recovery can be triggered and/or enhanced to improve the condition (or health) of river systems using process-based, nature-based approaches to improve valuable ecosystem services provision (Beechie et al., 2010; Hawley, 2018; Wheaton et al., 2019; Fryirs and Brierley, 2021). The working with recovery approach requires less physical intervention and maintenance, and is considered to be more cost-effective and sustainable than the ad hoc and reactive approach (Fryirs and Brierley, 2016; Moore and Rutherfurd, 2017). When implemented at the catchment rather than reach-scale, working with recovery can have other positive off-site and downstream effects such as reduced flood risk and improved longitudinal connectivity for fish migration (Langhans et al., 2016; Hermoso et al., 2021). The working with recovery approach typically requires that practitioners understand the recovery potential (high, moderate, or low) of the river systems they are working on (Fryirs et al., 2021). This necessitates that each reach is placed within a catchment context and that the impact of external pressures and internal limiting factors on current and future reach condition are understood (see Brierley and Fryirs (2005); Fryirs and Brierley (2016) for details). In this study, the recovery potential of reaches is used as a prioritisation tool (Agnew and Fryirs, 2022). Working with recovery is then applied by prioritising the protection of conservation reaches, which are reaches already in good condition with the highest geoecological values. This is followed by intervention to treat strategic reaches that contain threatening processes which may impact the integrity of adjacent conservation or other good condition reaches. Then, rehabilitation is further prioritised according to a scale of declining recovery potential in reaches with high recovery potential (HRP), followed by moderate recovery potential (MRP) and finally low recovery potential (LRP) (Brierley and Fryirs, 2005). The recovery potential of a reach will determine the level of intervention that is required. As recovery potential declines, more and costlier intervention is needed. However, strategic reaches may require a range of costly interventions depending on the type of threatening processes being treated.
Third, the corridors (Corr) approach prioritises the (re) building of longitudinally continuous river reaches that are in good condition. This catchment and landscape scale approach considers connections with adjacent and surrounding reaches, and works with reach and loci connections to build corridors of river recovery (Agnew and Fryirs, 2022). Reach connections are defined as an upstream to downstream section of river, linked end-to-end. Loci connections are defined as isolated river sections from which recovery can be established and extended into surrounding reaches and tributaries. In this approach, river managers regard the fluvial corridor as the management unit, and prioritise the treatment of reaches to connect corridors and undertake rehabilitation where it will enhance the recovery potential of the system as a whole (Beechie et al., 2010; Harvey and Gooseff, 2015; Fryirs and Brierley, 2016; Fryirs et al., 2018; Piégay et al., 2020). Combined with knowledge of local conditions, the corridors approach forms a significant input to decision making when prioritising and developing river management strategies, and should provide superior rehabilitation benefits to the ad hoc and reactive and working with recovery approaches.
In the river management sector no studies have been undertaken on the cost-benefit of the ad hoc and reactive, working with recovery or corridors approaches to quantify their environmental return on investment. For this to take place requires that data are available on the costs of rehabilitation and that a monetary value can be placed on the benefits that ensue (see Table 1 for examples of river rehabilitation costs) (DIPNR, 2004; Brooks et al., 2017; ECRR, 2018; Iacona et al., 2018; Szałkiewicz et al., 2018; European Commission, 2022a; Yong et al., 2023). In some places there are formalised and widespread data available on the scope, outcomes, and costs of river restoration/rehabilitation projects, and some attempts have been made to value the ecosystem service benefits of rehabilitation. For example, an EU and United Kingdom maintained publicly available river restoration database (ECRR, 2023) provides data on broad restoration costs of 119 EU and United Kingdom river restoration projects from 1989 to 2016 (Szałkiewicz et al., 2018). (Table 1). Other sources of costings include a global ecosystem services valuation database (De Groot et al., 2020) and a comprehensive and detailed Impact Assessment Working Paper for the EU-proposed Nature Restoration Law (European Commission, 2022a).
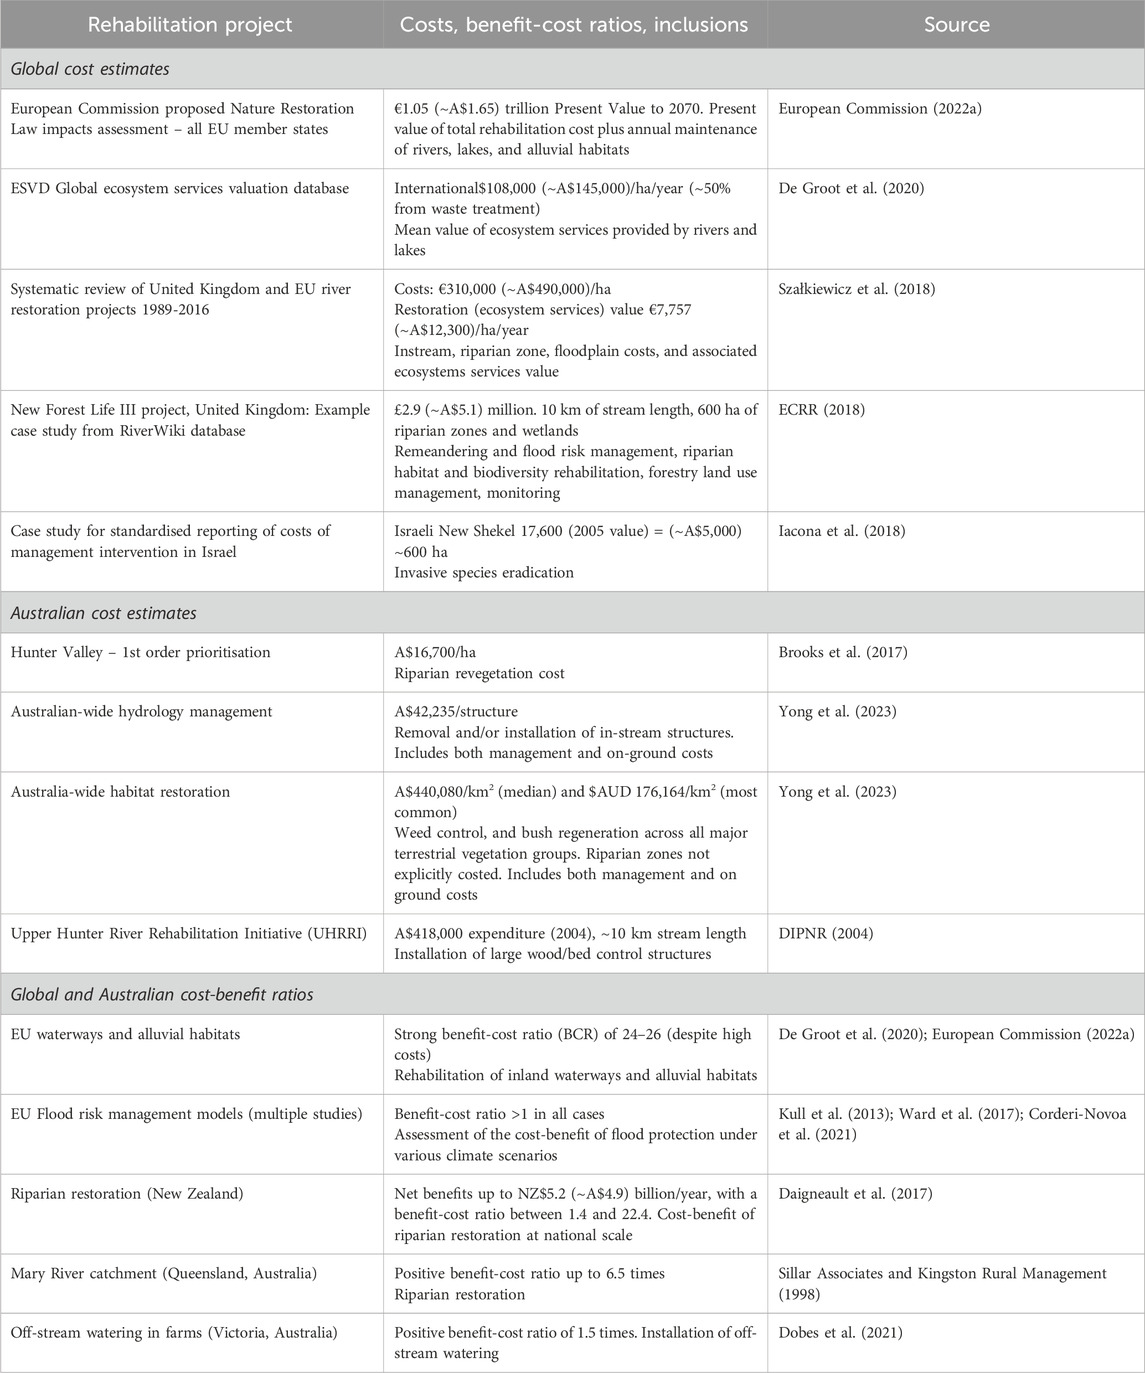
Table 1. Examples of river rehabilitation costs and cost-benefit ratios drawn from the literature.
In Australia, however, a systematically organised, publicly available, and transferable approach to river rehabilitation costing, and conservation cost reporting more generally, is lacking (Iacona et al., 2018). Costing data has generally been gleaned from academic and conference papers (Pietsch et al., 2021; Yong et al., 2023), individual project reports (Hunter-Central Rivers CMA, 2008; Brooks et al., 2017), analysis of government programs (Yong et al., 2023) (e.g. Victoria’s Strategic Management Prospects program (Thomson et al., 2020) and NSW’s Saving Our Species program (DPIE, 2021b)), or direct expert advice obtained from private and government organisations operating in the river management field (Table 1).
Environmental cost-benefit analysis compares the monetary costs and benefits derived from a project to systematically identify and express in monetary terms, the widest possible range of economic, social and environmental costs and benefits of taking (or not) a management action, whereas cost-effectiveness is the quantitative benefit, e.g. rate of species survival or improved ecosystem functioning, compared to its cost (Atkinson et al., 2018; Logar et al., 2019). Managing landscapes to optimise both ecosystem and human benefits, and cost effectiveness (Albert et al., 2021) is complex and dynamic, and often driven by multiple, sometimes conflicting objectives (Renwick et al., 2020). If done well, environmental cost-benefit analysis is a transparent method for project prioritisation ex ante, and evaluation ex post (Dobes et al., 2016; Atkinson et al., 2018). In most cost-benefit analyses, economic costs and benefits are straightforward to measure in financial terms. However, non-financial environmental and social costs and benefits require various assumptions to be identified and quantified in financial terms and incorporated into cost-benefit analysis (Dobes et al., 2016; Atkinson et al., 2018; Boardman et al., 2018). Financial proxies, or shadow pricing, including ecosystem service valuation, e.g. willingness to pay, clean water targets, or opportunity cost of pollution abatement, can be assigned to non-financial environmental costs and benefits (Howarth and Farber, 2002; Obst, 2018; Bonner, 2022).
Globally, there is wide variation in the extent of environmental costs and benefits being considered in cost-benefit analysis (Atkinson et al., 2018). In river management, the challenges lie in linking a direct cost to a measure of success (the benefit). Attempts have been made to determine the cost-benefit of riparian revegetation (Kimball et al., 2015), determine public preferences and willingness to pay for rehabilitation and to translate ecological and ecosystem services into economic values (Logar et al., 2019). In the EU, cost-benefit analysis has been used to assess the ecological impact of proposed riverine restoration actions to 2050 under the proposed Nature Restoration Law, finding strong benefit-cost ratios despite high costs (De Groot et al., 2020; European Commission, 2022a) (Table1). Elsewhere, flood risk management models yield positive benefit-cost ratios (Kull et al., 2013; Ward et al., 2017; Corderi-Novoa et al., 2021), and in New Zealand, riparian restoration at national scale would yield a positive benefit-cost ratio (Daigneault et al., 2017) (Table 1).
In Australia, cost-benefit analysis for freshwater systems have largely been focussed on biodiversity conservation, e.g., in south-east Queensland streams (Mantyka-Pringle et al., 2016). Other cost-benefit analyses have analysed the provision of environmental flows at flood stage in the Murray Darling Basin (Kahan et al., 2021), and riparian restoration of Queensland’s Mary River catchment, the latter yielding a positive benefit-cost ratio up to 6.5 times (Sillar Associates and Kingston Rural Management, 1998). Cost-benefit analysis has also been used to demonstrate the economic benefits from off-stream watering in farms (Dobes et al., 2021) and the mutual environmental and economic benefits from improving (e.g. fencing off) riparian zones (Cary et al., 2002; NRMSouth, 2015; NSW Government, 2021), resulting in positive benefit-cost ratios (Table 1).
Dobes et al. (2016) addresses some of the issues with environmental cost-benefit analysis in Australia and recommends that cost-benefit analysis frameworks be comprehensively harmonised and systemised across government organisations to provide transparency and rigour to project analysis. Systematic integration of geomorphological, ecological, and economic objectives into strategic planning is essential to identify the trade-offs between biodiversity conservation and ecosystem service delivery and optimise rehabilitation solutions both financially and environmentally (Hermoso et al., 2015; Fastré et al., 2020). Therefore, there is a need to identify, adapt and use a cost-benefit analysis tool and framework that can meet these requirements.
In conservation planning the maxim has been to emphasise the protection of intact habitat compared to restoration of degraded areas to achieve conservation goals, firstly addressing areas in good condition and working outwards into poorer areas (Dodds et al., 2008; Possingham et al., 2015; Garcia et al., 2021). In river management, rehabilitation can deliver improved ecosystem services (Bernhardt et al., 2005; Logar et al., 2019; Kaiser et al., 2020; Lin et al., 2020). For example, restoration of natural sediment regimes can support improved ecosystem functioning (Wohl et al., 2015). Nature-based solutions can be used to rehabilitate floodplain wetlands and riparian buffers to arrest biodiversity loss by improving channel and floodplain form and habitat heterogeneity (Hamilton et al., 2007; Sheldon et al., 2012; Langhans et al., 2014; Tickner et al., 2020). Tulloch et al. (2017) demonstrate the benefits of classification of remotely sensed geomorphic mapping as a surrogate for biodiversity representation.
Marxan is a spatial prioritisation tool, extensively used globally for systematic conservation planning (Lewis et al., 2003; Ball et al., 2009), most often in marine (Lewis et al., 2003) and terrestrial systems. Where it has been applied to freshwater and riparian systems, the focus has been on biodiversity, not geomorphology (Linke et al., 2019; Szabolcs et al., 2022). In Reis et al. (2019), Marxan was used to assess ecosystem protection using floodplain-wetland longitudinal and lateral connectivity. Marxan has been used to systematically prioritise cost-effective rehabilitation strategies in Swiss cantons by optimising the spatial allocation of costed repair, based on riparian condition assessment, to meet ecological benefits (Langhans et al., 2014). Where Marxan has incorporated geomorphology, this has been in marine reserves (Heyman and Wright, 2011; Tulloch et al., 2017) and at broad scales in terrestrial systems (Nel et al., 2009; Anderson et al., 2015), rather than in fluvial systems. However, Heyman and Wright (2011) advocate the use of geomorphology in marine reserve planning, and Álvarez-Romero et al. (2016) undertook marine planning based on river sediment plumes. Marxan can be used to prioritise the allocation of barrier removal projects to improve river geomorphology, allowing for augmented fish populations (Hermoso et al., 2021). Within Australian river systems, Marxan was instrumental in determining floodplain water allocation plans in the Murray-Darling Basin (DPIE, 2020), and in the New South Wales Hawkesbury/South Creek catchment to create a comprehensive map integrating strategic planning priorities for protection and enhancement of streamlines, riparian vegetation, and other water-dependent ecosystems (Dela-Cruz et al., 2021).
In this study we undertake the first cost-benefit analysis for river management in coastal catchments of NSW, Australia. The cost-benefit analysis focus in this study is restricted to using quantifiable costs and implied benefits from improved recovery potential over time to demonstrate the value in undertaking geomorphically-informed rehabilitation. We first calculate the potential costs of river rehabilitation based on the current recovery potential of these rivers. Using percentages of each recovery potential rehabilitated as determined by the river management approach, we then quantify the cost of the ad hoc and reactive, working with recovery and corridor approaches for these rivers. We then employ Marxan in a novel manner, setting targets for different river classifications, rather than species or habitats, to identify optimal locations for rehabilitation under present day and future scenarios. We then use Marxan as a cost-benefit analysis tool to systematically prioritise rehabilitation of fluvial corridors, working at the landscape scale, for current and future timescales, demonstrating benefits from improvements in recovery potential over time.
The study area covers the 20 major coastal catchments of NSW (140,025 km2), 75,461 km of freshwater stream length and seven regions (Figure 1, Supplementary Table S1 in Supplementary Material). In each region, the recovery potential of each streamline has already been assessed using the River Styles Framework (Brierley and Fryirs, 2005; DPIE, 2021a; Fryirs et al., 2021). Fluvial corridors containing reach and loci connections of various combinations have also already been identified for rehabilitation prioritisation (Fryirs et al., 2021; Agnew and Fryirs, 2022). Both these datasets are available Open Access at the NSW Government SEED portal, River Styles at NSW Government and DCCEEW (2023) and corridors datasets at Commonwealth of Australia and Macquarie University (2023).
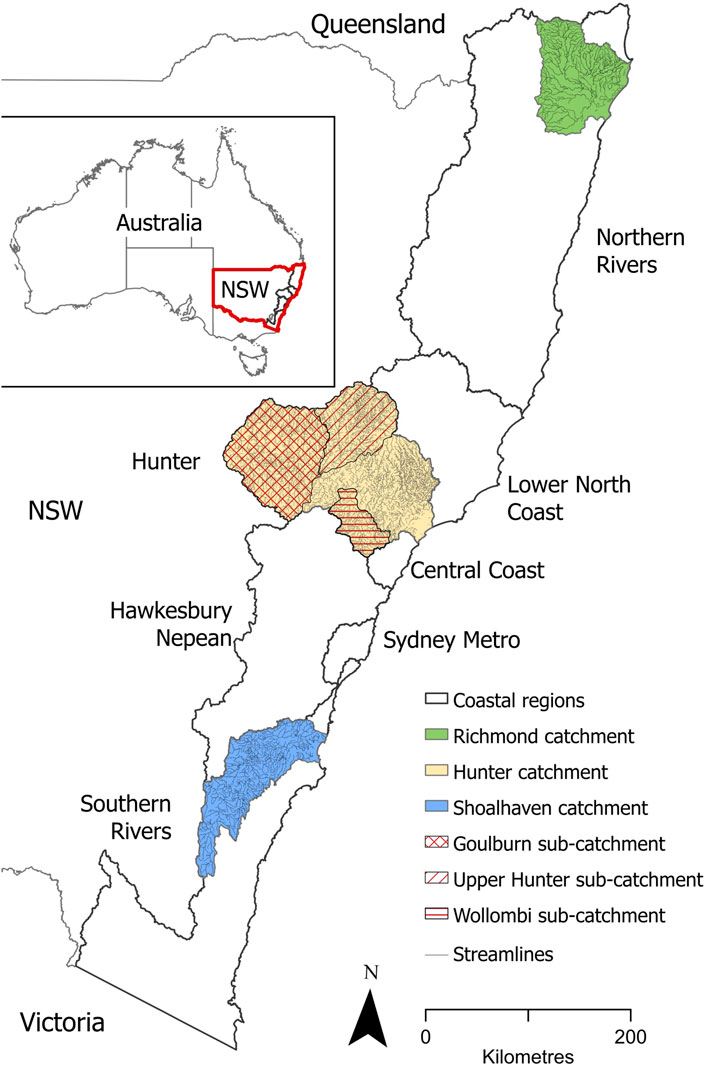
Figure 1. Study area showing regions, major catchments and key subcatchments in NSW coastal catchments of eastern Australia.
For regional costings we analysed the whole study area using the corridors dataset of Agnew and Fryirs (2022). Additionally, three major catchments and three key sub-catchments were selected for more detailed costing analysis and cost-benefit analysis using Marxan (Figure 1). Selection criteria were the overall length and diversity of suitable reach and loci connections. Three representative major catchments with diverse valley settings and assemblage of recovery potentials, Richmond (3,324 km stream length, 7,033 km2 catchment area), Hunter (15,269 km, 21,447 km2) and Shoalhaven (3,962 km, 7,208 km2) were selected for analysis. In addition, the Hunter catchment has a diverse range of recovery potentials, and reach and loci connections, and long stream length. Therefore, three key sub-catchments with these characteristics were selected from the Hunter catchment to test the level of variability in cost-benefit analysis results produced; the Upper Hunter (upstream of Denman township) (3,563 km, 4,490 km2), Goulburn (4,715 km, 7,782 km2) and Wollombi (1,408 km, 1,909 km2).
Some reaches have multiple reach and/or loci connections, e.g., a strategic reach may be both upstream of high recovery potential and downstream of conservation reaches. To avoid double counting, overlapping reaches within reach and loci connections have been removed from the analysis. However, there is still overlap where a reach forms part of both a reach connection and a loci connection. This resulted in 4,926 km and 5,888 km of reach and loci connections, respectively, to be used in the analysis, detailed by River Styles regions, and selected catchments and sub-catchments (Supplementary Table S1 in Supplementary Material).
A 40 m wide riparian zone (20 m perpendicular to each channel bank) was identified as a suitable and consistently applied average riparian zone width for rehabilitation, based on recommended riparian zone widths for Australian agricultural lands of between 20 and 38 m reported in Hansen et al. (2015), and optimum ideal width modelled by Malcher et al. (2023). Costs were applied assuming a 40 m riparian zone was being rehabilitated for all streams.
Typical rehabilitation activities and techniques were identified from a range of options identified in the literature (Brierley and Fryirs, 2005; Szałkiewicz et al., 2018) and from government and industry sources (Wheaton et al., 2019; The River Restoration Centre, 2020). To determine costings for the rehabilitation activities, we consulted expert industry professionals within Hunter Local Land Services, Landcare Australia, and MidCoast Council; three organisations actively involved in river rehabilitation in NSW coastal catchments. We obtained detailed estimates and actual costings for a variety of rehabilitation techniques, activities and from completed projects. Costs obtained were current from 2020 to 2023, and not inflation adjusted. Costs were restricted to on-ground rehabilitation and maintenance costs to enable direct comparison between the different rehabilitation approaches. Costs excluded design, management and other logistics costs, such as those included in Yong et al. (2023). Rehabilitation costs include instream structural works (e.g., bed control), riparian zone structural works (e.g., bank attached structures, fencing, off stream watering) and vegetative works (site preparation, weed removal, seeding and planting, ongoing maintenance). Rehabilitation costs can vary significantly across regions. Differences occur due to project size and site-specific rehabilitation requirements, methods, and limitations such as access. Costly components of rehabilitation include labour, and the installation of in-stream structures. Some costs decrease on a per-hectare basis as project size increases, i.e. those where transport and equipment deployment form an integral fixed cost component e.g. fencing, direct seeding, herbicide boom spraying (Schirmer and Field, 2000). Other costs relate directly to project size, particularly consumable costs, e. g, seedlings, seeds, and stakes; and the per-hectare cost stays relatively stable irrespective of project size (Schirmer and Field, 2000). The rehabilitation activities selected for this study are indicative rather than exhaustive and reflect using nature-based solutions where possible to work with a river’s recovery trajectory. Based on the activities required for each level of recovery potential, and using a discount rate of 2.5% pa (ABS, 2023), a per hectare average cost for rehabilitation was calculated. This average cost, based on a representative selection of rehabilitation activities, varied depending on the level of recovery potential, rather than on a bespoke cost developed for each reach, thus enabling comparison between the different recovery potentials across the study area.
Rehabilitation costs were applied to conservation and strategic reaches, to each category of recovery potential (high, moderate and low), and to selected reach and loci connections identified as reaches that can be used to build corridors of recovery (sourced from Agnew and Fryirs (2022)). In that study, reach and loci connections ranged from <1 to >155 km in length, averaging 2.6 km. The primary aim is to compare rehabilitation costs between different recovery potentials and reach and loci connections. For each recovery potential, the estimated and/or actual costs of each activity were collated to determine an average rehabilitation cost. Riparian coverage by recovery potential was calculated and used as an input (Brooks et al., 2017) and cost assumptions based on the literature e.g. Yong et al. (2023). Costings were converted to a per hectare basis to enable comparison with the literature (Table 2).
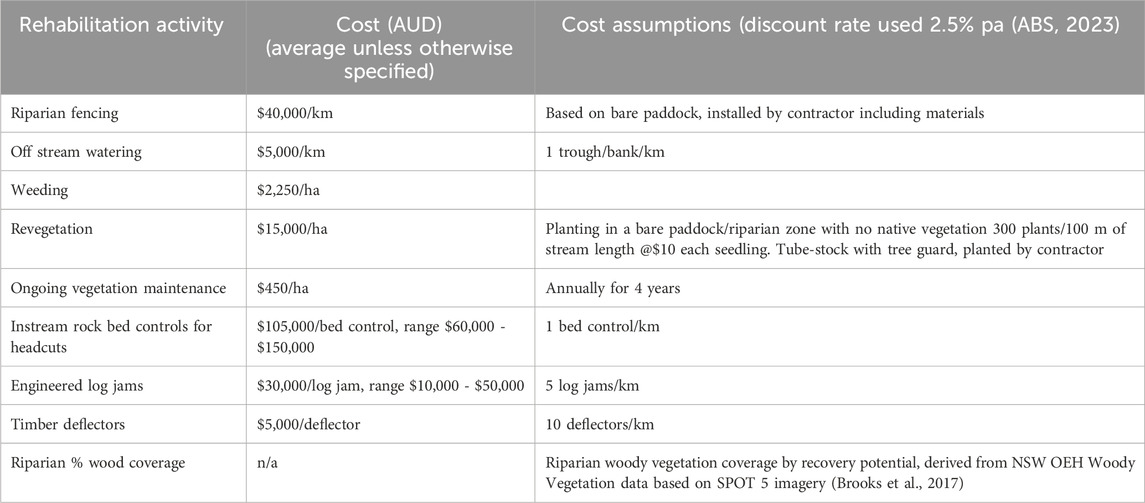
Table 2. Rehabilitation cost assumptions and inputs for cost-benefit analysis.
In this study, Marxan is used in a novel manner to identify optimal locations for rehabilitation and to systematically prioritise rehabilitation of fluvial corridors. Marxan enables users to satisfy user-defined conservation management targets for the minimum cost. Whilst Marxan does not explicitly use cost-benefit or cost-effective analysis in solving target-based problems, Marxan invariably delivers cost-effective options. Marxan’s algorithm provides a “near optimal” solution based on the costs of conservation targets of selected “features” (Morrell et al., 2015). This “near optimal” solution should however be considered within a continuum of good options, one of Marxan’s strengths as a prioritisation tool (Ardron et al., 2010). Marxan is generally used for ecological optimisation, but can also include economic and social characteristics, e.g., the cost-effectiveness of ecosystem services provision (Adame et al., 2015). Numerous prioritisation criteria can be included, e.g. percentage level of species protection and cost of protection (Kark et al., 2009). Costs can be financial or non-financial, e.g., land or cultural values (Adams et al., 2016; Dela-Cruz et al., 2021). By varying the selection criteria, multiple scenarios can be run.
In Marxan, features are usually based on species distribution datasets within a reserve area (Morrell et al., 2015). In this study, we have considered the varying recovery potentials of reaches within a catchment as features. Firstly, we determined the average per hectare rehabilitation cost of each category of recovery potential feature. This rehabilitation cost was then used as the cost parameter to prioritise reaches for rehabilitation within Marxan. Following Marxan best practice guidelines (Ardron et al., 2010), we elected to use the default settings where possible, thus removing an additional layer of decision making for river managers. This potentially makes the analysis more accessible to river managers for uptake and use. Using the default settings did not affect comparison between scenarios, however, river managers can elect to adjust Marxan settings to accommodate their strategic preferences.
Using Marxan, the study area is divided into small geographic parcels of regular or irregular shapes such as hexagons or squares, and/or from hydrological drainage areas (catchments), to create planning units (Reis et al., 2019). In this study, we used hexagons, rather than catchments, as hexagons provide a compact efficient interlocking shape, suitable for incorporating the fixed-width riparian zones for rehabilitation and following streamlines of various configurations. Hexagons were also the preferred planning unit as their scale enables scenario selection at the smaller recovery potential-classified reach scale as well as at corridor scale, compared to catchment or subcatchment scale planning units which are too large and encompass both corridor and non-corridor sections. The planning units were defined from catchments and sub catchments derived using the River Styles recovery potential database (DPIE, 2021a) and an open access digital elevation model (Wilson et al., 2011). This provided planning units covering both streamlines and adjacent riparian zones. Planning units were defined as 10 ha hexagons, equating to an ∼400 m longitudinal section of stream, which is considered an appropriate unit size for river rehabilitation project planning, given an ∼2 km mean reach length across NSW coastal catchments. To reduce processing time, the number of planning units was reduced by removing terrestrial-only components more than 200 m from streamlines. Only planning units within 200 m of streamlines were retained for analysis, fully encompassing the 40 m riparian zone, and allowing longitudinal analysis along entire streamlines. The number of planning units in each catchment depended on each catchment’s stream length, and ranged from 113,853 planning units in the Hunter catchment to 10,860 planning units in the Wollombi sub catchment.
We calibrated the Boundary Length Modifier to locate the optimal efficiency of cost increase versus boundary length reduction (Ardron et al., 2010), based on the 100% conservation protection scenario in Wollombi sub-catchment. Average reserve cost plotted against the average value of total boundary length of all solutions resulted in an optimal boundary length modifier of 0.6, which we then used for all Marxan analysis. Equation of best fit: y = −15.213x + 7E+07; R2 = 0.8885.
Marxan output determines how many, and which specific, planning units should be optimally selected for each scenario. In this study we ran Marxan 100 times for each scenario to provide sufficient repetition, as the solutions generated were a representative sample of the solutions available (Ardron et al., 2010). For each solution, a score is derived for each planning unit, with lower scores preferred to higher scores, where protection targets, e.g. percentage of a recovery potential classification protected, are met with minimum cost. From these 100 possible solutions, Marxan outputs the “best” solution, which has the lowest overall score. Marxan also derives a summed solution, based on selection frequency, to show how often a planning unit is selected for inclusion. Planning units that are more frequently selected under varying scenarios are more likely to meet all management targets and form higher priority for protection (Ardron et al., 2010).
We started by running the ad hoc and reactive, working with recovery and corridors scenarios across the study area (Table 3). For each, we tested scenarios based on current recovery potentials (time slice 1), and future (in 15 years) estimated recovery potentials (time slice 2). For each scenario, we based the percentages of each recovery potential to be protected on expert advice from several practicing agency river managers and the literature, without any budgetary constraints. Input of percentages protected obtained from agency river managers was reasonably aligned with the literature. The selection was focussed on creating an approach to the comparison of scenarios. However, river managers can select their own protection percentages to tailor scenarios to their strategic planning. For time slice 1, we developed seven scenarios based on the current recovery potential classifications to analyse what would be considered best practice i.e. working with recovery in the highest recovery potential reaches and reach and loci connections (scenarios working with recovery #1, #2, and #3, and corridors #1 and #2), versus worst case ad hoc practices working in lower recovery potential reaches (ad hoc and reactive #1 and #2). For time slice 2, we developed two future scenarios based on improved recovery potentials (working with recovery #4) and deteriorating recovery potentials (ad hoc and reactive #3), applying an inflation rate of 2.5% pa (ABS, 2023). We did not develop time slice 2 scenarios based on the corridors approach as that would involve reassessment of all reach and loci connections, a potential future study. We used the Hunter regional catchment to demonstrate the effect of these future scenarios, as this catchment has considerable diversity, and long stream length. For demonstration purposes, as input to the future scenarios, we reclassified current recovery potentials to proposed future recovery potentials following the likely rehabilitation impact of two current scenarios, working with recovery #3 and ad hoc and reactive #2. In addition, we developed a rehabilitation scenario based on working with recovery #2 with a fixed dollar budget (working with recovery #2 with budget) and the Cost Threshold Penalty variable to demonstrate the use of Marxan for optimal rehabilitation project selection. The Cost Threshold Penalty enables the user to assess scenarios in reverse, i.e. find a solution which is the best representation for all features constrained by a maximum cost (Ball and Possingham, 2000).
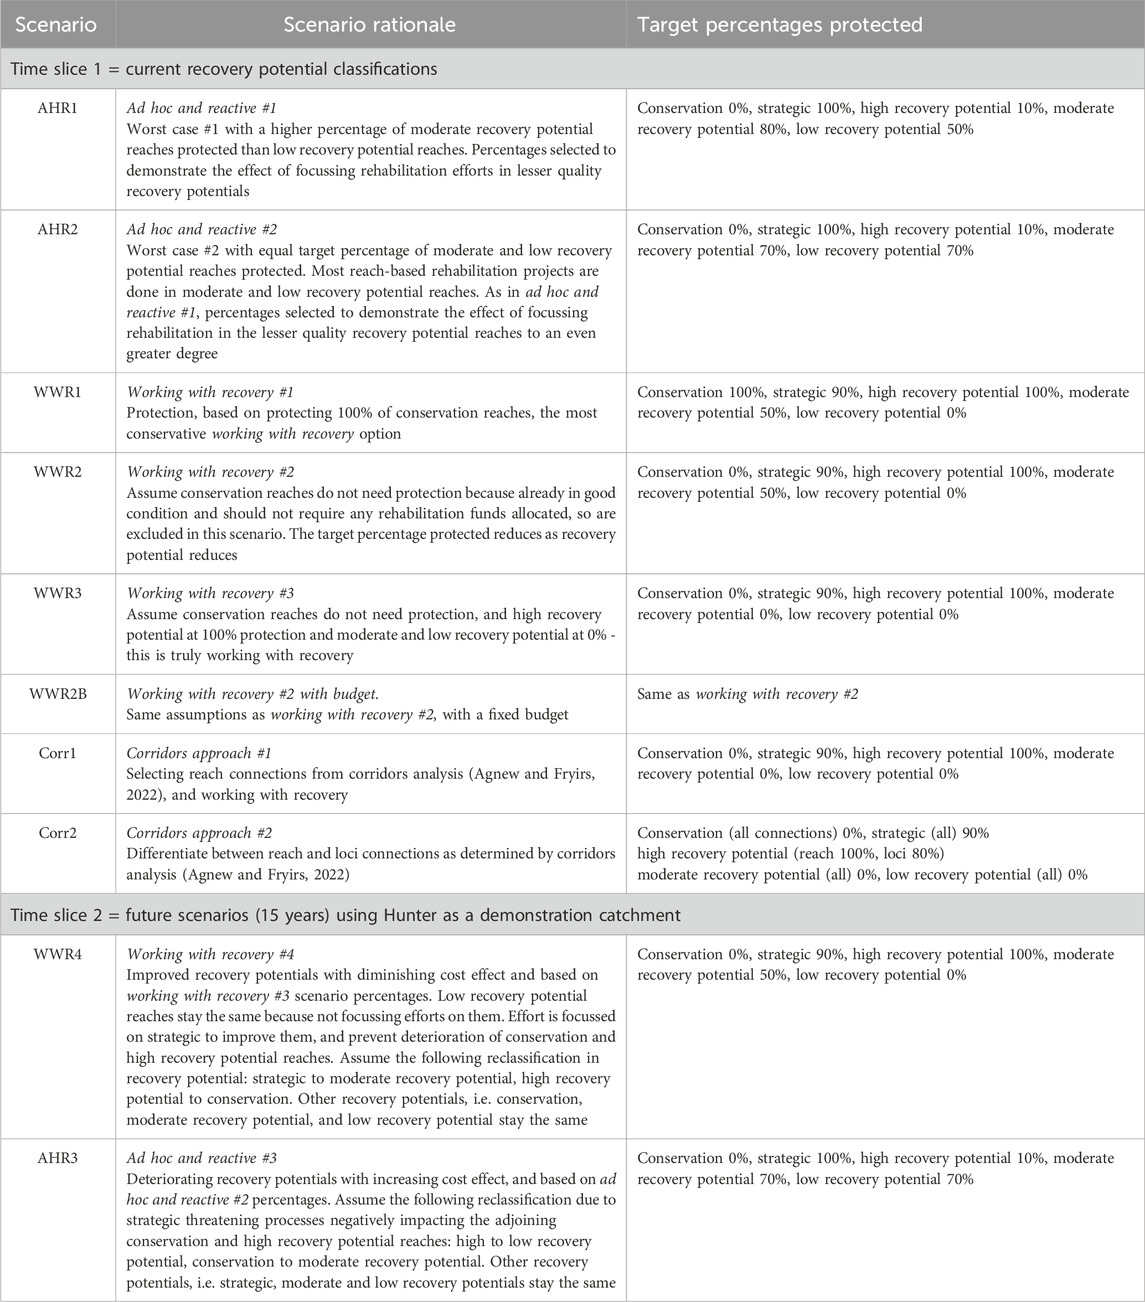
Table 3. Marxan scenarios for reaches by recovery potential, and reach and loci connections, with target percentages of each recovery potential (in ha) protected, based on expert advice of several practicing agency river managers which was reasonably aligned with the literature. Depending on local conditions and their own strategic requirements, river managers can select their own protection percentages, and run different scenarios in Marxan. All scenarios, except working with recovery #2 with budget, are without budgetary constraints. The River Styles database (DPIE, 2021a) also contains a rapid recovery potential classification. For this analysis rapid recovery potential was combined with high recovery potential.
Rehabilitation costs were applied to buffered recovery potentials to obtain total rehabilitation costs for the combined 20 coastal catchments, three representative major catchments and three key subcatchments. Total rehabilitation costs were based on 20 m buffered streamlines and ranged from $11,115/km ($2,779/ha) of stream length for conservation reaches to $326,715/km ($81,679/ha) of stream length for low recovery potential reaches (Supplementary Table S2 in Supplementary Material). Total estimated rehabilitation cost for the 20 coastal catchments is $8.165 billion (Figure 2, Supplementary Table S2 in Supplementary Material). This ranges from the Northern Rivers region with both the longest stream length (25,540 km) and the largest total rehabilitation cost of $2,650 million, to the smallest stream length (702 km) and cost of $62 million in the Sydney Metro catchment. Combined strategic and low recovery potential rehabilitation cost and stream length as a proportion of total rehabilitation cost and stream length across all regions, catchments and sub-catchments ranges from 13%–55% and 3%–29%, respectively (Supplementary Table S2 in Supplementary Material). The Goulburn sub-catchment has the largest proportion (55%) of combined strategic and low recovery potential reach rehabilitation costs, and the highest proportion (29%) of combined strategic and low recovery potential reach length. Within the Hunter region, the Goulburn, Upper Hunter, and Wollombi sub-catchments have similar proportions of combined strategic and low recovery potential rehabilitation costs compared to total rehabilitation costs, 55%, 45% and 52% respectively.
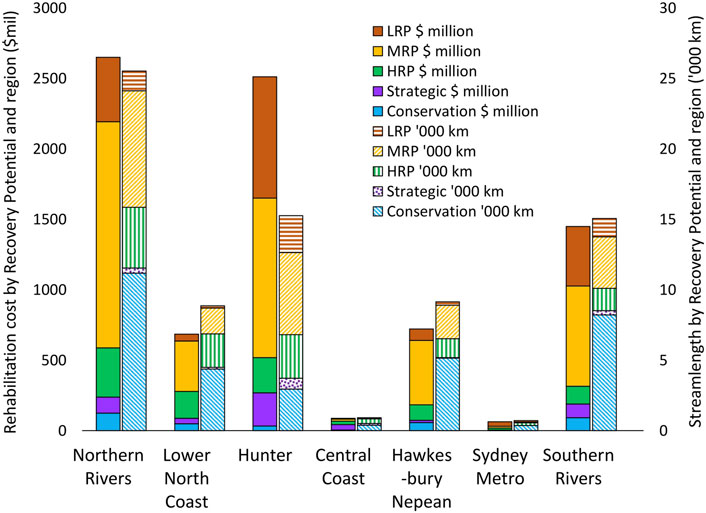
Figure 2. Stream length and total rehabilitation costs ($ million) and stream length (‘000 km) for each recovery potential, by region. HRP = High recovery potential; MRP = Moderate recovery potential; LRP = Low recovery potential.
Rehabilitation costs by buffered recovery potential were applied to selected reach and loci connections to obtain corridor rehabilitation costs for the combined 20 coastal catchments, three representative major catchments, and three key sub catchments in the Hunter region. Total estimated rehabilitation cost for the selected reach and loci connections of the 20 coastal catchments was $940 million and $592 million, respectively (Figure 3, Supplementary Table S3 in Supplementary Material). There was minor overlap between the totals for reach and loci connections, as a reach may form part of both a reach connection and a loci connection. Total reach connection rehabilitation costs represented less than 12% of the $8.165 billion total recovery potential rehabilitation cost across the study area, despite a ‘skewing’ to strategic reach connections. Correspondingly, total loci connection rehabilitation costs represented 7% of total recovery potential rehabilitation costs. Generally, reach connection rehabilitation cost as a percentage of total regional recovery potential cost was less than 13%, except for Sydney Metro and Central Coast, 26% and 92% respectively. Generally, loci connection rehabilitation cost as a percentage of total regional recovery potential cost was less than 10%, except for Central Coast at 35%.
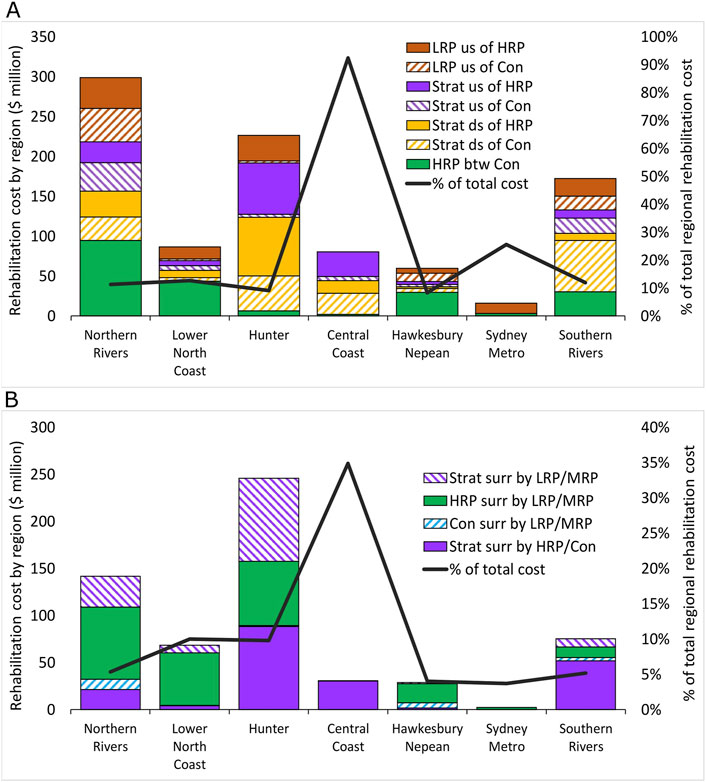
Figure 3. Rehabilitation costs ($ million) and as % of total regional recovery potential rehabilitation cost, for selected (A) reach and (B) loci connections, by region. Con = Conservation; Strat = Strategic; HRP = High recovery potential; MRP = Moderate recovery potential; LRP = Low recovery potential; ds of = downstream of; us of = upstream of; surr by = surrounded by.
The seven Marxan scenario best solution (lowest objective function) results were based on protecting varying percentages of the different buffered recovery potentials and reach and loci connections within a system. Total rehabilitation costs for all scenarios ranged from $12 million (corridors #1 in Upper Hunter) to $1,633 million (ad hoc and reactive #2 in Hunter) (Figures 4A, 5, and Supplementary Table S4 in Supplementary Material). Generally, total costs were lowest for working with recovery #3, corridors #1 and corridors #2, and highest for ad hoc and reactive #1 and ad hoc and reactive #2. Total costs for Hunter catchment scenarios were higher than all other catchments, due to its longer total stream length. The total hectares of buffered recovery potentials and reach and/or loci connections available for selection impacted each scenario outcome. Total rehabilitation cost and total area protected for corridors #1 and corridors #2 was lower compared to working with recovery and ad hoc and reactive scenarios, as corridors #1 and corridors #2 drew from only the corridor connections, and not total stream length, in each catchment (Figures 4A, 5, and Supplementary Table S4 in Supplementary Material).
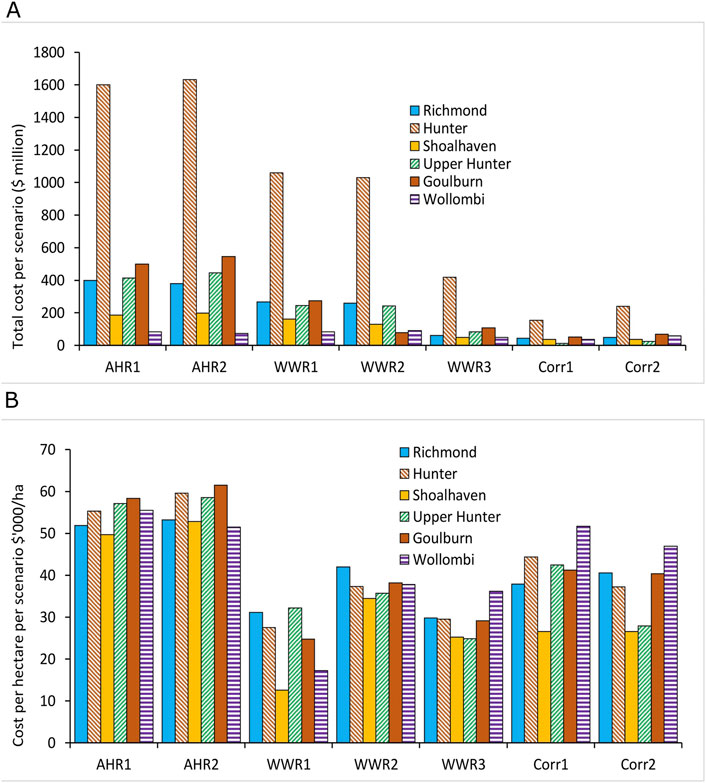
Figure 4. Comparison of (A) total ($ million) and (B) per hectare ($‘000/ha) rehabilitation cost for major catchments and key subcatchments for each of the seven current scenarios (time slice 1). AHR = ad hoc and reactive; WWR = working with recovery; Corr = corridors.
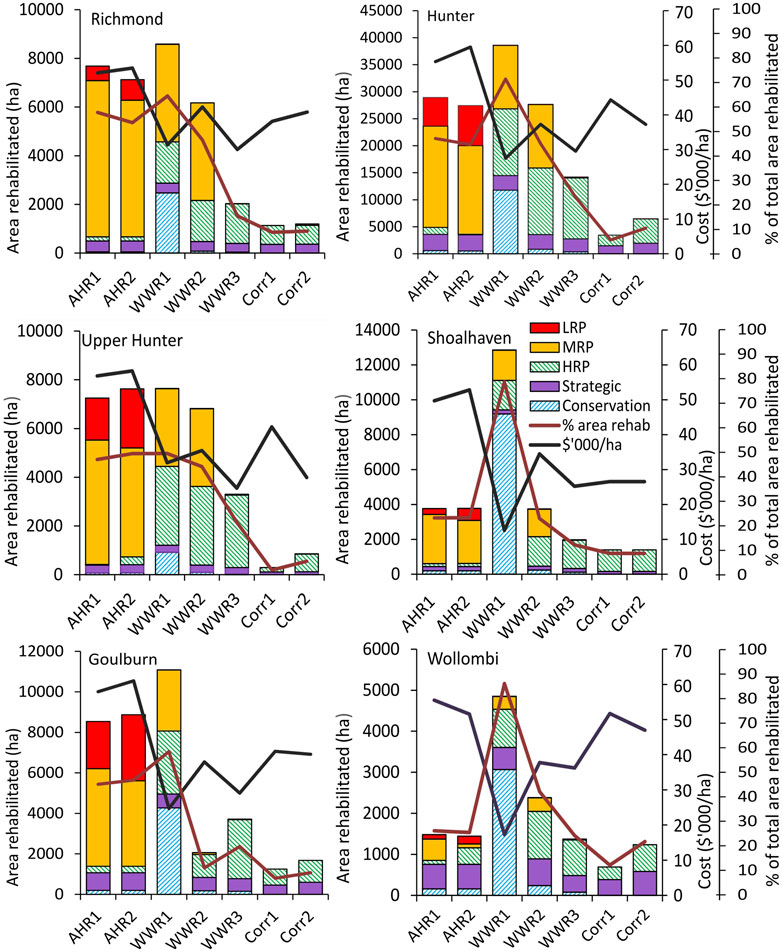
Figure 5. Major catchments and key subcatchments showing total area rehabilitated (ha), % of total area rehabilitated (%), and cost per hectare ($‘000/ha) for each of the seven current scenarios (time slice 1). AHR = ad hoc and reactive, WWR = working with recovery, Corr = corridors. HRP = High recovery potential, MRP = Moderate recovery potential, LRP = Low recovery potential.
Rehabilitation cost per hectare followed a similar trend, ranging from $12,552/ha (working with recovery #1 in Shoalhaven) to $61,506/ha (ad hoc and reactive #2 in Goulburn) (Figures 4B, Figure 5, and Supplementary Table S4 in Supplementary Material). Generally, working with recovery #1 scenario generated the lowest per hectare cost followed by working with recovery #3, corridors #1 and corridors #2 scenarios. For all catchments, ad hoc and reactive #2 scenario generated the highest per hectare cost. For all catchments, per hectare costs of working with recovery #2 and working with recovery #3 scenarios were similar to corridors #1 and corridors #2 scenarios, but with a lower total area protected. If working with recovery or corridors scenarios are implemented, the cost per hectare will be lower than if ad hoc and reactive scenarios are implemented, providing a financial benefit (Figures 4B, 5, and Supplementary Table S4 in Supplementary Material).
Protection targets (percentage protected) of all recovery potentials and reach and loci connections met a threshold of approximately 90% of each scenario’s parameters. The number of planning units selected was similar between the best solutions for each recovery potential scenario in each catchment. The spatial distribution of selected planning units among the seven scenarios was similar, and only varied according to the scenario parameters. Generally, planning units selected under the optimal solution for each scenario were scattered throughout the study area with clear spatial pattern and clumping. The Marxan results can be visualised as follows, using the corridors #2 scenario for Upper Hunter catchment as an example, and Pages River in detail (Figure 6).
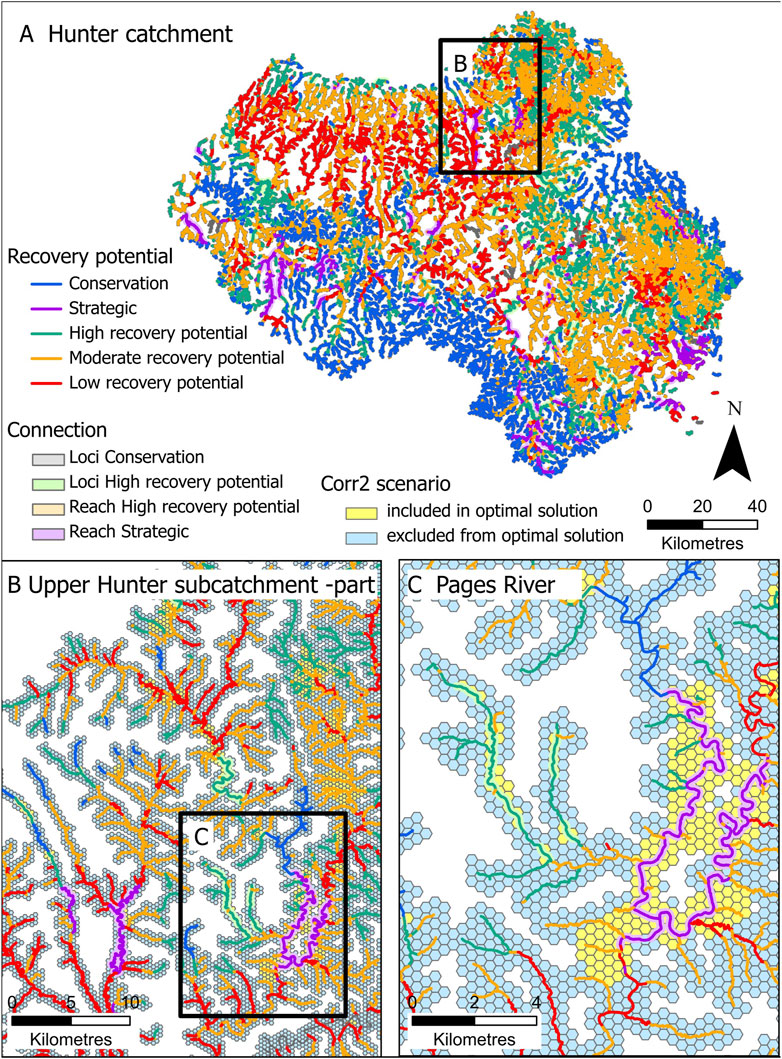
Figure 6. Marxan corridors #2 scenario for the Hunter regional catchment, showing (A) whole catchment (B) portion of Upper Hunter subcatchment including Pages River, and (C) Pages River detail. The optimal solution is shown by coloured hexagons (yellow = planning units included in the optimal solution, blue = planning units excluded from the optimal solution). Reach and loci connections selected in the optimal solution (yellow hexagon planning units) are considerably clumped, providing a corridor suitable for rehabilitation. Streamlines are classified by recovery potential. Yellow hexagon planning units wholly outside of the 40 m ripiarian zone are an artefact of the spatial resolution, have no value, and do not affect the scenario result. Corr = corridors.
The best solution for each scenario for a catchment or sub-catchment yielded a range of optimal planning unit combinations. This can clearly be seen in the example in Figure 7, a detailed portion of Goulburn River sub-catchment, showing Kerrabee Creek and Widden Brook. Yellow hexagons represent the planning units included in the optimal solutions under each scenario, whilst blue hexagons represent planning units omitted from the optimal solution. There is good clumping of included planning units in all scenarios. Across scenarios, there is spatial variability in included planning units, however this will be influenced by the different scenarios, which completely excluded specific recovery potentials and reach and/or loci connections. However, in ad hoc and reactive #1 and ad hoc and reactive #2 scenarios, where the percentage proportion of moderate and low recovery potential reaches included in the solution only varied from 50% to 80%, spatial variability between the two scenarios was similar. For corridors #1 and corridors #2, the scenarios using reach and/or loci connections, there are fewer planning units for potential inclusion, reflected in the more sparsely distributed optimal solutions.
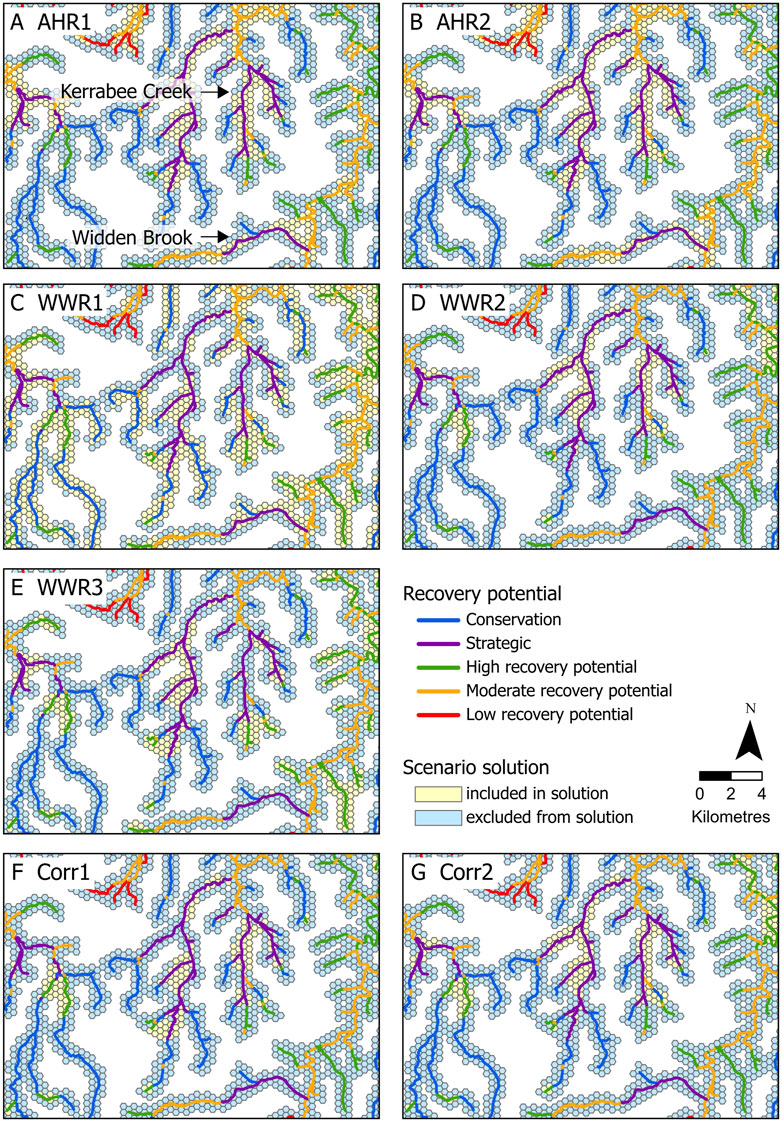
Figure 7. The best solution output for Goulburn subcatchment scenarios (A–G), detailing Kerrabee Creek and Widden Brook to demonstrate comparison between the seven scenarios. AHR = ad hoc and reactive; WWR = working with recovery; Corr = corridors.
Using Marxan, we applied a fixed budget scenario (working with recovery #2 with budget) of $300,000 to two subcatchment scale projects to demonstrate the difference in rehabilitation outcomes. The two project areas each comprised approximately 15 km of stream length, one optimal with 85% high recovery potential reaches, and one sub-optimal with 67% moderate and 18% high recovery potential reaches. The optimal project had 46% more riparian zone area selected for rehabilitation (Figure 8).
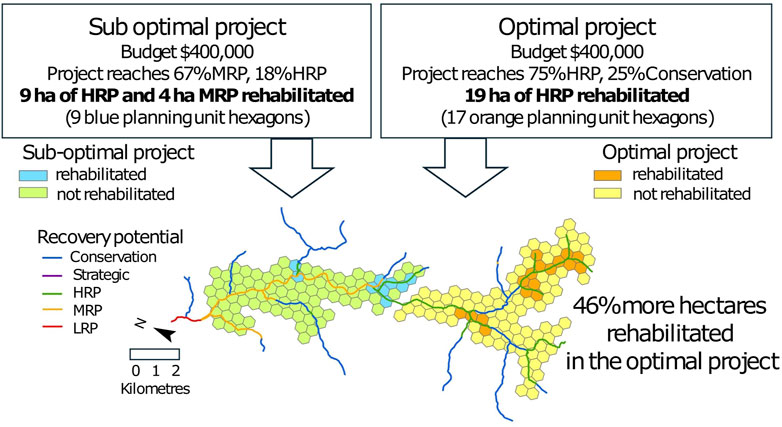
Figure 8. Comparison of two subcatchment-scale fixed budget rehabilitation projects, optimal and suboptimal, showing riparian zone (contained within the selected planning unit hexagons) for rehabilitation. HRP = high recovery potential, MRP = moderate recovery potential.
In time slice 2, over a 15 year period, based on the Hunter catchment for demonstration purposes, total rehabilitation cost for working with recovery #4 (time slice 2) was $543 million, approximately 50% of working with recovery #1 and #2 time slice 1 scenarios, and approximately 25% higher than working with recovery #3 (Figure 9 and Table 4). Alternatively, following the ad hoc and reactive approach, total rehabilitation cost for ad hoc and reactive #3 (time slice 2) was $3.433 billion, higher than all other working with recovery, ad hoc and reactive and corridors time slice 1 scenarios. The per hectare cost for working with recovery #4 was $50,394, higher than time slice 1 working with recovery scenarios, due to the lack of lower cost high recovery potential reaches in the time slice 2 scenario, which drove the per hectare cost down. Overall, 18% of reaches were identified for rehabilitation in working with recovery #4, lower than time slice 1 working with recovery scenarios, again due to a lack of high recovery potential reaches requiring rehabilitation. Conversely, the percentage of reaches identified for rehabilitation in ad hoc and reactive #3 was 72%, higher than ad hoc and reactive time slice 1 reaches, as more strategic and moderate recovery potential reaches required rehabilitation. Figure 9 and Table 4 show the impact of changing rehabilitation approach, and evolution over time.

Figure 9. Optimal Marxan current and future scenarios for Hunter region showing impact of changing rehabilitation approach, and evolution over time. Current = time slice 1 (hatched bars), future = time slice 2 (solid bars), total area rehabilitated (ha), % of total Hunter regional streams rehabilitated, total rehabilitation cost ($ million), and rehabilitation cost per hectare ($‘000/ha). AHR = ad hoc and reactive; WWR = working with recovery; Corr = corridors; HRP = High recovery potential; MRP = Moderate recovery potential; LRP = Low recovery potential.
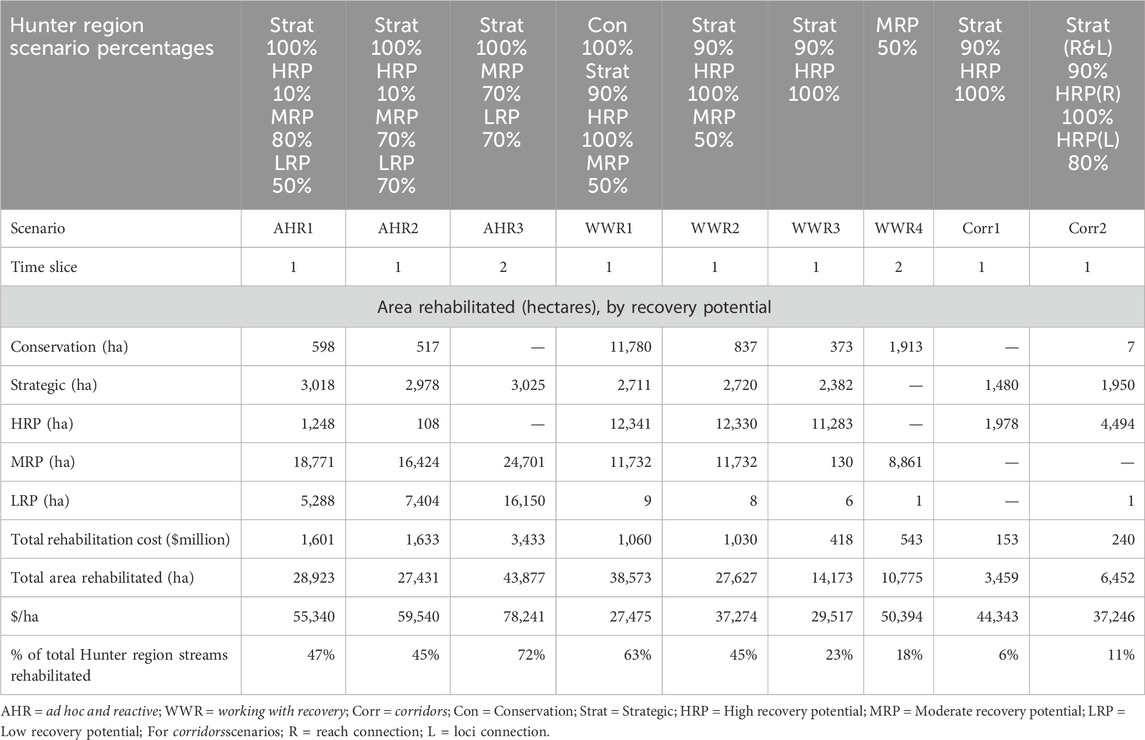
Table 4. Optimal Marxan current (time slice 1) and future (time slice 2) scenario results for Hunter region. Time slice 2 adjusted for inflation of 2.5% pa over average 15 years (ABS, 2023).
In this study, the financial cost to rehabilitate 75,461 km of stream length across NSW coastal catchments is $8.165 billion. This represents <0.5% of Australia’s GDP of $1.688 trillion (ABS, 2023). The rehabilitation cost compares favourably to the estimated insurance losses of ∼$6.41 billion from eastern Australia’s 2021-2022 floods (Insurance Council of Australia, 2022; O’Kane and Fuller, 2022) that were amongst the costliest natural disasters in Australia’s recorded history. With targeted rehabilitation restricted to selected fluvial reach and loci corridor connections, the estimated rehabilitation cost reduces to $940 million and $592 million, respectively. Whilst at the state level the estimated $8.165 billion is a considerable total cost, this cost can be distributed, over decades, by region, major catchment or subcatchments and associated river management authorities (Figure 10).
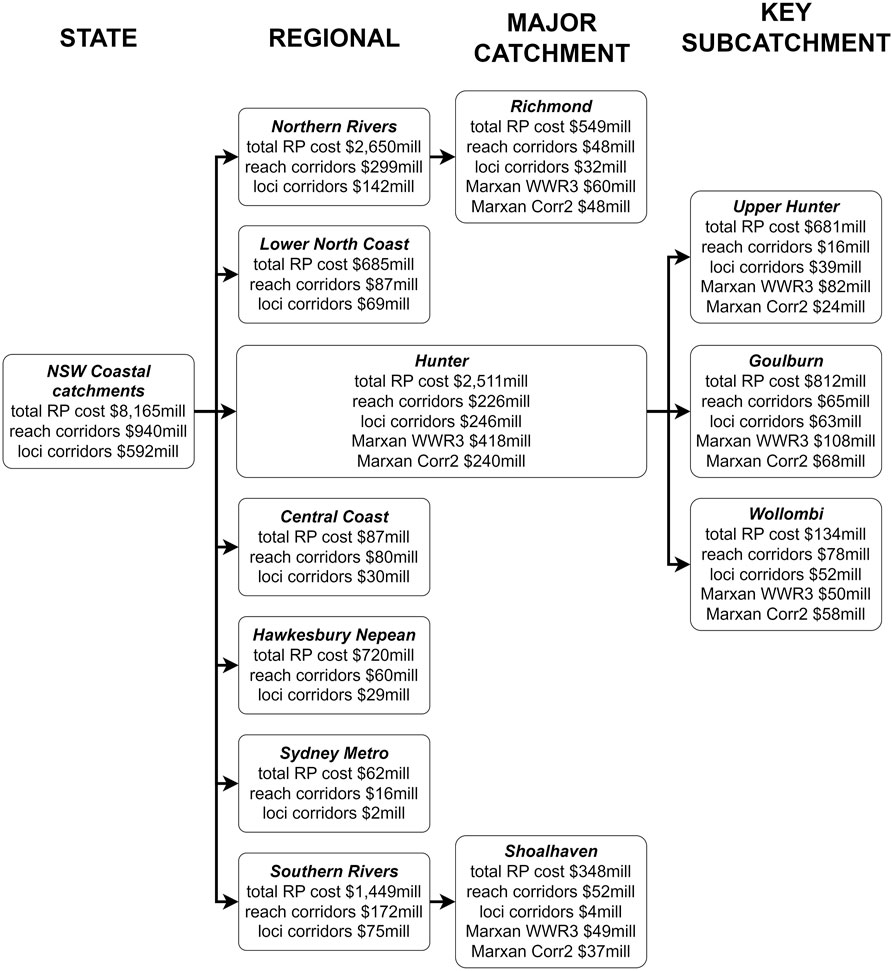
Figure 10. Cost-benefit analysis showing scalar context of rehabilitation costs from state level to key sub-catchments. RP = recovery potential; AHR = ad hoc and reactive; WWR = working with recovery; Corr = corridors.
The contrast between disaster relief expenditure and disaster resilience expenditure in Australia is stark. Federal Government expenditure on disaster resilience ($0.51 billion) over the period 2005 to 2022 represented only 2.12% of expenditure on disaster relief ($23.99 billion) (Insurance Council of Australia, 2022; Lefebvre and Reinhard, 2022). There are calls for government to focus more on resilience and future-proofing against natural disasters (Fryirs et al., 2023). The CSIRO has forecast the annual economic cost of natural disasters in Australia will reach $35.2 billion by 2050, or three times 2017 costs, if there is no substantial investment in mitigation (Naughtin et al., 2022). The Federal Government committed $1.1 billion across 6 years (2019-2023) for environmental protection and a further $1.1 billion commitment for 2023-2028 through the Natural Heritage Trust (DCCEEW, 2024). This contrasts with the estimated $2 billion annual expenditure (0.1% of GDP) required to support restoration of just terrestrial ecosystems Mappin et al. (2021). Furthermore, Federal Government commitments for all environmental protection (water, soil, flora and fauna) is a small percentage of estimated annual disaster relief spending to 2050 (Deloitte Access Economics, 2021; Lefebvre and Reinhard, 2022). In this context, river rehabilitation is an investment in the future recovery of rivers to improve resilience and mitigate the costs of future natural disasters and anthropogenic impacts on the environment and society (O’Kane and Fuller, 2022).
For stakeholders, a successful rehabilitation project can have multiple combined benefits both economic and environmental, including carbon sequestration and enhanced biodiversity (Smith et al., 2016; Worley et al., 2023), and financial and non-financial. Both financial and non-financial costs and benefits can be applied to river rehabilitation cost-benefit analysis. Our analysis is based on readily quantifiable financial costs, and based on the comparison between the different scenarios, in both time slices 1 and 2. From this analysis, it is evident that there is considerably greater financial incentive from reduced costs in adopting working with recovery or corridors scenarios compared to ad hoc and reactive scenarios. Alternatively, if rehabilitating using the ad hoc and reactive model, then rehabilitation costs will outweigh the financial and non-financial benefits over time. Reaches with a higher recovery potential generally are in better condition and provide better ecosystem services. Using working with recovery and corridors approaches will substantially improve recovery potential across systems and provide enhanced ecosystem services and thus higher environmental benefits (Chessman et al., 2006; Wohl et al., 2015; Brierley and Fryirs, 2022). Therefore, working with recovery can be considered a surrogate for the improved ‘environmental benefits’ in cost-benefit analysis. If using a working with recovery approach to improve riparian zones, there are mutual economic and environmental benefits for property owners (Cary et al., 2002; NRMSouth, 2015; NSW Government, 2021).
In our analysis, quantification of the reduction in financial costs is twofold:
1) Current lower rehabilitation costs involved in implementing working with recovery/corridors versus ad hoc and reactive scenarios, based on time slice 1 that represents the present day situation (DPIE, 2021a).
2) Future reduction in financial costs accrued from the diminishing effect of working with recovery and corridors scenarios in the present day which then leads to improved recovery potential in the future. Future rehabilitation (time slice 2) would be carried out on reaches that have improved their condition and therefore recovery potential, with a corresponding lower cost for the reaches that have been reclassified with improved recovery potential. The reduced future total project rehabilitation cost can be implied as a quantifiable future increased financial benefit. This diminisher effect is a flow-on effect that is built into time slice 2.
The cost of rehabilitating streams can be considered an investment with both accompanying long-term flow-on financial and non-financial benefits. This is the additional multiplier effect which can be applied in the cost-benefit analysis. For example, for agricultural landowners, treating the riparian zone as an asset where non-financial ecological improvements occur can lead to flow-on financial benefits including carbon credit scheme income (DCCEEW, 2023), reduced pesticide use due to increased natural pest control from biodiverse-rich riparian zones adjacent to agricultural land (Cole et al., 2012; Cole et al., 2020; Giraldo et al., 2022), and increased livestock valuations (Dobes et al., 2021). Working with recovery can also have flow-on non-financial benefits such as the improvement in ecosystem services provision from vegetated riparian zones (Maes et al., 2020; Riis et al., 2020; Garcia et al., 2021; European Commission, 2022a). Quantification of these benefits could be included in future research. In this study, reach and loci connections which overlapped were excluded from the analysis. There may be multiplicative effect on benefits from the rehabilitation of these connections, which could form part of a future study.
For the river management sector, cost-benefit analysis can be used to inform or improve decision support tools in river management and quantify both financial and non-financial benefits. For example, cost-benefit analysis results can be used in decision support tools to prioritise the projects that will have best environmental return on investment (Schultze et al., 2019). Multi-objective planning can also be undertaken to identify complementary benefits and trade-offs in economic and environmental values (Álvarez-Romero et al., 2021).
The use of Marxan and the tailoring of it so it is fit-for-purpose for cost-benefit analysis of fluvial and riparian systems means that river managers anywhere can run Marxan as a cost-benefit analysis tool in their catchments (Ball et al., 2009; Langhans et al., 2014; Adams et al., 2016; DPIE, 2020; Dela-Cruz et al., 2021). Whilst the focus in this study is on the reduction of costs, additional ecological information, e.g. habitat protection or riparian biodiversity measures, can also be incorporated into the Marxan analysis to identify environmental benefits, and further refine river rehabilitation strategies, depending on river management priorities. For coastal catchments of NSW, Marxan is now ready to be used to prioritise future rehabilitation projects. No programming skills are required, making this decision-making approach accessible to a wide variety of stakeholders. We have now demonstrated the cost-benefit of transitioning management practice fully towards working with recovery and corridors approaches and moving away from ad hoc and reactive approaches (Beechie et al., 2010; Hawley, 2018; Wheaton et al., 2019; Fryirs and Brierley, 2021). We demonstrate that the protection of better-quality (high recovery potential) reaches, along with treating strategic reaches, results in lower initial total and per hectare rehabilitation costs (Fryirs and Brierley, 2016). Importantly, a dual benefit is achieved, i.e. more sustainable rehabilitation coupled with lower investment cost (Hermoso et al., 2015). This approach is not a drive to actively select the lowest cost approach, but rather a benefit that derives from selecting the most sustainable approach to river management (Fryirs and Brierley, 2021). The intent of the Marxan analysis is to demonstrate the conceptual use of Marxan and the relative solutions produced. This approach can be modified by others, whereby scenarios with different recovery potential protection percentages or inclusion of ecological datasets are developed. Rather than determining actual costs of rehabilitation using different scenarios, the take away message is that working with recovery is more cost effective than the ad hoc and reactive approach. We have demonstrated that flow on multiplier benefits, both financial and non-financial, occur over time slices 1 and 2 with the adoption of working with recovery rather than ad hoc and reactive approaches to river management (Figure 11).
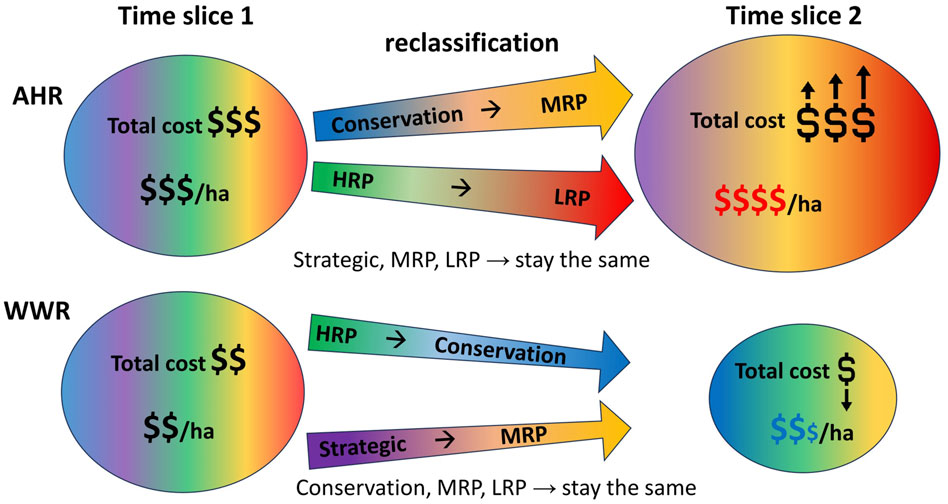
Figure 11. Conceptual comparison of average rehabilitation cost differences over time between working with recovery (WWR) and ad hoc and reactive (AHR) models of river management. HRP = high recovery potential; MRP = moderate recovery potential; LRP = low recovery potential.
The timeframe over which river recovery will occur will be specific to the conditions in each system, i.e. the extent and severity of pressures and limiting factors that need to be addressed (Fryirs and Brierley, 2016; Fryirs et al., 2018). Improvements can occur quickly (years) (Schulz-Zunkel et al., 2022), or take much longer (decades) (Higgisson et al., 2019; Cohen et al., 2022; Kauffman et al., 2022), depending on whether biotic (ecosystem respiration, species diversity) and/or abiotic (geomorphic units, flow velocity) conditions require treatment. In some places, actively working with recovery can accelerate further improvement and creation of positive feedbacks in the system. Therefore, the sooner that working with recovery and corridors approaches to river management are adopted, the sooner that benefits will begin to accrue.
The benefits that accrue from transitioning to working with recovery now (time slice 1) will become apparent over time as rehabilitation outcomes become more sustainable and potentially trigger improvements in recovery potential elsewhere in the system, creating positive feedback for improvement. This is demonstrated in Figure 11 whereby if river managers focus rehabilitation efforts on high recovery potential and strategic reaches, and the rehabilitation is successful, the trajectory of improvement may be sufficient to reclassify strategic reaches as moderate recovery potentials, and high recovery potentials as conservation. In this analysis, time slice 2 total rehabilitation costs are lower as they are based on reclassified reaches. There is only a small increase in per hectare costs due to the higher portion of moderate recovery potential versus high recovery potential reaches included in the time slice 2 Marxan scenario. Alternatively, if river managers continue to use an ad hoc and reactive approach, the reverse is likely (Figure 11). In this case, most rehabilitation work is done in poorer quality moderate and low recovery potential reaches, that have a higher failure risk. Current total and per hectare rehabilitation costs are high, and overall rehabilitation outcomes are unlikely to be sustainable. If moderate and low recovery potential reaches impact any adjoining high recovery potential and conservation reaches it is likely that these reaches will deteriorate in condition and be reclassified as poorer recovery potential reaches. Future rehabilitation costs will increase.
In addition to the types of analyses undertaken in this study, other cost-benefit analyses that can now be undertaken include; back-running scenarios to prioritise rehabilitation based on a fixed budget, running other sorts of corridor scenarios (e.g. working in poorer quality reaches (moderate and low recovery potential) that may occur between/upstream/downstream of high recovery potential and conservation reaches), or building in other variables and weighting them (e.g. weighting reaches where community groups are already in place and there is a willingness to participate) (Ball et al., 2009; Linke et al., 2019). Other environmental (e.g. ecological, water quality) datasets can also be incorporated as additional non-financial features into Marxan analysis for further prioritisation (Ball et al., 2009; Dela-Cruz et al., 2021; Hermoso et al., 2021). For example, Marxan can be run using a fixed budget (working with recovery #2 with budget) to assess and select optimal project sites (Figure 8). Under this scenario, the optimal project would be able to rehabilitate 19 ha of riparian zone, 46% more than at the adjoining suboptimal project site. Working with recovery will be a collaborative exercise with multiple landowners, especially where adjoining landowners are situated on reaches with different recovery potentials. At smaller scales, under 10 km stream length, Marxan is less effective in identifying optimal sites, as not all recovery potentials will be sufficiently represented, if at all. However, at larger scales, Marxan identifies sites where most cost-effective rehabilitation can be undertaken. This provides a method to assess cross-scalar rehabilitation opportunities, upscaling with a higher budget to subcatchment and catchment scale (Figure 10).
In this study, the future time slice was not run using the corridors model. However similar benefits to the working with recovery approach would accrue and a positive reclassification of recovery potentials should result. Importantly, the corridors approach extends connections to adjacent and surrounding good quality reaches, thus creating longer fluvial corridors, and moving towards landscape scale rehabilitation (Sholtes and Doyle, 2011). Working at fluvial corridor scale, rather than at reach scale, is critical. For example, the influence of increased floodplain roughness on flood wave attenuation has been determined as a significant factor over stream lengths of 20–50 km (Anderson et al., 2006; Ghavasieh et al., 2006) and increased biodiversity and ecosystem connectivity benefits are also needed at much larger scales (Kool et al., 2013; Linke et al., 2019; Renwick et al., 2020). Marxan can be used to run and cost corridor-scale rehabilitation scenarios over time, and as recovery occurs and corridors are built. As a multiplier effect, this builds on the important effects of off-site positive feedback in river systems.
Naturally, when working with recovery, local on-ground expert decisions by river managers are required to assess, prioritise, and cost for rehabilitation, individual reaches and connections, according to the specific characteristics. In this study Marxan’s default settings were used enabling straightforward comparison between scenarios. Planning units were restricted to those within 200 m of streamlines. River managers may elect to tailor Marxan settings to their own strategic goals and consider expanding the spatial extent of planning units where rehabilitation strategies consider land cover and land use changes. Indeed, systemic planning using a conservation planning tool such as Marxan, combined with on-ground expert judgement, can provide the best possible outcomes and enhance the overall efficacy of rehabilitation strategies (Langhans et al., 2016).
The total cost of fluvial rehabilitation of NSW coastal catchments is insignificant compared to the annual and increasing costs of insurance losses. Nature-based solutions such as river rehabilitation which enhance river recovery are a remedy for mitigating the effects of climate change-related floods and extreme weather. It is a cost-effective approach to proactive river management. If river managers work with recovery and at corridor scale, we have demonstrated that the benefits of undertaking rehabilitation go well beyond financial. Ecosystem benefits accrue from this approach, and lower costs are incurred both now and into the future through the multiplier effect. Here we have successfully demonstrated the application of cost-benefit analysis for coastal NSW catchments using a robust approach with Marxan, an accessible optimisation/prioritisation tool. No programming skills are required, making this decision-making approach accessible to a wide variety of stakeholders. This enables river managers and other stakeholders to address the complexities of strategic river rehabilitation planning prioritisation using a transparent, geomorphologically-informed approach at the landscape scale rather than opportunistically at the reach scale.
The raw data supporting the conclusions of this article will be made available by the authors, without undue reservation.
DA: Writing–original draft, Writing–review and editing, Formal Analysis, Investigation, Methodology, Visualization. KF: Conceptualization, Funding acquisition, Supervision, Writing–review and editing, Methodology. ML: Writing–review and editing, Supervision.
The authors declare that financial support was received for the research, authorship, and/or publication of this article. This research was funded by an ARC Linkage Grant (LP190100314) led by KF with industry partners Landcare Australia and Hunter Local Land Services. DA is supported by a Macquarie University Research Excellence Scholarship (MQRES). The funders had no role in study design, data collection and analysis, decision to publish, or preparation of the manuscript.
We thank Vera Horigue for her assistance with Marxan software. We thank Jenny Weingott, Rob Porter, and Andrew Morris for their assistance with rehabilitation costings. We acknowledge the Traditional Custodians of the land and rivers where we work and upon which this paper reports.
The authors declare that the research was conducted in the absence of any commercial or financial relationships that could be construed as a potential conflict of interest.
All claims expressed in this article are solely those of the authors and do not necessarily represent those of their affiliated organizations, or those of the publisher, the editors and the reviewers. Any product that may be evaluated in this article, or claim that may be made by its manufacturer, is not guaranteed or endorsed by the publisher.
The Supplementary Material for this article can be found online at: https://www.frontiersin.org/articles/10.3389/fenvs.2024.1425668/full#supplementary-material
Con, Conservation; Strat, Strategic; HRP, High recovery potential; MRP, Moderate recovery potential; LRP, Low recovery potential; RRP, Rapid recovery potential; Corr, Corridors approach; WWR, Working with recovery approach; AHR, Ad hoc and reactive approach.
ABS (2023). Australian national accounts: national income, expenditure and product. Australian Bureau of Statistics. Canberra, ACT: Australian Government. Available at: https://www.abs.gov.au/statistics/economy/national-accounts/australian-national-accounts-national-income-expenditure-and-product/latest-release (Accessed December 5, 2023).
Adame, M. F., Hermoso, V., Perhans, K., Lovelock, C. E., and Herrera-Silveira, J. A. (2015). Selecting cost-effective areas for restoration of ecosystem services. Conserv. Biol. 29 (2), 493–502. doi:10.1111/cobi.12391
Adams, V. M., Pressey, R. L., and Álvarez-Romero, J. G. (2016). Using optimal land-use scenarios to assess trade-offs between conservation, development, and social values. PLOS ONE 11 (6), e0158350. doi:10.1371/journal.pone.0158350
Agnew, D., and Fryirs, K. (2022). Identifying corridors of river recovery in coastal NSW Australia, for use in river management decision support and prioritisation systems. PLOS ONE 17 (6), e0270285. doi:10.1371/journal.pone.0270285
Agnew, D., Graves, B. P., and Fryirs, K. (2022). A GIS workflow for the identification of corridors of geomorphic river recovery across landscapes. PLOS ONE 17 (12), e0278831. doi:10.1371/journal.pone.0278831
Albert, C., Brillinger, M., Guerrero, P., Gottwald, S., Henze, J., Schmidt, S., et al. (2021). Planning nature-based solutions: principles, steps, and insights. Ambio 50 (8), 1446–1461. doi:10.1007/s13280-020-01365-1
Álvarez-Romero, J. G., Kiatkoski Kim, M., Pannell, D., Douglas, M. M., Wallace, K., Hill, R., et al. (2021). Multi-objective planning in northern Australia: co-benefits and trade-offs between environmental, economic, and cultural outcomes,” in Final report to the Australian department of agriculture, water and the environment. Townsville, Qld: James Cook University.
Álvarez-Romero, J. G., Pressey, R. L., Ban, N. C., and Brodie, J. (2016). Advancing land-sea conservation planning: integrating modelling of catchments, land-use change, and river plumes to prioritise catchment management and protection. PLOS ONE 10 (12), e0145574. doi:10.1371/journal.pone.0145574
Anderson, B. G., Rutherfurd, I. D., and Western, A. W. (2006). An analysis of the influence of riparian vegetation on the propagation of flood waves. Environ. Model. and Softw. 21 (9), 1290–1296. doi:10.1016/j.envsoft.2005.04.027
Anderson, E. P., Jackson, S., Tharme, R. E., Douglas, M., Flotemersch, J. E., Zwarteveen, M., et al. (2019). Understanding rivers and their social relations: a critical step to advance environmental water management. WIREs Water 6 (6), e1381. doi:10.1002/wat2.1381
Anderson, M. G., Comer, P. J., Beier, P., Lawler, J. J., Schloss, C. A., Buttrick, S., et al. (2015). Case studies of conservation plans that incorporate geodiversity. Conserv. Biol. 29 (3), 680–691. doi:10.1111/cobi.12503
AON (2021). Weather, climate and catastrophe insight: 2020 annual report. Weather, Clim. and Catastrophe Insight. Chic. Ill
Ardron, J., Possingham, H., and Klein, C. (2010). Marxan good practices handbook. Pac. Mar. Analysis Res. Assoc.
Atkinson, G., Braathen, N. A., Groom, B., and Mourato, S. (2018). Cost benefit analysis and the environment: further developments and policy use. Paris, France: Organization for Economic Co-operation and Development.
Ball, I. R., and Possingham, H. P. (2000). Marxan marine reserve design using spatially explicit annealing A manual prepared for the great barrier reef marine park authority. Brisbane: University of Queensland.
Ball, I. R., Possingham, H. P., and Watts, M. (2009). “Marxan and relatives: software for spatial conservation prioritisation,” in Spatial conservation prioritisation: quantitative methods and computational tools. Editors A. Moilanen, K. A. Wilson, and H. Possingham (Oxford: Oxford University Press), 185–196.
Basak, S. M., Hossain, M. S., Tusznio, J., and Grodzińska-Jurczak, M. (2021). Social benefits of river restoration from ecosystem services perspective: a systematic review. Environ. Sci. and Policy 124, 90–100. doi:10.1016/j.envsci.2021.06.005
Beechie, T. J., Sear, D. A., Olden, J. D., Pess, G. R., Buffington, J. M., Moir, H., et al. (2010). Process-based principles for restoring river ecosystems. BioScience 60 (3), 209–222. doi:10.1525/bio.2010.60.3.7
Bergstrom, J. C., and Loomis, J. B. (2017). Economic valuation of river restoration: an analysis of the valuation literature and its uses in decision-making. Water Resour. Econ. 17, 9–19. doi:10.1016/j.wre.2016.12.001
Bernhardt, E. S., Palmer, M., Allan, J. D., Alexander, G., Barnas, K., Brooks, S., et al. (2005). Synthesizing U. S. river restoration efforts. Science 308 (5722), 636–637. doi:10.1126/science.1109769
Beyer, H. L., Kennedy, E. V., Beger, M., Chen, C. A., Cinner, J. E., Darling, E. S., et al. (2018). Risk-sensitive planning for conserving coral reefs under rapid climate change. Conserv. Lett. 11 (6), e12587. doi:10.1111/conl.12587
Boardman, A. E., Greenberg, D. H., Vining, A. R., and Weimer, D. L. (2018). Cost benefit analysis: concepts and practice. Cambridge: Cambridge University Press.
Bonner, S. (2022). “A social perspective to CBA,” in Social cost benefit analysis and economic evaluation (Brisbane, Qld: The University of Queensland), 180–210.
Brierley, G., and Fryirs, K. (2022). Truths of the Riverscape: moving beyond command-and-control to geomorphologically informed nature-based river management. Geosci. Lett. 9 (1), 14. doi:10.1186/s40562-022-00223-0
Brierley, G. J., and Fryirs, K. A. (2005). Geomorphology and river management: applications of the river styles framework. Carlton, Victoria: Blackwell Publishing.
Brooks, A., Pietsch, T., Spencer, J., and Daley, J. (2017). Hunter River management prioritisation. A first order prioritisation based on riparian vegetation condition. Nathan, Queensland: Griffith University.
Burgess-Gamble, L., Ngai, R., Wilkinson, M., Nisbet, T., Pontee, N., Harvey, R., et al. (2017). Working with Natural Processes–Evidence Directory. Bristol: Environment Agency.
Cary, J. W., Webb, T. J., and Barr, N. F. (2002). Understanding landholders’ capacity to change to sustainable practices. Insights about practice adoption and social capacity for change. Canberra, ACT: Bureau of Rural Sciences.
Chessman, B. C., Fryirs, K. A., and Brierley, G. J. (2006). Linking geomorphic character, behaviour and condition to fluvial biodiversity: implications for river management. Aquatic Conservation Mar. Freshw. Ecosyst. 16 (3), 267–288. doi:10.1002/aqc.724
Cohen, T. J., Suesse, T., Reinfelds, I., Zhang, N., Fryirs, K., and Chisholm, L. (2022). The re-greening of east coast Australian rivers: an unprecedented riparian transformation. Sci. Total Environ. 810, 151309. doi:10.1016/j.scitotenv.2021.151309
Cohen-Shacham, E., Andrade, A., Dalton, J., Dudley, N., Jones, M., Kumar, C., et al. (2019). Core principles for successfully implementing and upscaling Nature-based Solutions. Environ. Sci. and Policy 98, 20–29. doi:10.1016/j.envsci.2019.04.014
Cohen-Shacham, E., Walters, G., Janzen, C., and Maginnis, S. (2016). in Nature-based solutions to address global societal challenges. Editors E. Cohen-Shacham, G. Walters, C. Janzen, and S. Maginnis. Gland, Switzerland: International Union for Conservation of Nature IUCN, 2016–2036.
Cole, L. J., Brocklehurst, S., Elston, D. A., and McCracken, D. I. (2012). Riparian field margins: can they enhance the functional structure of ground beetle (Coleoptera: carabidae) assemblages in intensively managed grassland landscapes? J. Appl. Ecol. 49 (6), 1384–1395. doi:10.1111/j.1365-2664.2012.02200.x
Cole, L. J., Stockan, J., and Helliwell, R. (2020). Managing riparian buffer strips to optimise ecosystem services: a review. Agric. Ecosyst. and Environ. 296, 106891. doi:10.1016/j.agee.2020.106891
Commonwealth of Australia and Macquarie University (2023). Identification of corridors of river recovery for NSW hunter catchments. The sharing and enabling environmental data portal (SEED). Available at: https://datasets.seed.nsw.gov.au/dataset/50a283c9-2402-48f5-938d-574a2dce3cd3 (Accessed November 12, 2023).
Corderi-Novoa, D., Hori, T., and Yamin, L. E. (2021). The economics of investment and prioritization of flood risk reduction measures in a watershed. Risk Anal. 41 (8), 1345–1361. doi:10.1111/risa.13642
Daigneault, A. J., Eppink, F. V., and Lee, W. G. (2017). A national riparian restoration programme in New Zealand: is it value for money? J. Environ. Manag. 187, 166–177. doi:10.1016/j.jenvman.2016.11.013
DCCEEW (2023). Australian carbon credit unit (ACCU) scheme. Dep. Clim. Change, Energy, Environ. Water. Available at: https://www.dcceew.gov.au/climate-change/emissions-reduction/emissions-reduction-fund (Accessed January 10, 2024).
DCCEEW (2024). Environment Restoration Fund: tackling emerging and long-term national environmental priorities. Dept Clim. Change, Energy, Environ. Water. Available at: https://www.dcceew.gov.au/environment/biodiversity/conservation/environment-restoration-fund (Accessed January 8, 2024).
De Groot, R., Brander, L., and Solomonides, S. (2020). Update of global ecosystem service valuation database (ESVD). Wageningen, Netherlands: Wageningen University and Research.
Dela-Cruz, J., Powell, M., Tippler, C., Wen, L., Ocock, J., J, S., et al. (2021). Mapping the natural blue grid elements of Wianamatta-South Creek: high ecological value waterways, riparian vegetation communities and water dependent ecosystems. Parramatta, N. S. W. DPIE.
Deloitte Access Economics (2021). Special report: update to the economic costs of natural disasters in Australia. Sydney, Australia: Deloitte Access Economics.
DIPNR (2004). Natural heritage Trust 03-04 IS project final report - installation of large woody debris/bed control structures. Sydney, NSW: NSW Department of Infrastructure Planning and Natural Resources.
Dobes, L., Crane, M., Higgins, T., Van Dijk, A. I. J. M., and Lindenmayer, D. B. (2021). Increased livestock weight gain from improved water quality in farm dams: a cost-benefit analysis. PLOS ONE 16 (8), e0256089. doi:10.1371/journal.pone.0256089
Dobes, L., Leung, J., and Argyrous, G. (2016). “Social cost-benefit analysis in Australia and New Zealand,” in The state of current practice and what needs to be done. Canberra, ACT: ANU Press.
Dodds, W. K., Wilson, K. C., Rehmeier, R. L., Knight, G. L., Wiggam, S., Falke, J. A., et al. (2008). Comparing ecosystem goods and services provided by restored and native lands. BioScience 58 (9), 837–845. doi:10.1641/b580909
DPIE (2020). Background document to the floodplain management plan for the border rivers valley floodplain 2020 (ref. INT20/8160). Parramatta, NSW: NSW Department of Planning Industry and Environment.
DPIE (2021a). River styles in NSW [online]. Parramatta, NSW: NSW Department of Planning, Industry and Environment. Available at: https://water.dpie.nsw.gov.au/science-data-and-modelling/surface-water/monitoring-changes/river-styles-in-nsw (Accessed December 22, 2023).
DPIE (2021b). Saving our species year in review 2019–20. Parramatta, NSW: NSW Department of Planning, Industry and Environment.
ECRR (2018). RiverWiki case study: New forest life III project [online]. European Centre for River Restoration. Available at: https://restorerivers.eu/wiki/index.php?title=Case_study%3ANew_Forest_Life_III_project#Cost_for_project_phases (Accessed January 12, 2024).
ECRR (2023). RiverWiki European Centre for River Restoration. Available at: https://restorerivers.eu/wiki/index.php?title=Main_Page (Accessed January 12, 2024).
European Commission (2022a). Commission staff working document: impact assessment: annexes accompanying the proposal for a regulation of the European Parliament and of the Council on nature restoration (Document 52022SC0167). Brussels: Publications Office of the European Union.
European Commission (2022b). Nature restoration law – for people, climate, and planet. Brussels: Publications Office of the European Union.
Fastré, C., Possingham, H. P., Strubbe, D., and Matthysen, E. (2020). Identifying trade-offs between biodiversity conservation and ecosystem services delivery for land-use decisions. Sci. Rep. 10 (1), 7971. doi:10.1038/s41598-020-64668-z
Friberg, N., Angelopoulos, N., Buijse, A., Cowx, I., Kail, J., Moe, T., et al. (2016). Effective river restoration in the 21st century: from trial and error to novel evidence-based approaches. Advances in Ecological Research. 55, 535–611. doi:10.1016/bs.aecr.2016.08.010
Fryirs, K., and Brierley, G. (2021). How far have management practices come in ‘working with the river’. Earth Surf. Process. Landforms 46, 3004–3010. doi:10.1002/esp.5279
Fryirs, K., Hancock, F., Healey, M., Mould, S., Dobbs, L., Riches, M., et al. (2021). Things we can do now that we could not do before: developing and using a cross-scalar, state-wide database to support geomorphologically-informed river management. PLOS ONE 16 (1), e0244719. doi:10.1371/journal.pone.0244719
Fryirs, K., Zhang, N., Ralph, T. J., and Arash, A. M. (2023). Natural flood management: lessons and opportunities from the catastrophic 2021–2022 floods in eastern Australia. Earth Surf. Process. Landforms 48 (9), 1649–1664. doi:10.1002/esp.5647
Fryirs, K. A., and Brierley, G. J. (2016). Assessing the geomorphic recovery potential of rivers: forecasting future trajectories of adjustment for use in management. Wiley Interdiscip. Rev. Water 3 (5), 727–748. doi:10.1002/wat2.1158
Fryirs, K. A., Brierley, G. J., Hancock, F., Cohen, T. J., Brooks, A. P., Reinfelds, I., et al. (2018). Tracking geomorphic recovery in process-based river management. Land Degrad. and Dev. 29 (9), 3221–3244. doi:10.1002/ldr.2984
Garcia, X., Müller, S., and Buchecker, M. (2021). “Valuation of ecosystem services to assess River Restoration projects,” in River restoration: political, social, and economic perspectives. Editors B. Morandi, M. Cottet, and H. Piégay (Oxford: John Wiley and Sons), 210–232.
Ghavasieh, A.-R., Poulard, C., and Paquier, A. (2006). Effect of roughened strips on flood propagation: assessment on representative virtual cases and validation. J. Hydrology 318 (1-4), 121–137. doi:10.1016/j.jhydrol.2005.06.009
Giraldo, L. P., Chará, J., Calle D, Z., and Chará-Serna, A. M. (2022). “Riparian forests: longitudinal biodiversity islands in agricultural landscapes,” in Biodiversity islands: strategies for conservation in human-dominated environments. Editor F. Montagnini (Cham: Springer International Publishing), 139–156.
Guimarães, L. F., Teixeira, F. C., Pereira, J. N., Becker, B. R., Oliveira, A. K. B., Lima, A. F., et al. (2021). The challenges of urban river restoration and the proposition of a framework towards river restoration goals. J. Clean. Prod. 316, 128330. doi:10.1016/j.jclepro.2021.128330
Hamilton, S. K., Kellndorfer, J., Lehner, B., and Tobler, M. (2007). Remote sensing of floodplain geomorphology as a surrogate for biodiversity in a tropical river system (Madre de Dios, Peru). Geomorphology 89 (1-2), 23–38. doi:10.1016/j.geomorph.2006.07.024
Hansen, B. D., Reich, P., Cavagnaro, T. R., and Lake, P. S. (2015). Challenges in applying scientific evidence to width recommendations for riparian management in agricultural Australia. Ecol. Manag. and Restor. 16 (1), 50–57. doi:10.1111/emr.12149
Hartig, J. H., Krantzberg, G., and Alsip, P. (2020). Thirty-five years of restoring great lakes areas of concern: gradual progress, hopeful future. J. Gt. Lakes. Res. 46 (3), 429–442. doi:10.1016/j.jglr.2020.04.004
Harvey, J., and Gooseff, M. (2015). River corridor science: hydrologic exchange and ecological consequences from bedforms to basins. Water Resour. Res. 51 (9), 6893–6922. doi:10.1002/2015WR017617
Hawley, R. J. (2018). Making stream restoration more sustainable: a geomorphically, ecologically, and socioeconomically principled approach to bridge the practice with the science. Bioscience 68 (7), 517–528. doi:10.1093/biosci/biy048
Hermoso, V., Clavero, M., and Filipe, A. F. (2021). An accessible optimisation method for barrier removal planning in stream networks. Sci. Total Environ. 752, 141943. doi:10.1016/j.scitotenv.2020.141943
Hermoso, V., and Filipe, A. F. (2021). Offsetting connectivity loss in rivers: towards a no-net-loss approach for barrier planning. Biol. Conserv. 256, 109043. doi:10.1016/j.biocon.2021.109043
Hermoso, V., Pantus, F., Olley, J., Linke, S., Mugodo, J., and Lea, P. (2012). Systematic planning for river rehabilitation: integrating multiple ecological and economic objectives in complex decisions. Freshw. Biol. 57 (1), 1–9. doi:10.1111/j.1365-2427.2011.02693.x
Hermoso, V., Pantus, F., Olley, J., Linke, S., Mugodo, J., and Lea, P. (2015). Prioritising catchment rehabilitation for multi objective management: an application from SE-Queensland, Australia. Ecol. Model. 316, 168–175. doi:10.1016/j.ecolmodel.2015.08.017
Heyman, W. D., and Wright, D. J. (2011). Marine geomorphology in the design of marine reserve networks. Prof. Geogr. 63 (4), 429–442. doi:10.1080/00330124.2011.585074
Higgisson, W. P., Downey, P. O., and Dyer, F. J. (2019). Changes in vegetation and geomorphological condition 10 Years after riparian restoration. Water 11 (6), 1252. doi:10.3390/w11061252
Howarth, R. B., and Farber, S. (2002). Accounting for the value of ecosystem services. Ecol. Econ. 41 (3), 421–429. doi:10.1016/S0921-8009(02)00091-5
Hunter-Central Rivers CMA (2008). Hunter-Central Rivers catchment management authority 2007/2008 annual report. Paterson, NSW: Hunter-Central Rivers Catchment Management Authority.
Iacona, G. D., Sutherland, W. J., Mappin, B., Adams, V. M., Armsworth, P. R., Coleshaw, T., et al. (2018). Standardized reporting of the costs of management interventions for biodiversity conservation. Conserv. Biol. 32 (5), 979–988. doi:10.1111/cobi.13195
Insurance Council of Australia (2022). Insurance catastrophe resilience report 2021–22. Sydney, NSW: Insurance Council of Australia.
Kahan, G., Colloff, M., and Pittock, J. (2021). Using an ecosystem services approach to re-frame the management of flow constraints in a major regulated river basin. Australas. J. Water Resour. 25 (2), 222–233. doi:10.1080/13241583.2020.1832723
Kaiser, N. N., Feld, C. K., and Stoll, S. (2020). Does river restoration increase ecosystem services? Ecosyst. Serv. 46, 101206. doi:10.1016/j.ecoser.2020.101206
Kark, S., Levin, N., Grantham, H. S., and Possingham, H. P. (2009). Between-country collaboration and consideration of costs increase conservation planning efficiency in the Mediterranean Basin. Proc. Natl. Acad. Sci. 106 (36), 15368–15373. doi:10.1073/pnas.0901001106
Kauffman, J. B., Coleman, G., Otting, N., Lytjen, D., Nagy, D., and Beschta, R. L. (2022). Riparian vegetation composition and diversity shows resilience following cessation of livestock grazing in northeastern Oregon, USA. PLOS ONE 17 (1), e0250136. doi:10.1371/journal.pone.0250136
Kimball, S., Lulow, M., Sorenson, Q., Balazs, K., Fang, Y.-C., Davis, S. J., et al. (2015). Cost-effective ecological restoration. Restor. Ecol. 23 (6), 800–810. doi:10.1111/rec.12261
Koehn, J. D., Brierley, G. J., Cant, B. L., and Lucas, A. M. (2001). “River restoration framework,” in Land and Water Australia occasional paper (Canberra, ACT).
Kool, J. T., Moilanen, A., and Treml, E. A. (2013). Population connectivity: recent advances and new perspectives. Landsc. Ecol. 28 (2), 165–185. doi:10.1007/s10980-012-9819-z
Kroeger, T., Klemz, C., Boucher, T., Fisher, J. R. B., Acosta, E., Cavassani, A. T., et al. (2019). Returns on investment in watershed conservation: application of a best practices analytical framework to the Rio Camboriú Water Producer program, Santa Catarina, Brazil. Sci. Total Environ. 657, 1368–1381. doi:10.1016/j.scitotenv.2018.12.116
Kull, D., Mechler, R., and Hochrainer-Stigler, S. (2013). Probabilistic cost-benefit analysis of disaster risk management in a development context. Disasters 37 (3), 374–400. doi:10.1111/disa.12002
Langhans, S. D., Gessner, J., Hermoso, V., and Wolter, C. (2016). Coupling systematic planning and expert judgement enhances the efficiency of river restoration. Sci. Total Environ. 560-561, 266–273. doi:10.1016/j.scitotenv.2016.03.232
Langhans, S. D., Hermoso, V., Linke, S., Bunn, S. E., and Possingham, H. P. (2014). Cost-effective river rehabilitation planning: optimizing for morphological benefits at large spatial scales. J. Environ. Manag. 132, 296–303. doi:10.1016/j.jenvman.2013.11.021
Lefebvre, M., and Reinhard, J. (2022). “The cost of extreme weather,” in Building resiliance in the face of disaster. Sydney, NSW: The McKell Institute.
Lewis, A., Slegers, S., Lowe, D., Muller, L., Fernandes, L., and Day, J. (2003). “Use of spatial analysis and GIS techniques to re-zone the great barrier reef marine park,” in Coastal GIS workshop (Wollongong, NSW: University of Wollongong).
Lin, Q., Zhang, Y., Marrs, R., Sekar, R., Luo, X., and Wu, N. (2020). Evaluating ecosystem functioning following river restoration: the role of hydromorphology, bacteria, and macroinvertebrates. Sci. Total Environ. 743, 140583. doi:10.1016/j.scitotenv.2020.140583
Linke, S., Hermoso, V., and Januchowski-Hartley, S. (2019). Toward process-based conservation prioritizations for freshwater ecosystems. Aquatic Conservation Mar. Freshw. Ecosyst. 29 (7), 1149–1160. doi:10.1002/aqc.3162
Logar, I., Brouwer, R., and Paillex, A. (2019). Do the societal benefits of river restoration outweigh their costs? A cost-benefit analysis. J. Environ. Manag. 232, 1075–1085. doi:10.1016/j.jenvman.2018.11.098
Mabbott, R., and Fryirs, K. (2022). Geomorphic and vegetative river recovery in a small coastal catchment of New South Wales, Australia: Implications for flow hydrology and river management. Geomorphology. 413, 108334. doi:10.1016/j.geomorph.2022.108334
Maes, J., Teller, A., Erhard, M., Condé, S., Vallecillo, S., Barredo, J., et al. (2020). Mapping and assessment of ecosystems and their services: an EU wide ecosystem assessment in support of the EU biodiversity strategy (EUR 30161 EN). Luxembourg: Publications Office of the European Union.
Malcher, J., Critchell, K., Matthews, T. G., and Lester, R. E. (2023). How wide, how much? A framework for quantifying the economic and ecological outcomes of altering riparian width on agricultural land. Sci. Total Environ. 897, 165342. doi:10.1016/j.scitotenv.2023.165342
Mantyka-Pringle, C. S., Martin, T. G., Moffatt, D. B., Udy, J., Olley, J., Saxton, N., et al. (2016). Prioritizing management actions for the conservation of freshwater biodiversity under changing climate and land-cover. Biol. Conserv. 197, 80–89. doi:10.1016/j.biocon.2016.02.033
Mappin, B., Ward, A., Hughes, L., Watson, J. E., Cosier, P., and Possingham, H. P. (2021). The costs and benefits of restoring a continent's terrestrial ecosystems. J. Appl. Ecol. 59 (2), 408–419. doi:10.1111/1365-2664.14008
Moore, H. E., and Rutherfurd, I. D. (2017). Lack of maintenance is a major challenge for stream restoration projects. River Res. Appl. 33 (9), 1387–1399. doi:10.1002/rra.3188
Morrell, N., Schuster, R., and Arcese, P. (2015). Marxan tutorial for the coastal douglas-fir and conservation partnership study area [online]. Vancouver, British Columbia: University of British Columbia. Available at: http://arcese.forestry.ubc.ca/marxan-tool/(Accessed March 13, 2023).
Naughtin, C., Hajkowicz, S., Schleiger, E., Bratanova, A., Cameron, A., Zamin, T., et al. (2022). Our Future World: global megatrends impacting the way we live over coming decades. Brisbane, Queensland: Commonwealth of Australia.
Nel, J. L., Reyers, B., Roux, D. J., and Cowling, R. M. (2009). Expanding protected areas beyond their terrestrial comfort zone: identifying spatial options for river conservation. Biol. Conserv. 142 (8), 1605–1616. doi:10.1016/j.biocon.2009.02.031
NRMSouth (2015). Healthy farming: landholder series property planning guide. Hobart, Tasmania: NRM South.
NSW Government (2021). Local land services natural resource management framework 2021 - 2026. NSW: NSW Government. Local Land Services.
NSW Government and DCCEEW (2023). New South Wales River Styles spatial dataset the sharing and enabling environmental data portal (SEED): NSW state government, NSW department of climate change. Energy, Environ. Water. Available at: https://datasets.seed.nsw.gov.au/dataset/1fa6cf3f-6a24-46b7-90f5-a0d3c59f5a4b (Accessed March 7, 2024).
Obst, C. (2018). The valuation of ecosystem services and assets for SEEA ecosystem accounting: background paper on SEEA EEA approach to valuation prepared for the BfN/UNSD workshop on ecosystem valuation, held in Bonn, Germany, April 2018. Melbourne, Australia: IDEAA Group.
O'Donnell, J., Fryirs, K. A., and Leishman, M. R. (2016). Seed banks as a source of vegetation regeneration to support the recovery of degraded rivers: a comparison of river reaches of varying condition. Sci. Total Environ. 542, 591–602. doi:10.1016/j.scitotenv.2015.10.118
O’Kane, M., and Fuller, M. (2022). 2022 flood inquiry volume one: summary report. Sydney NSW: NSW State Government.
Perry, N. (2023). “The economics of ecological restoration,” in Ecological restoration: moving forward using lessons learned. Editors S. Florentine, P. Gibson-Roy, K. W. Dixon, and L. Broadhurst (Cham: Springer International Publishing), 567–590.
Piégay, H., Arnaud, F., Belletti, B., Bertrand, M., Bizzi, S., Carbonneau, P., et al. (2020). Remotely sensed rivers in the Anthropocene: state of the art and prospects. Earth Surf. Process. Landforms 45 (1), 157–188. doi:10.1002/esp.4787
Pietsch, T., Daley, J., Stout, J. C., and Brooks, A. (2021). “Delta Green – a new metric for predicting trends in riparian vegetation recovery,” in 10th Australian stream management conference (10ASM) full proceedings. Editor I. Rutherfurd (NSW: Kingscliff).
Pittock, J., Thieme, M., Blom, E., and Willems, D. (2018). “Freshwater protected area corridors,” in Freshwater ecosystems in protected areas. Editors C. M. Finlayson, A. H. Arthington, and J. Pittock (London: Routledge), 177–189.
Possingham, H. P., Bode, M., and Klein, C. J. (2015). Optimal conservation outcomes require both restoration and protection. PLoS Biol. 13 (1), e1002052. doi:10.1371/journal.pbio.1002052
Reis, V., Hermoso, V., Hamilton, S. K., Bunn, S. E., and Linke, S. (2019). Conservation planning for river-wetland mosaics: a flexible spatial approach to integrate floodplain and upstream catchment connectivity. Biol. Conserv. 236, 356–365. doi:10.1016/j.biocon.2019.05.042
Renwick, A. R., Chauvenet, A. L. M., Possingham, H. P., Adams, V. M., McGowan, J., Gagic, V., et al. (2020). Taking a landscape approach to conservation goals: designing multi-objective landscapes. bioRxiv 2020. 2001.2021.914721. doi:10.1101/2020.01.21.914721
Riis, T., Kelly-Quinn, M., Aguiar, F. C., Manolaki, P., Bruno, D., Bejarano, M. D., et al. (2020). Global overview of ecosystem services provided by riparian vegetation. BioScience 70 (6), 501–514. doi:10.1093/biosci/biaa041
Robins, J. (2023). “A catchment based approach towards river restoration planning,” in Scientific advances in River Restoration 2023 (SARR23) (Liverpool: UK River Restoration Centre).
Schirmer, J., and Field, J. (2000). The cost of revegetation. Canberra, ACT: ANU Forestry, Greening Australia Ltd.
Schultze, A. K., Gellert, G., Koenzen, U., Riecker, T., and Rittner, R. (2019). Systematic rehabilitation planning: a new decision support system for targeted morphological river restoration. Water Environ. J. 33 (1), 135–143. doi:10.1111/wej.12384
Schulz-Zunkel, C., Seele-Dilbat, C., Anlanger, C., Baborowski, M., Bondar-Kunze, E., Brauns, M., et al. (2022). Effective restoration measures in river-floodplain ecosystems: lessons learned from the ‘Wilde Mulde’ project. Int. Rev. Hydrobiology 107 (1-2), 9–21. doi:10.1002/iroh.202102086
Seddon, N., Daniels, E., Davis, R., Chausson, A., Harris, R., Hou-Jones, X., et al. (2020). Global recognition of the importance of nature-based solutions to the impacts of climate change. Glob. Sustain. 3, e15. doi:10.1017/sus.2020.8
Sheldon, F., Peterson, E. E., Boone, E. L., Sippel, S., Bunn, S. E., and Harch, B. D. (2012). Identifying the spatial scale of land use that most strongly influences overall river ecosystem health score. Ecol. Appl. 22 (8), 2188–2203. doi:10.1890/11-1792.1
Sholtes, J. S., and Doyle, M. W. (2011). Effect of channel restoration on flood wave attenuation. J. Hydraulic Eng. 137 (2), 196–208. doi:10.1061/(asce)hy.1943-7900.0000294
Sillar AssociatesKingston Rural Management (1998). Cost benefit study of riparian restoration on the Mary River - interim report. Maryborough, Queensland: Mary River catchment coordinating committee.
Skidmore, P., and Wheaton, J. (2022). Riverscapes as natural infrastructure: meeting challenges of climate adaptation and ecosystem restoration. Anthropocene 38, 100334. doi:10.1016/j.ancene.2022.100334
Smith, R. F., Hawley, R. J., Neale, M. W., Vietz, G. J., Diaz-Pascacio, E., Herrmann, J., et al. (2016). Urban stream renovation: incorporating societal objectives to achieve ecological improvements. Freshw. Sci. 35 (1), 364–379. doi:10.1086/685096
Speed, R., Li, Y., Tickner, D., Huang, H., Naiman, R., Cao, J., et al. (2016). River restoration: a strategic approach to planning and management. Paris: UNESCO Publishing.
Szabolcs, M., Kapusi, F., Carrizo, S., Markovic, D., Freyhof, J., Cid, N., et al. (2022). Spatial priorities for freshwater biodiversity conservation in light of catchment protection and connectivity in Europe. PLOS ONE 17 (5), e0267801. doi:10.1371/journal.pone.0267801
Szałkiewicz, E., Jusik, S., and Grygoruk, M. (2018). Status of and perspectives on River Restoration in europe: 310,000 euros per hectare of restored river. Sustainability 10 (1), 129. doi:10.3390/su10010129
The River Restoration Centre (2020). Manual of River Restoration techniques. Cranfield: Cranfield University: The River Restoration Centre. Available at: https://www.therrc.co.uk/manual-river-restoration-techniques (Accessed November 12, 2023).
Thomson, J., Regan, T. J., Hollings, T., Amos, N., Geary, W. L., Parkes, D., et al. (2020). Spatial conservation action planning in heterogeneous landscapes. Biol. Conserv. 250, 108735. doi:10.1016/j.biocon.2020.108735
Tickner, D., Opperman, J. J., Abell, R., Acreman, M., Arthington, A. H., Bunn, S. E., et al. (2020). Bending the curve of global freshwater biodiversity loss: an emergency recovery plan. Bioscience 70 (4), 330–342. doi:10.1093/biosci/biaa002
Tulloch, V. J., Klein, C. J., Jupiter, S. D., Tulloch, A. I. T., Roelfsema, C., and Possingham, H. P. (2017). Trade-offs between data resolution, accuracy, and cost when choosing information to plan reserves for coral reef ecosystems. J. Environ. Manag. 188, 108–119. doi:10.1016/j.jenvman.2016.11.070
UN DESA (2023). The sustainable development goals report 2023. Special Edition. New York: United Nations Department of Economic and Social Affairs UN DESA.
United Nations (2023). United Nations Decade on ecosystem restoration: preventing, halting and reversing loss of nature [Online]. New York, NY: United Nations. Available at: https://www.decadeonrestoration.org/(Accessed December 12, 2023).
Vörösmarty, C. J., Rodríguez Osuna, V., Cak, A. D., Bhaduri, A., Bunn, S. E., Corsi, F., et al. (2018). Ecosystem-based water security and the sustainable development goals (SDGs). Ecohydrol. and Hydrobiology 18 (4), 317–333. doi:10.1016/j.ecohyd.2018.07.004
Ward, P. J., Jongman, B., Aerts, J. C. J. H., Bates, P. D., Botzen, W. J. W., Diaz Loaiza, A., et al. (2017). A global framework for future costs and benefits of river-flood protection in urban areas. Nat. Clim. Change 7 (9), 642–646. doi:10.1038/nclimate3350
Wheaton, J. M., Bennett, S. N., Bouwes, N. W., Maestas, J. D., and Shahverdian, S. M. (2019). Low-tech process-based restoration of Riverscapes: design manual. Logan, Utah: Utah State University Restoration Consortium. Available at: http://lowtechpbr.restoration.usu.edu/manual (Accessed November 12, 2023).
Wilson, N., Tickle, P. K., Gallant, J. C., Dowling, T. I., and Read, A. (2011). 1 second SRTM derived hydrological digital elevation model (DEM-H) version 1.0. Record 1.0.4. [Online]. Canberra, ACT: Geoscience Australia. Available at: http://pid.geoscience.gov.au/dataset/ga/71498 (Accessed June 12, 2021).
Wohl, E., Bledsoe, B. P., Jacobson, R. B., Poff, N. L., Rathburn, S. L., Walters, D. M., et al. (2015). The natural sediment regime in rivers: broadening the foundation for ecosystem management. BioScience 65 (4), 358–371. doi:10.1093/biosci/biv002
Worley, L. C., Underwood, K. L., Diehl, R. M., Matt, J. E., Lawson, K. S., Seigel, R. M., et al. (2023). Balancing multiple stakeholder objectives for floodplain reconnection and wetland restoration. J. Environ. Manag. 326, 116648. doi:10.1016/j.jenvman.2022.116648
Keywords: fluvial corridor, working with recovery, cost-benefit analysis, Marxan, nature-based solutions, river management, recovery potential, prioritisation
Citation: Agnew D, Fryirs K and Leishman MR (2024) Cost-benefit analysis of working with recovery in river management using Marxan. Front. Environ. Sci. 12:1425668. doi: 10.3389/fenvs.2024.1425668
Received: 10 May 2024; Accepted: 21 August 2024;
Published: 25 September 2024.
Edited by:
Shaoda Liu, Beijing Normal University, ChinaReviewed by:
Laure André, Institut de recherche pour le développement (IRD), New CaledoniaCopyright © 2024 Agnew, Fryirs and Leishman. This is an open-access article distributed under the terms of the Creative Commons Attribution License (CC BY). The use, distribution or reproduction in other forums is permitted, provided the original author(s) and the copyright owner(s) are credited and that the original publication in this journal is cited, in accordance with accepted academic practice. No use, distribution or reproduction is permitted which does not comply with these terms.
*Correspondence: Danelle Agnew, ZGFuZWxsZS5hZ25ld0BoZHIubXEuZWR1LmF1
Disclaimer: All claims expressed in this article are solely those of the authors and do not necessarily represent those of their affiliated organizations, or those of the publisher, the editors and the reviewers. Any product that may be evaluated in this article or claim that may be made by its manufacturer is not guaranteed or endorsed by the publisher.
Research integrity at Frontiers
Learn more about the work of our research integrity team to safeguard the quality of each article we publish.