
94% of researchers rate our articles as excellent or good
Learn more about the work of our research integrity team to safeguard the quality of each article we publish.
Find out more
ORIGINAL RESEARCH article
Front. Environ. Sci., 19 July 2024
Sec. Soil Processes
Volume 12 - 2024 | https://doi.org/10.3389/fenvs.2024.1425044
This article is part of the Research TopicVegetation-soil-hydrology Interactions and Ecohydrological ProcessesView all 16 articles
 Xu-Dong Huang1,2*
 Yue-Jia Li1
 Pei-Pei Han3
 Ran Zheng3Hua-Jie Yan1
 Pan-Pan Zhao1,2Xiao-Li Zhang1,2Li-Li Feng1,2Dong Wang4Feng-Juan Zeng5
Understanding the complex influencing factors of soil erosion is critical for maintaining regional ecological security. The revised wind erosion equation (RWEQ) and partial least squares regression (PLSR) model were used to reveal the primary factors affecting soil erosion. Based on the results of the RWEQ model, the wind erosion area was 8,439.3 km2 in 2018, accounting for 54.3% of the total planning area, and mild erosion, moderate erosion, intense erosion, very intense erosion, and fierce erosion accounted for 18.22%, 11.43%, 11.78%, 10.16%, and 2.74% of the total planning area, respectively. Based on the results of the PLSR model, the results indicate that the proportion of mining land, meteorological indicators, and mean square deviation of slope difference were positively correlated with the soil erosion area, intensity, and severity, respectively. The proportion of grassland and forest land was negatively correlated with the soil erosion area, intensity, and severity. The mean square deviation of slope difference, the mean square deviation of difference in elevation, and the proportion of urban land use contributed the most to the soil erosion severity index, with variable importance in projection (VIP) scores of 1.55, 1.44 and 1.43, respectively. The mean square deviation of slope difference, the proportion of urban land, and the mean square deviation of difference in elevation contributed the most to the soil erosion area, with VIP scores of 1.53, 1.26 and 1.24, respectively. The results provide new insights into wind erosion and the influences of weather conditions and human influences, which can guide regional soil and water conservation planning in wind erosion regions.
Topography, precipitation, wind speed, and the soil type affect soil erosion in wind erosion regions (Luo et al., 2023). The slope degree and length are considered to be the direct factors affecting the intensity of soil erosion, and the relief height is considered to be a necessary condition (Peng and Quan, 2023). A positive correlation exists between the threshold of the slope gradient and steepness, which decreases or stays constant as the value increases to the critical threshold (Zhao et al., 2015). As the proportion of meteorological factors affecting soil erosion has increased, the spatial and temporal heterogeneity of rainfall erosion has also increased, and rainfall has become an important indicator of erosion risk (Ma et al., 2012). The soil type, parent material, and vegetation cover influence soil erodibility, which is commonly assessed using the K-factor (Battista et al., 2022). Vegetation reduces the soil erosion level because the roots anchor the soil (Wang, 2023).
The topography, land ownership, non-agricultural activities, and inefficient water conservation measures can negatively affect soil and water conservation. The education level of farmers and soil and water conservation extension personnel positively influences soil and water conservation (Huang X. et al., 2020). Farmers use soil and water conservation measures to protect cultivated land and increase food production. As a result, the rate of soil erosion has decreased in cultivated land areas (Udayakumara et al., 2012). A significant positive correlation exists between population density and soil and water erosion intensity (Istanbuly et al., 2022). Many studies have shown that population density and economic density are indicators of soil erosion (Yang and Tian, 2024).
Most studies focused on the temporal and spatial variations in soil erosion in water erosion areas and their influencing factors. However, soil erosion is more complex in wind erosion than in water erosion regions. Traditional methods for evaluating soil erosion and its influencing factors include models, such as the Markov model, statistical methods, and the gray system theory. These methods have been used to clarify the influences of various factors on soil erosion. However, they did not consider the multicollinearity of the influencing factors, and it is difficult to identify the main controlling factors of soil erosion in the areas where wind erosion are intertwined (Lin et al., 2022). Partial least squares regression (PLSR) is an advanced method for solving multivariate linear problems. It minimizes the error between the true and predicted values and is used in many fields of academic research. This method is suitable for assessing the factors influencing soil erosion (Huang et al., 2016; Huang X. D. et al., 2020).
In order to study the wind erosion area more accurately, the study area is chosen to be a part of the Xinjiang Zhundong Economic and Technological Development Region, where extensive wind erosion occurs, and many industrial and mining enterprises are located (ZDR). The ZDR pertains to typical areas of wind erosion, and the areas resulting in soil erosion are characterized by their diversity and greatly affected by human activities, which brings great difficulties to soil and water conservation programs and ecological environmental protection (Yang et al., 2016). Taking ZDR as an example, the PLSR model is used to analyze the spatial heterogeneity and influencing factors of soil erosion in a wind erosion region affected by anthropogenic and natural factors. The results can guide soil and water conservation projects in wind erosion regions to ensure normal human life in the face of variable weather factors and better ecological restoration of eroded areas.
The ZDR extends from the western border of Jimusaer County, the eastern border of the Kalamaili Mountain Ungulate Nature Reserve, the northern border of Changji Prefecture, and the southern border of the Kalamaili Mountain Ungulate Nature Reserve. The geographical center coordinates are 90°15′19″E and 44°42′46″N. The east–west length is 220 km, and the average north–south width is 60 km. It covers an area of 15,500 km2. The schematic diagram of the planning scope of the ZDR is shown in Figure 1.
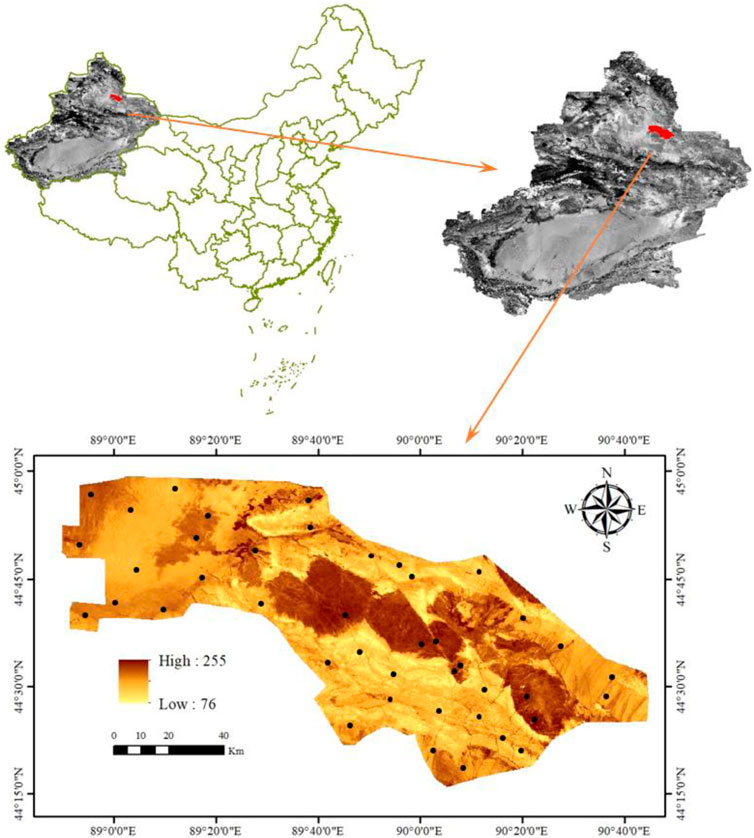
Figure 1. Schematic diagram of the planning scope of the ZDR.
It has a semi-arid climate with extensive wind in spring and summer. The mean annual temperature is 3°C, the average annual precipitation is 106 mm, most of which falls from June to July, and the total annual solar radiation is 565 kJ/cm2.
In the delineated area of interest, the dominant soil type is calcareous brown soil (Figure 2). The area has sparse vegetation and a thin topsoil. The dry, windy conditions coupled with scarce precipitation have resulted in few surface water sources. The vegetation status in the ZDR is shown in Figure 3. The average wind speed is 3.4 m/s, the maximum wind speed is 28.4 m/s, and the number of windy days annually is 28 days. These conditions have resulted in extensive wind erosion and soil degradation. Various climatic factors contribute to soil erosion, including wind velocity, temperature, rainfall intensity, solar exposure, and snowfall.
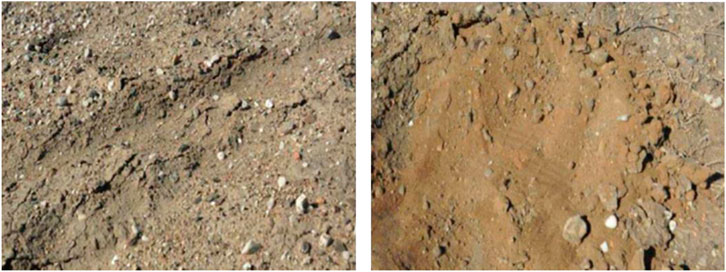
Figure 2. Soil and surface constituents of ZDR.
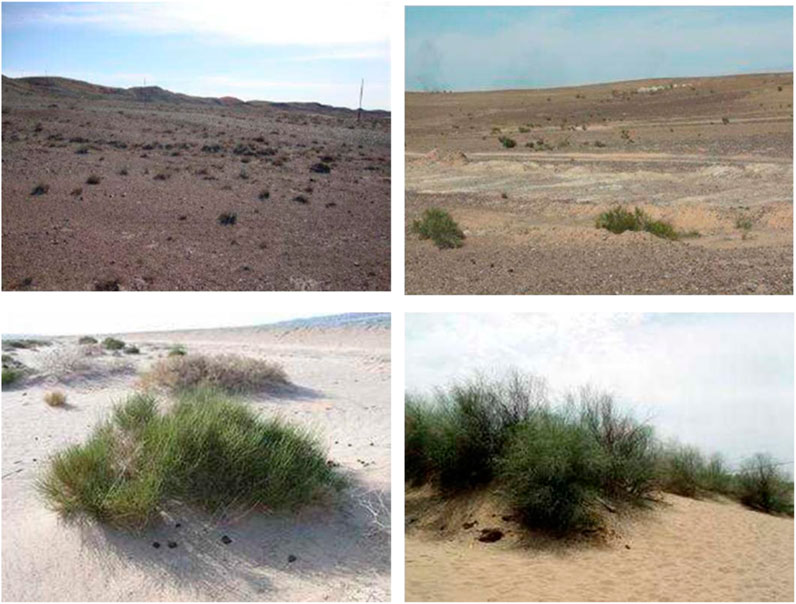
Figure 3. Status of vegetation in the ZDR.
A 1:50,000 digital elevation model (DEM) with a Xi’an 80 coordinate system, 1985 National Elevation Datum (NED), and Gauss–Krüger projection was used to assess the topography of the region. The elevation contour distance was 5 m in flat areas and 10 m in mountainous areas.
The ZDR has no meteorological stations. Thus, meteorological data from 1990 to 2018 were obtained from eight surrounding meteorological stations (Fuhai, Fuyun, Changji, Miquan, Fukang, Jimusaer, Dabancheng, and Mulei). The data included wind direction, daily precipitation, snowfall amount, monthly average temperature, and monthly average relative humidity. Other meteorological data were obtained from the China Meteorological Data Network.
Landsat series images data from 1990, 2000, 2015, and 2018 were downloaded from the Geospatial Data Cloud. The resolution was 30 m for Landsat 5 TM and 15 m for Landsat 8 OLI data.
This study selected 42 sampling points to investigate and analyze the elevation, slope, land use types and proportions, soil types, soil texture, vegetation types, and vegetation coverage. The distribution of sampling points is shown in Figure 1.
The Soil Erosion Classification and Grading Standard (SL190-2007) defines the soil erosion areas as the sum of the water erosion areas with levels above low erosion. We used the soil erosion severity index to quantify soil erosion at the county level administrative district.
In order to reflect the contribution of a certain level of erosion intensity to the soil erosion severity index, the median value of the erosion modulus for different intensity levels in the Soil Erosion Classification and Grading Standard (SL190-2007) was used to determine the weight of Mi. To expand the difference and highlight the severity of erosion of different intensities, the proportional series was used to determine the Mi of the corresponding erosion intensity grade. Since the erosion modulus of micro-erosion areas is relatively small and the effect on soil degradation is minimal, the weight was set to 0 for these areas. The weights of erosion intensity grades at each level are determined, as shown in Table 1.
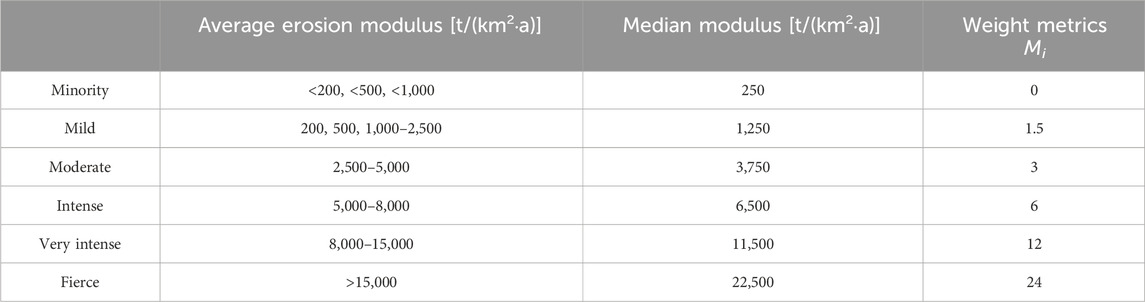
Table 1. Classification of degrees of soil erosion, modulus mid-value, and weight.
Three dependent variables were used:
Soil erosion severity index (SECI, Y1)—It is a comprehensive indicator of soil erosion, which comprehensively measures the severity of soil erosion.
Soil erosion area (SEArea, Y2)—It represents the rate of the sum of wind erosion areas above the mild erosion level to the total area.
Average soil erosion modulus (SEIndens, Y3)—It represents the area of the median value of the erosion modulus above the low erosion level. It was summed to obtain the soil erosion modulus in the region, use the total soil erosion modulus to divide it by the total area of the mild or above level of soil erosion, and get the average soil erosion modulus for the eroded area in the region.
where Ai is the area of class i, Mi is the median soil erosion intensity for class i, and Mi ×Ai is the total erosion area for class i (i ranges from 2 to 6). The total erosion area for five classes was obtained by summing;
The standard deviation of the elevation and slope differences in the counties (districts) was calculated to reflect the complexity of topography and geomorphology in the study areas. The daily rainfall and average wind speed of the ZDR from 2022 to 2023 were selected as natural factors. The soil erodibility K-factor was assumed to be stable because it does not change significantly over time.
Due to great complexity, there are a large number of variables, and there are even problems such as repeated selection of variables in terms of human factors, but land use factors, including cultivated land, forest land, mining land, and urban land, are the most active factors affecting soil erosion in the short term (Tilahun et al., 2022). Therefore, only land use was used as the social drivers affecting soil erosion. The index implication and calculation method was shown in Table 2.
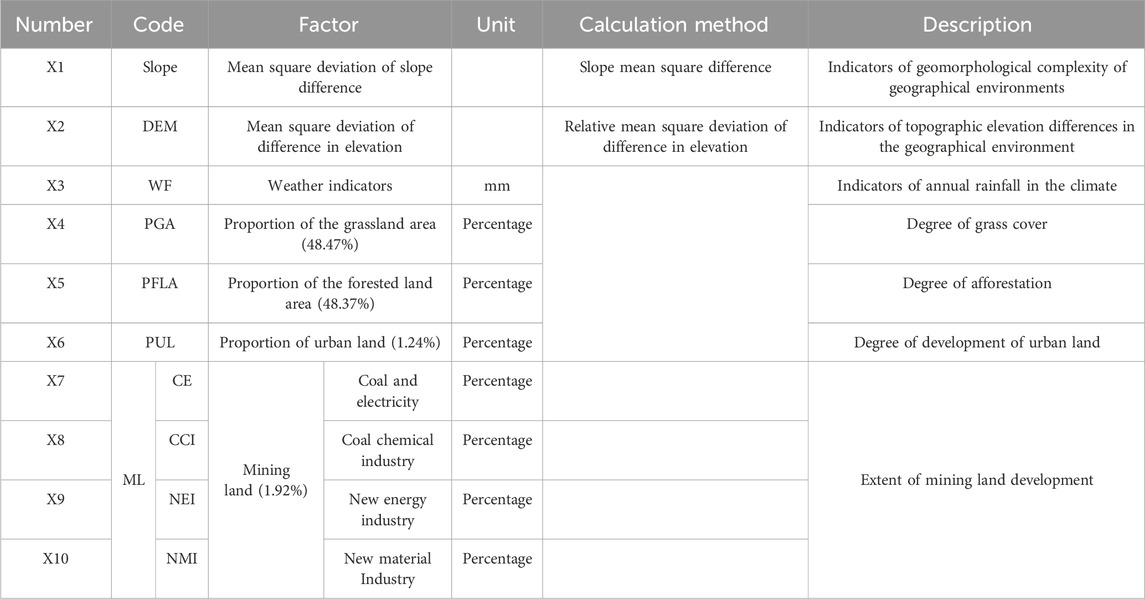
Table 2. Index implication and calculation method.
The revised wind erosion equation (RWEQ) was used to quantify wind erosion in the ZDR, and the RWEQ model is the soil transfer caused by a combination of multiple factors such as weather factors, soil crust factor, vegetation cover factor, surface roughness, and other factors. The maximum transfer capacity is defined in Eq. 2. The amount of the transferred volume reaching 63.2% of transfer capacity is called the key plot length (S) in Eq. 3, and the total amount of all soil transfers in the study area is the amount of soil loss (SL) in Eq. 4. The calculations were performed in the ArcGIS map algebra module.
where
(1) Weather factor (WF)
The weather factor (WF), i.e., the response of various types of meteorological factors to the combined effects of wind erosion, is expressed in Eq. 5.
where WF is the weather factor (kg/m);
(2) Soil erodibility factor (EF)
Soil erodibility refers to the soil’s vulnerability and the resistance of the surface soil to wind erosion. The RWEQ model was used to establish a relationship between the physicochemical properties of soil samples by analyzing their physical and chemical properties and the soil erodibility factors:
where Sa is the sand content (%), Si is the silt content (%), Cl is the clay content (%), OM is the organic matter content (%), and CaCO3 is the calcium carbonate content (%).
(3) Soil crust factor (SCF)
A soil crust can reduce soil erosion due to fewer erodible particles on the surface. It can reduce the abrasive effect of soil particles, which is conducive to the fixation of sand dunes and significantly impacts the soil’s physical and chemical characteristics, wind erosion resistance, and soil stability (Nosrati, 2013). We established an equation to quantity the soil crust factor using wind tunnel tests on soils with different clay and organic matter contents:
where cl is the soil clay content (%) and OM is the organic matter content (%).
(4) Vegetation cover factor (C)
The amount of vegetation has a significant effect on wind erosion. It increases surface roughness, reduces wind speed, and slows the movement of particles (Li and Bo, 2019). The vegetation cover, denoted as C, is defined as follows:
where SC is the vegetation cover (%).
(5) Surface roughness factor (K′)
The RWEQ model describes the effect of surface roughness on wind erosion. In agricultural settings, roughness refers to soil ridges due to plowing (Li et al., 2019). It distinguishes between random roughness, Crr, and ridge roughness, Kr. The surface roughness factor K′ is defined as
It is difficult to determine the random roughness Crr in the cultivated areas at the regional scale, and no cultivated areas occur in the study area. Thus, the ridge roughness Kr is replaced by calculating the topographic roughness as
where Kr is the topographic roughness (cm); Crr is a random roughness factor (cm), which is 0 here; K′ is the topographic roughness factor (cm); L is the topographic relief parameter; and △H is the difference in elevation within the distance L (cm). The ArcGIS neighborhood tool was used to calculate the terrain relief in adjacent DEM pixels within the distance L.
(6) Wind erosion modulus
Using the database management function and raster spatial analysis function of ArcGIS, a total of five factor thematic maps of WF, EF, SCF, K′, and C of the generated model (Figure 4) were used to generate wind erosion class distribution maps through Eqs. 1–3 based on the same projection method and accuracy in the ArcGIS platform. According to the Soil Erosion Classification Standard (Ministry of Water Resources, SL190-2007) (Table 3), the erosion raster map was classified into six categories, namely, minor, mild, moderate, intense, very intense, and fierce, and the soil erosion class map was obtained.
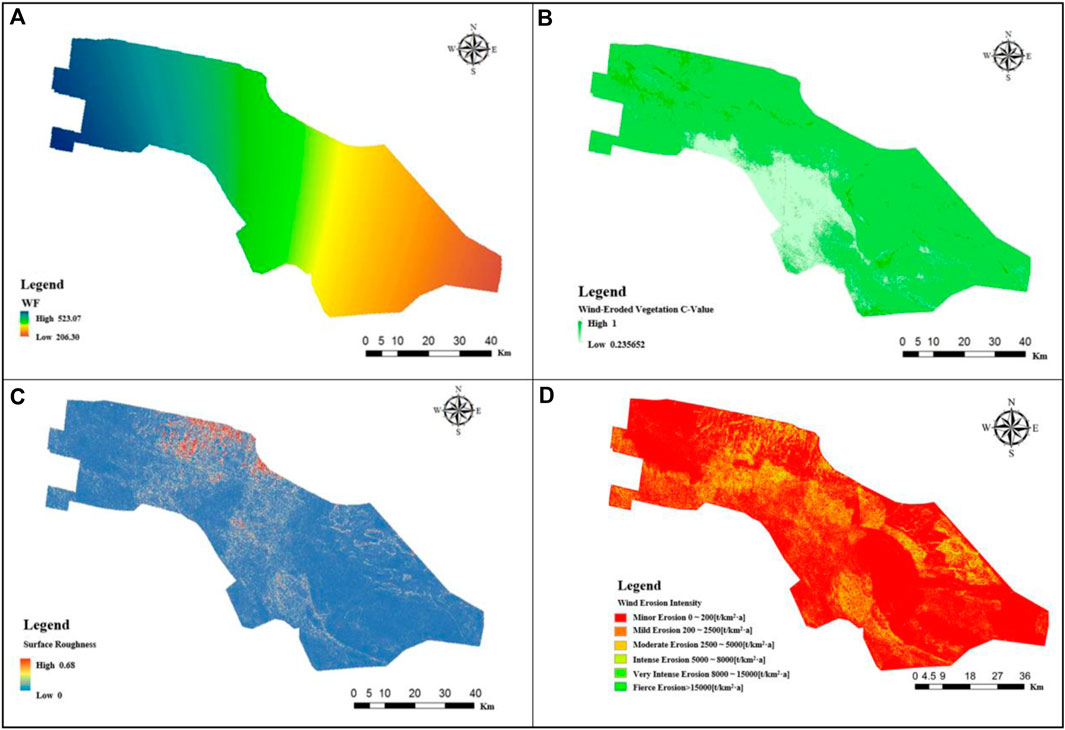
Figure 4. Wind erosion impact factors. (A) weather factor (B) Vegetation cover factor (C) Surface roughness factor (D) Wind erosion intensity.
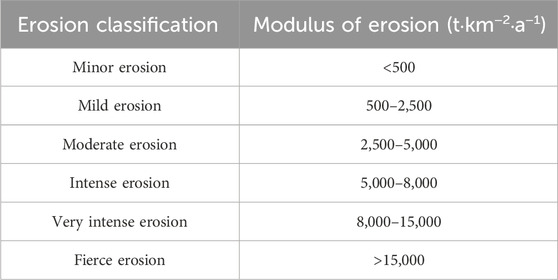
Table 3. Wind erosion intensity classification.
We used PLSR to analyze the influence of the factors on soil erosion. The predictive variables included topographical and meteorological factors and land use (grassland, forest land, urban land, and mining areas). PLSR is not significantly affected by multicollinearity. We created a data matrix X with n samples and p features and an outcome matrix Y with the same number of samples and q outcomes. PLSR can handle multiple responses and predict outcomes beyond the range of Y. The model coefficients describe the degree of influence and directionality between predictors and responses. The variable importance in projection (VIP) score reflects the relative importance of the effect of the variables on the outcome, providing insights into the influence of various factors on soil erosion in this study.
The meteorological factors (wind speed, air density, soil moisture, and other factors) had a high impact of 523.07 in the northeastern part of the ZDR, with a decreasing trend in the southeastern lower mountainous areas and a minimum of 206.3 in the southeastern part of the region (Figure 4A). The soil erodibility factors had higher scores in the southwestern to southeastern regions and lower values in the northern than in the southern part of the eastern region. The oil crust factor had higher values in the southeastern to southwestern regions and lower values in the northwest and northeast regions. The vegetation cover was high in the ZDR, with higher values in the northwest and northeast and lower values in the southcentral part of the ZDR (Figure 4B). The roughness coefficients were low, with higher values in the central part and the highest value of 0.68 in the northwestern part of the region (Figure 4C).
The erosion raster map was categorized into six categories of erosion, and Table 3 shows a large proportion of low-erosion areas. The northcentral zone has low vegetation cover and a large proportion of areas with moderate and severe wind erosion (Figure 4D).
In the RWEQ model calculations, meteorological elements include daily average wind speed, wind direction data, daily precipitation, snow accumulation, monthly average temperature, and monthly average relative humidity, and all meteorological data are from the China Meteorological Data Network. Soil texture spatial distribution data were obtained from the Chinese Academy of Sciences Resources and Environment Data Cloud Platform, and soil organic matter content data were obtained from the National Science and Technology Basic Condition Platform. The final formula from the RWEQ model yields the following data.
The wind erosion area of the ZDR was 8,439.3 km2 in 2018, accounting for 54.3% of the total area of the planning area; the area of mild erosion was 2,830.0 km2, accounting for 33.5% of the total wind erosion area; the moderate erosion area was 1776.3 km2, accounting for 21.0% of the total wind erosion area; the intense erosion area was 1829.7 km2, accounting for 21.7% of the wind erosion area; the very intense erosion area was 1,578.2 km2, accounting for 18.7% of the wind erosion area; and the area of fierce erosion was 425.1 km2, and the percentage of the wind erosion area is 5.0%. The erosion area in the planning area is shown in Table 4, and the percentage of the total erosion area caused by wind erosion of different intensities is shown in Figure 5.
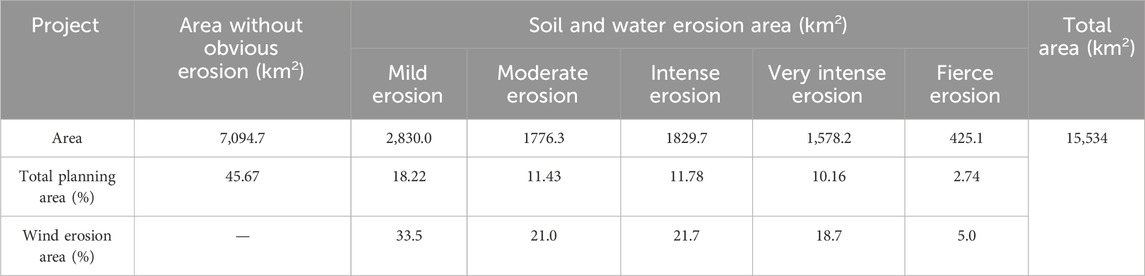
Table 4. Basic information on the area and intensity of soil erosion in the planning area.
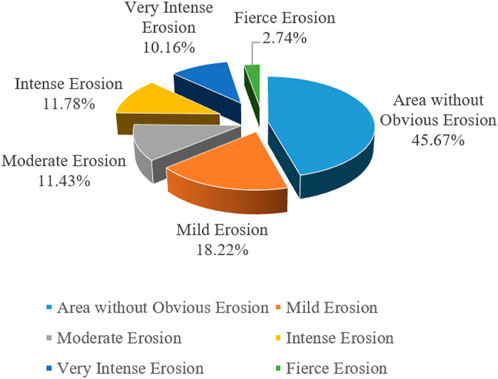
Figure 5. Proportion of erosion areas of different intensities in the planning area.
The symbol R2X in Table 5 indicates the explanatory power of component th to X, R2 (X; th), h = 1, 2. R2Y indicates the explanatory power of the component th to Y, R2(Y; th), h = 1, 2. Q2 indicates the cross-validated residuals. Q2Y (cum) of all PLS principal components was extracted, i.e., the precision with which the dependent variable can be explained. The results are listed in Table 5.
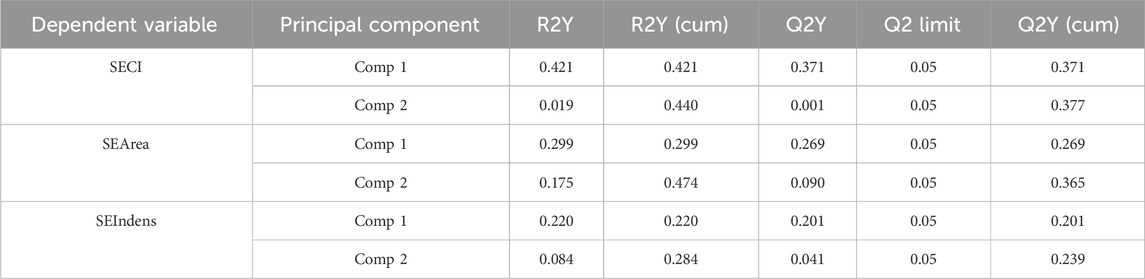
Table 5. Accuracy comparison of PLS models.
The regression coefficients and variables important in projection importance values of the three dependent variables of the main correlation factors and soil erosion are shown in Figure 6. For the three variables, the proportion of the soil erosion area (SEArea) had the greatest amount of explanation for Y, and with two components extracted, it was more stable for modeling the soil erosion composite index (SECI). Therefore, VIP1 and VIP2 refer to the amount of explanation of SEArea and SECI by the dependent variable, respectively. The mean square deviation of the slope difference, the mean square deviation of difference in elevation, and the proportion of the urban land contributed the most to the first component, with variables important in projection values of 1.55, 1.44 and 1.43, respectively. The mean square deviation of slope difference, the proportion of urban land, and the mean square deviation of differences in elevation contributed the most to the second component, with variables important in projection values of 1.53, 1.26 and 1.24, respectively. The coefficient of variation indicated the high importance of these variables. Although variables important in projection values of the proportion of Energy Industry and new Material Industry did not exceed 1, the values of R2Y (cum) and Q2 (cum) were reduced after removing these factors. The regression coefficients of the explanatory variables and the dependent variables are both large, as shown in Figure 7, indicating a high correlation between these factors and the dependent variables.
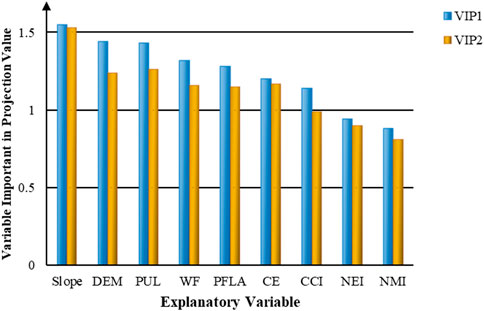
Figure 6. Variables important in the projection value of the PLS model of the ZDR.
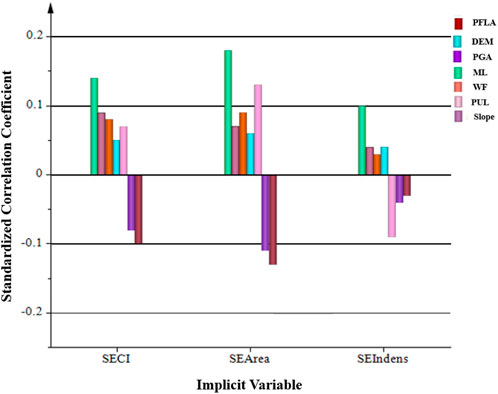
Figure 7. Coefficient values of the PLS model of the ZDR.
Figure 7 shows that the mean square deviation of slope difference, weather indicators, and the proportions of the urban land and mining land were positively correlated with the amount of soil erosion. In contrast, the proportion of the grassland and forest land was negatively correlated. The area of soil erosion in each county (district), which shows a stronger correlation between its mining land and urban land, shows a positive correlation. The correlation between the topographical factors and the second component was relatively high, indicating that the topographic has a certain correlation with the distribution of soil erosion. The third dependent variable, soil erosion intensity, describes the distribution of the average degree of soil erosion across counties (districts) and is more highly and positively correlated with the proportion of mining land.
Figure 8 shows that the explanatory variable of the mean square deviation of the slope differenced error was positively correlated with both the soil erosion area and soil erosion intensity, i.e., as the slope difference decreased from mountains to hills to plains, the soil erosion area and intensity also decreased.
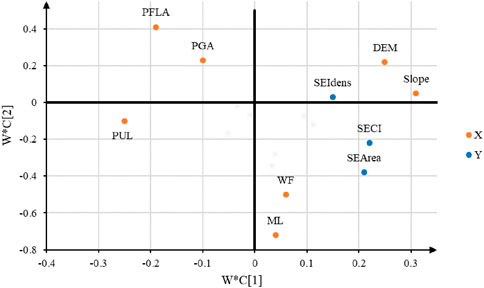
Figure 8. Loading plots of the PLS of the ZDR.
The mining areas were positively correlated with the degree of soil erosion. The same was observed for the urban population density, which reflects urbanization in 2018. The severity of soil erosion in these regions was not as high as in the northwestern part of the ZDR and the southeastern part, where the proportion of urban population is lower.
In addition to climatic factors (wind, rainfall, air temperature, etc.,) and subsurface factors (vegetation cover, soil texture, topography, etc.,), there are also unscientific and irrational production and construction, indiscriminate logging, and anthropogenic factors, which are specifically manifested in the following two aspects.
(1) Wind factor: The study area is located in the Gobi Desert, which is extremely windy. The average number of windy days is 25, and there are few mountains acting as barriers. The wind speed is typically at a level of 4 to 5, and northwesterly winds prevail, resulting in extensive wind erosion.
(2) Vegetation factor: Soil and water conservation in this area has focused on increasing vegetation cover and creating a hierarchical vegetation structure. The vegetation cover in the study area is relatively low, the vegetation height is uniform, and exposed soil is common, resulting in moderate or higher soil erosion.
Soil erosion is closely related to human socioeconomic activities. With the development of society and the continuous increase in population, the intensity of human utilization of natural resources has strengthened, leading to increased awareness of resource environmental protection. Inappropriate land use has caused soil and water erosion.
(1) Resource exploitation is the main reason for soil erosion and environmental degradation. In September 2012, the State Council approved the establishment of the state-level ZDR. In December 2012, the People’s Republic approved the “ZDR (2012–2030)”. The ZDR is a national-level energy construction demonstration. The construction of coal power plants and coal-based chemical plants, coupled with the population increase, has resulted in environmental degradation, reducing the carrying capacity of the land and increasing soil erosion.
(2) Significant construction has occurred in the ZDR due to extensive development. Highway, oil, hydropower, thermal power, natural gas, coal and coal chemical industries, and other construction projects have been started. These activities have increased the areas of disturbance due to slag piles, breaking the region’s original soil erosion law, resulting in original soil erosion which is not too serious areas but produced intense soil erosion. Soil erosion has also increased in sandy soil. Thus, construction activities have exacerbated soil erosion.
(3) The awareness of soil and water conservation is not strong in this area. The focus has been on development and construction but not on protection and conservation. Thus, soil and water erosion and environmental damage due to human activities are crucial problems. Therefore, the focus should be changed to consider ecological protection to reduce soil erosion and create a sustainable, virtuous cycle.
The area of the ZDR without erosion was 7,094.7 km2, accounting for 45.67% of the total area. The area of wind erosion was 8,439.3 km2, accounting for 54.33% of the total area of the planning area, and the area of mild erosion was 18.22%. These results indicate that the ZDR is dominated by areas with mild erosion, showing a step in the right direction. The proportions of areas with moderate and higher soil erosion levels indicate that the risk of soil erosion in this area is high.
We used the RWEQ and PLSR model to determine factors affecting soil erosion. The mean square deviation of slope difference, the mean square deviation of difference in elevation, and the proportion of urban land use contributed the most to the soil erosion severity index, with VIP scores of 1.55, 1.44 and 1.43, respectively. The mean square deviation of slope difference, the proportion of urban land, and the mean square deviation of difference in elevation contributed the most to the soil erosion area, with VIP scores of 1.53, 1.26 and 1.24, respectively. Mining land, weather indicators, the mean square deviation of difference in elevation, and the mean square deviation of slope difference were positively correlated with the soil erosion area, soil erosion intensity, and soil erosion severity index. Areas with the elevation exceeding 1,000 m or a slope greater than 20° had the highest soil erosion risk.
The original contributions presented in the study are included in the article/Supplementary Material; further inquiries can be directed to the corresponding author.
X-DH: funding acquisition, writing–original draft, and Writing–review and editing. Y-JL: writing–original draft. P-PH: data curation, methodology, and writing–review and editing. RZ: data curation and writing–review and editing. H-JY: writing–review and editing. P-PZ: funding acquisition and writing–review and editing. X-LZ: funding acquisition and writing–review and editing. L-LF: funding acquisition and writing–review and editing. DW: writing–review and editing. F-JZ: writing—review and editing.
The authors declare that financial support was received for the research, authorship, and/or publication of this article. This work was supported by the National Natural Science Foundation of China (42207100, 51979106, and 42007158), the Key Science and Technology Program of Henan Province, China (222102320083 and 232102320019), the Science and Technology Major Project of Henan Province (21100320200), and the National Key Research and Development Program of China (2023YFC3006602).
The research would not have been possible without the interest and cooperation of the North China University of Water Resources and Electric Power.
Author F-JZ was employed by China Construction Seventh Engineering Division Corp., Ltd.
The remaining authors declare that the research was conducted in the absence of any commercial or financial relationships that could be construed as a potential conflict of interest.
All claims expressed in this article are solely those of the authors and do not necessarily represent those of their affiliated organizations, or those of the publisher, the editors, and the reviewers. Any product that may be evaluated in this article, or claim that may be made by its manufacturer, is not guaranteed or endorsed by the publisher.
Battista, G., Molnar, P., and Burlando, P. (2022). Modelling impacts of spatially variable erosion drivers on suspended sediment dynamics. Earth Surf. Dyn. 8 (3), 619–635. doi:10.5194/esurf-8-619-2020
Huang, X., Lu, Q., and Yang, F. (2020a). The effects of farmers' adoption behavior of soil and water conservation measures on agricultural output. Int. J. Clim. Change Strategies Manag. 12, 599–615. doi:10.1108/IJCCSM-02-2020-0014
Huang, X. D., Shi, Z. H., Fang, N. F., and Li, X. (2016). Influences of land use change on baseflow in mountainous watersheds. Forests 7 (1), 16. doi:10.3390/f7010016
Huang, X. D., Wang, D., Han, P. P., Wang, W. C., Li, Q. J., Zhang, X. L., et al. (2020b). Spatial patterns in baseflow mean response time across a watershed in the loess plateau: linkage with land-use types. For. Sci. 66 (4), 382–391. doi:10.1093/forsci/fxz084
Istanbuly, M. N., Josef, K., and Amiri, B. J. (2022). How socio-economic drivers explain landscape soil erosion regulation services in polish catchments. Int. J. Environ. Res. Public Health 19 (4), 2372. doi:10.3390/ijerph19042372
Li, X., and Bo, T. (2019). Statistics and spectra of turbulence under different roughness in the near-neutral atmospheric surface layer. Earth Surf. Process. Landforms 44 (5), 1460–1470. doi:10.1002/esp.4588
Lin, D., Shi, P., Meadows, M., Yang, H., Wang, J., Zhang, G., et al. (2022). Measuring compound soil erosion by wind and water in the eastern agro–pastoral ecotone of northern China. Sustainability 14 (10), 6272. doi:10.3390/su14106272
Luo, B., Li, J., Gong, C. M., Zhong, S. q., and Wei, C. f. (2023). Driving forces and their interactions of soil erosion in soil and water conservation regionalization at the county scale with a high cultivation rate. J. Mt. Sci. 20 (9), 2502–2518. (in Chinese). doi:10.1007/s11629-023-8033-6
Ma, Q., Yu, X., Lü, G., and Liu, Q. (2012). The changing relationship between spatial pattern of soil erosion risk and its influencing factors in Yimeng mountainous area, China 1986–2005. Environ. Earth Sci. 66 (5), 1535–1546. doi:10.1007/s12665-011-1393-1
Miao, C. Y., Yang, L., Chen, X. H., and Gao, Y. (2012). The vegetation cover dynamics (1982–2006) in different erosion regions of the Yellow River Basin, China. Land Degrad. Dev. 23 (1), 62–71. doi:10.1002/ldr.1050
Nosrati, K. (2013). Assessing soil quality indicator under different land use and soil erosion using multivariate statistical techniques. Environ. Monit. Assess. 185 (4), 2895–2907. doi:10.1007/s10661-012-2758-y
Pei, L., Wang, C., Sun, L., and Wang, L. (2022). Temporal and spatial variation (2001–2020) characteristics of wind speed in the water erosion area of the typical black soil region, northeast China. Int. J. Environ. Res. Public Health 19 (17), 10473. doi:10.3390/ijerph191710473
Peng, X., and Quan, H. D. (2023). Drivers of soil erosion and subsurface loss by soil leakage during karst rocky desertification in SW China. Int. Soil Water Conservation Res. 10 (2), 217–227. (in Chinese). doi:10.1016/j.iswcr.2021.10.001
Tang, Q., Li, H., Cao, Y. F., Jiang, L., and Cai, C. F. (2023). Human activities are the key driver of water erosion changes in northeastern China. Land Degrad. Dev. 35 (9), 62–75. doi:10.1002/ldr.4897
Tilahun, D., Gashu, K., and Shiferaw, G. T. (2022). Effects of agricultural land and urban expansion on peri-urban forest degradation and implications on sustainable environmental management in southern Ethiopia. Sustainability 14, 16527. doi:10.3390/su142416527
Udayakumara, E. P. N., Shrestha, R. P., Samarakoon, L., and Schmidt-Vogt, D. (2012). Mitigating soil erosion through farm-level adoption of soil and water conservation measures in Samanalawewa Watershed, Sri Lanka. Acta Agric. Scand. B 62, 273–285. doi:10.1080/09064710.2011.608708
Wang, K. L., Zhou, J., Tan, M. L., Lu, P. D., Xue, Z., Liu, M., et al. (2024). Impacts of vegetation restoration on soil erosion in the Yellow River Basin, China. CATENA 234 (11), 107547. doi:10.1016/j.catena.2023.107547
Wang, T. (2023). Analysis of the effects of vegetation on improving soil erosion and water loss. Haihe River Water Resour. (07), 8–10. (in Chinese).
Wei, W., Chen, L., Yang, L., Fu, B., and Sun, R. (2012). Spatial scale effects of water erosion dynamics: complexities, variabilities, and uncertainties. Chin. Geogr. Sci. 340 (s1-2), 127–143. CNKI: SUN: ZDKX.0.2012-02-002. doi:10.1007/s11769-012-0524-2
Yang, Y., and Tian, P. (2024). Vulnerability assessment of soil erosion in Southwest Hubei based on RUSLE model and geodetector. J. Soil Water Conservation 38 (01), 91–103. doi:10.13870/j.cnki.stbcxb.2024.01.015
Yang, Z., Gao, J., Yang, M., and Sun, Z. (2016). Effects of freezing intensity on soil solution nitrogen and microbial biomass nitrogen in an alpine grassland ecosystem on the Tibetan Plateau, China. J. Arid Land 8 (5), 749–759. doi:10.1007/s40333-016-0012-0
Keywords: soil erosion, wind erosion, vegetation, partial least squares regression, ecological protection
Citation: Huang X-D, Li Y-J, Han P-P, Zheng R, Yan H-J, Zhao P-P, Zhang X-L, Feng L-L, Wang D and Zeng F-J (2024) Research on spatial patterns of soil erosion in wind erosion region based on the revised wind erosion equation and partial least squares regression. Front. Environ. Sci. 12:1425044. doi: 10.3389/fenvs.2024.1425044
Received: 29 April 2024; Accepted: 25 June 2024;
Published: 19 July 2024.
Edited by:
Jing Liu, University of Birmingham, United KingdomReviewed by:
Niu Yu hua, Henan University, ChinaCopyright © 2024 Huang, Li, Han, Zheng, Yan, Zhao, Zhang, Feng, Wang and Zeng. This is an open-access article distributed under the terms of the Creative Commons Attribution License (CC BY). The use, distribution or reproduction in other forums is permitted, provided the original author(s) and the copyright owner(s) are credited and that the original publication in this journal is cited, in accordance with accepted academic practice. No use, distribution or reproduction is permitted which does not comply with these terms.
*Correspondence: Xu-Dong Huang, aHVhbmd4dWRvbmcyNjlAMTYzLmNvbQ==
Disclaimer: All claims expressed in this article are solely those of the authors and do not necessarily represent those of their affiliated organizations, or those of the publisher, the editors and the reviewers. Any product that may be evaluated in this article or claim that may be made by its manufacturer is not guaranteed or endorsed by the publisher.
Research integrity at Frontiers
Learn more about the work of our research integrity team to safeguard the quality of each article we publish.