 Shi Xuan
- 1Songlin College of Architecture and Art, University of South China, Hengyang, China
- 2School of Architecture and Urban Planning, Hunan City University, Yiyang, China
- 3Department of National Spatial Planning Data, The Third Surveying and Mapping Institute of Hunan Province, Changsha, China
Urbanization-induced land use transitions (LUTs) result in a decline in ecosystem services, which has implications for regional ecological security. In order to explore the relationship between ecosystem services and land use transition, this paper utilizes the InVEST model, a geographically weighted regression (GWR) model, to examine the impact of land use transition on ecosystem services in the Dongting Lake area (DLA). The results showed that 1) with the change in urbanization development, the average values of land use transition intensity (LUI) in 2000, 2010, and 2020 are 237.99, 235.82, and 238.92, respectively. Land use dynamics (LUD) show a tendency to increase and then decrease, with average values of 5.58 and 5.62 for the periods 2000–2010 and 2010–2020, respectively, and the transformation of land use shows obvious spatio-temporal heterogeneity. 2) Habitat quality and carbon sequestration showed a downward trend. In contrast, food supply followed an upward trend; soil conservation (SC) and water yield (WY) services initially increased and decreased later. The overall spatial changes in habitat quality and carbon sequestration appear to be insignificant. Food supply shows significant differences in the plains compared to other areas, while soil conservation and water yield service show significant changes in places other than the DLA. 3) From 2000 to 2020, land use transition dynamics, population density, GDP density, night lighting, and transition intensity had mainly negative effects on ecosystem services. Only the Normalized Vegetation Index (NDVI) showed a positive effect on ecosystem services. The results of the research will provide valuable references for the development and implementation of spatial ecological restoration planning and land use policies in the national territory.
1 Introduction
Since the 21st century, with growing urbanization and industrialization (Wang et al., 2023a), the large-scale growth of building land has led to noticeable shifts in land use, in which natural and semi-natural habitat classes have shifted toward artificial habitat classes (Griggs et al., 2013). In addition, current research has identified habitat fragmentation, soil quality deterioration, and increasing environmental contamination as direct effects of human overexploitation (Banks-Leite et al., 2020). These repercussions are predominantly driven by land use transition (LUT), which considerably alters the balance between the supply and demand of ecosystem services (ESs) (Xiang et al., 2022), leading to changes in their providing ecosystem functions (Keyes et al., 2021). Therefore, disclosing the impacts on ESs in the process of LUT is vital for the creation and implementation of ecological restoration planning and land use regulations in the territorial area (Feng et al., 2023).
LUT is the result of the interaction between social and natural factors (Zhou et al., 2020) and plays an important role in regulating socioeconomic development and ecological restoration (Cao et al., 2021a). The meaning of change, its effects, and other facets have been the subject of several academic studies. Explicit and implicit LUT modes are distinguishable among them based on their respective connotations (Shi et al., 2021). Implicit LUT, on the other hand, primarily refers to changes in land use functions (Zou et al., 2024), including various land attributes in terms of property rights (Wen et al., 2020), inputs, outputs, production, etc. Among them, explicit LUT refers to changes in land use structure (i.e., quantitative and spatial structure) (de Groot, 2006; Burton et al., 2009). In terms of effect, LUT has caused changes in the land use structure, which has led to the reduction in ecological land, thus causing ecological environment damage (Yang et al., 2018). Among them are ESs, which people rely on for direct or indirect environmental benefits. Research has demonstrated that ESs are key components of ecological security (Liu et al., 2023). Natural variables like temperature and rainfall and socioeconomic factors like population growth, construction site expansion, and economic development all have an impact on ESs (Ouyang et al., 2022). Of these, land use change has a major impact on ESs (Xu et al., 2019). Prior research has mostly examined how changes in land use structure affect ESs without taking into account how these changes affect ESs themselves during the LUT process (Bai et al., 2020). Furthermore, research on the effects of changing land use on ESs (Hasan et al., 2020) is primarily conducted at the administrative division level (Liu, 1996; Chen et al., 2019; Song et al., 2022). This limits the ability to suggest relevant planning for the area and makes it challenging to characterize the phenomenon’s local changes.
The Dongting Lake Ecological Reserve is an important part of the Yangtze River basin (Liu et al., 2023) and an important area for ecological restoration and food supply in China. The process of urbanization has precipitated a significant shift in land utilization within the locality, exerting a profound impact on the ESs of the area. Hence, this study focuses on the Dongting Lake area (DLA) as the subject of investigation, elucidating the transition in land use and ESs at the grid scale from 2000 to 2020 through a multi-dimensional assessment. It aims to delve into the mechanism by which land use transition impacts ESs, employing a geographically weighted regression (GWR) model. This endeavor seeks to address the following scientific inquiries: 1) What patterns characterize the changes in ESs during the process of land use transition? 2) What is the relationship between land use transition (LUT) and ESs? The ultimate objective is to furnish theoretical underpinnings for the high-quality development of land space in the DLA (Li et al., 2023).
2 Methods
2.1 Overview of the study area
DLA (28°30′N-29°40′N, 113°10′E−114°40′E) is the second largest freshwater lake in China (Song et al., 2022). It is located in the northern part of Hunan Province and the southern part of Hubei Province, serving as an essential storage lake and ecological security function area in the Yangtze River basin (Liu et al., 2022). The region is predominantly characterized by plains, which can be categorized into four main types: lake water bodies and shoals, plains surrounding the lake, hills and low mountains adjacent to the lake, and valley plains and hills (Zhao et al., 2023). The current investigation centered on a subset comprising 19 counties (cities and districts) from the three prefecture-level cities, namely, Yueyang, Yiyang, and Changde, within the DLA (Jiang and Zeng, 2024). These areas encompassed Yueyang city, Linxiang city, Yueyang County, Huarong County, Miluo City, Xiangyin County, Yiyang city, Yuanjiang city, Nan County (including the Datong Lake area), Changde city, Hanshou County, Anxiang County, Li County, Jin city, and Linli County (Jie et al., 2023). As shown in Figure 1, the total area spans approximately 25,800 km2, constituting 12.18% of Hunan Province. As of the end of 2020, the resident population numbered approximately 10,705,800, accounting for approximately 16.11% of the province. The GDP amounted to 710.44 billion yuan, representing roughly 17% of the province.
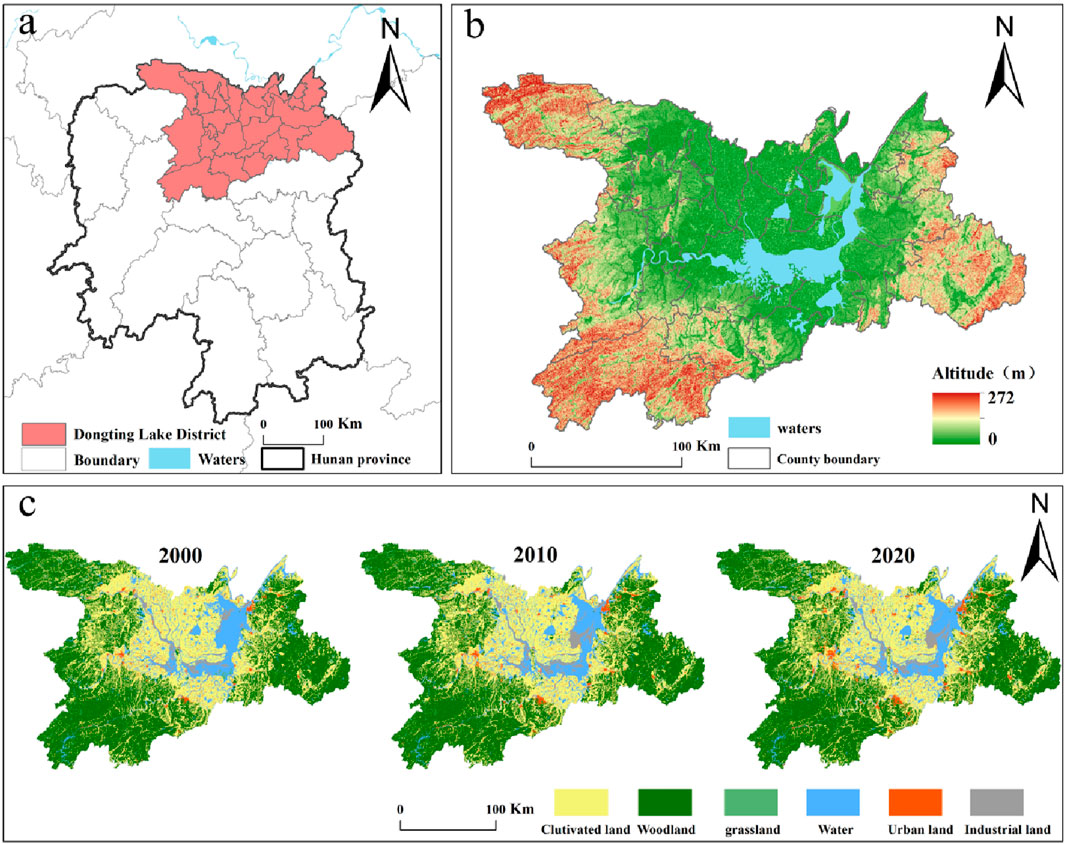
Figure 1. Geographic location and land use classification of the Dongting Lake ecological and economic zone. Location of the region (A), digital elevation model (B), and class of land use (C).
In terms of land use, we reclassified land cover into six categories. Of these, forest land accounted for the largest share of 46% of the total area in 2020, followed by cropland at 37%, grassland and unused land both at 2%, watershed at 11%, and built-up land at 3%. There was a shift in land use between 2000 and 2020, mainly for cropland—from 38% of the total area to 37%—and built-up land—from 2% to 3%. The 46% coverage of forested land around Dongting Lake underscores the substantial forest resources in the area, reflecting not only its biodiversity but also its contribution to water yield (WY) and soil conservation (SC), which are pivotal for maintaining the ecological balance of the lake region. The 37% allocation to cultivated areas highlights the significance of agriculture in the Dongting Lake vicinity, particularly in the production of staple crops such as rice, which is vital for local and neighboring food supplies. Moreover, the 11% designated as watershed areas signifies the abundant water resources surrounding Dongting Lake, crucial for sustaining crop growth and ecological equilibrium. Prudent conservation and management of these land resources, including preserving forest cover and wetland ecosystems, as well as enhancing agricultural productivity and sustainability, are essential for maintaining the ecological balance and food security in the Dongting Lake region, ensuring a healthy and stable environmental landscape within the area.
2.2 Materials
2.2.1 Data sources
The data mainly include land use data, food supply, carbon density, night light data, and others, as shown in Table 1.
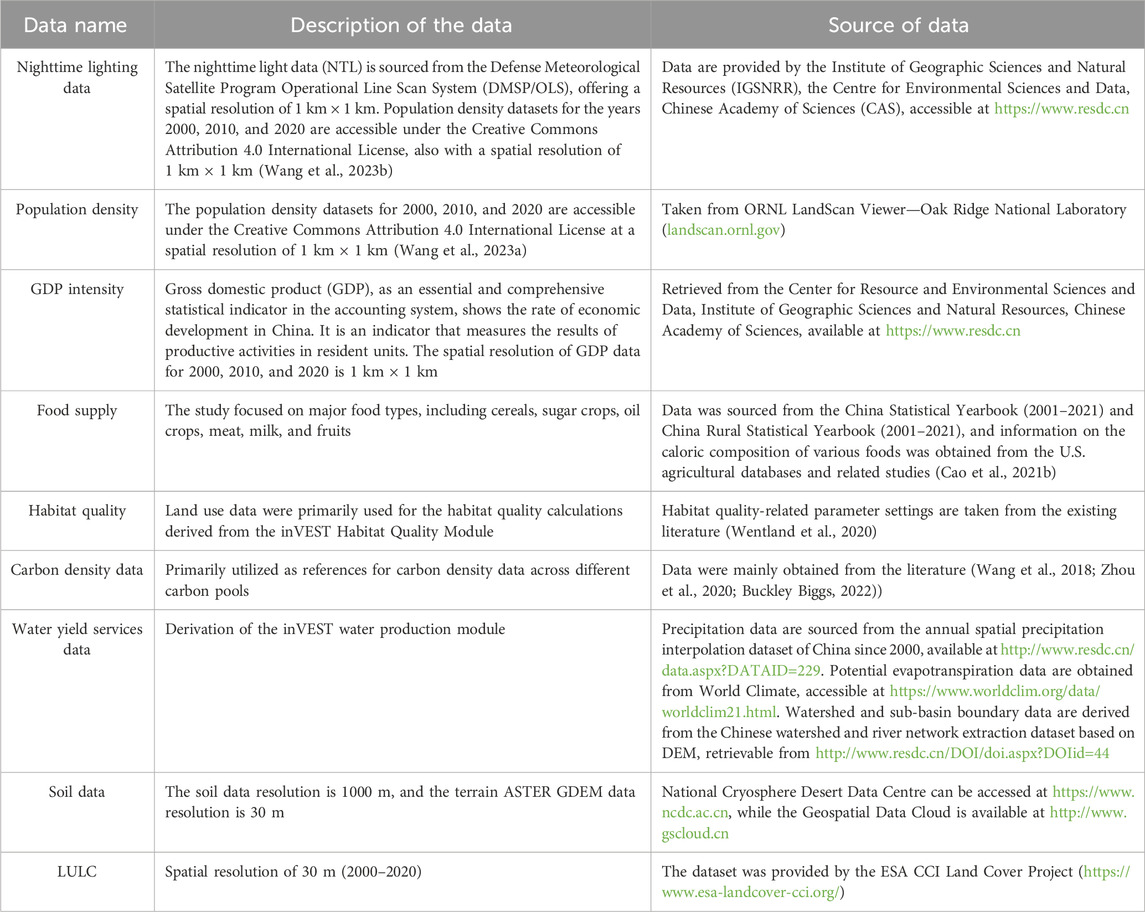
Table 1. Data sources.
2.3 Methods
2.3.1 Land use transition intensity
Land use transition intensity (LUI) is a significant metric of the land use function (Yang et al., 2020). From a socio-economic standpoint, LUI can indicate varied degrees of land transitions, development, and exploitation. The study will treat each land raster as a sampling point, generating a 1 km × 1 km grid and calculating the LUI of each grid independently, as depicted in Figure 3. Each land use type can be defined as the ability of different land use types to provide products and services for human beings (Kleijn et al., 2009). Their contribution to LUI is consistent with their weights. Therefore, using the grid, LUI can be calculated using the following formula:
In this formula,
2.3.2 Land use dynamics model
Land use dynamics (LUD) serves to depict the rate and trajectory of land transition and reflects its overall characteristics within a region over time (El-Naggar et al., 2022). Similarly, this study utilizes the grid as the fundamental unit for LUD calculation. The specific equations are provided below (Li et al., 2021):
Here,
2.3.3 Methods for quantifying ecosystem services
Ecosystem services can be classified into four main types: provisioning services (providing food and water), regulating services (controlling floods and diseases), cultural services (offering spiritual, entertainment, and cultural benefits), and supporting services (maintaining nutrient cycling that sustains life on earth) (MA et al., 2017; Ning and Ouyang, 2023).
In this study, we selected carbon sequestration, water yield services, food production, habitat quality, and soil conservation. Carbon sequestration and soil conservation fall under regulating services; water yield services and food production belong to provisioning services; and habitat quality is classified as a supporting service (Yu et al., 2024). Specific quantification was done using the InVEST model (Wei et al., 2021), and the corresponding equations are shown in Table 2.
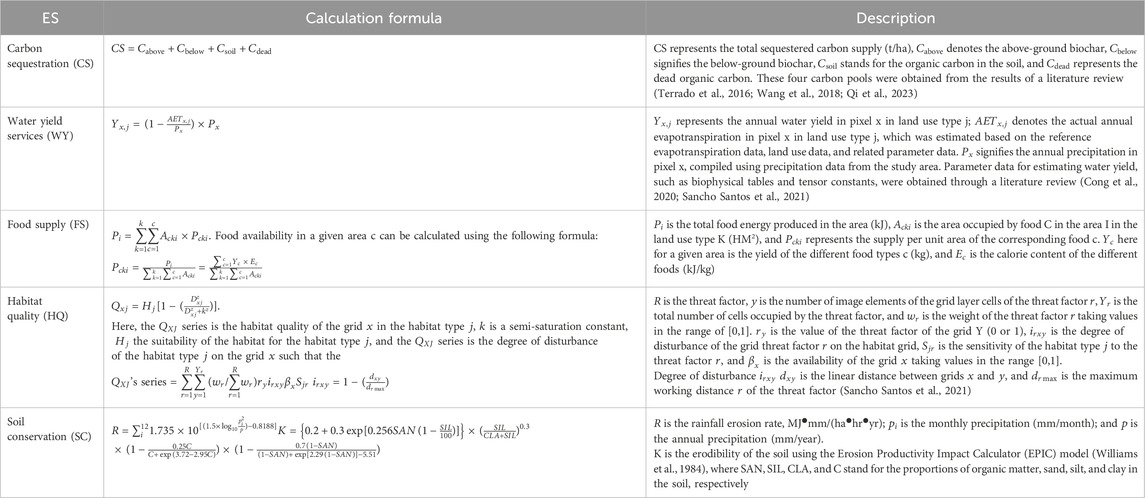
Table 2. Formulas and descriptions of ecosystem service calculations.
Since the five ESs of carbon sequestration, water yield services, food production, habitat quality, and soil conservation have different units, a standardized method was used to standardize the ESs to [0,1]. Then all the values were added to obtain the total ESs (TES).
2.3.4 Geographically weighted regression
The GWR model is a classic approach for analyzing spatial heterogeneity. It effectively captures the influence of geographical location on the relationship between dependent and independent variables. Compared to other models, GWR offers higher accuracy. Additionally, the ecosystem service observation data in this paper exhibit spatial correlation. Therefore, incorporating temporal attributes into the GWR model allows for the exploration of the spatio-temporal driving mechanisms underlying the explanatory power of the independent variable on the dependent variable. The specific formula of the GWR model is presented below:
where
3 Results
3.1 Characteristics of spatial and temporal changes in LUT
Overall, the LUI exhibited slight fluctuations, with average values of 237.99, 235.82, and 238.92 in 2000, 2010, and 2020, respectively. The average annual growth rate of the LUI from 2000 to 2010 was −0.22, and from 2010 to 2020, it was 0.31. In contrast, LUD demonstrated a trend of initially increasing and then decreasing, with average values of 5.58 and 5.62 for the periods 2000–2010 and 2010–2020, respectively. Spatially, high-value areas in 2000–2010 were predominantly situated around the lake area and in urban expansion zones, while those in 2010–2020 were dispersed across urban, rural, and urban expansion areas (see Figure 2). The concentration of high-value areas of land use transition intensity in 2000, 2010, and 2020 was observed in the DLA, indicating favorable topography and optimal utilization of land resources in the region (see Figures 3D–F).
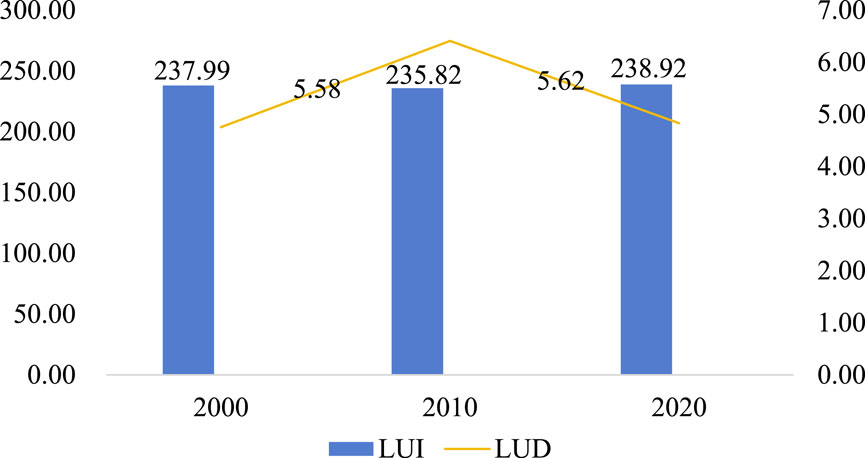
Figure 2. Intensity of land use transition and motivation, 2000–2020.
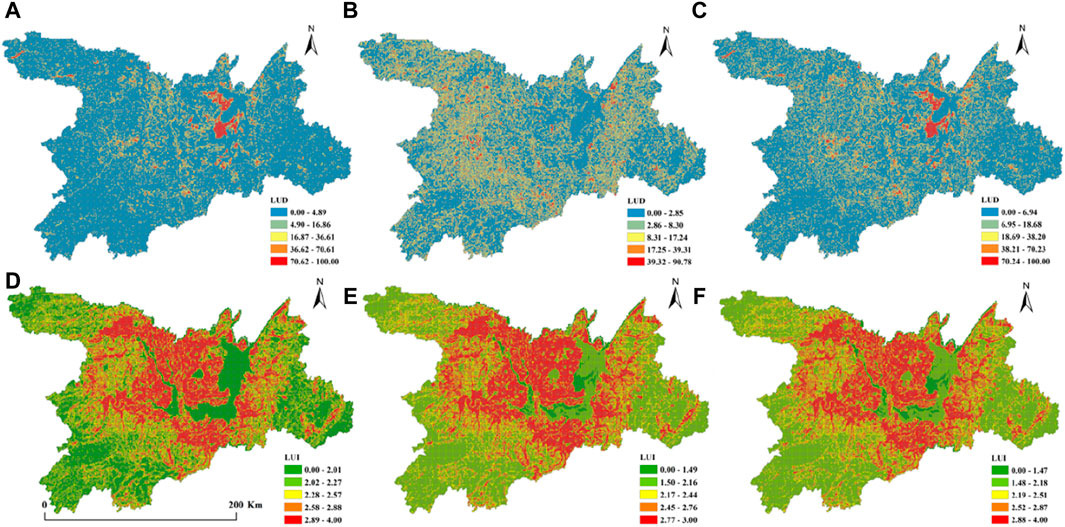
Figure 3. Intensity of land use transition and dynamics of motivation. (A) LUD during 2000-2010; (B) LUD during 2010-2020; (C) LUD during 2000-2020; (D) LUI 2000; (E) LUI 2010; (F) LUI 2020.
From 2000 to 2010, the high-value area of LUD for land use transition motivation was primarily concentrated in the eastern coastal area at the northern end of DLA and in urban construction areas around the region. Conversely, from 2010 to 2020, the high-value area of LUD for land use transition motivation was mainly concentrated in the suburbs of cities and urban and rural areas, particularly in the townships around cities, with a significant range of land use changes. The motivation for change slowed down around the lake area during this period (see Figures 3A–C).
3.2 Characteristics of spatial and temporal changes in ESs
The temporal and spatial variations over the period 2000–2020 for different ESs are discussed in this section. As shown in Table 3 and Figure 4, the mean value of WY increased from 490.18 mm in 2000 to 902.01 mm in 2010. High-value areas are distributed in the southeastern and southern hilly areas; low-value areas are spread in the waters of the Dongting Lake basin. The mean value of WY increased from 902.01 mm in 2010 to 690.10 mm in 2020. High-value areas are sporadically scattered; low-value areas are still distributed in the waters of the Dongting Lake Basin. The average value of CS decreased from 2289.35 t/hm2 in 2000 to 2255.01 t/hm2 in 2010, and the high-value areas are distributed in the hilly areas and the Dongting Lake Basin, while the low-value areas are distributed in the plains. The average value of CS in 2010 decreased from 2255.01 t/hm2 to 2247.46 t/hm2 in 2020. High values are still distributed in the hilly mountainous areas and the Dongting Lake basin; low values are distributed in the built-up areas and part of the waters of the Dongting Lake. The average value of SC in 2000 increased from 1088.32 t/ha2/ha2 to 1822.64 t/ha2/ha2 in 2010. High values are distributed in the mountainous areas at the edges of the study area; low values are distributed in the Dongting Lake basin. The mean value of SC increased from 1088.32 t/ha2 in 2000 to 1822.64 t/ha2/in 2010. High-value areas were distributed in the marginal mountains of the study area; low-value areas were distributed in the watershed of Dongting Lake. The mean value of SC decreased from 1822.64 t/ha2 in 2010 to 626.29 t/ha2 in 2020. High-value areas were distributed in the marginal mountains; low-value areas were distributed in the watershed of Dongting Lake. The mean value of HQ decreased from 0.71 in 2000 to 0.697 in 2010. High-value areas are distributed in the marginal mountains of the study area and in the Dongting Lake Basin; low-value areas are distributed in the urban areas. The mean value of HQ decreased from 0.697 in 2010 to 0.695 in 2020. High-value areas are still distributed in the marginal mountains and the Dongting Lake basin; low-value areas are still distributed in the urban areas. The average value of FS increased from 4740855.49 KJ in 2000 to 6024647.79 KJ in 2010. High-value areas were distributed in the plains and hills of the Dongting Lake basin; low-value areas were distributed in the marginal mountains of the study area and the Dongting Lake Basin. The average value of FS in 2010 increased from 60246447.79 KJ to 7036502.47 KJ in 2020. High-value areas are still distributed in the Dongting Lake Basin. The high-value areas are still distributed in the plains and hills of the Dongting Lake Basin; the low-value areas are still distributed in the mountains at the edge of the study area and in the Dongting Lake Basin.
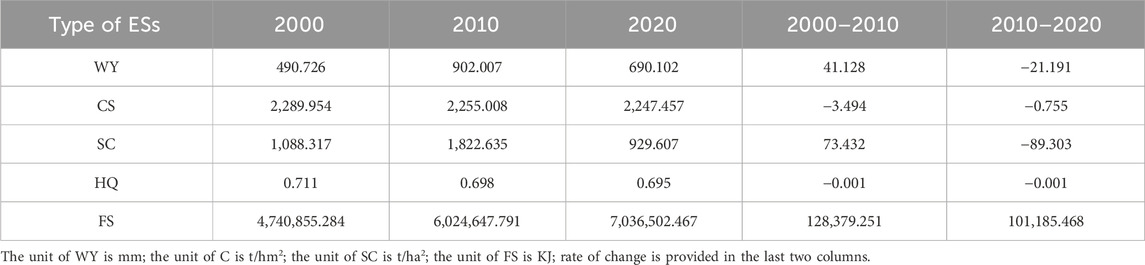
Table 3. Changes in ecosystem services, 2000–2020.
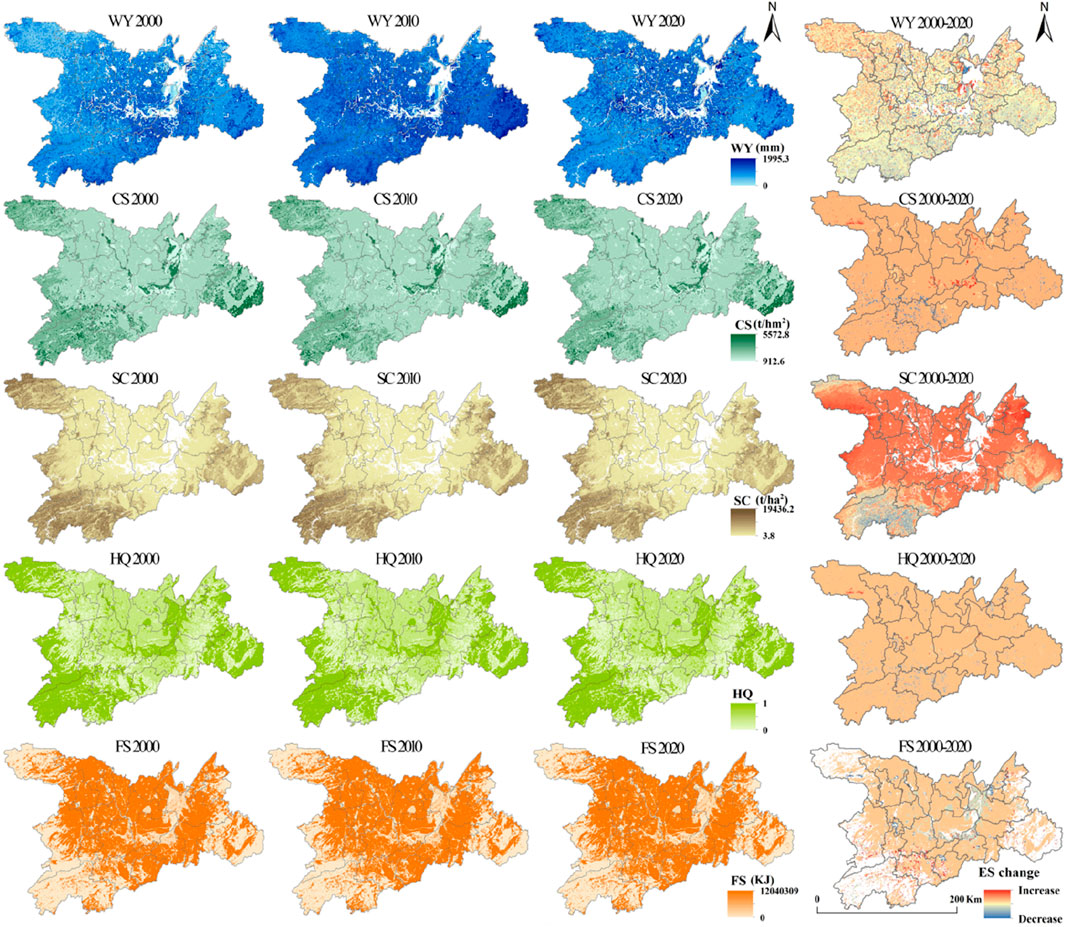
Figure 4. Changes in various types of ecosystem services, 2000–2020.
3.3 Spatial and temporal correlation between LUT and ESs
The regression parameters of TES between and socio-economics are less variable than those between natural ecological factors (Figures 5, 6). The regression coefficients of NDVI ranged from −0.097836 to 0.208317, with the largest changes in regression coefficients and significant spatial heterogeneity. During the period of 2000–2010, 85% of the grids consisted of negative coefficient spaces, whereas the positive coefficient spaces were distributed in the southwest of Dongting Lake; between 2010 and 2020, the proportion of negative coefficient spaces decreased significantly, while positive coefficient spaces were distributed in the east coast, the western basin, and the southern edge of the study area.
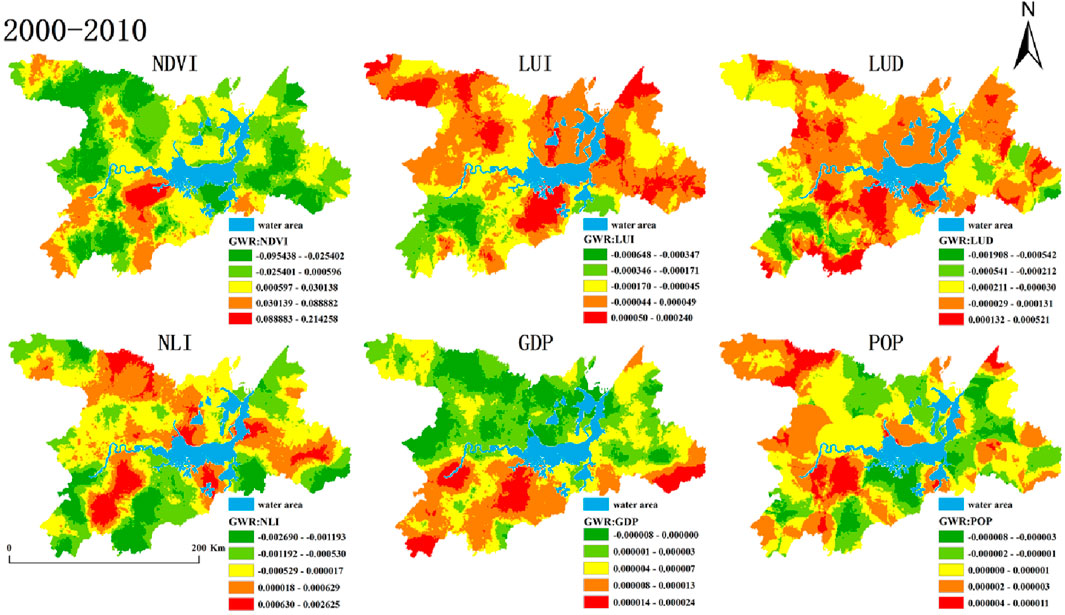
Figure 5. Changes in the coefficients of the role of different influencing factors, 2000–2010.
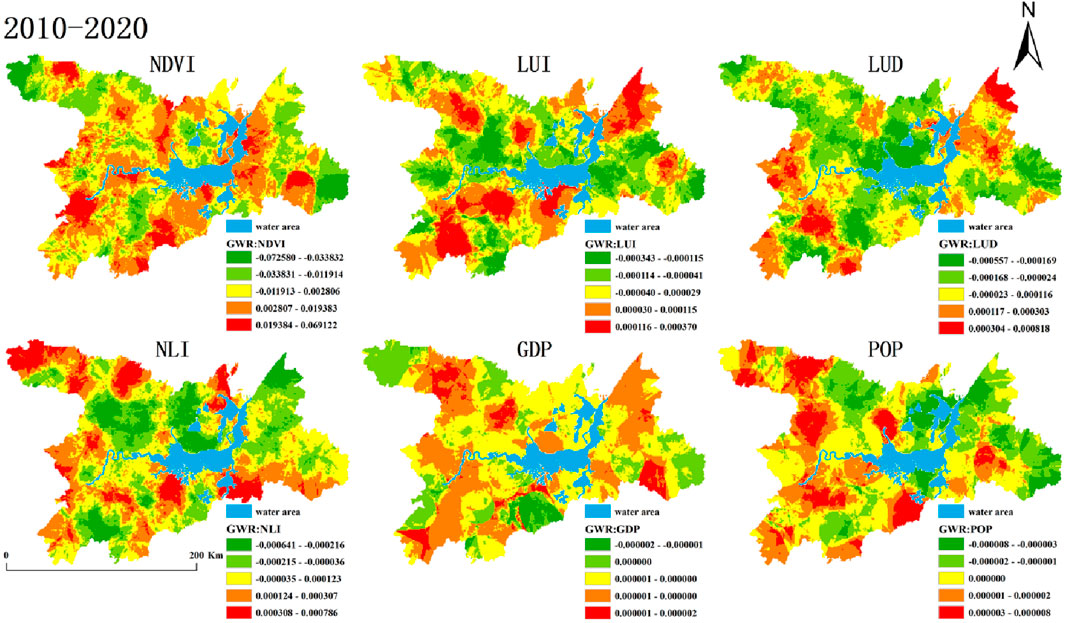
Figure 6. Changes in the coefficients of the role of different influencing factors, 2010–2020.
The regression coefficients of LUD ranged from −0.001908 to 0.000521. The magnitude of the change in the regression coefficients varied slightly, indicating weaker spatial heterogeneity. During 2000–2010, 60% of the grids exhibited negative coefficients, with relatively positive coefficient spaces mainly distributed in the southern part of Dongting Lake, the southwestern edge, and the northwestern part of the study area. However, from 2010 to 2020, the positive coefficient spaces varied significantly, with a substantial increase in the proportion of negative coefficient spaces. Positive coefficient spaces were primarily distributed in the southwestern and northeastern parts of the study area.
Additionally, the regression coefficients of LUI ranged from −0.000593 to 0.000370, showing small variations and weak spatial heterogeneity. Positive coefficients during the period 2000–2010 were predominantly observed in the southern and eastern parts of Dongting Lake, as well as the western and northeastern fringes of the study area. Conversely, for the period 2010–2020, high-value areas were primarily concentrated in the northeastern and southwestern parts of the study area, as well as in the southern basin of Dongting Lake.
The socio-economic data encompass population density, GDP density, and nighttime light data. The regression coefficients of the nighttime light data ranged from −0.002690 to 0.002625. Spatially, during the period from 2000 to 2010, high values were primarily concentrated in the eastern, southern, and northern regions of Dongting Lake, as well as the southern part of the western watershed and the northern edge of the study area. Conversely, in the period from 2010 to 2020, high values shifted to the northern, southeastern, and southwestern parts of Dongting Lake, along with the northwestern and western edges of the study area. For GDP density, the regression coefficients ranged from −0.000008 to 0.000024. During the period 2000–2010, high values were dispersed in the southern part of the study area, while during 2010–2020, they were primarily located toward the northwestern part of Dongting Lake. The regression coefficients of population density ranged from −0.000008 to 0.000011. During the period 2000–2010, high-value areas were mainly distributed in the northwestern part of the study area and the western part of the Dongting Lake basin, whereas during 2010–2020, they shifted to the western and northwestern parts of the study area, as well as the southern part.
4 Discussion
4.1 Impacts of LUT on ESs
The structure of ecosystems (e.g., cropland and woodland) and processes (e.g., habitat quality) in the process of land-use transition are influenced by human-social factors, which aim to maximize human benefits by transforming natural ecosystems (Long and CHEN, 2021). Concurrently, the process of land use transition affects socio-economic characteristics correspondingly, as evidenced by the growth of night-time lighting data, population density, and GDP density, following the expansion of urban construction land (Song, 2017). As depicted in Figure 4, habitat quality and carbon sequestration exhibit a downward trend, while food supply trends upward; soil conservation and water yield services initially increase and then decrease. During the period 2000–2010, the eastern littoral area at northern Dongting Lake experienced a significant land transition. This transformation can be attributed to the implementation of policies related to the return of farmland to the lake and forests in 2002, which reduced the human occupation of land in the lake area. Subsequently, there was an expansion of land for urban construction, aligning with China’s high rate of development during this decade, characterized by rapid growth in urban, rural, and city areas. In the functional spatial layout of ESs, the high-value areas of WY, CS, SC, and HQ were mainly in the mountainous hills at the edge of the study area, and the spatial pattern of the distribution of the high-value areas of FS was mainly in the plains around the Dongting Lake watershed. In the 2000–2020 changes, the ESs showed changes in WY in Dongting Lake waters, a slow decrease in the mean value of HQ, an overall increase in SC, an overall slow decrease in CS, and a gradual increase in FS. The land use overuse pattern is mainly policy-oriented, with obvious changes in DLA unutilized land and high LUD values clustered in the lake area related to the land policy of returning farmland to the lake at that time.
LUT has an impact not only on human life and socioeconomic characteristics but also on the regional spatial environment (Dong et al., 2021). This research used a micro-grid scale to explore the fact that ecosystem services in neighboring regions are strongly correlated. The spillover effect makes land use transitions affect ecosystem services not only within the same region but also in neighboring regions (Feng et al., 2023). This study explores the effects of spatial spillovers on ecosystem service types at a grid scale, with different combinations of influencing factors that enhance the persuasive power of GWR. The results also showed that while sensible land use would enhance ESs in nearby areas, socio-economic development would inevitably lead to an increase in transition intensity. Furthermore, the LUI exhibited a negative spatial correlation with the majority of ESs at the grid scale. After 2013, the area had a sharp increase in both urban and rural development, and as a result of the loss of forest land and the accumulation of rural dwelling land, SC services started to diminish. High-value areas of LUD are primarily concentrated in areas with infrequent human activities, primarily in areas with higher elevation and lower LUI and LUD. In contrast, the distribution pattern of high-value areas of SC is different. These areas, including LUD, have a negative correlation with SC and a more homogeneous land structure with more intact soil, primarily composed of forested land.
4.2 Implications for LUT
From 2000 to 2010, the central and northern parts of Dongting Lake witnessed dramatic areas of land-use transformation, mainly in the form of the transfer of arable land to construction land and forest land, leading to a decline in the regional capacity to supply ecosystem services. From 2010 to 2020, the transformation of the Dongting Lake region was reduced, with the spread of aggregation from urban areas to peri-urban areas. In the future, the land use transformation of the Dongting Lake area will take land consolidation, reclamation, development, and urban and rural construction land increase/decrease linkage as a platform to promote the comprehensive improvement of fields, water, mountains, forests, and villages; control the proportion of arable land and forest land transferring to construction land; and enhance the sustainability of the land use structure (Gomersall, 2021). How to enhance ecosystem services through effective land management is a key issue for the sustainable development of Dongting Lake (Griggs et al., 2013). Different ecosystem service types showed different trends of change, except for FS and WY, which showed a decreasing trend. Among them, in terms of carbon stock and habitat quality, among different land use types, forest land was the main contributor to CS in the study area, while the expansion of construction land was the main reason for the decrease in CS. Therefore, the protection and restoration of forest ecosystems should be strengthened in the Dongting Lake area. For soil and water conservation, slope and vegetation cover in natural conditions determine the ability of soil and water conservation, and since the slope length is not easy to change, improving the vegetation cover on the ground surface can weaken the influence of slope length on soil erosion and reduce the spatial heterogeneity of soil erosion. When carrying out soil erosion control, corresponding soil erosion control measures can be formulated for the dominant factors of erosion differentiation in different regions. In terms of food production, arable land should be further protected, the scale of high-standard farmland should be expanded, and at the same time, agricultural production technology should be upgraded. In terms of water production, water ecology monitoring should be strengthened, wetland shrinkage and degradation should be controlled, and ecological restoration projects for wetland protection should be carried out. Overall, the Dongting Lake area needs to improve rural production, living conditions, and ecological environment and promote the development of large-scale agricultural management, centralized population living, and industrial agglomeration so as to mitigate the impacts of human activities and climate change on ecosystem services and improve the sustainability of the land space in the Dongting Lake area.
4.3 Shortcomings and future study
To explore the impact of LUT on the spatial and temporal changes in ecosystem services, this paper selected GWR to reflect the partial spatial characteristics. Among them, mountainous areas and waters are intuitively more sensitive than built-up areas, causing variations in ecosystem services related to carbon sequestration and water yield services different from other areas. This, in turn, affects the median values of the corresponding coefficients of variation, which are usually used to characterize the overall GWR results (Chen et al., 2019). Future studies should refine the limitations to quantitative methods, owing to data accuracy. For example, this study measured five types of ecosystem services, which cannot fully reflect the regional ecosystem pattern. In addition, factors such as ecological protection policies should be considered in the future to improve the mechanism of ecosystem service changes.
5 Conclusion
In this paper, the Dongting Lake Ecological and Economic Zone serves as the focal point of our investigation, utilizing remote sensing images from 2000, 2010, and 2020 as primary data sources. Employing grid analysis alongside InVEST and GWR models, we examine the repercussions of LUT on ESs within the study area, spanning from 2000 to 2020. The principal conclusions are outlined as follows:
During the period 2000–2020, the rapid expansion of construction land in the study area led to a significant LUT. The result demonstrates that the mean value of intensity changed from 237.99 in 2000 to 238.92 in 2020. In particular, the high intensity of LUT is mainly distributed around the Dongting Lake Basin, while the low intensity is mainly distributed in the mountainous areas at the edge of the area. Additionally, the dynamics of LUT changed from 5.58 in 2000–2010 to 5.62 in 2010–2020. Among them, the high dynamics in 2000–2010 were mainly distributed in the coastal areas in the northeastern part of Dongting Lake and urban construction areas. On the other hand, the high dynamics in 2010–2020 were mainly located on the outskirts of cities and rural areas.
Different types of ecosystem services displayed spatial and temporal heterogeneity. To be specific, carbon sequestration services, habitat quality services, and soil conservation have similar spatial characteristics, and the high values are primarily distributed in high-elevation mountain areas. In contrast, food production services presented the opposite features, with high values mainly distributed in plain areas. Soil conservation declined first and then ascended. The low value of water services is related to the distribution of watersheds.
There are differences in the factors that influence ecosystem services in different periods. Compared with 2010–2020, NDVI coefficients had the largest value of change in 2000–2010 and the strongest impact on ecosystem services. Notably, the high values in 2000–2010 converge on the west side of Dongting Lake, while the high-value areas in 2010–2020 are scattered all over the research area. Furthermore, LUI and LUD had more grids with high values in 2000–2010, but the number of grids with high values decreased in 2010–2020. The NLI has a higher impact coefficient in the high-value range of 2000–2010 compared to 2010–2020. However, GDP and POP have the smallest coefficients, implying that they have the lowest explanatory validity compared to other impact factors. The findings have significant implications for understanding the relationship and evolutionary processes between land use transition and ecosystem services.
Data availability statement
The original contributions presented in the study are included in the article/Supplementary Material; further inquiries can be directed to the corresponding author.
Author contributions
XS: conceptualization, methodology, software, supervision, validation, and writing–original draft. QN: funding acquisition, project administration, validation, and writing–original draft. ZL: software, supervision, validation, visualization, and writing–original draft.
Funding
The author(s) declare that financial support was received for the research, authorship, and/or publication of this article. This research was funded by the “Hunan Provincial Natural Science Foundation Project” (No. 2022JJ50271).
Conflict of interest
The authors declare that the research was conducted in the absence of any commercial or financial relationships that could be construed as a potential conflict of interest.
Publisher’s note
All claims expressed in this article are solely those of the authors and do not necessarily represent those of their affiliated organizations, or those of the publisher, the editors, and the reviewers. Any product that may be evaluated in this article, or claim that may be made by its manufacturer, is not guaranteed or endorsed by the publisher.
References
Bai, Y., Chen, Y., Alatalo, J. M., Yang, Z., and Jiang, B. (2020). Scale effects on the relationships between land characteristics and ecosystem services - a case study in Taihu Lake Basin. China. Sci. Total Environ. 716, 137083. doi:10.1016/j.scitotenv.2020.137083
Banks-Leite, C., Ewers, R. M., Folkard-Tapp, H., and Fraser, A. (2020). Countering the effects of habitat loss, fragmentation, and degradation through habitat restoration. One Earth 3, 672–676. doi:10.1016/j.oneear.2020.11.016
Buckley Biggs, N. (2022). Drivers and constraints of land use transitions on Western grasslands: insights from a California mountain ranching community. Landsc. Ecol. 37, 1185–1205. doi:10.1007/s10980-021-01385-6
Burton, M. L., Samuelson, L. J., and Mackenzie, M. D. (2009). Riparian woody plant traits across an urban–rural land use gradient and implications for watershed function with urbanization. Landsc. And Urban Plan. 90, 42–55. doi:10.1016/j.landurbplan.2008.10.005
Cao, S., Liu, Z., Li, W., and Xian, J. (2021a). Balancing ecological conservation with socioeconomic development. Ambio 50, 1117–1122. doi:10.1007/s13280-020-01448-z
Cao, Y., Kong, L., Zhang, L., and Ouyang, Z. (2021b). The balance between economic development and ecosystem service value in the process of land urbanization: a case study of China’s land urbanization from 2000 to 2015. Land Use Policy 108, 105536. doi:10.1016/j.landusepol.2021.105536
Chen, W., Chi, G., and Li, J. (2019). The spatial association of ecosystem services with land use and land cover change at the county level in China, 1995–2015. Sci. Total Environ. 669, 459–470. doi:10.1016/j.scitotenv.2019.03.139
Cong, W., Sun, X., Guo, H., and Shan, R. (2020). Comparison of the SWAT and InVEST models to determine hydrological ecosystem service spatial patterns, priorities and trade-offs in a complex basin. Ecol. Indic. 112, 106089. doi:10.1016/j.ecolind.2020.106089
de Groot, R. (2006). Function-analysis and valuation as a tool to assess land use conflicts in planning for sustainable, multi-functional landscapes. Landsc. And Urban Plan. 75, 175–186. doi:10.1016/j.landurbplan.2005.02.016
Dong, J. H., Zhang, Z. B., Da, X. J., Zhang, W. B., and Feng, X. L. (2021). Eco-environmental effects of land use transformation and its driving forces from the perspective of "production-living-ecological" spaces: a case study of Gansu Province. Acta Ecol. Sin. 41 (15), 5919–5928. doi:10.5846/stxb201909201969
El-Naggar, A., Zhou, R., Tang, R., Hur, J., Cai, Y., and Chang, S. X. (2022). Rice husk and its biochar have contrasting effects on water-soluble organic matter and the microbial community in a bamboo forest soil. Land 11, 2265. doi:10.3390/land11122265
Feng, X., Li, Y., Wang, X., Yang, J., Yu, E., Wang, S., et al. (2023). Impacts of land use transitions on ecosystem services: a research framework coupled with structure, function, and dynamics. Sci. Total Environ. 901, 166366. doi:10.1016/j.scitotenv.2023.166366
Gomersall, K. (2021). Governance of resettlement compensation and the cultural fix in rural China. Environ. Plan. A 53, 150–167. doi:10.1177/0308518x20926523
Griggs, D., Stafford-Smith, M., Gaffney, O., Rockström, J., Öhman, M. C., Shyamsundar, P., et al. (2013). Sustainable development goals for people and planet. Nature 495, 305–307. doi:10.1038/495305a
Hasan, S. S., Zhen, L., Miah, M. G., Ahamed, T., and Samie, A. (2020). Impact of land use change on ecosystem services: a review. Environ. Dev. 34, 100527. doi:10.1016/j.envdev.2020.100527
Jiang, L., and Zeng, Z. (2024). Analysis of flood water level variation in the yichang–chenglingji reach of the Yangtze River after three gorges project operation. Water 16, 841. doi:10.3390/w16060841
Jie, N., Cao, X., Chen, J., and Chen, X. (2023). A new method for identifying the central business districts with nighttime light radiance and angular effects. Remote Sens. 15, 239. doi:10.3390/rs15010239
Keyes, A. A., McLaughlin, J. P., Barner, A. K., and Dee, L. E. (2021). An ecological network approach to predict ecosystem service vulnerability to species losses. Nat. Commun. 12, 1586–1611. doi:10.1038/s41467-021-21824-x
Kleijn, D., Kohler, F., B´ aldi, A., Bat´ ary, P., Concepci´on, E. D., Clough, Y., et al. (2009). On the relationship between farmland biodiversity and land-use intensity in Europe. Proc. R. Soc. B 276, 903–909. doi:10.1098/rspb.2008.1509
Li, P., Zuo, D., Xu, Z., Zhang, R., Han, Y., Sun, W., et al. (2021). Dynamic changes of land use/cover and landscape pattern in a typical alpine river basin of the Qinghai-Tibet Plateau, China. Land Degrad. Dev. 32, 4327–4339. doi:10.1002/ldr.4039
Li, S., Jiang, C., Ma, Y., and Li, C. (2023). Spatiotemporal analysis of hydrometeorological factors in the source region of the dongting Lake Basin, China. Atmosphere 14, 1793. doi:10.3390/atmos14121793
Liu, C., Deng, C., Li, Z., and Liu, Y. (2022). Response characteristics of soil erosion to spatial conflict in the production-living-ecological space and their DrivingMechanism: a case study of dongting Lake Basin in China. Land 11, 1794. doi:10.3390/land11101794
Liu, C., Liu, Y., Giannetti, B. F., Almeida, C. M. V. B., Sevegnani, F., and Li, R. (2023). Spatiotemporal differentiation and mechanism of anthropogenic factors affecting ecosystem service value in the Urban Agglomeration around Poyang Lake, China. Ecol. Indic. 154, 110733. doi:10.1016/j.ecolind.2023.110733
Liu, J. Y. (1996). The macro investigation and dynamic research of the resource and environment. Beijing: China Science and Technology Press.
Long, H., and Chen, K. (2021). Urban-rural integrated development and land use transitions: a perspective of land system science. Acta Geogr. Sin. 76 (2), 295–309. doi:10.11821/dlxb202102004
Ma, L., Liu, H., Peng, J., and Wu, J. (2017). A review of ecosystem services supply and demand. Acta Geogr. Sin. 72 (7), 1277–1289. doi:10.11821/dlxb201707012
Ning, Q., and Ouyang, X. (2023). Spatio-temporal characteristics and mechanism of ecological degradation in a hilly southern area—a case study of Dong ting Lake Basin. Environ. Sci. Pollut. Res. 30, 45274–45284. doi:10.1007/s11356-023-25514-7
Ouyang, X., Wang, K., and Wei, X. (2022). The impact of the correlation between urban and rural construction land on ecosystem services: a case study of Dong ting Lake area. J. Acta Ecol. Sin. (21), 8713–8722. doi:10.5846/stxb202110182937
Qi, Y., Wang, R., Shen, P., Ren, S., and Hu, Y. (2023). Impacts of land use intensity on ecosystem services: a case study in harbin city, China. Sustainability 15, 14877. doi:10.3390/su152014877
Sancho Santos, M. E., Eva, Š., Pavel, H., and Christoph, S. (2021). Comment on “Diluted concentrations of methamphetamine in surface water induce behavior disorder, transgenerational toxicity, and ecosystem-level consequences of fish” by Wang et al. [Water Research 184 (2020) 116-164]. Water Res. 197, 117007. doi:10.1016/j.watres.2021.117007
Shi, Y., Feng, C.-C., Yu, Q., and Guo, L. (2021). Integrating supply and demand factors for estimating ecosystem services scarcity value and its response to urbanization in typical mountainous and hilly regions of south China. Sci. Total Environ. 796, 149032. doi:10.1016/j.scitotenv.2021.149032
Song, X., Liu, Y., Zhu, X., Cao, G., Chen, Y., Zhang, Z., et al. (2022). The impacts of urban land expansion on ecosystem services in Wuhan, China. Environ. Sci. Pollut. Res. 29, 10635–10648. doi:10.1007/s11356-021-16419-4
Terrado, M., Sabater, S., Chaplin-Kramer, B., Mandle, L., Ziv, G., and Acuña, V. (2016). Model development for the assessment of terrestrial and aquatic habitat quality in conservation planning. Sci. Total Environ. 540, 63–70. doi:10.1016/j.scitotenv.2015.03.064
Wang, Y., Dai, E., Yin, L., and Ma, L. (2018). Land use/land cover change and the effects on ecosystem services in the Hengduan Mountain region, China. Ecosyst. Serv. 34, 55–67. doi:10.1016/j.ecoser.2018.09.008
Wang, Z., Fu, H., Liu, H., and Liao, C. (2023a). Urban development sustainability, industrial structure adjustment, and land use efficiency in China. Sustain. Cities Soc. 89, 104338. doi:10.1016/j.scs.2022.104338
Wang, Z., Wan, D., Liao, J., Lv, J., Wu, F., and Wang, L. (2023b). Ecological environment effect and driving factors of transformation of“Production-Living-Eco-logical Space”in Dong ting Lake eco-economic zone. J. Sci. Technol. Eng. 23 (9), 3876–3888. doi:10.12404/j.issn.1671-1815.2023.23.09.03876
Wei, P., Chen, S., Wu, M., Deng, Y., Xu, H., Jia, Y., et al. (2021). Using the InVEST model to assess the impacts of climate and land use changes on water yield in the upstream regions of the shule River Basin. Water 13, 1250. doi:10.3390/w13091250
Wen, L., Chatalova, L., Butsic, V., Hu, F. Z., and Zhang, A. (2020). Capitalization of land development rights in rural China: a choice experiment on individuals’ preferences in peri-urban Shanghai. Land Use Policy 97, 104803. doi:10.1016/j.landusepol.2020.104803
Wentland, S. A., Ancona, Z. H., Bagstad, K. J., Boyd, J., Hass, J. L., Gindelsky, M., et al. (2020). Accounting for land in the United States: integrating physical land cover, land use, and monetary valuation. Ecosyst. Serv. 46, 101178. doi:10.1016/j.ecoser.2020.101178
Williams, J. R., Jones, C. A., and Dyke, P. T. (1984). A modeling approach to determining the relationship between erosion and soil productivity. Trans. ASAE. 27, 129–144.doi:10.13031/2013.32748
Xiang, H., Zhang, J., Mao, D., Wang, Z., Qiu, Z., and Yan, H. (2022). Identifying spatial similarities and mismatches between supply and demand of ecosystem services for sustainable Northeast China. Ecol.Indic. 134, 108501. doi:10.1016/j.ecolind.2021.108501
Xu, D. X., Wu, F., He, L. H., Liu, H. J., and Jiang, Y. (2019). Impact of land use change on ecosystem services: case study of the Zhangjiakou-Chengde area. Acta Ecol. Sin. 39 (20), 7493–7501. doi:10.5846/stxb201810072163
Yang, J., Zeng, C., and Cheng, Y. (2020). Spatial influence of ecological networks on land use intensity. Sci. Total Environ. 717, 137151. doi:10.1016/j.scitotenv.2020.137151
Yang, Q., Duan, X., Wang, L., and Jin, Z. (2018). Land use transformation and ecological environment effect based on "Three-life space": a case study of the core area of the Yangtze River Delta. Sci. Geogr. Sin. 38 (01), 97–106. doi:10.13249/j.cnki.sgs.2018.01.011
Yu, C., Zhang, Z., Jeppesen, E., Gao, Y., Liu, Y., Liu, Y., et al. (2024). Assessment of the effectiveness of China’s protected areas in enhancing ecosystem services. Ecosyst. Serv. 65, 101588. doi:10.1016/j.ecoser.2023.101588
Zhao, Y., Luo, J., Li, T., Chen, J., Mi, Y., and Wang, K. (2023). A framework to identify priority areas for restoration: integrating human demand and ecosystem services in Dongting Lake eco-economic zone, China. Land 12, 965. doi:10.3390/land12050965
Zhou, Y., Li, X., and Liu, Y. (2020). Land use change and driving factors in rural China during the period 1995-2015. Land Use Policy 99, 105048. doi:10.1016/j.landusepol.2020.105048
Keywords: ecosystem service, Dongting Lake area, land use transitions, InVEST model, geographically weighted regression
Citation: Xuan S, Qimeng N and Zhigang L (2024) Impacts of the land use transition on ecosystem services in the Dongting Lake area. Front. Environ. Sci. 12:1422989. doi: 10.3389/fenvs.2024.1422989
Received: 25 April 2024; Accepted: 01 July 2024;
Published: 23 July 2024.
Edited by:
Xue-Chao Wang, Beijing Normal University, ChinaReviewed by:
Siyun Chen, Hunan University of Finance and Economics, ChinaGuoen Wei, Nanchang University, China
Peng Cao, Henan University of Technology, China
Copyright © 2024 Xuan, Qimeng and Zhigang. This is an open-access article distributed under the terms of the Creative Commons Attribution License (CC BY). The use, distribution or reproduction in other forums is permitted, provided the original author(s) and the copyright owner(s) are credited and that the original publication in this journal is cited, in accordance with accepted academic practice. No use, distribution or reproduction is permitted which does not comply with these terms.
*Correspondence: Lei Zhigang, 13077341678@163.com