 Heng Zhou
 Mingdong Tang
 Jun Huang3
- 1School of Urban Construction, Wuhan University of Science and Technology, Wuhan, China
- 2Hubei Engineering Research Center of Urban Renewal, Wuhan, China
- 3College of Digital Construction and Blasting Engineering, Jianghan University, Wuhan, China
- 4School of Urban Design, Wuhan University, Wuhan, China
- 5Wuhan Design Consultation Group Co., Ltd, Wuhan, China
The Jianghan Plain is simultaneously responsible for ecological protection, food security and urbanization, and land use conflicts are prominent. Revealing the driving mechanism of land use/cover change (LUCC) and simulating the land use pattern can help to coordinate the land use conflicts in the future. Utilizing the National Land Survey Data (NLSD) of Jiangling County in Jianghan Plain (2011–2020) and the patch-generating land use simulation (PLUS) model, this paper analyzed the characteristics of land use evolution, applied the random forest classification (RFC) to analyze the driving mechanism, simulated the 2035 land use pattern under three scenarios of natural development, planning guidance and ecological protection through Markov and Cellular Automaton based on multiple random seeds (CARS) models, and proposed several countermeasures. The study found that: 1) From 2011 to 2020, town construction land increased, village construction land, agricultural land and ecological land decreased. 2) The factors driving LUCC were socio-economic factors, spatial factors, and natural factors in descending order. 3) In the three scenarios, the trend of construction land expansion, agricultural land and ecological land encroachment is inevitable by 2035. 4) It is imperative to actively advocate for large-scale mechanization and informatization of agricultural production, encourage the repurposing of idle and inefficiently used construction land, facilitate multi-purpose land utilization, and implement a policy of locally balancing occupation and compensation for cultivated and ecological land. 5) When employing the PLUS model to simulate LUCC, using continuous NLSD yielded more accurate results than remote sensing image interpretation data. This study offers a theoretical basis for the coordinated development of land use in Jianghan Plain, and presents a method to enhance the simulation accuracy of the PLUS model.
1 Introduction
China has achieved globally recognized successes in economic development and urbanization, leading to a swift expansion of construction land. Consequently, ecological and agricultural lands are experiencing encroachment, and land use conflicts are gaining prominence. Land use/cover change (LUCC) is the most direct effect of the joint action of mankind and the earth (Sterling et al., 2013; Liu H. et al., 2020), and it is the comprehensive reflection of the land use type over time in the regional space. Analyzing the driving mechanisms of LUCC can reveal the influence of natural, socio-economic, spatial and other elements on LUCC. Simulating LUCC can help identify potential land use problems. Combining problems and mechanisms, targeted land management strategies can be proposed to promote sustainable development.
In recent years, scholars have extensively explored LUCC, examining it through the lenses of remote sensing monitoring (Vu et al., 2022), simulation prediction (Zhou L. et al., 2020), hydrological impacts (Zhang et al., 2020), soil quality (Li et al., 2023), and food security (Guo et al., 2023). Their efforts have yielded substantial outcomes. Regarding research content, the focus lied on change characteristics (Ning et al., 2018), landscape patterns (Bindajam et al., 2023), impact mechanisms (Zhou Y. et al., 2020), and modelling predictions (Han et al., 2023). In terms of research scales, most studies operated at macro (Winkler et al., 2021; Guo et al., 2023) and meso (Liang J. et al., 2021; Jiang et al., 2023; Zeng et al., 2023) scales, encompassing global, national, provincial, watershed, urban agglomeration, and municipal levels. However, there was a dearth of research at the county level (Deng and Quan, 2023). In terms of basic data, previous studies predominantly relied on discrete remote sensing image data or decentralized annual NLSD (Wu Q. et al., 2022; Chen and Yao, 2023). In terms of research methodology, previous LUCC studies primarily employed the land use transfer matrix and land use dynamics for fundamental analysis (Wang Y. et al., 2023), utilized geoprobes and CLUE-S model to drive the analysis (Ning et al., 2018; Li et al., 2023), and conducted simulation predictions based on models such as CA, CA-Markov, FLUS (Lv et al., 2021; Niu and Pan, 2021; Wu et al., 2021; Wu J. et al., 2022; Wen et al., 2023; Zhang et al., 2023) and PLUS (Liang et al., 2021b; Liang et al., 2021c; Xu D. et al., 2022; Fan et al., 2023; Kou et al., 2023; Tian et al., 2023; Zeng et al., 2023). With the advancement of 3S (RS, GIS, and GPS) technology, the integration of remote sensing monitoring and various associated models is increasingly prevalent in LUCC studies (Lv et al., 2021).
Overall, despite the fruitful research results on LUCC, there are still deficiencies. Firstly, the research content primarily focuses on specific aspects such as change characteristics, landscape patterns, influence mechanisms, and simulation predictions. The comprehensive closed-loop research approach of change characteristics-driving mechanisms-simulation predictions-policy suggestions is seldom employed. Secondly, the research scale is predominantly concentrated at the macro and meso scales, with insufficient attention given to the micro scale, particularly the county space, which serves as the most basic administrative unit in the national spatial governance system. Thirdly, the basic data are less based on the NLSD of consecutive years, and the classification of land classes is not detailed enough, requiring improvements in the accuracy of research results. Fourthly, certain research methods exhibit limitations. For instance, the Geodetector and CLUE-S model can only analyze individual data. Although the CA model can simulate spatial changes in complex systems, its prediction accuracy is restricted. While the CA-MarKov model and the FLUS model can simulate multi-scenarios, multi-scale, and high-precision complex land-use change, they struggle to reflect relevant driving mechanisms. In contrast, the PLUS model excels in revealing driving mechanisms and conducting multi-scenario, multi-scale, and high-precision simulations.
The Jianghan Plain is a crucial component of the Yangtze River Basin, tasked with the significant responsibility of upholding ecological security. It stands as one of China’s primary grain-producing regions and serves as the origin of permanent basic farmland. Simultaneously, its riverfront cities play a pivotal role in urbanization. Therefore, this area has become one of the most prominent areas of land use conflicts. Consequently, this study focused on representative counties in the Jianghan Plain. Utilizing continuous NLSD from 2011 to 2020, this study employed the PLUS model to analyze the driving mechanism and simulate the land use development pattern in 2035 under three scenarios of natural development, planning guidance and ecological protection. Additionally, it offered policy suggestions for the rational allocation of land resources in the Jianghan Plain.
2 Materials and methods
2.1 Study area
Situated in the middle reaches of the Yangtze River, the middle and lower stretches of the Han River, and the south-central region of Hubei Province, the Jianghan Plain extends from Yichang Zhijiang in the west to Wuhan in the east. It connects with Zhongxiang in the north and the Dongting Lake Plain in the south. Spanning between 29°26′-31°37′north latitude and 111°14′-114°36′east longitude, it encompasses an area exceeding 46,000 km2. The study focused on Jiangling County, representing a typical county in the Jianghan Plain (Figure 1). Positioned in the center of the Jianghan Plain, Jiangling County is situated between 112°12'52″-112°44′22″east longitude and 29°54'36″-30°16′45″north latitude, west of the Yangtze River. Jiangling County falls within the north subtropical monsoon humid climate zone, experiencing simultaneous rainfall and high temperatures during the same season, with an annual average rainfall ranging from 900 to 1,100 mm. The elevation ranges between 25.3 and 40 m, featuring four types of landforms: island flat, silt flat, intermediate flat, and low wet flat. The total area covers 1,048.74 km2, with a permanent population of 300.01 million in 2021.

Figure 1. Location of study area.
2.2 Data and preconditioning
The research encompassed land use data, natural environment data, spatial accessibility data, and socio-economic data (Table 1). Land use data, spatial accessibility data, elevation, slope, slope direction, and soil type data were obtained from the NLSD conducted by the Jiangling County Natural Resources and Planning Bureau. The average annual temperature, average annual precipitation, and average land GDP were sourced from the Data Center for Resources and Environmental Sciences, Chinese Academy of Sciences (https://www.resdc.cn/). Population density data were obtained from the Jiangling County Statistics Bureau.
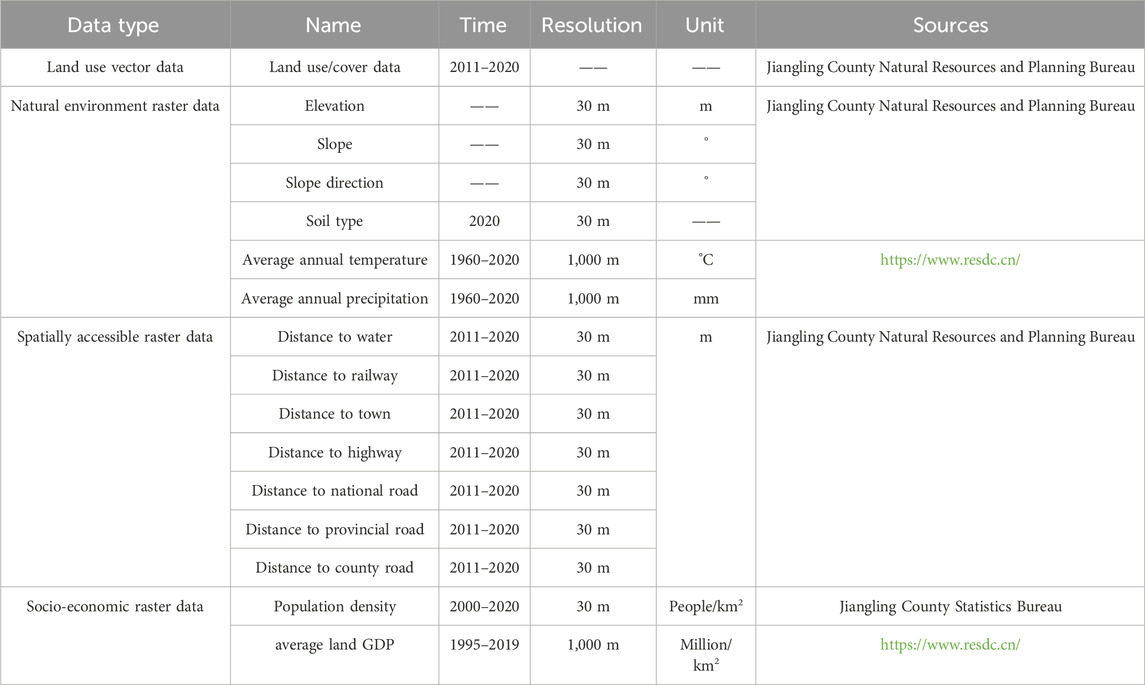
Table 1. Data details.
Typically, land use data derived from remote sensing images are categorized into six categories, namely, cultivated land, forest, grassland, water, construction land, and unused land (Chang et al., 2010; Xu C. et al., 2023; Fan et al., 2023). To enhance the study’s precision, we utilized land change survey data, integrating it with the land use classification from the second (2009–2018) and third (2019 to date) LUCC surveys in China. The land use types were then classified into ten categories, encompassing grassland, towns and villages, special, cultivated, industrial and mining, transportation, forest, other, water, and garden (Table 2).
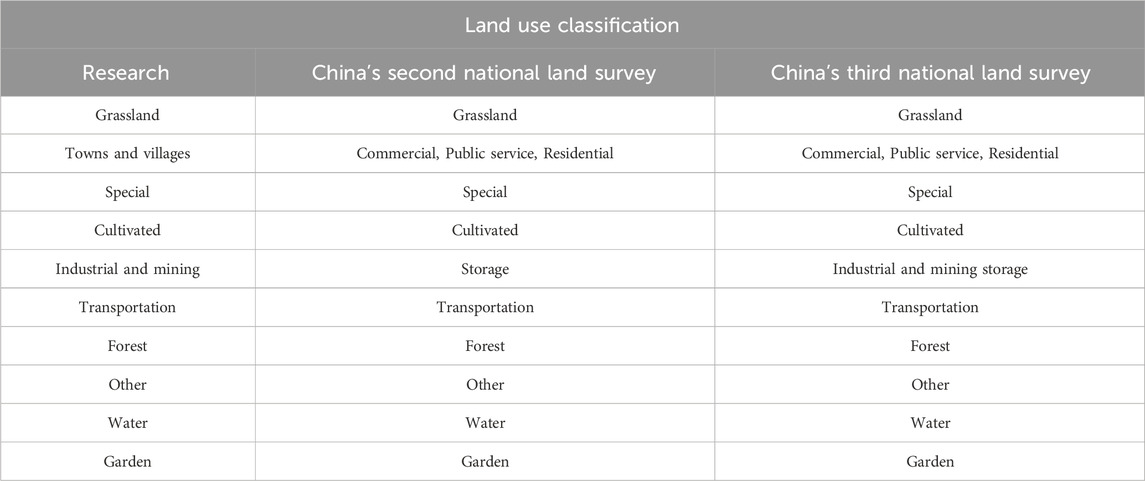
Table 2. The corresponding relation of land use classification.
2.3 Methodology
2.3.1 Research framework
Employing the PLUS model, this study analyzed and forecasted LUCC through the framework of change characteristics, driving mechanisms, simulation predictions, and policy suggestions (Figure 2). Initially, the trend research method and dynamics of LUCC were used to analyze the overarching structural evolution characteristics. Additionally, the transfer matrix was utilized to examine the transformation traits of land classes over the years, while the landscape pattern index was employed to scrutinize the spatial pattern evolution characteristics. Subsequently, various driving factors were chosen from socio-economic, spatial, and natural environmental aspects. Using RFC, the contribution degree of each driving factor and the development probability of each land category were calculated to summarize the driving mechanisms. Thirdly, leveraging the driving mechanisms and development probabilities of each category, the Markov model was employed to determine the initial simulation year and forecast the land use demand under three scenarios: natural development, planning guidance, and ecological protection. Furthermore, the CARS model was utilized to simulate the spatial distribution of land use in 2035 across the three scenarios. Lastly, the differences between the simulations of the scenarios were compared and analysed, and policy recommendations were formulated.
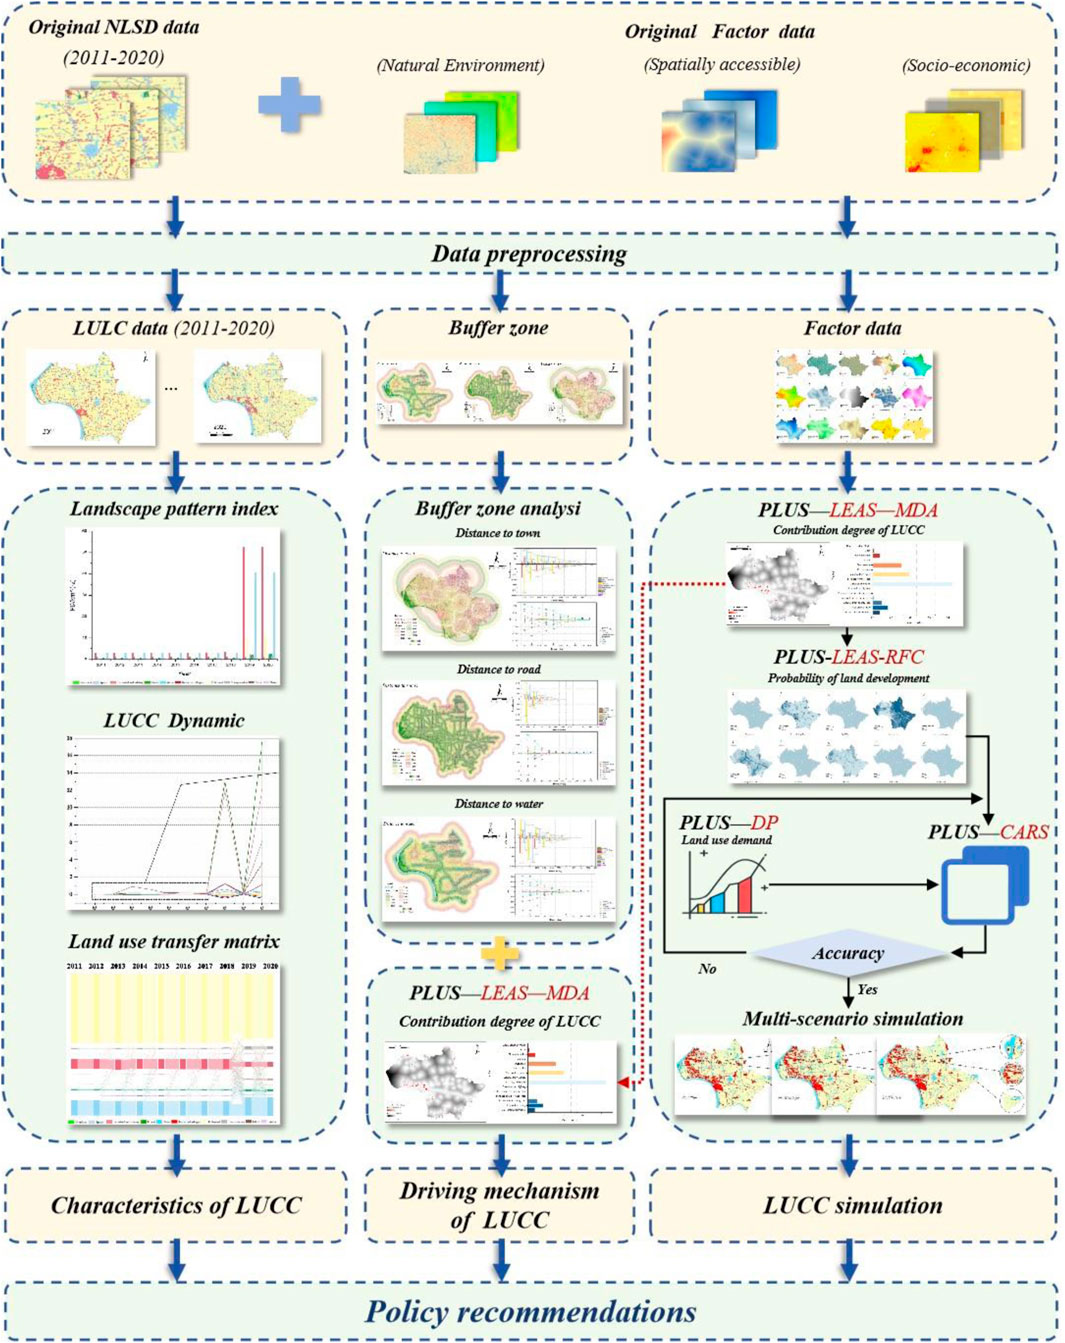
Figure 2. Research framework.
2.3.2 The PLUS model
The PLUS model contains several modules such as Land expansion analysis strategy (LEAS), Demand Projection (DP), CA based on multiple random seeds (CARS), and Confusion Matrix and FoM (CMF) (Liang et al., 2021b).
2.3.2.1 LEAS
The Mean Decrease Accuracy (MDA) in RFC is used to represent the contribution degree of driving factors. The method is to randomly swap a factor in the permuted oob data, then reroute the predictions and calculate how much accuracy has fallen. The algorithm is presented in Eq. 1.
where
The RFC algorithm is employed to excavate the land use expansion and driving factors one by one. Ultimately, it determines the probability of the occurrence of k land-use types on cell I. The algorithm is presented in Eq. 2.
where d takes the value range of 0 or one; if d = 1, it means that there are other land use types transformed into k land use types; when d = 0, it means that the land use types are transformed into other land use types except k; x is a vector consisting of a number of driving force factors; i is the indicator function of the set of decision trees; hn(x) is the predicted type of the nth decision tree of the vector x; M is the total number of decision trees.
2.3.2.2 DP
The Markov model was employed to simulate the projected land demand under different development scenarios with the algorithm shown in Eq. 3.
where
2.3.2.3 CARS
The CARS module integrates the CA model, stochastic seed generation mechanism and threshold decreasing mechanism to simulate future land use data. Under the constraint of the growth probability of each land use type, the overall probability of each land use type is calculated, and the spatial distribution results are obtained by combining the land quantity prediction results, land use cost transfer matrix and neighbourhood weights. The algorithm is shown in Eqs 4, 5.
where
2.3.2.4 CMF
The CMF includes Kappa coefficient, FoM coefficient, and Overall accuracy. The Kappa coefficient combines mapping accuracy with user accuracy and is a test of consistency between data prediction results and monitoring results. The algorithm is shown in Eq. 6.
where
The FoM coefficient is able to test the variation of the spatial location of the predicted results. The algorithm is shown in Eq. 7.
where A is the error region where the land use type actually changes and is predicted to be unchanged; B indicates the region where the prediction is correct; M is the error region where the land use type is incorrectly predicted; and M indicates the error region where the land use type actually does not change and is predicted to be changed; The FoM coefficient value has a range of 0–1, and the FoM value for land use prediction is usually in the range of 0.12–0.18 (Liang et al., 2021b; Liang et al., 2021c), with the larger value indicates that the simulation results are more reliable.
The Overall accuracy represents the percentage of the total sample that predicted correctly. The algorithm is shown in Eq. 8.
where OA is the Overall accuracy; TP is the number of positive cases of successful prediction; FP is the number of positive cases of failed prediction; FN is the number of negative cases of failed prediction; TN is the number of negative cases of successful prediction.
2.3.3 Landscape pattern index
Landscape pattern index can highly effectively reflect the landscape pattern information, presenting the landscape composition and spatial distribution of the current status and changes in the study area through different levels of landscape indicators. In this study, relying on existing research outcomes (Li L. et al., 2022; Wang et al., 2023b) and prioritizing clarity, representativeness, and consistency, we selected landscape pattern indices at both the patch type and landscape levels for analysis. A total of nine landscape pattern indexes were selected (Table 3), and in order to ensure the accuracy of the data in this study, the analyses were carried out with the image sizes of “5m*5m” and “30m*30m”, respectively, through continuous debugging.
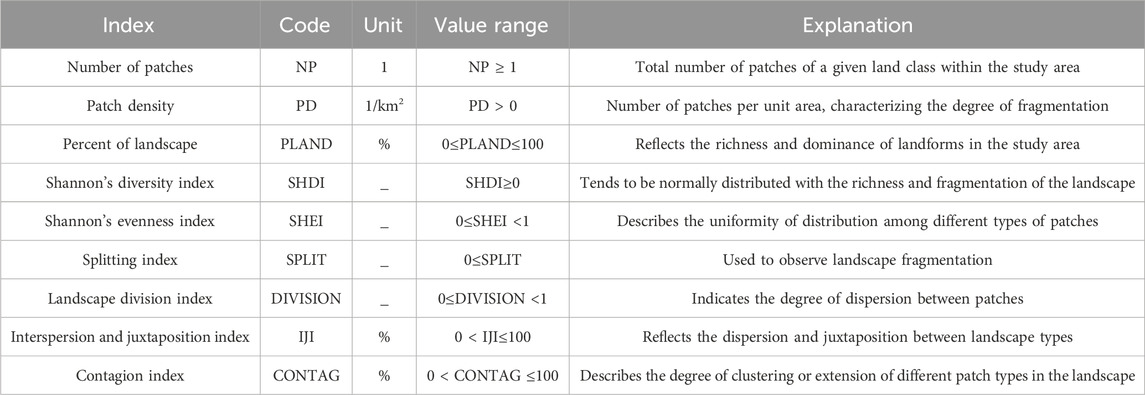
Table 3. Landscape pattern index.
2.3.4 LUCC dynamic
The LUCC dynamic can visualize the speed and magnitude of change in different land categories. The algorithm is shown in Eq 9.
where K denotes the dynamic attitude of a land class in the time period from
2.3.5 Land use transfer matrix
The land use transfer matrix reflects the transformation between different land categories. The algorithm is shown in Eq. 10.
where
2.3.6 Buffer zone analysis
Buffer zone is used to analyze the distance of each target in the space. Buffer analysis is an important spatial analysis function in GIS, which is widely used in the study of spatial distance on land use change (Zheng et al., 2021; Xiao et al., 2024). A buffer is an area of a certain width within the sphere of influence of a spatial object or set of objects (Patarasuk and Binford, 2012; Li C. et al., 2022). The algorithm is shown in Eq. 11.
where
3 Results
3.1 Characteristics of LUCC
3.1.1 Structural evolutionary features
In terms of area share, the land use structure of Jiangling County has been basically stable during the 10-year period (Figure 3). The proportion of each land use type, in descending order, are as follows: cultivated > water > towns and villages > forest > special > garden > transportation > industrial and mining > other > grassland (Figure 4). Cultivated land constituted 67%–72% of the total, water accounted for 14%–19%, towns and villages made up 8%–11%, and grassland had the smallest proportion, approximately 0.005% throughout the year. Due to changes in the rules of the LUCC Survey, all types of land use have experienced significant fluctuations in their shares in 2019.
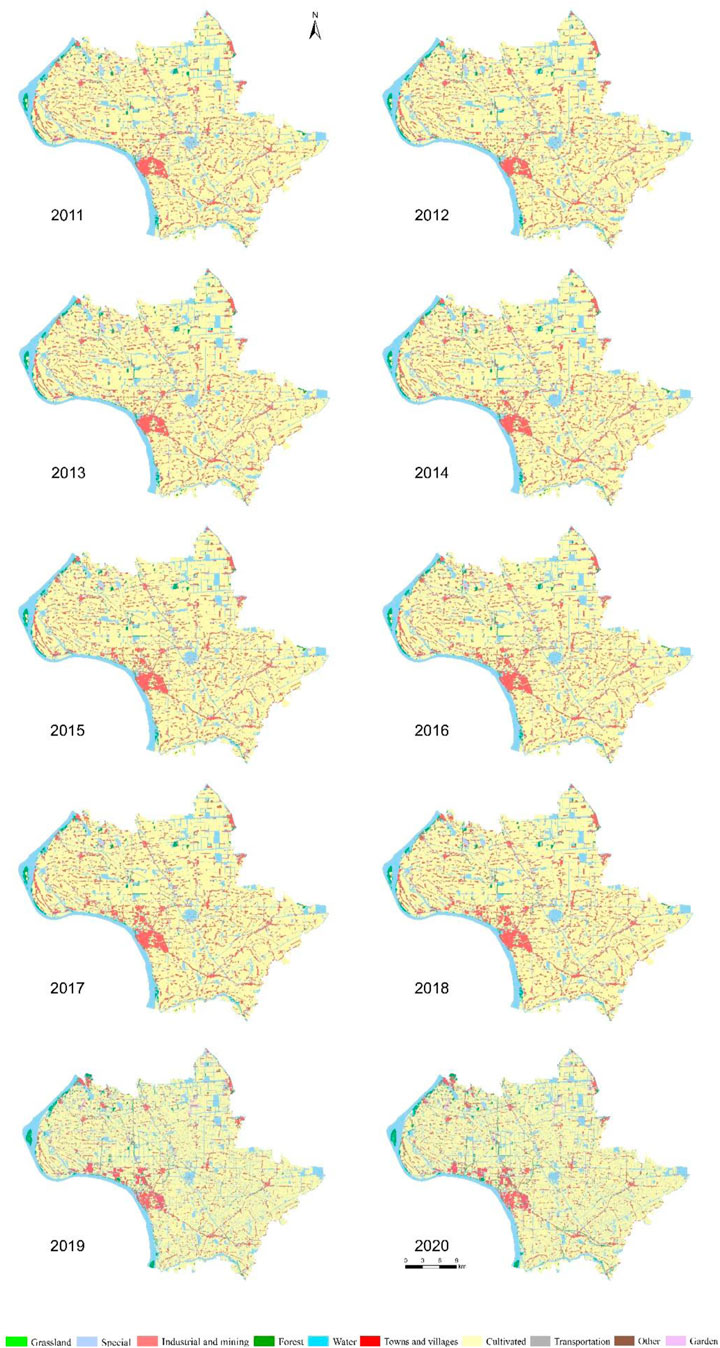
Figure 3. LUCC in Jiangling county from 2011 to 2020.
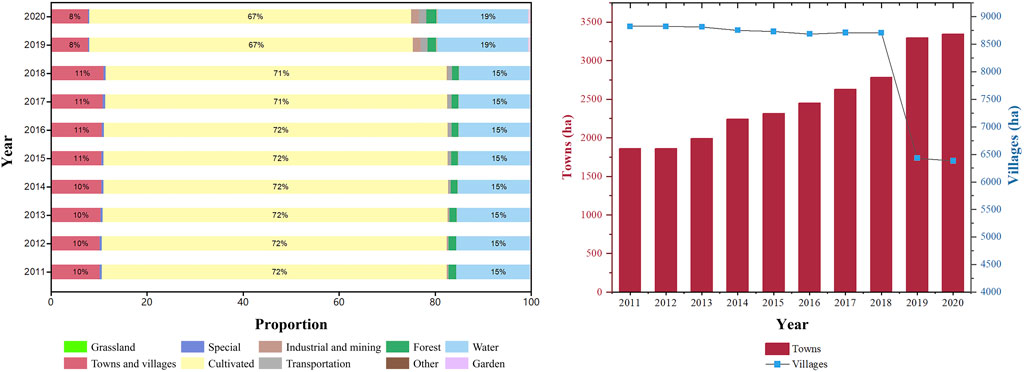
Figure 4. Evolution of land use structure from 2011 to 2020.
Examining the LUCC trends 9), significant variations are observed in the trends of each category (Table 4). Over the 10-year period, grassland, industrial and mining, and transportation exhibited higher change trends, while cultivated and water had lower change trends. Grassland exhibited an inflow trend, with a dynamic attitude of 195.15%. Transfer volatility was highest in 2013–2014, while inflow volatility reached its peak in 2018–2019. Over the past decade, towns and villages exhibited a trend of turning out, with a dynamic attitude of −2.73%. It experienced mild growth from 2011 to 2017 but underwent a significant decline from 2018 to 2020. It can be seen from Figure 4 that the towns were increasing, while the villages were decreasing. The special showed a general trend of transfer out, with the highest transfer out fluctuation in 2012–2013 and the greatest inflow fluctuation in 2014–2015. The cultivated exhibited an overall trend of outflow, except for a slight increase in 2012–2013. Outflow fluctuated in other study periods, with the most significant outflow observed in 2018–2019. The industrial and mining exhibited an overall inflow trend, with a turn-out fluctuation in 2012–2013 and 2016–2017, and a turn-in fluctuation in 2018–2020. The transportation exhibited an inflow trend with annual fluctuations, reaching its peak in 2013–2014. The forest generally exhibited an inflow trend, with a mild outflow fluctuation from 2011 to 2016 and an inflow fluctuation from 2017 to 2020. The other exhibited an overall inflow trend, increasing every year. The garden and water exhibited an overall inflow trend, with a slight decrease except in 2018–2019.
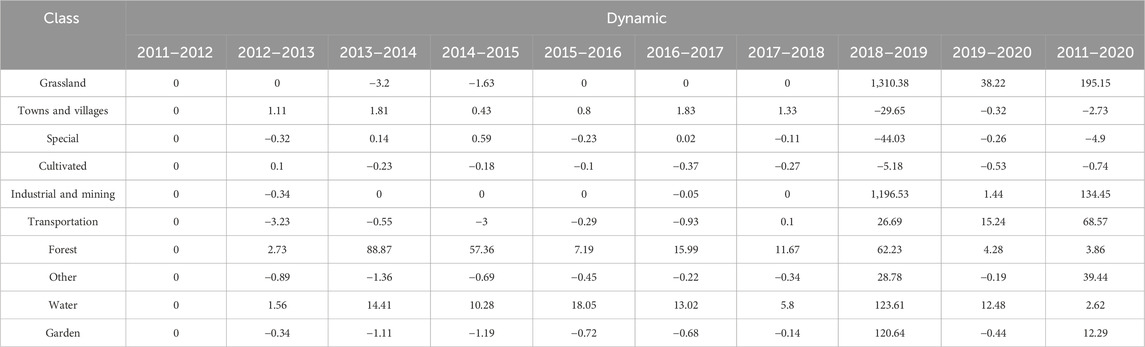
Table 4. LUCC dynamic from 2011 to 2020 (unit: %).
3.1.2 Land use transfer characteristics
From the perspective of land use transfer matrix ((10), Table 5), cultivated, water, towns and villages were the three primary types of land transfer in the past 10 years. The cultivated had an inflow of 6087.2646 hm2 and an outflow of 11,101.4566 hm2. The main sources of inflow were towns and villages (49.37%) and water (35.36%). The main outflow areas were water (52.47%), transportation (19.84%), forest (7.28%), industrial and mining (7.12%), and towns and villages (6.71%). The water experienced an inflow of 7202.9484 hm2 and outflow of 3441.6894 hm2. The main inflow sources were cultivated (80.86%) and towns and villages (14.58%). The main outflows were cultivated (62.53%) and transportation (15.75%). The towns and villages had an inflow of 1,177.2608 hm2 and outflow of 5915.2737 hm2. The main inflow sources were cultivated (63.27%), water (19.95%) and special (8.88%). The main outflows were cultivated (50.80%), water (17.75%), industrial and mining (12.10%) and transportation (11.16%).
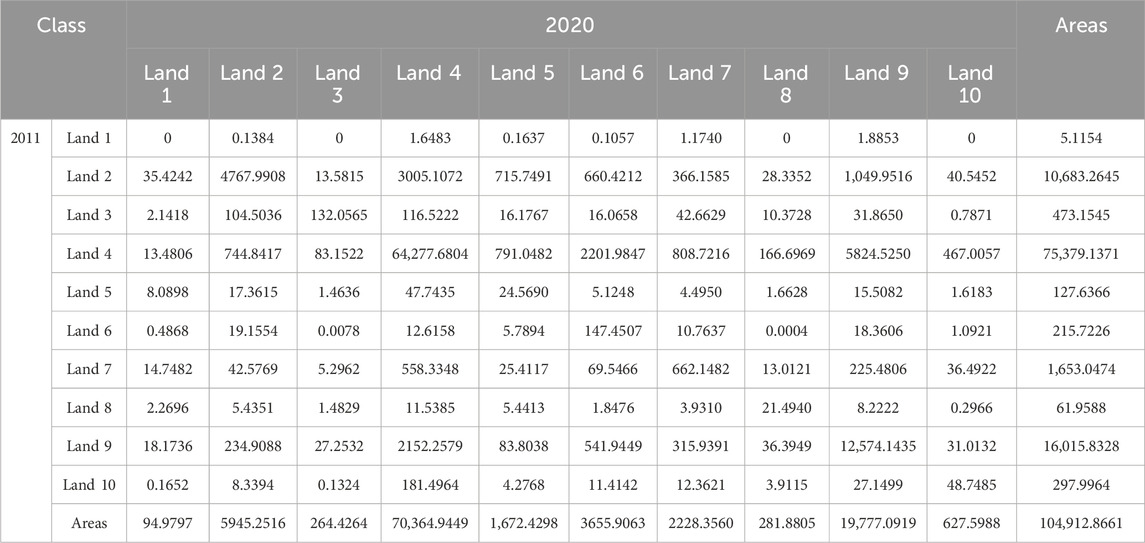
Table 5. Transfer matrix of land use from 2011 to 2020 (unit: hm2). The Land 1–10: Grassland, Towns and villages, Specia, Cultivated, Industrial and mining, Transportation, Forest, Other, Water, Garden.
Based on the annual transfer data (Figure 5), there were no significant changes in land classes in the study area from 2011 to 2012. From 2012 to 2018, the inflow and outflow of land classes remained basically the same every year. Cultivated, garden, towns and villages, and water were the primary outflow land types. Cultivated, transportation, towns and villages, and other land were the primary types of inflow land. From 2018 to 2020, changes in territorial investigation rules led to inflows and outflows in all categories.
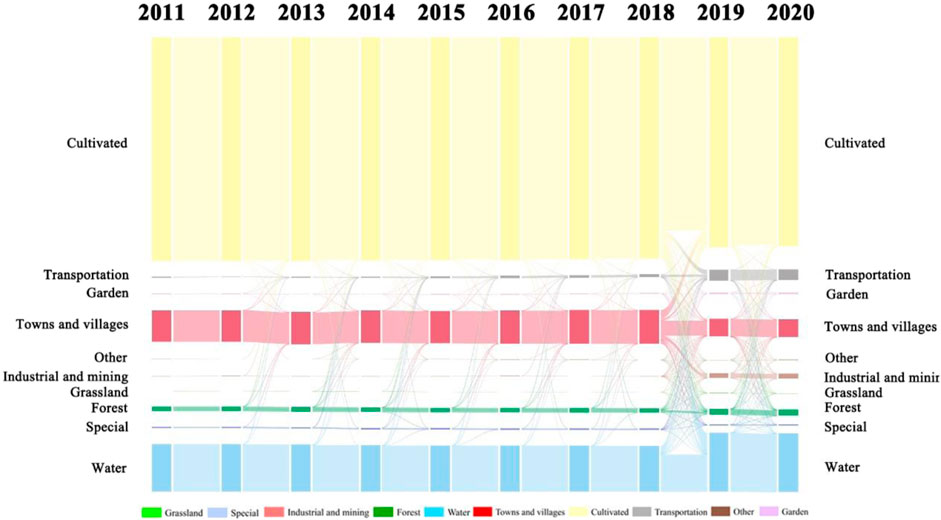
Figure 5. Land use transfer from 2011 to 2020.
3.1.3 Landscape pattern evolution characteristics
Examining the overall landscape pattern (Table 6), CONTAG exhibited a persistent decline, signifying diminished connectivity among various patch types and an escalating degree of fragmentation. The Increase in IJI suggested a continual augmentation of landscape continuity. DIVISION and SPLIT exhibited an initial gradual rise followed by a sharp increase, indicating the constant separation of small patches and an ongoing surge in landscape fragmentation. The SHDI experienced a slight decrease from 2011 to 2013 but continued to rise from 2014 to 2020, suggesting an increase in land use diversity and the information content of its uncertainty. The SHEI exhibited a slow but steady increase from 2011 to 2020, suggesting relative stability in the dominance of landscape types in Jiangling County.
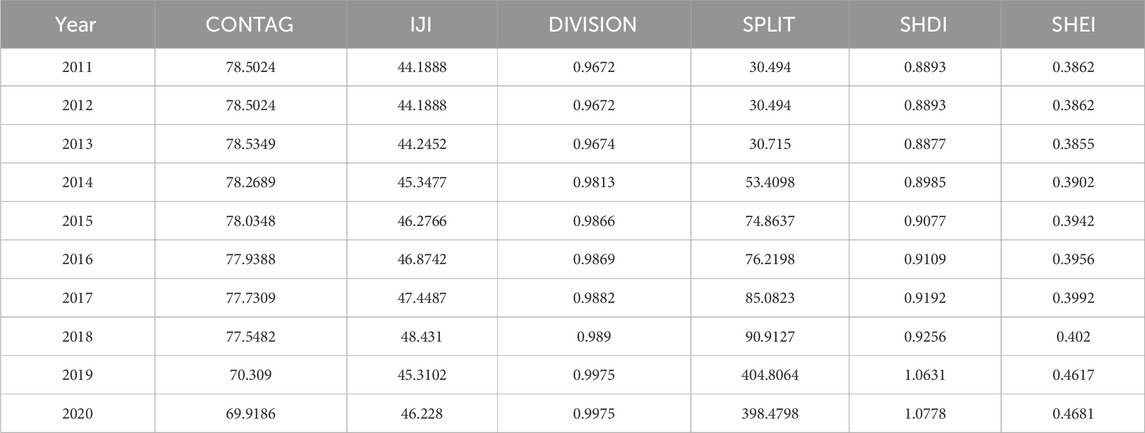
Table 6. Overall landscape pattern index from 2011 to 2020.
Examining landscape pattern changes across different regions (Figure 6), the PD for water and towns and villages was higher, indicating increased fragmentation. During 2011–2018, the PD of towns and villages, cultivated, transportation and other land showed an increasing trend, indicating that these four land types were gradually fragmented. The PD of garden decreased, signifying a reduction in the degree of fragmentation. The PD of other categories were relatively stable. During 2019–2020, the PD of all categories fluctuated greatly, which were related to the change of land category identification and division rules in the third territorial survey.
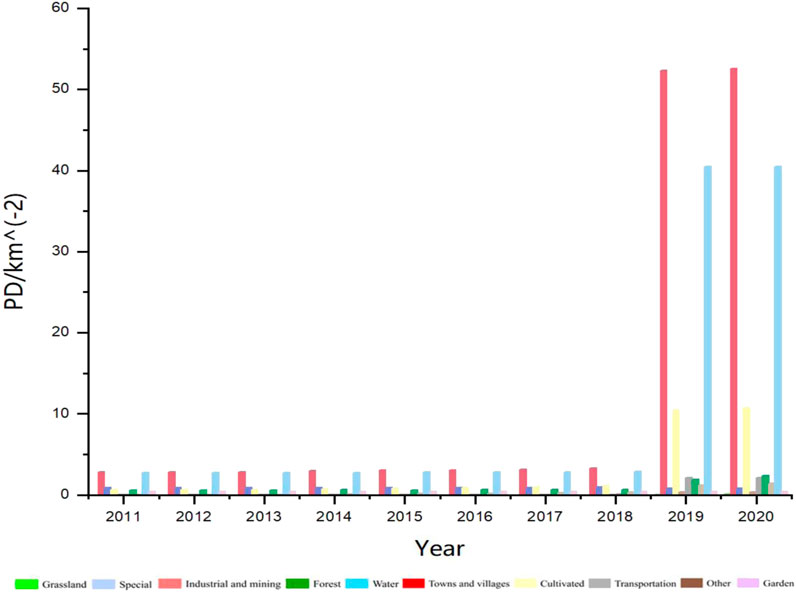
Figure 6. PD index from 2011 to 2020.
3.2 Driving mechanism of LUCC
3.2.1 Driving factor contribution degree
Drawing from existing relevant research literature (Gao et al., 2022; Liu et al., 2022; Zhang et al., 2022; Xu W. et al., 2023) and the specific conditions of Jiangling County, a total of 15 driving factors (Table 1; Figure 7) were identified. These factors were selected based on the principles of accessibility, correlation, quantification, spatial differentiation, and consistency from three domains: natural environment, social economy, and spatial accessibility. They were used to analyze the driving mechanisms and conduct simulation predictions. The MDA in RFC was used to measure the contribution degree of driving factor. Overlaying the land class expansion patches with the most important driver can intuitively display the spatial relationship between them (Figure 8). Taking cultivated land as an example, the distance to town contributed the most to its expansion. The spatial superposition of the cultivated expansion patches and the distance to town showed that the cultivated land expansion was mainly distributed in areas far from the towns. The findings indicated that the root mean square error (RMSE) for land expansion driving force analysis was below 0.15, ensuring high data reliability.
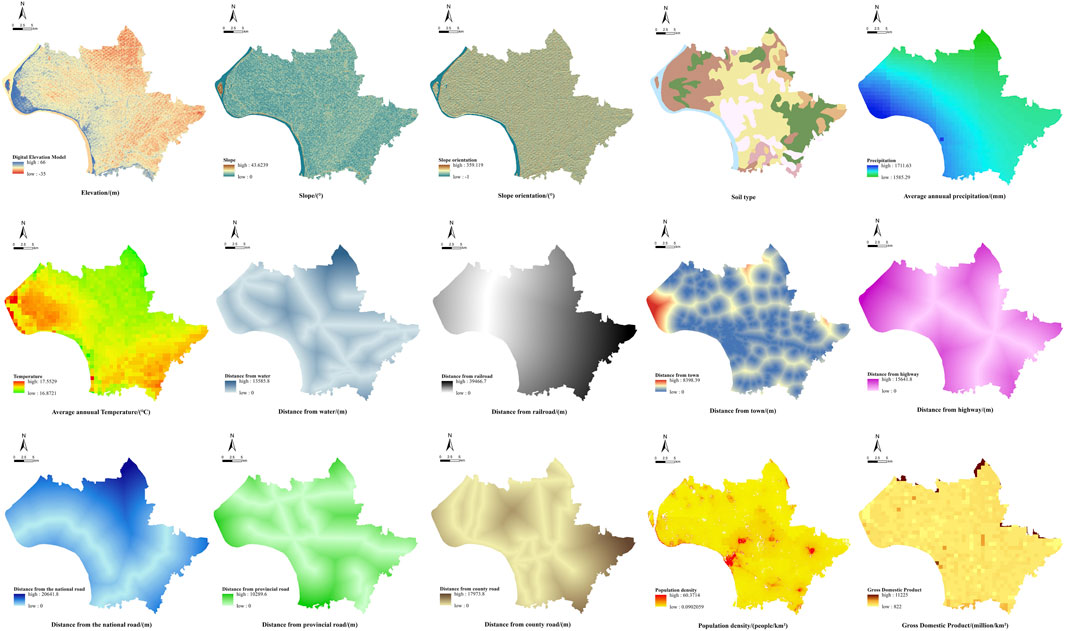
Figure 7. Driving factors of LUCC.
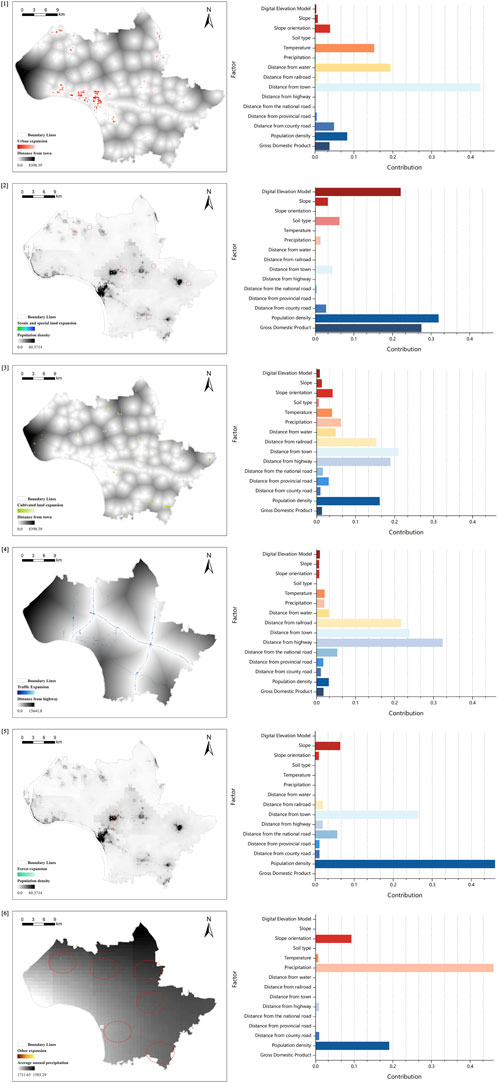
Figure 8. Overlay of land class expansion patches and the most important driving factor, Contribution degree of LUCC driving factors: (1) towns and villages expansion, (2) special land expansion, (3) cultivated expansion, (4) transportation expansion, (5) forest expansion, (6) other land expansion.
The primary factors affecting towns and villages expansion from high to low were distance to town, distance to water, annual average temperature, population density, distance to county road. The majority of newly allocated towns and villages land exhibited proximity to towns, high population density regions, and county roads, aligning with the established pattern of construction land expansion. Furthermore, the expansion of towns and villages land showed a preference for areas in proximity to water and lower temperature zones, signifying that the human settlement environment had emerged as a crucial factor in site selection for construction.
The expansion of special land was mainly driven by population density, average land GDP, and elevation, ranked in descending order of impact. The majority of newly developed special land was located within a 2 km radius outside each town in the peripheral urban area, predominantly occupying areas with higher elevations. This suggests that such lands should serve the towns while also being distanced from them. Moreover, these locations require stringent flood control measures.
The primary factors affecting cultivated land expansion from high to low were distance to town, distance to highway, population density, distance to railway and distance to water. Most of the newly added cultivated land was far away from towns, convenient transportation and dense population areas. It accords with the basic principle of the balance of cultivated land occupation and compensation.
The primary factors influencing the expansion of transportation land, ranked from high to low impact, were distance to highway, distance to town, distance to railway, and distance to the national road. The majority of the newly designated transportation land was situated in proximity to existing transportation routes and towns.
The primary factors influencing the expansion of forest land, ranked from high to low impact, were population density and distance to towns. The majority of the newly designated forest land was situated in densely populated urban areas, predominantly in town road green belts.
The primary factors influencing the expansion of other types of land, ranked from high to low impact, were average annual precipitation and population density. The newly added land mainly consisted of facility agricultural land, primarily located in areas with high precipitation and low population density, aligning with the principles of agricultural production.
In terms of the average contribution degree of various category and the average contribution degree of each driving factor (Figure 9), socioeconomic factors had the greatest impact, followed by spatial accessibility, and natural environmental factors had the least impact. The main driving factors affecting LUCC in Jiangling County from high to low were population density, distance to town, average annual precipitation, distance to highway, distance to railway, average land GDP, distance to water and elevation.
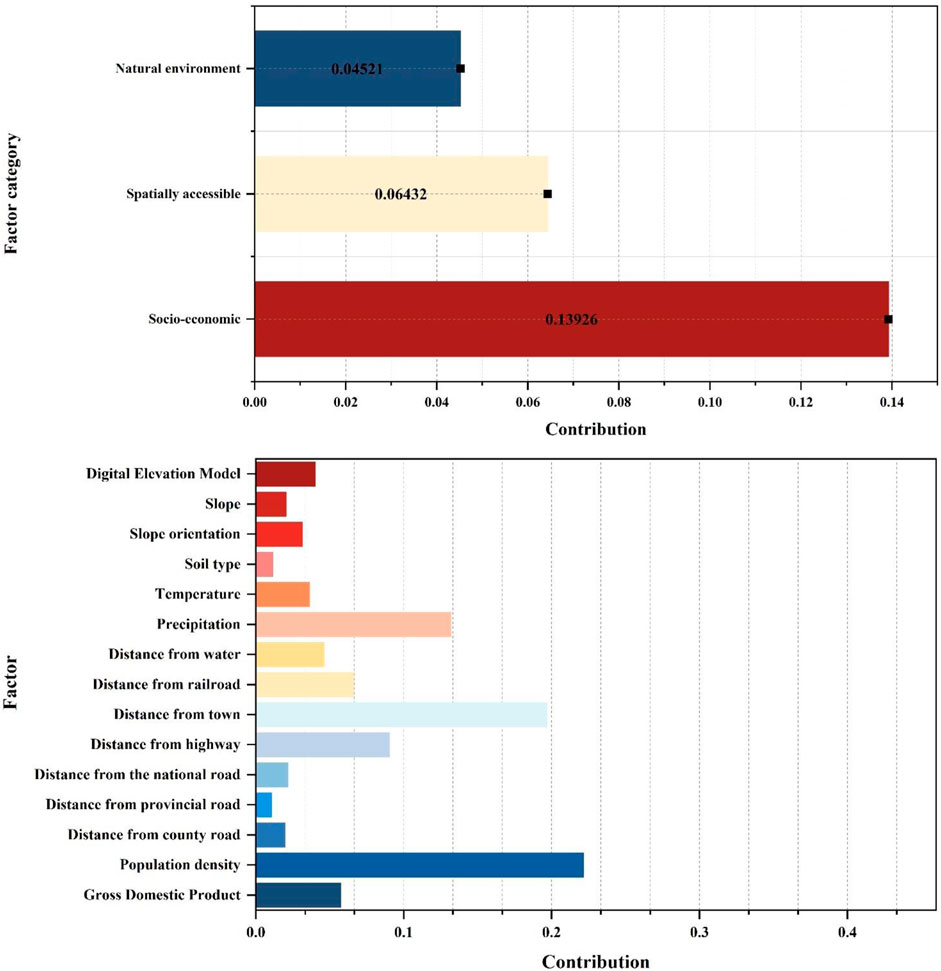
Figure 9. Average contribution degree of various category, Average contribution degree of each factor.
3.2.2 Spatial factor driving mechanism
According to the above contribution analysis, socio-economic and spatial factors were the main driving forces. However, the contribution degree could not reflect the driving mechanism at the micro level. Because socio-economic factors were average data, it was difficult to analyze at the micro level. Therefore, the spatial factors were analyzed at the micro level. By establishing buffer zones (11) for towns, roads, and waters, the number and area of increased and decreased land class patches in the buffer zones from 2011 to 2020 were counted, and the gradient change characteristics were analyzed, and then the microscopic driving mechanism of spatial factors was revealed.
3.2.2.1 Water driving mechanism
As can be seen from Figure 10, the inflow and outflow of species from 2011 to 2020 mainly concentrated within 3000 m away from the water. The closer to the water, the more inflow and outflow patches, indicating that the closer to the water, the more frequent the land class transformation. The closer cultivated, towns and villages, transportation, and forest were to water, the larger inflow area, showing a strong “hydrophilic” property. In addition, the closer cultivated, towns and villages, and forest were to the water, the larger outflow area, indicating that the more hydrophilic the more easily encroach. Water resources were the key factors for production and life in Jianghan Plain, and LUCC was negatively correlated with the distance to water.
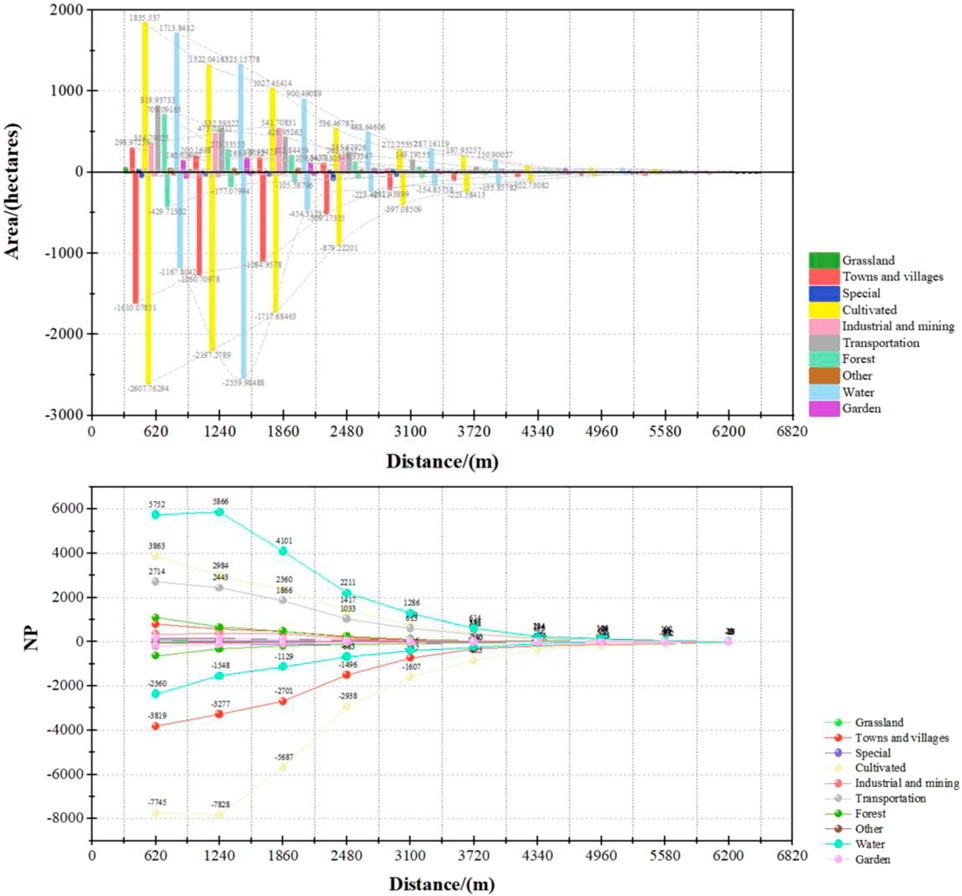
Figure 10. Transfer changes at different distances to water.
3.2.2.2 Road driving mechanism
As can be seen from Figure 11, the inflow and outflow of land classes from 2011 to 2020 mainly concentrated within 1,200 m away from the road. The closer to the road, the more inflow and outflow patches, and the larger area, indicating a higher frequency of LUCC closer to roads. The changes of cultivated, towns and villages, transportation, forest, industrial and mining, and water were positively correlated with transportation accessibility.
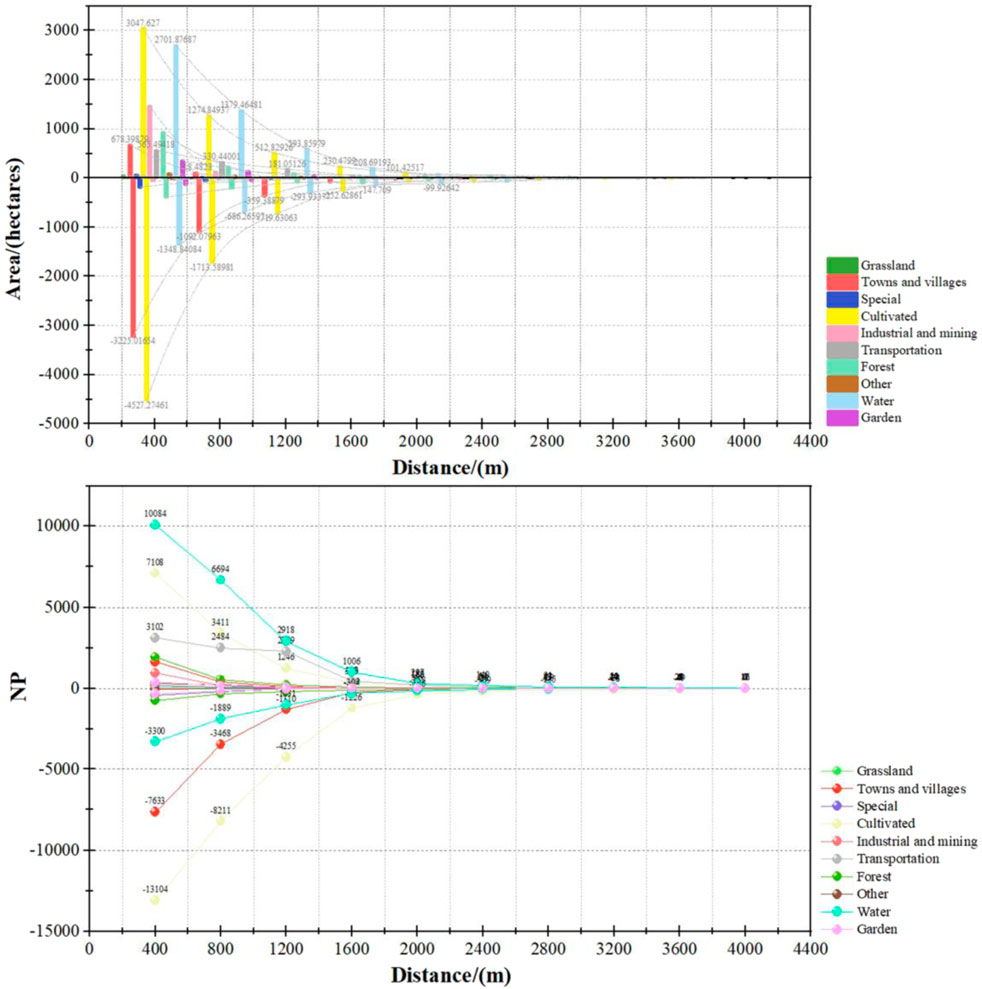
Figure 11. Transfer changes at different distances to roads.
3.2.2.3 Towns driving mechanism
As can be seen from Figure 12, the inflow and outflow of various land types from 2011 to 2020 mainly concentrated within 6000 m away from towns. The closer to the town, the more inflow and outflow patches, and the larger the area, indicating a higher frequency of LUCC nearer to towns. The increase and decrease of various land use types were negatively correlated with the distance to towns. It is noteworthy that the inflow of cultivated land also tended to occur closer to towns.
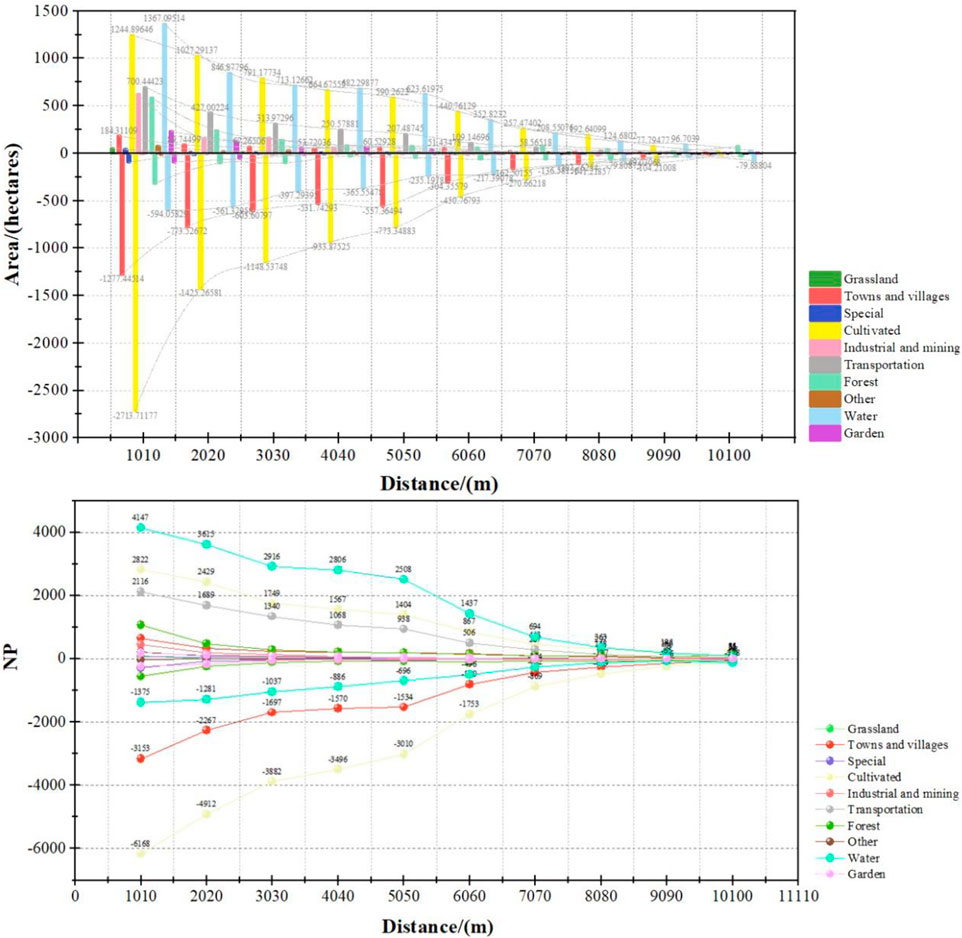
Figure 12. Transfer changes at different distances to towns.
3.2.3 Probability of land development
Utilizing the spatial distribution of various land types expansion and the influence range of each driving factor, the RFC 2) was used to mine land expansion one by one, resulting in the probability distribution of land type development (Figure 13). Findings revealed a higher likelihood of towns and villages expansion in the central and northwest regions along the Yangtze River, while indicating a contraction trend in other areas, suggestive of “rural-town convergence”. Cultivated land exhibited higher development probabilities in the northeastern, southeastern, and western parts of the county along the Yangtze River. The expansion probability of transportation was higher along highways, provincial roads and other roads around towns. The development of other land was inextricably linked with cultivated, leading to a concentration of development mainly in the northwest along the Yangtze River, the southern border zone, and the northeast region. Conversely, grassland, special, industrial and mining, forest, water, and garden areas exhibited a declining or stagnant development trend.
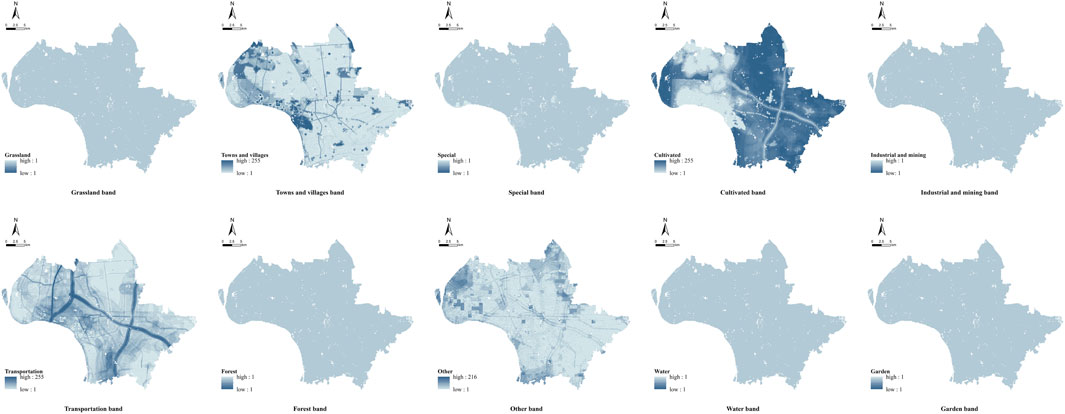
Figure 13. Development probability of each land use type.
3.3 LUCC simulation
3.3.1 Accuracy check and comparison
The Markov model’s demand for different land classes varies based on the selected start and end simulation years. Therefore, it is crucial to assess time precision before simulation and choose a time period that yields superior simulation outcomes for land class demand within the study area. Various start and end years, along with time spans, were employed to simulate land use in 2018. As depicted in Table 7, the Kappa coefficient 6), Overall Accuracy 8), and FoM values 7) obtained from simulations in 2016–2017 (1-year interval) surpassed those from simulations in 2014–2016 (2-year interval) and 2012–2015 (3-year interval). Employing 2016–2017 (1-year interval) for simulating land class demand exhibited superior results compared to the other two options, aligning well with the actual spatial patterns (Figure 14). Consequently, 2016–2017 was chosen as the base period for further spatial pattern simulation of land use in 2035, utilizing 2018 land use data, 15 driving factors, and related parameters.
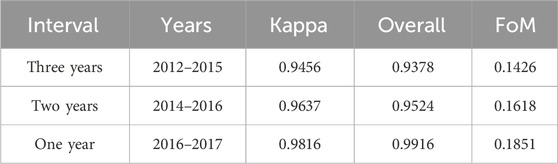
Table 7. Comparison of prediction accuracy for different time spans.
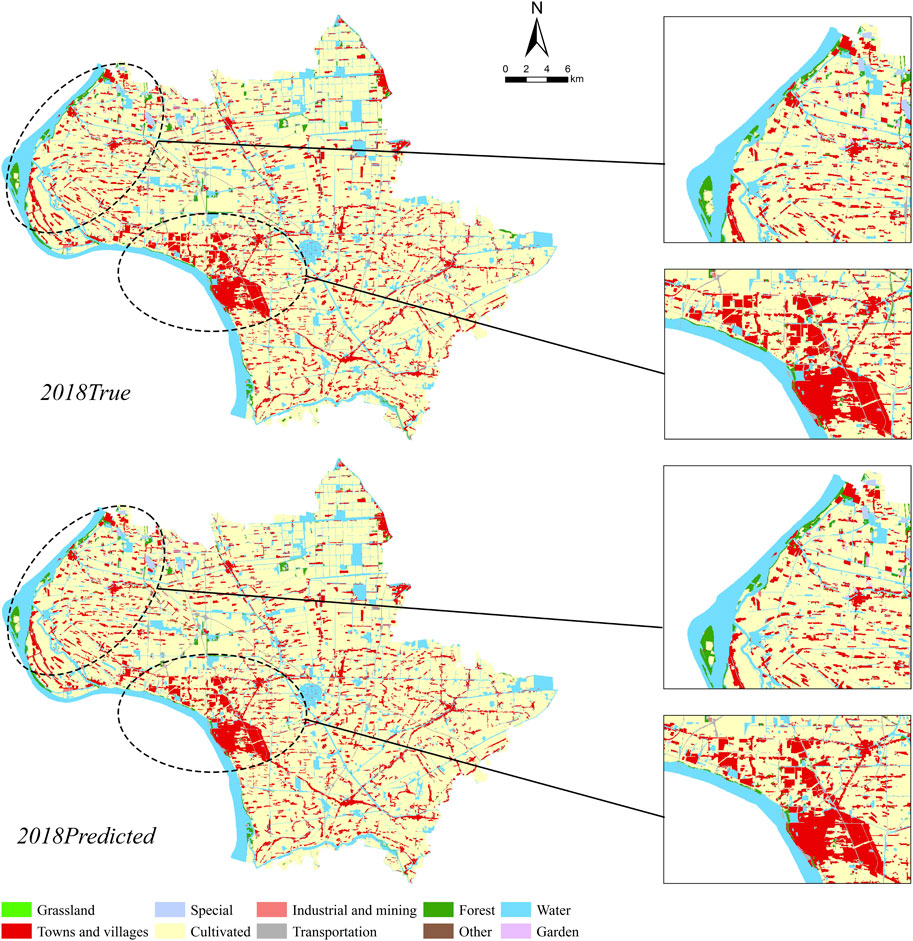
Figure 14. Simulation result in 2018.
3.3.2 Multi-scenario simulation
As LUCC is influenced by various factors, and the change process is intricate, numerous possibilities exist for the future spatial pattern change in land use. Therefore, based on previous studies (Zhou L. et al., 2020; Liu Y. et al., 2020; Qingzheng et al., 2023), the future LUCC in Jiangling County was modeled across three scenarios: natural development, planning guidance, and ecological protection. In the natural development scenario, it assumed that LUCC in Jiangling County from 2018 to 2035 would follow patterns observed in previous years. In the planning guidance scenario, areas designated as priority development zones were identified in alignment with the “Jiangling County Territorial Space Master Plan (2020–2035)". In the ecological protection scenario, forest and grassland are strictly protected. The simulation results are presented in Tables 8–10; Figure 15.
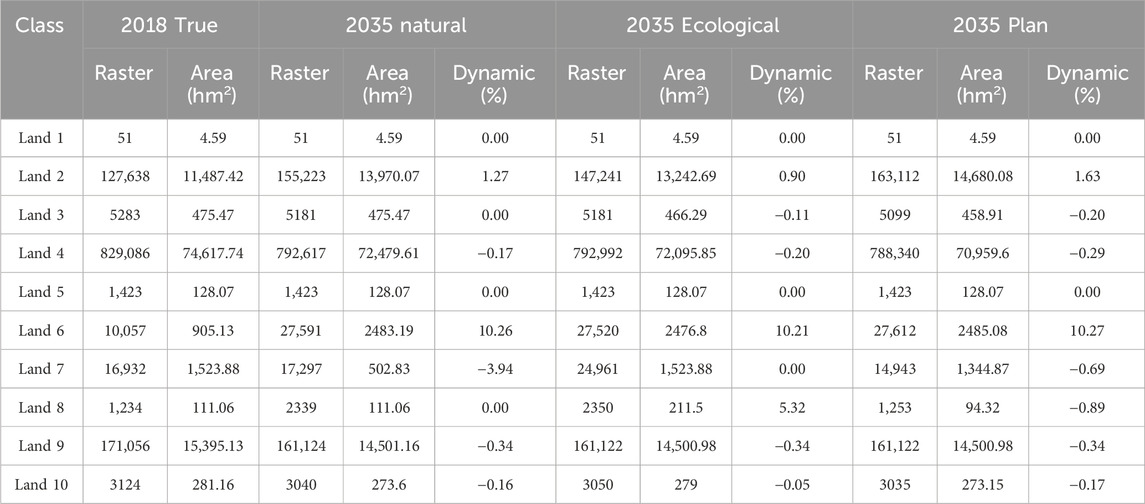
Table 8. Land use area and dynamic in 2035 under multi-scenario simulation. The Land 1–10: Grassland, Towns and villages, Specia, Cultivated, Industrial and mining, Transportation, Forest, Other, Water, Garden.
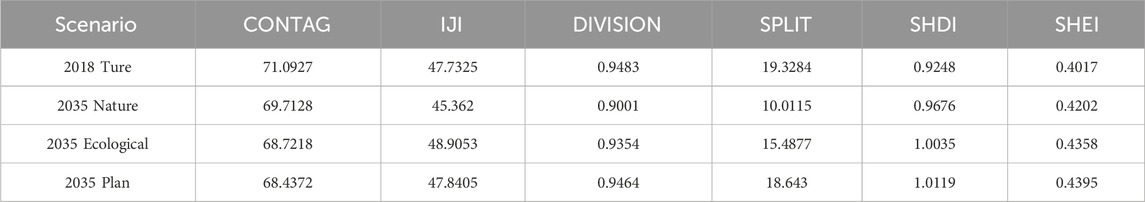
Table 9. Overall landscape pattern index in 2035 under multi-scenario simulation.
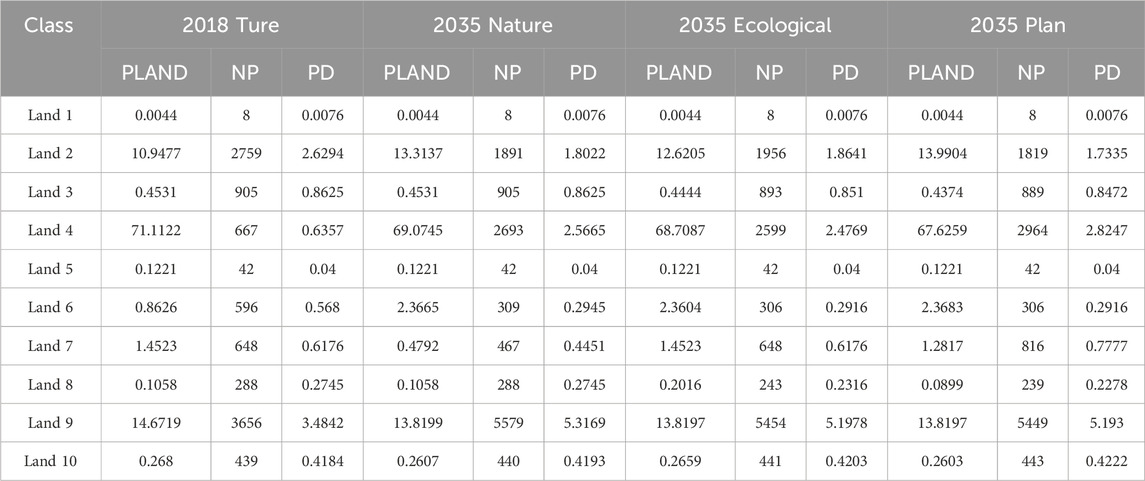
Table 10. Land class landscape pattern index in 2035 under multi-scenario simulation. The Land 1–10: Grassland, Towns and villages, Specia, Cultivated, Industrial and mining, Transportation, Forest, Other, Water, Garden.
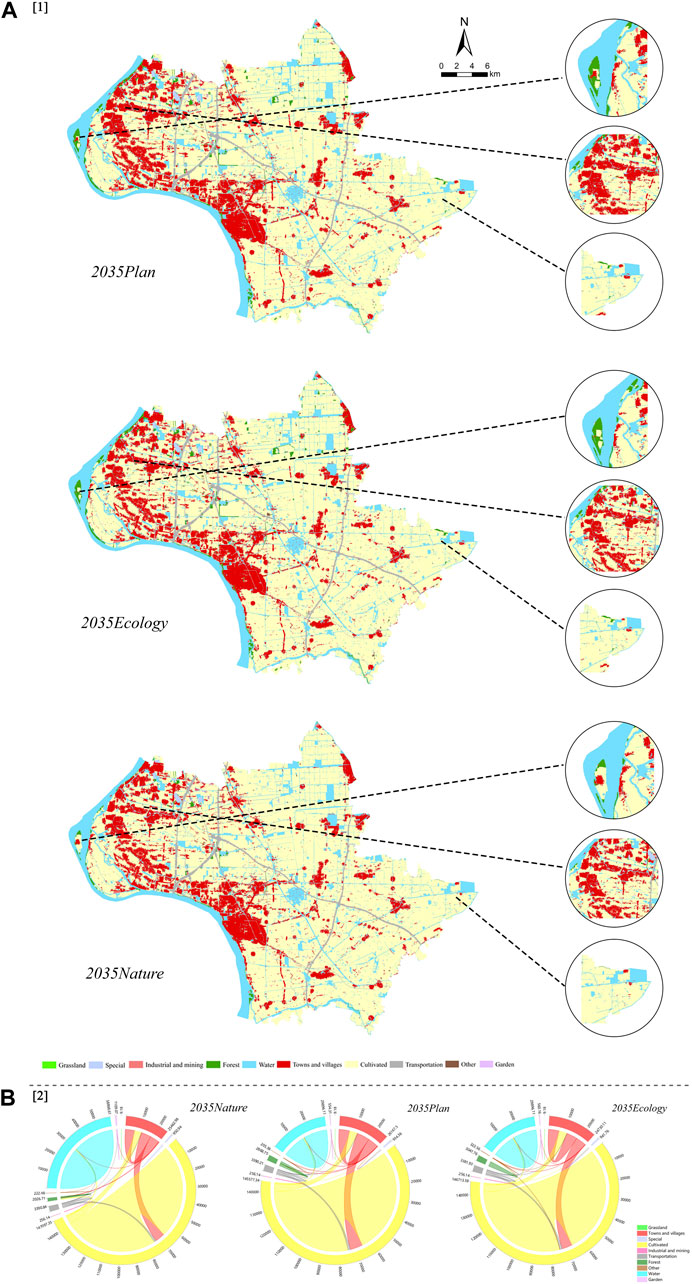
Figure 15. Simulation results: (A) Multi-scenario simulation results in 2035, (B) Land use transfer in different scenarios from 2018 to 2035.
3.3.2.1 Natural development scenario
In terms of the dynamic attitude of land use, it can be seen from Table 8 that the increased land types were transportation and towns and villages, while the forest, cultivated, water and garden all decreased, and the other types remained stable. The transportation had the largest change (10.27%), followed by forest (−3.94%), towns and villages (1.27%). Cultivated, water and garden had a small fluctuation. In terms of land use transfer change, it can be seen from Table 8; Figure 15 that the transportation increased from 905.13 hm2 to 2,483.19 hm2, of which 86.47% came from the conversion of cultivated. The forest decreased from 1,523.88 hm2 to 502.83 hm2, of which 66.37% was transferred to cultivated and 29.62% to towns and villages. The towns and villages increased from 11,487.42 hm2 to 13,970.07 hm2, primarily from cultivated (6986.97 hm2) and forest (302.4 hm2), while 4744.26 hm2 transferred out to cultivated. The cultivated decreased from 74,617.74 hm2 to 72,479.61 hm2, primarily transferred to towns and villages (6,986.97 hm2) and transportation (1,364.58 hm2), while 4,744.26 hm2 transferred from towns and villages.
From the perspective of landscape pattern (Table 9; Table 10), SHEI and SHDI were on the rise compared with 2018, while CONTAG declined, indicating that the degree of landscape fragmentation increased and the dominant land types declined. PLAND of towns and villages increased compared to 2018, but PD experienced a decline, indicating that towns and villages construction land was gathering, which was due to the transfer of some rural areas along the Yangtze River and in the eastern region to town areas. In contrast to 2018, the PLAND of cultivated, water and garden decreased, but the PD increased, indicating that agricultural space and ecological space were occupied.
3.3.2.2 Planning guidance scenario
In terms of land use dynamics, Table 8 shows that transportation and towns and villages increased, grassland, industrial and mining remained stable, and other types of land decreased. Transportation and towns and villages land fluctuated greatly. Compared with the natural development scenario, the transportation remained at 10.27%, the towns and villages increased to 1.63%, and the forest decreased to −0.69%. In terms of land use transfer change, it can be seen from Table 8; Figure 15 that the transportation increased from 905.13 hm2 to 2,485.08 hm2, of which 87.94% was transferred from cultivated land. The towns and villages increased from 11,487.42 hm2 to 14,680.08 hm2, primarily through the transfer from cultivated (7,845.03 hm2) and transfer to cultivated (4,781.16 hm2). The forest decreased from 1,523.88 hm2 to 1,344.87 hm2, being transferred to towns and villages, cultivated and transportation. Cultivated decreased from 74,617.74 hm2 to 70,959.6 hm2, primarily transferred to towns and villages (7845.03 hm2) and transportation (1,389.33 hm2), mainly transferred from towns and villages (4781.16 hm2).
From the landscape pattern index (Table 9; Table 10), the CONTAG and SPLIT decreased compared with 2018, indicating that the degree of landscape fragmentation was increasing. Compared with the other two scenarios, CONTAG was the smallest, and DIVISION, SPLIT, SHDI, and SHEI were the largest, indicating that the dominant land class was the least obvious and the fragmentation degree was the highest. The PLAND of towns and villages increased substantially, indicating an obvious aggregation trend. The PLAND and PD of forest and garden did not fluctuate greatly, indicating that their encroachment decreased. Figure 15 also shows that forest and garden along the Yangtze River had been effectively protected. The PLAND of cultivated decreased by about 2%, and the PD increased by 3%–4%, indicating that the degree of fragmentation continued to increase.
3.3.2.3 Ecological protection scenario
In terms of the LUCC dynamic, it can be seen from Table 8 that the transportation, towns and villages and the other land increased, while the grassland, forest and industrial and mining remained stable, and the other types of land decreased. The transportation expanded steadily and remained at 10.21%. The other types dynamic attitudes were lower than that in the other two scenarios. The towns and villages dynamic attitude decreased to 0.9%, which decreased by 0.37% and 0.73% compared with the natural development scenario and the planning guidance scenario, respectively. The cultivated dynamic attitude was 0.2%, which decreased by 0.09% compared with the planning guidance scenario and increased by 0.03% compared with the natural development scenario. In terms of land use circulation change, it can be seen from Table 8; Figure 15 that the transportation increased by 1,571.67 hm2, of which 89.09% was transferred from cultivated. Towns and villages increased by 1755.27 hm2, with a growth rate significantly lower than in the previous two scenarios. The main source of transfer was from cultivated (6469.11 hm2), with the primary transfer to cultivated (4766.76 hm2). Cultivated decreased by 2521.89 hm2, primarily transferred to towns and villages (6469.11 hm2) and transportation (1,400.22 hm2), with the main transfer source from towns and villages (4766.76 hm2). Compared with the natural development and planning guidance scenarios, forest increased by 1,021.05 hm2 and 179.01 hm2, respectively, indicating that ecological land was protected better under this scenario.
From the perspective of landscape pattern (Table 9; Table 10), SHEI and SHDI were higher than those in 2018, while SPLIT and CONTAG declined, indicating an increased degree of landscape fragmentation and a decline in dominant landscape land types. IJI was higher than in the other two scenarios, suggesting a more uniform distribution of land types. Compared with the other two scenarios, towns and villages’ PLAND was lower, and NP was higher, indicating a weaker agglomeration and appropriately slowed urbanization process. The PD of cultivated was lower than in the other two scenarios, indicating lower fragmentation. The PLAND of forest was the largest among all scenarios, and the NP was smaller than in the planning guidance scenario, indicating effective control of the forest and a trend toward aggregation in this scenario.
3.3.2.4 Comparative analysis
As shown in Table 11, in the natural development scenario, construction land increased by 31.25%, and agricultural land was occupied the least, with a reduction ratio of 2.86%. Ecological land was occupied the most, with a decrease of 11.32%. In the planning guidance scenario, construction land increased the most, with a ratio of 36.60%. Agricultural land faced the most occupation, experiencing a reduction of 4.91%. The proportion of ecological land reduction was 6.34%. In the ecological protection scenario, construction land increased the least, with a ratio of 25.53%. Agricultural land was reduced by 3.23%. Ecological land faced the least occupation, with a reduction ratio of 5.28%. In either scenario, the expansion of construction land and encroachment on agricultural and ecological land were inevitable.
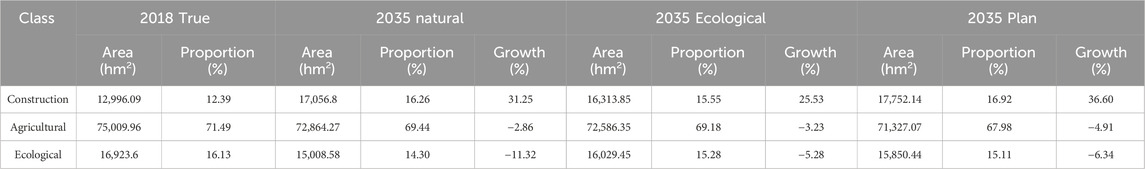
Table 11. Land use structure in 2018 and 2035. Construction: Towns and villages, Special, Industrial and mining, Transportation. Agricultural: Cultivated, Other, Garden. Ecological: Forest, Grassland, Water.
4 Discussion
4.1 Challenges
From the perspective of land use evolution, policy is the core factor affecting the change of land use structure in Jianghan Plain, and the continuous weakening of agricultural production function deserves attention. From 2011 to 2020, towns increased, villages and cultivated reduced greatly. Grassland, forest, garden, and water increased slightly. In the past 10 years, urbanization had achieved good results, and some ecological land had been effectively protected, but the loss of agricultural land was serious. The above phenomenon was primarily attributed to the influence of policies (Deng and Quan, 2023; Fan et al., 2023; Zhou et al., 2023). Firstly, the implementation of the strategy of “Yangtze River Economic Belt” and “Coal transportation from North to South” has brought water transportation port (Zhang et al., 2022), Haoji railway and coal resources to Jiangling County, fostering rapid industrialization and urbanization. Secondly, the implementation of the strategy of “Great Protection of the Yangtze River” requires the cities along the river to protect the ecological environment, leading to stringent protection of ecological land (Liang et al., 2021b; Zeng et al., 2023). Thirdly, the implementation of the policy of “Balance of cultivated land occupation and compensation” requires that the amount of cultivated land occupied by the construction should be supplemented by the amount of cultivated land with the same quantity and quality (Liu et al., 2015; Zhou et al., 2023). The indicators that can not be balanced within the region can be purchased from outside the region. Jiangling County has taken measures to purchase indicators outside the region, resulting in a substantial reduction of cultivated land.
From the perspective of driving mechanisms, urbanization emerges as the central theme in Jianghan Plain, and the limitation of ecological growth space warrants attention (Zhou Y. et al., 2020; Xu W. et al., 2023). The key factors influencing the LUCC in Jiangling County include distance to town, distance to road, distance to water, population density, annual average precipitation, and annual average temperature. It is evident that the driving force behind LUCC at the micro level primarily stems from spatial factors, with little impact from the natural environment and socio-economic factors. Two reasons contribute to this phenomenon. Firstly, Jiangling County is undergoing rapid urbanization, marked by frequent urban and infrastructure construction activities leading to a series of LUCC events (Bindajam et al., 2023). Secondly, within Jianghan Plain, the flat terrain, dense river network, and uniform natural environment contribute to a lack of significant social and economic disparities between different areas, reducing the driving force for LUCC. Additionally, there are notable driving mechanisms (Cui et al., 2021; Ren et al., 2024). Firstly, the expansion of urban and village land tends to occur near water areas and regions with moderate temperatures, influenced by the “land of fish and rice” culture and a preference for areas with lower temperatures due to the impact of hot summer climates (Cui et al., 2021). Secondly, the expansion of forest was predominantly concentrated in urban areas. Given that Jianghan Plain is primarily characterized by agricultural production, where cultivated, water, and construction land occupy about 97% of the space, there is limited room for the growth of forest, which can only be enhanced through urban greening. Therefore, space for future forest growth and carbon neutrality is a great challenge in the Jianghan Plain (Li L. et al., 2022).
4.2 Policy suggestion
By comparing the results under three different scenarios of natural development, planning guidance and ecological protection, it is found that planning policies play an important role in LUCC, which can directly affect the spatial distribution and quantitative changes of various classes. Regardless of the scenario, by 2035, construction land will increase, agricultural land and ecological land will decrease, and ecological growth space will be limited, highlighting a common challenge in the Jianghan Plain (Deng and Quan, 2023; Fan et al., 2023; Zhou et al., 2023). Different scenario models have different policies and land use trends (Zhou et al., 2023). The selection of development scenarios should not be viewed as an “either/or” decision, and land management policies should not adopt a “one-size-fits-all” approach. The land use structure must be meticulously planned, integrating regional environmental considerations with social and economic functions, striking a harmonious balance among cultivated land protection, ecological security, and economic development (Wang et al., 2023c). As an important part of the Yangtze River Economic Belt and the birthplace of “permanent basic farmland”, Jianghan Plain should not only develop its economy, but also implement the great protection strategy of the Yangtze River and assume important agricultural production functions (Zhang et al., 2022). In the face of the continuous reduction of agricultural land and ecological land, it is necessary to implement a land policy for high-quality development. First, promote the scale, mechanization and informatization of agricultural production, and improve the production efficiency of agricultural land (Liu et al., 2015; Zhou et al., 2023). Second, implement a policy of locally balancing occupation and compensation for cultivated, ensuring its stability (Zhou et al., 2023). Third, promote the reuse of idle and inefficient construction land to reduce the demand for new construction land (Zhou et al., 2023). Fourth, encourage the integrated use of land, expanding afforestation spaces, and enhancing ecological benefits. Fifth, implement a policy to balance the local occupation and compensation of ecological land to ensure that ecological land will not decrease (Gao et al., 2022; Zeng et al., 2023).
4.3 Simulation effect
The contribution degree of driving factors is the basis of multi-scenario land use simulation, which determines the direction and probability of different land class expansion in the future (Lin and Peng, 2022). The PLUS model firstly calculated the contribution degree of driving factors through MDA, and then calculated the development probability of different classes in space (Wang Q. et al., 2023). At the same time, DP was used to predict the future land use demand in different scenarios. Finally, the future spatial distribution of land use was simulated by CARS based on the annual land use in the base period, the development probability of land classes, and the future land use demand (Liang et al., 2021c). The Kappa and Overall results of this simulation reached 0.9816 and 0.9916 respectively, indicating that the PLUS simulation effect was very effective. Therefore, this research framework is feasible.
To enhance the simulation accuracy of the PLUS model, improvements can be pursued in two main dimensions. Initially, employing continuous NLSD (Liu et al., 2015; Chen et al., 2022) for simulation is recommended. When contrasted with remote sensing image interpretation data (Table 12), NLSD offers superior continuity, more detailed land classification, and higher accuracy, resulting in a more precise simulation effect (Zhou L. et al., 2020; Xu L. et al., 2022; Li X. et al., 2022; Chen and Yao, 2023; Fan et al., 2023; Nie et al., 2023). Additionally, a comparative analysis of the simulation accuracy at 1-year, 2-year, and 3-year intervals was conducted (Table 7). The optimal interval data was selected based on the Kappa coefficient, Overall accuracy, and Form coefficient to refine and enhance the simulation effect.
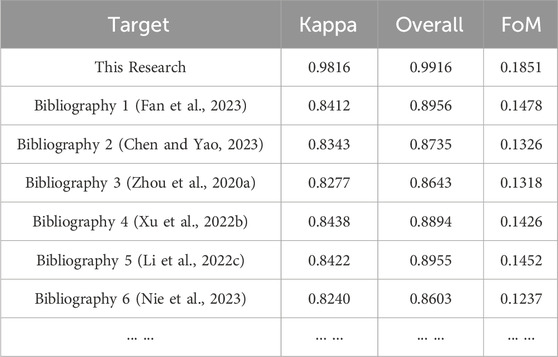
Table 12. Comparison of simulation accuracy of existing studies.
4.4 Limitations and future research directions
Firstly, the 15 driving factors chosen in this study may not comprehensively encompass all relevant factors (Xu W. et al., 2023). Secondly, the PLUS model lacks the capability to quantify the contribution of driving factors to the contraction of land classes (Liang et al., 2021b). Thirdly, there is inherent subjectivity in the parameter setting for scenario simulation (Qingzheng et al., 2023). Given the identified limitations of the current study, future research endeavors aim to incorporate a broader range of influential factors and analytical methods for understanding the driving mechanisms. Additionally, the integration of deep learning technology is proposed to enhance the determination of model parameters, aiming to refine and elevate the overall systematic and scientific rigor of the research.
5 Conclusion
Utilizing the National Land Survey Data spanning 2011 to 2020 in Jiangling County, this study employed the PLUS model and embraced the conceptual framework integrating change characteristics, driving mechanisms, simulation predictions, and policy suggestions. The main conclusions are as follows:
(1) Over the period from 2011 to 2020, there was an increase in urban construction land while village construction land, agricultural land and ecological land experienced reductions. Cultivated, towns and villages, and water were the three primary circulation change categories. The degree of landscape fragmentation was increasing.
(2) The main driving factors affecting LUCC in Jiangling County from high to low were population density, distance to town, average annual precipitation, distance to highway, distance to railway, average land GDP, distance to water and elevation. Socioeconomic factors had the greatest impact, followed by spatial accessibility, and natural environmental factors had the least impact.
(3) In the three scenarios of natural development, planning guidance and ecological protection, the trend of construction land expansion, agricultural land and ecological land encroachment is inevitable by 2035.
(4) To address the decline in agricultural land and the scarcity of ecological land, it is imperative to actively advocate for large-scale mechanization and informatization of agricultural production, encourage the repurposing of idle and inefficiently used construction land, facilitate multi-purpose land utilization, and adopt a land management approach that balances the local occupation and compensation of cultivated and ecological land.
(5) Utilizing the PLUS model for LUCC simulation, the ultimate Kappa coefficient and Overall accuracy achieved 0.9816 and 0.9916, respectively, through the selection of continuous NLSD and careful accuracy screening across different time spans. The simulation results demonstrated higher accuracy compared to those obtained from remote sensing image interpretation data.
Data availability statement
The original contributions presented in the study are included in the article/Supplementary Material, further inquiries can be directed to the corresponding authors.
Author contributions
HZ: Conceptualization, Funding acquisition, Methodology, Validation, Writing–review and editing. MT: Validation, Visualization, Writing–original draft. JH: Formal Analysis, Investigation, Writing–review and editing. XM: Data curation, Writing–review and editing. HJZ: Project administration, Writing–review and editing.
Funding
The author(s) declare that financial support was received for the research, authorship, and/or publication of this article. This research was financially supported by the Social science research project of Education Department of Hubei Province under Grants 22G051.
Conflict of interest
Author HJZ was employed by Wuhan Design Consultation Group Co., Ltd.
The remaining authors declare that the research was conducted in the absence of any commercial or financial relationships that could be construed as a potential conflict of interest.
Publisher’s note
All claims expressed in this article are solely those of the authors and do not necessarily represent those of their affiliated organizations, or those of the publisher, the editors and the reviewers. Any product that may be evaluated in this article, or claim that may be made by its manufacturer, is not guaranteed or endorsed by the publisher.
References
Bindajam, A. A., Mallick, J., and Hang, H. T. (2023). Assessing landscape fragmentation due to urbanization in English Bazar Municipality, Malda, India, using landscape metrics. Environ. Sci. Pollut. Res. 30 (26), 68716–68731. doi:10.1007/s11356-023-27252-2
Chang, R., Liu, G., and Fu, B. (2010). Review on the methods for soil carbon sequestration at regional scale. Geogr. Res. 29 (9), 1616–1628. doi:10.11821/yj2010090008
Chen, S., and Yao, S. (2023). Identifying the drivers of land expansion and evaluating multi-scenario simulation of land use: a case study of Mashan County, China. Ecol. Inf. 77, 102201. doi:10.1016/j.ecoinf.2023.102201
Chen, X., Yu, L., Du, Z., Liu, Z., Qi, Y., Liu, T., et al. (2022). Toward sustainable land use in China: a perspective on China’s national land surveys. Land Use Policy 123, 106428. doi:10.1016/j.landusepol.2022.106428
Cui, X., Liu, C., Shan, L., Lin, J., Zhang, J., Jiang, Y., et al. (2021). Spatial-Temporal responses of ecosystem services to land use transformation driven by rapid urbanization: a case study of Hubei Province, China. Int. J. Environ. Res. Public Health 19 (1), 178. doi:10.3390/ijerph19010178
Deng, Z., and Quan, B. (2023). Intensity analysis to communicate detailed detection of land use and land cover change in chang-zhu-tan metropolitan region, China. Forests 14 (5), 939. doi:10.3390/f14050939
Fan, L., Cai, T., Wen, Q., Han, J., Wang, S., Wang, J., et al. (2023). Scenario simulation of land use change and carbon storage response in Henan Province, China: 1990–2050. Ecol. Indic. 154, 110660. doi:10.1016/j.ecolind.2023.110660
Gao, L., Tao, F., Liu, R., Wang, Z., Leng, H., and Zhou, T. (2022). Multi-scenario simulation and ecological risk analysis of land use based on the PLUS model: a case study of Nanjing. Sustain. Cities Soc. 85, 104055. doi:10.1016/j.scs.2022.104055
Guo, A., Yue, W., Yang, J., Xue, B., Xiao, W., Li, M., et al. (2023). Cropland abandonment in China: patterns, drivers, and implications for food security. J. Clean. Prod. 418, 138154. doi:10.1016/j.jclepro.2023.138154
Han, S., Jing, Y., and Liu, Y. (2023). Simulation of land use landscape pattern evolution from a multi-scenario simulation: a case study of Nansi Lake Basin in China. Environ. Monit. Assess. 195 (7), 830. doi:10.1007/s10661-023-11416-1
Jiang, Y., Du, G., Teng, H., Wang, J., and Li, H. (2023). Multi-scenario land use change simulation and spatial response of ecosystem service value in black soil region of northeast China. Land 12 (5), 962. doi:10.3390/land12050962
Kou, J., Wang, J., Ding, J., and Ge, X. (2023). Spatial simulation and prediction of land use/land cover in the transnational ili-balkhash basin. Remote Sens. 15 (12), 3059. doi:10.3390/rs15123059
Li, C., Zhang, J., Philbin, S. P., Yang, X., Dong, Z., Hong, J., et al. (2022b). Evaluating the impact of highway construction projects on landscape ecological risks in high altitude plateaus. Sci. Rep. 12 (1), 5170. doi:10.1038/s41598-022-08788-8
Li, L., Fu, W., and Luo, M. (2022a). Spatial and temporal variation and prediction of ecosystem carbon stocks in yunnan province based on land use change. Int. J. Environ. Res. Public Health 19 (23), 16059. doi:10.3390/ijerph192316059
Li, X., Fu, J., Jiang, D., Lin, G., and Cao, C. (2022c). Land use optimization in Ningbo City with a coupled GA and PLUS model. J. Clean. Prod. 375, 134004. doi:10.1016/j.jclepro.2022.134004
Li, Y., Ma, J., Li, Y., Jia, Q., Shen, X., and Xia, X. (2023). Spatiotemporal variations in the soil quality of agricultural land and its drivers in China from 1980 to 2018. Sci. Total Environ. 892, 164649. doi:10.1016/j.scitotenv.2023.164649
Liang, J., Li, S., Li, X., Li, X., Liu, Q., Meng, Q., et al. (2021a). Trade-off analyses and optimization of water-related ecosystem services (WRESs) based on land use change in a typical agricultural watershed, southern China. J. Clean. Prod. 279, 123851. doi:10.1016/j.jclepro.2020.123851
Liang, X., Guan, Q., Clarke, K. C., Liu, S., Wang, B., and Yao, Y. (2021b). Understanding the drivers of sustainable land expansion using a patch-generating land use simulation (PLUS) model: a case study in Wuhan, China. Comput. Environ. Urban Syst. 85, 101569. doi:10.1016/j.compenvurbsys.2020.101569
Liang, X., Tian, H., Li, X., Huang, J.-L., Clarke, K. C., Yao, Y., et al. (2021c). Modeling the dynamics and walking accessibility of urban open spaces under various policy scenarios. Landsc. Urban Plan. 207, 103993. doi:10.1016/j.landurbplan.2020.103993
Lin, Z., and Peng, S. (2022). Comparison of multimodel simulations of land use and land cover change considering integrated constraints-A case study of the Fuxian Lake basin. Ecol. Indic. 142, 109254. doi:10.1016/j.ecolind.2022.109254
Liu, H., Gong, P., Wang, J., Clinton, N., Bai, Y., and Liang, S. (2020a). Annual dynamics of global land cover and its long-term changes from 1982 to 2015. Earth Syst. Sci. Data 12 (2), 1217–1243. doi:10.5194/essd-12-1217-2020
Liu, T., Liu, H., and Qi, Y. (2015). Construction land expansion and cultivated land protection in urbanizing China: insights from national land surveys, 1996–2006. Habitat Int. 46, 13–22. doi:10.1016/j.habitatint.2014.10.019
Liu, X., Wei, M., Li, Z., and Zeng, J. (2022). Multi-scenario simulation of urban growth boundaries with an ESP-FLUS model: a case study of the Min Delta region, China. Ecol. Indic. 135, 108538. doi:10.1016/J.ECOLIND.2022.108538
Liu, Y., Hou, X., Li, X., Song, B., and Wang, C. (2020b). Assessing and predicting changes in ecosystem service values based on land use/cover change in the Bohai Rim coastal zone. Ecol. Indic. 111, 106004. doi:10.1016/j.ecolind.2020.106657
Lv, J., Wang, Y., Liang, X., Yao, Y., Ma, T., and Guan, Q. (2021). Simulating urban expansion by incorporating an integrated gravitational field model into a demand-driven random forest-cellular automata model. Cities 109, 103044. doi:10.1016/j.cities.2020.103044
Nie, W., Xu, B., Yang, F., Shi, Y., Liu, B., Wu, R., et al. (2023). Simulating future land use by coupling ecological security patterns and multiple scenarios. Sci. Total Environ. 859, 160262. doi:10.1016/j.scitotenv.2022.160262
Ning, J., Liu, J., Kuang, W., Xu, X., Zhang, S., Yan, C., et al. (2018). Spatiotemporal patterns and characteristics of land-use change in China during 2010–2015. J. Geogr. Sci. 28, 547–562. doi:10.1007/s11442-018-1490-0
Niu, L., and Pan, M. (2021). Research on dynamic simulation of land use change based on geographical weighted CLUE-S model. Int. J. Environ. Technol. Manag. 24 (1-2), 49–61. doi:10.1504/IJETM.2021.115728
Patarasuk, R., and Binford, M. W. (2012). Longitudinal analysis of the road network development and land-cover change in Lop Buri province, Thailand, 1989–2006. Appl. Geogr. 32 (2), 228–239. doi:10.1016/j.apgeog.2011.05.009
Qingzheng, W., Qingyu, G., Yunfan, S., Qinqin, D., Xiong, X., Haiping, L., et al. (2023). Simulation of future land use/cover change (LUCC) in typical watersheds of arid regions under multiple scenarios. J. Environ. Manag. 335, 117543. doi:10.1016/J.JENVMAN.2023.117543
Ren, W., Zhang, X., and Peng, H. (2024). The spatiotemporal changes and trade-off synergistic effects of ecosystem services in the Jianghan Plain of China under different scenarios. Environ. Res. Commun. 6 (3), 035015. doi:10.1088/2515-7620/ad2a8d
Sterling, S. M., Ducharne, A., and Polcher, J. (2013). The impact of global land-cover change on the terrestrial water cycle. Nat. Clim. Change 3 (4), 385–390. doi:10.1038/nclimate1690
Tian, L., Tao, Y., Li, M., Qian, C., Li, T., Wu, Y., et al. (2023). Prediction of land surface temperature considering future land use change effects under climate change scenarios in nanjing city, China. Remote Sens. 15 (11), 2914. doi:10.3390/rs15112914
Vu, H. T. D., Tran, D. D., Schenk, A., Nguyen, C. P., Vu, H. L., Oberle, P., et al. (2022). Land use change in the Vietnamese Mekong Delta: new evidence from remote sensing. Sci. Total Environ. 813, 151918. doi:10.1016/j.scitotenv.2021.151918
Wang, Q., Guan, Q., Sun, Y., Du, Q., Xiao, X., Luo, H., et al. (2023d). Simulation of future land use/cover change (LUCC) in typical watersheds of arid regions under multiple scenarios. J. Environ. Manag. 335, 117543. doi:10.1016/j.jenvman.2023.117543
Wang, Y., Liang, D., Wang, J., Zhang, Y., Chen, F., and Ma, X. (2023a). An analysis of regional carbon stock response under land use structure change and multi-scenario prediction, a case study of Hefei, China. Ecol. Indic. 151, 110293. doi:10.1016/J.ECOLIND.2023.110293
Wang, Z., Fu, H., Liu, H., and Liao, C. (2023c). Urban development sustainability, industrial structure adjustment, and land use efficiency in China. Sustain. Cities Soc. 89, 104338. doi:10.1016/j.scs.2022.104338
Wang, Z., Zhang, J., Li, H., and Zhang, F. (2023b). Spatiotemporal pattern and multi-scenario simulation of ecological risk in mountainous cities: a case study in Chongqing, China. Environ. Monit. Assess. 195 (6), 760. doi:10.1007/s10661-023-11398-0
Wen, D., Wang, X., Liu, J., Xu, N., Zhou, W., and Hong, M. (2023). Maintaining key ecosystem services under multiple development scenarios: a case study in Guangdong–Hong Kong–Macao greater bay Area, China. Ecol. Indic. 154, 110691. doi:10.1016/J.ECOLIND.2023.110691
Winkler, K., Fuchs, R., Rounsevell, M., and Herold, M. (2021). Global land use changes are four times greater than previously estimated. Nat. Commun. 12 (1), 2501. doi:10.1038/s41467-021-22702-2
Wu, J., Luo, J., Zhang, H., Qin, S., and Yu, M. (2022b). Projections of land use change and habitat quality assessment by coupling climate change and development patterns. Sci. Total Environ. 847, 157491. doi:10.1016/J.SCITOTENV.2022.157491
Wu, Q., Yang, R., and Yang, Z. (2022a). A study on the rationality of land use change in the Dianchi Basin during the last 40 years under the background of lake revolution. Sustainability 14 (18), 11479. doi:10.3390/su141811479
Wu, X., Lin, A.-Q., Li, Y., Wu, H., Cen, L.-Y., Liu, H., et al. (2021). Simulating spatiotemporal land use change in middle and high latitude regions using multiscale fusion and cellular automata: the case of Northeast China. Ecol. Indic. 133, 108449. doi:10.1016/J.ECOLIND.2021.108449
Xiao, C., Wang, Y., Yan, M., and Chiaka, J. C. (2024). Impact of cross-border transportation corridors on changes of land use and landscape pattern: a case study of the China-Laos railway. Landsc. Urban Plan. 241, 104924. doi:10.1016/j.landurbplan.2023.104924
Xu, C., Zhang, Q., Yu, Q., Wang, J., Wang, F., Qiu, S., et al. (2023a). Effects of land use/cover change on carbon storage between 2000 and 2040 in the Yellow River Basin, China. Ecol. Indic. 151, 110345. doi:10.1016/J.ECOLIND.2023.110345
Xu, D., Zhang, K., Cao, L., Guan, X., and Zhang, H. (2022a). Driving forces and prediction of urban land use change based on the geodetector and CA-Markov model: a case study of Zhengzhou, China. Int. J. Digital Earth 15 (1), 2246–2267. doi:10.1080/17538947.2022.2147229
Xu, L., Liu, X., Tong, D., Liu, Z., Yin, L., and Zheng, W. (2022b). Forecasting urban land use change based on cellular automata and the PLUS model. Land 11 (5), 652. doi:10.3390/land11050652
Xu, W., Song, J., Long, Y., Mao, R., Tang, B., and Li, B. (2023b). Analysis and simulation of the driving mechanism and ecological effects of land cover change in the Weihe River basin, China. J. Environ. Manag. 344, 118320. doi:10.1016/J.JENVMAN.2023.118320
Zeng, W., Tang, H., Liang, X., Hu, Z., Yang, Z., and Guan, Q. (2023). Using ecological security pattern to identify priority protected areas: a case study in the Wuhan Metropolitan Area, China. Ecol. Indic. 148, 110121. doi:10.1016/j.ecolind.2023.110121
Zhang, L., Wang, C., Liang, G., Cui, Y., and Zhang, Q. (2020). Influence of land use change on hydrological cycle: application of SWAT to Su-Mi-Huai area in Beijing, China. Water 12 (11), 3164. doi:10.3390/w12113164
Zhang, S., Yang, P., Xia, J., Wang, W., Cai, W., Chen, N., et al. (2022). Land use/land cover prediction and analysis of the middle reaches of the Yangtze River under different scenarios. Sci. Total Environ. 833, 155238. doi:10.1016/J.SCITOTENV.2022.155238
Zhang, Y., Yu, P., Tian, Y., Chen, H., and Chen, Y. (2023). Exploring the impact of integrated spatial function zones on land use dynamics and ecosystem services tradeoffs based on a future land use simulation (FLUS) model. Ecol. Indic. 150, 110246. doi:10.1016/J.ECOLIND.2023.110246
Zheng, F., Huang, J., Feng, Z., and Xiao, C. (2021). Impact of the Kunming–Bangkok highway on land use changes along the route between Laos and Thailand. Land 10 (9), 991. doi:10.3390/land10090991
Zhou, L., Dang, X., Sun, Q., and Wang, S. (2020a). Multi-scenario simulation of urban land change in Shanghai by random forest and CA-Markov model. Sustain. Cities Soc. 55, 102045. doi:10.1016/j.scs.2020.102045
Zhou, Y., Li, X., and Liu, Y. (2020b). Land use change and driving factors in rural China during the period 1995-2015. Land Use Policy 99, 105048. doi:10.1016/j.landusepol.2020.105048
Keywords: sustainable development, land use change, driving mechanism, multi-scenario simulation, land use policy, National Land Survey Data, Plus model, Jianghan Plain
Citation: Zhou H, Tang M, Huang J, Mei X and Zhao H (2024) Driving mechanisms and multi-scenario simulation of land use change based on National Land Survey Data: a case in Jianghan Plain, China. Front. Environ. Sci. 12:1422987. doi: 10.3389/fenvs.2024.1422987
Received: 25 April 2024; Accepted: 09 July 2024;
Published: 24 July 2024.
Edited by:
Merja H. Tölle, University of Kassel, GermanyReviewed by:
Dewen Liu, Nanjing University of Posts and Telecommunications, ChinaQinghai Guo, Zhejiang Sci-Tech University, China
Copyright © 2024 Zhou, Tang, Huang, Mei and Zhao. This is an open-access article distributed under the terms of the Creative Commons Attribution License (CC BY). The use, distribution or reproduction in other forums is permitted, provided the original author(s) and the copyright owner(s) are credited and that the original publication in this journal is cited, in accordance with accepted academic practice. No use, distribution or reproduction is permitted which does not comply with these terms.
*Correspondence: Heng Zhou, emhAd3VzdC5lZHUuY24=; Mingdong Tang, MjAyMDAxMTQ0MDI0QHd1c3QuZWR1LmNu