 Yu Chen
 Xinyu Zhao1
95% of researchers rate our articles as excellent or good
Learn more about the work of our research integrity team to safeguard the quality of each article we publish.
Find out more
ORIGINAL RESEARCH article
Front. Environ. Sci. , 30 July 2024
Sec. Land Use Dynamics
Volume 12 - 2024 | https://doi.org/10.3389/fenvs.2024.1422077
Typical black soil regions in Northeastern China (TBSN) are facing problems of degradation of ecosystem services (ESs) and spatial conflicts between cropland and ecological land. Ecological Protection Redline (EPR) policy is one of the first national policies to utilizing multiple ESs. However, there is no standardized framework of delineation and validation for TBSN. In this study, the framework of Ecological Protection Redline delineation was further improved in three aspects of the ecosystem, namely, service function, ecological sensitivity, and biodiversity. Specifically, the framework considered the conflict between high-quality cropland and ecological land in the TBSN. We examined EPR effectiveness by comparing ESs and trade-off/synergistic relationships of different land use scenarios for 2035. The results show that 1) the EPR delineation threshold for each key indicator was determined to be 15%, considering the quality level of cropland. The ecological redline area of 89,593.63 km2 was identified, which was concentrated in the southwestern part of the Mengdong typical black soil subzone and Songnen typical black soil subzone. 2) Compared to the current ecological protection scenario and current ecological protection redline scenario, the optimized EPR scenario was the best solution to guarantee the sustainable development of the TBSN, maximizing ESs, weakening trade-offs, and strengthening synergistic relationships between them. The results of the study provided a theoretical basis for land use planning and the scientific management of ecosystems in the TBSN.
Ecosystem services (ESs) are defined as the benefits that humans derive directly or indirectly from ecosystems (Costanza et al., 2014). They are crucial in forming and maintaining the environmental conditions and the material basis for human survival and development. China has established the concept of “a community of life in mountains, waters, forests, lakes, lakes, grasses, and sands” and has launched major ecological protection and restoration projects at the national and local levels, such as the Three-North Shelter Forest System Project and the Grain to Green Project, with the aim of maximizing one or more types of ESs (Li et al., 2022a). However, with human influence on the natural environment, the goal of diversifying ESs and maximizing benefits is difficult due to people tending to maximize a particular ecosystem service by changing a particular land use type, further exacerbating the trade-off between ESs (Barbier et al., 2008; Carpenter et al., 2009; Fridman and Kissinger, 2018). Spatial heterogeneity in land use change leads to spatial heterogeneity in ESs (He et al., 2023; Yu et al., 2023). Meta-analysis of 89 ecological restoration projects globally has shown that these initiatives can result in 25 percent recovery of ESs, but they do not fully restore ecosystem service to their pre-degradation levels (Wang, 2019). Although ecological protection and restoration projects are continuously implemented, high-intensity human agricultural activities have led to a significant expansion of cultivated land, a reduction in the ability of the root system to hold soil, retain sediment, intercept and filter nitrogen, and a significant decline in soil retention and water purification capacity (Fang et al., 2021; Li et al., 2022b). Decline in vegetation cover due to the expansion of arable land has resulted in a significant decline in carbon storages and habitat quality (He and Jiang, 2023). Therefore, the scientific formulation of the ecological protection policy is significant for maximizing ecological benefits and ensuring the stability of ecosystems.
China is currently facing a huge environmental crisis, with some regions struggling to maintain a stable, coordinated, and sustainable supply of ESs, and land degradation in the form of soil erosion, desertification, and salinization is another serious threat to China’s ecology and food security (Bai et al., 2016; Maron et al., 2017). China has proposed a new strategy called the “Ecological Protection Redline (EPR)” that incorporates ESs to tackle issues such as incomplete coverage, conflicting functions, and overlapping goals in the current planning policies and ecological projects (Zhang et al., 2020; Li et al., 2021a; Zhang et al., 2022). The EPR areas contain essential ecological functions, rich biodiversity, and high ecological fragility, and EPR is one of the first spatial planning approaches to incorporate ESs into land management practices (Jiang et al., 2019). The concept of “community of life in mountain, water, forestland, cropland, lake, grassland, and sand” has further strengthened the influence of the EPR on ecological space management. Although China has made progress in EPR research, the framework of EPR delineation and effectiveness still faces many challenges. First, the region scale of EPR delineation is unscientific. Most of the delineation of EPR focuses on provinces (Feng et al., 2022), cities (Yang et al., 2020a), and watersheds (Chen et al., 2021), with fewer studies conducted on a larger scale in typical regions. Second, the delineation of EPR in all regions is based on consistent indicators, following the Technical Guidelines for Delineating Ecological Redline (Bai et al., 2018). However, this indicator of guideline has no particularity to specific regions. The proportion of thresholds may also vary across regions (city, county, and district) due to differences in ecological importance at spatial scales (Yang et al., 2020b). Finally, however, the current framework lacks the ability to verify whether EPR effectively improves ESs and maximizes ecological benefits. In this background, it is important to consider developing a strategic framework for EPR delineation and an assessment framework for measuring the effectiveness of its implementation for typical regions so as to provide a scientific foundation and a methodological approach for the optimization of the spatial planning.
The typical black soil region of Northeastern China (TBSN) is located in one of the world’s three major black soil areas and serves as a crucial grain-producing region and commercial grain production base (Wang et al., 2022). However, high-intensity human activities have led to a continuous transformation of land use types and patterns. More importantly, the continuous expansion of a large number of cultivated land and built-up land has occupied a large amount of ecological land, such as forestland, grassland, and wetland, resulting in weakening the ecological functions of biodiversity, nutrient maintenance, carbon storage, water purification, and soil retention (Mao et al., 2019; Yang et al., 2021). Research has demonstrated that maximizing the ecological protection capabilities of natural ecosystems such as forestland, grassland, and wetland can control and repair the degradation of the black soil land. At the same time, it can prevent the soil erosion and salinization of the black soil land and thus achieve the goal of sustainable utilization of the black soil land (Zhang et al., 2021). Therefore, it is important to address the conflict between high-quality cropland and ecological land and select guiding indicators to formulate a framework for the EPR delineation in the context of the implementation of the integrated development strategy of “mountain, water, forestland, cropland, lake, grassland, and sand.” In addition, how to incorporate EPR into the establishment of future land use scenarios is crucial for improving the rationality of future land management decisions and realizing sustainable use of black soil land.
The purpose of this study was to construct a guiding framework for EPR delineation in the TBSN and validate the effectiveness of EPR in terms of ESs and their trade-off/synergistic relationships. This study aims at the following detailed objectives: 1) selecting the EPR indicators representing ecological status and problems in TBSN from ESs, ecological sensitivity, and biodiversity; 2) determining EPR indicator thresholds and optimal EPR areas combined with cropland quality evaluation in TBSN; and 3) comparing ESs and their trade-off/synergistic relationship under different scenarios to verify the effectiveness of the EPR of TBSN. The results of this study can provide a reference for promoting comprehensive ecosystem management and land use pattern optimization so as to realize the sustainable utilization of black soil land.
Liu Baoyuan et al. referred the concentrated distribution area of black soils and black calcareous soils the “the typical black soil region of Northeastern China” (Liu et al., 2021). The area covers 333,000 km2, accounting for 23.2% of the total area of the Northeast Region and involving 138 county-level administrative districts, and is divided into three sub-areas according to the geographical location from west to east, namely, the Menddong typical black soil subzone (MDTB), Songnen typical black soil subzone (SNTB), and Sanjiang typical black soil subzone (SJTB) (Figure 1). The temperature varies greatly throughout the year, average annual precipitation increases gradually from west to east (311.3–837.5 mm), and altitude decreases gradually from west to east (0–2029 km). TBSN has rich and diverse ecosystems (forestland, grassland, wetland, and cropland), and cropland and grassland are the most dominant land use types, which play a key role in ecological conservation and food security in China (Tian et al., 2020). Since the 1950s, the proportion of natural ecosystems such as forestland, grassland, and wetland has declined after large-scale reclamation, while the proportion of agri-ecosystems has increased significantly, and the original ecological functions have been greatly damaged (Li et al., 2013; Xiang et al., 2022). Intense human activities have led to an imbalance in the water, soil, climate, and ecological environment of the TBSN, seriously threatening the sustainable development of food security.
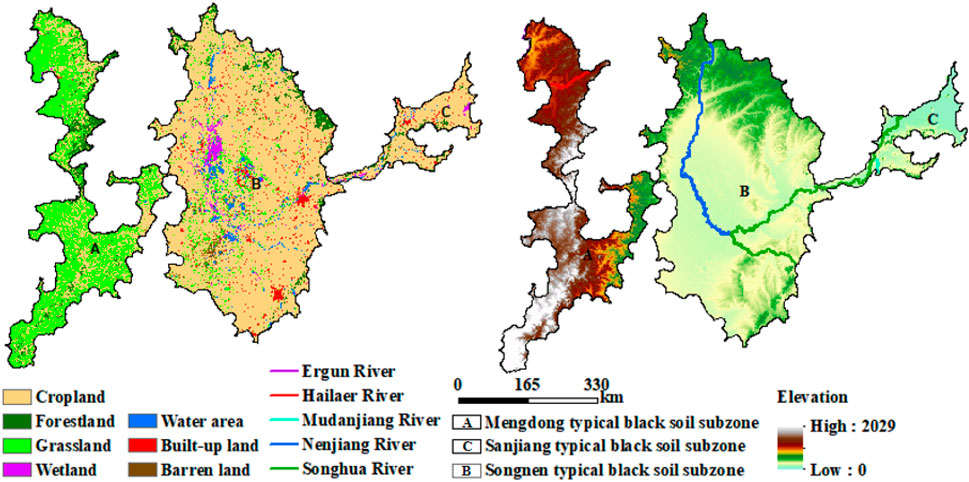
Figure 1. Geographical location of TBSN and general geographical features.
The LULC maps were provided by the Climate Change Initiative (CCI, https://maps.elie.ucl.ac.be/CCI/viewer). Considering the requirement of the study, 37 LC types were reclassified into seven major LC categories: cropland, forestland, grassland, wetland, water area, built-up land, and barren land. Based on the existing representative research results and the regional characteristics of the typical black soil area in the Northeast, forestland, grassland, wetland, and water body are referred to as the ecological land.
The others sources of data are shown in Table 1. As the study period was short, changes in soil properties, organic carbon, and root depth were assumed to be negligible. All data were converted into a unified projection coordinate system (Albers conical equal-area) and resampled to a spatial resolution of 300 m.
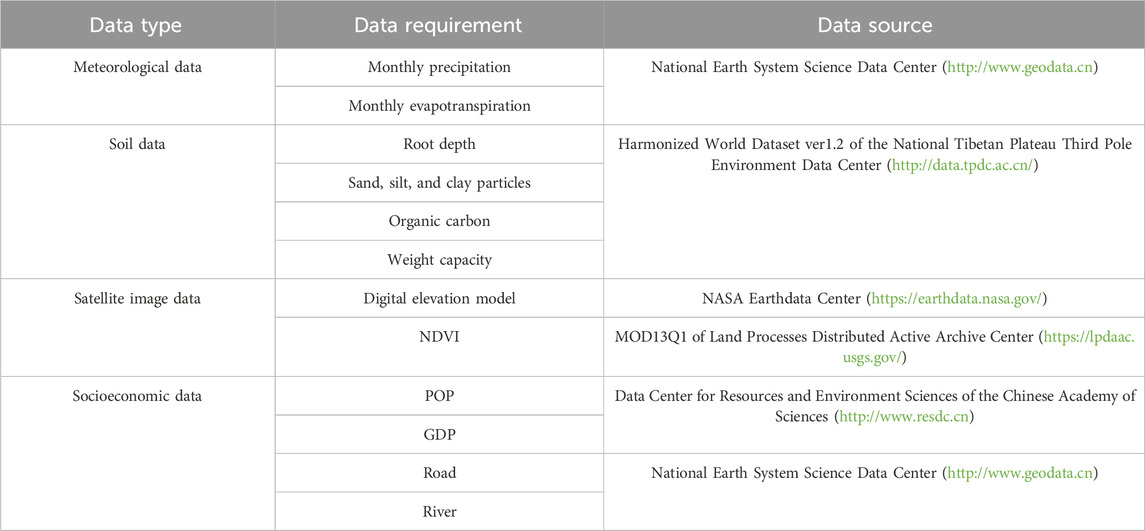
Table 1. Data descriptions and sources used in this study.
Considering the serious ecological problems, stakeholder concerns, and field study results in the TBSN (Zhang et al., 2021; Yang et al., 2020a), water retention (WR), water purification (WP), soil retention (SR), carbon storage (CS), and habitat quality (HQ) are selected. Water yield (For WR), nitrogen export and phosphorus export (For WP), soil retention, carbon storage, and habitat quality were quantified using the InVEST model (Ver 3.11.0). The model and requested data are listed in Table 2.
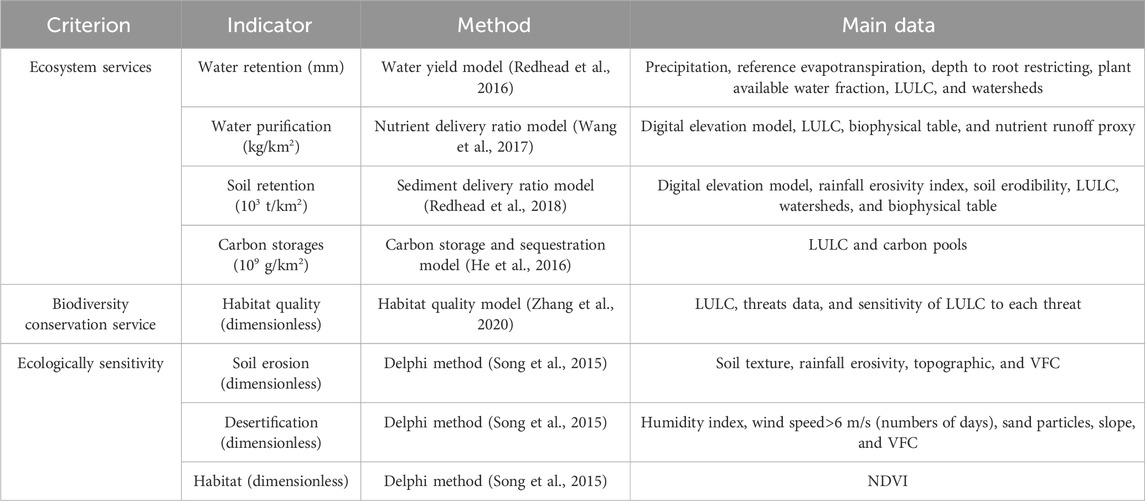
Table 2. Indicators, data, and methods to assess ESs and sensitivity.
We compared the results of water yield from the InVEST simulation with the surface water resources published in the Water Resources Bulletin, and the error was controlled at 0.09, which indicated that the simulation was effective. The results of water purification, soil retention, carbon storage, and habitat quality from the InVEST simulation were compared with the related literature, and the results were more consistent (Mao et al., 2019; Xiang et al., 2022).
Ecological sensitivity is the degree to which ecosystems reflect disturbances from human activities and changes in the natural environment, indicating the ease and likelihood of the occurrence of regional ecological problems (Ouyang et al., 2000; Mao et al., 2019). Taking into account the natural and socio-economic realities of the TBSN (Zhang and Huisingh, 2018; Cao et al., 2021; Wang et al., 2022b), TBSN is facing the problems of soil erosion, desertification, and habitat quality degradation. At the same time, with reference to the Interim Regulations on Ecological Functional Zoning Techniques and Guidelines for the Delineation of Ecological RedLines issued by the State Environmental Protection Administration (SEPA), soil erosion, desertification, and habitat are important indicators to characterize ecological sensitivity. The two documents also elaborate on the specific process of assessing ecological sensitivity so as to quantitatively reveal the degree of ecological sensitivity and its spatial distribution pattern. Soil erosion sensitivity was evaluated by selecting soil texture, rainfall erosivity, topography, and vegetation cover; land desertification sensitivity was evaluated by selecting windy days, dryness index, soil texture, slope, and vegetation cover; and habitat sensitivity was evaluated by selecting the normalized vegetation index (NDVI), which reflects the in situ state of vegetation and plant growth.
In this study, the evaluated steps are as follows: 1) Selection of evaluation indicators. Considering the characteristics of TBSN and referring to the related literature (Liu et al., 2020; Song et al., 2022), we selected 11 indicators from three aspects: natural conditions, soil conditions, and soil management. 2) Determination of indicator weights. The AHP method decomposes complex problems into multiple specific indicators and establishes a comprehensive evaluation through the levels of objectives, guidelines, and indicators (Liu et al., 2020). The AHP-entropy method was utilized to determine the weight of the indicators by combining subjective and objective weighting (Table 3). At the same time, the consistency ratios of the distance array construction were all lower than 0.1, which was verified by consistency and had satisfactory consistency. 3) Calculation of the cropland quality score. To avoid dimensional inconsistencies in the assessment process caused by the simultaneous existence of quantitative and qualitative indicators, we quantified the indicators using percentages (0–100). The cropland quality score was obtained through a weighted sum model. 4) Cropland quality grading. The score of cropland was classified into 10 grades by the cumulative frequency curve method (Song et al., 2022).
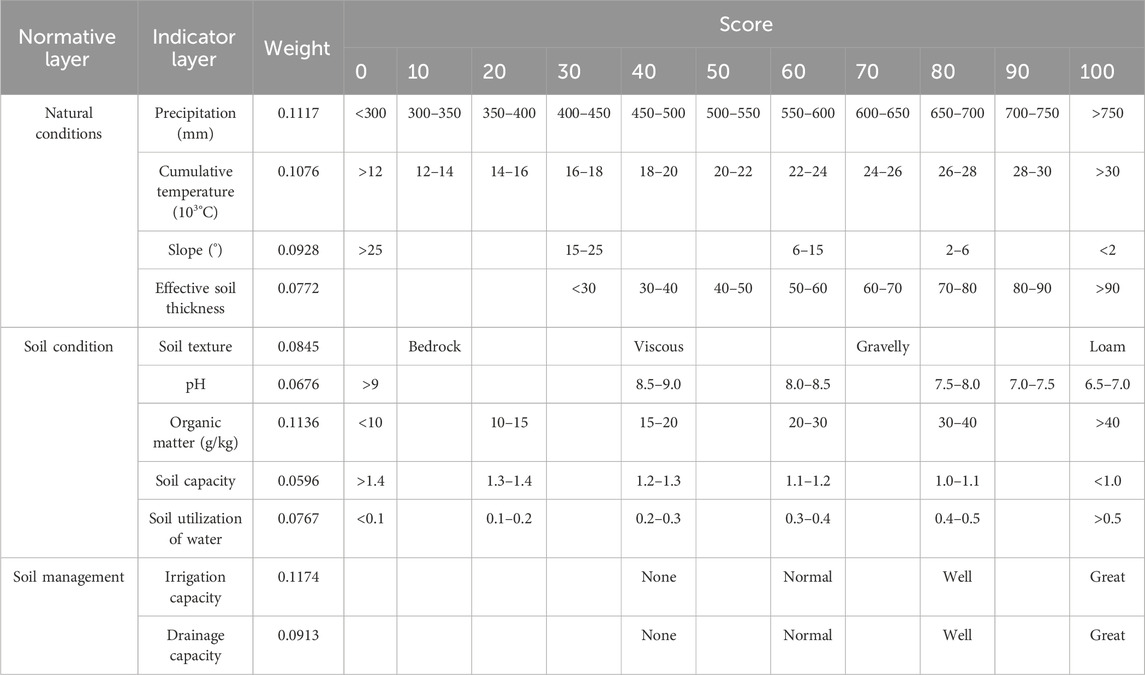
Table 3. Cropland quality evaluation index system.
The EPR delineation in the TBSN aims to protect important ecological function areas, ecologically sensitive areas, and important species habitats without destroying high-quality cropland. The identification of EPR areas in this study consists of three main steps: 1) Selection and assessment of evaluation indicators. Combined with the ecological problems of the TBSN, water retention (WR), water purification (WP), soil retention (SR), carbon storage (CS), and habitat quality (HQ) were selected to characterize ecosystem functions, and soil erosion, land desertification, and habitat were selected to characterize ecological sensitivity. 2) Determination delineation thresholds of indicators. We determined the top 5%, 10%, 15%, 20%, and 25% of the evaluation results of each indicator as extremely important ecological function areas, extremely sensitive ecological areas, and extremely important biodiversity protection areas. Comparison with the results of the cropland quality grade evaluation reveals that the best threshold for the delineation of indicators was 15% under the premise of guaranteeing that high-quality cropland is not destroyed. 3) Identification of EPR areas. The EPR was identified by spatial superposition of the three kinds of extremely important areas to determine the optimal EPR areas.
According to the historical land use transfer law of the TBSN, combined with the current development situation and future planning, the following three scenarios are set up: 1) Currently ecological protection scenario (CES): considering the existing ecological protection measures (except ERP), slowing down the pace of urbanization; 2) Current EPR scenario (CRS): under current EPR areas, strict control of the rate of urbanization and agricultural production, and ecological land cannot transfer to others land use types; 3) Optimized EPR scenario (ORS): within the optimized EPR areas, the expansion of cropland and built-up land is prohibited. Outside the EPR areas, the area of ecological land should be increased appropriately in accordance with the policy of Grain to Green Project.
The PLUS model combines the rule mining framework based on the land expansion analysis strategy model (LEAS) and the CA model based on multi-class random patch seeds (CARS) (Liang et al., 2021a). The simulation accuracy of this model is higher than that of different models frequently employed in relevant studies (Li et al., 2021b). Therefore, this study used the PLUS model to simulate land use and a random sampling approach to obtain 20% of the data as training samples based on the land use data in 2005 and 2020. To assess the likelihood of each land use type suitable for TBSN, we chose 12 driving elements of land use change as predictor variables, and the complicated link between each land use type and the driving factors was established using the random forest algorithm. The land demand, transfer cost matrix, and neighborhood weight of the model were set to simulate different types of land use patches under three scenarios in 2035.
Based on the land use type in 2005, the results of the land use simulation in 2020 were obtained. Comparing the 2020 simulation results to the real land use data allowed for the calculation of the overall accuracy and Kappa coefficient. The closer the Kappa coefficient is to 1, the higher the simulation accuracy, with a value greater than 0.8, indicating acceptable model accuracy (Zhou et al., 2022). The overall accuracy and Kappy coefficient are both greater than 0.8, and the overall simulation effect is good.
Spatial dependence of ecosystem services across regions and land types is due to spatial attributes and distribution patterns of ecosystem services constrained by geographical factors (Wu et al., 2021). In this study, the cities and counties in the TBSN were used as the base unit, and the bivariate global Moran’s I was calculated to determine the overall correlation of the TBSN. A positive value of the Moran’s I index indicates that the ecosystem services as a whole show a synergistic relationship, while a negative value of the Moran’s I index indicates that the ecosystem services as a whole in the study area show a trade-off relationship. The larger the absolute value of the Moran’s I index, the more significant the trade-off/synergistic relationship is, while I = 0 indicates no correlation.
The local Moran’s I index can only reflect the overall relationship of ESs. However, due to the influence of spatial heterogeneity of land use types on the subsurface, the local ecosystem services in the region will show different trade-off/synergistic relationships (Shaikh et al., 2021). Therefore, the bivariate spatial autocorrelation (Moran’s I) in GeoDA was used to analyze the local ecosystem service trade-off/synergistic relationships. According to the local spatial correlation index, homogeneous “high–high” agglomeration and “low–low” agglomeration characteristics indicate synergistic relationships, while heterogeneous agglomerations indicate trade-offs, and the others are uncorrelated (Liang et al., 2021b).
ESs of the TBSN showed significant spatial differentiation (Figure 2). Both WR and SR output showed a distribution pattern of “high in the west and low in the east,” and NE and PE output showed a distribution pattern of “low in the west and high in the east,” primarily due to the high intensity, irrationality, or utilization of cropland by human beings. The spatial distribution patterns of CS and HQ were similar, with high supply areas concentrated in the central and northeastern parts of the MDTB and SNTB, which had a high degree of vegetation cover. Conversely, low-supply areas are concentrated in the other regions with a high intensity of human activities.
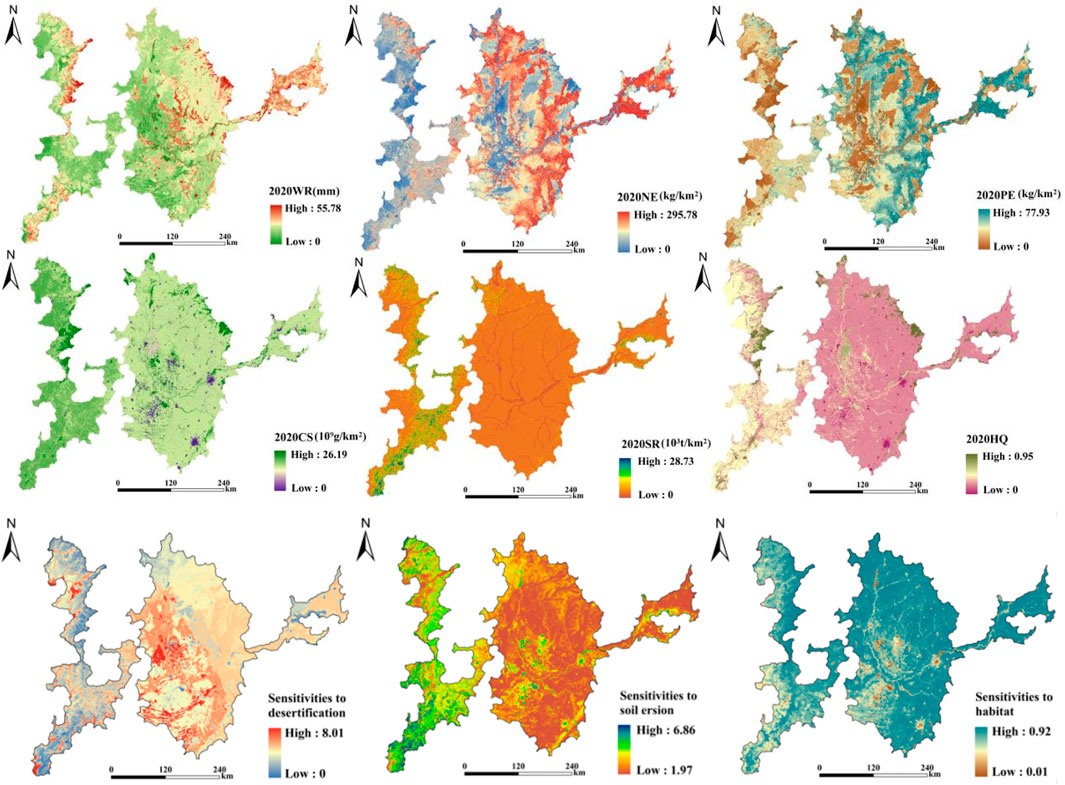
Figure 2. Spatial distribution of ESs and ecological sensitivity in the TBSN.
Areas of high soil erosion sensitivity, land desertification sensitivity, and habitat quality sensitivity were primarily concentrated in the southern part of the MDTB and the southwestern part of the SNTB. The southern part of the MDTB has a greater degree of topographic relief, with rainfall exerting a stronger erosive impact on soil erosion. The region has high evapotranspiration, strong winds throughout the year in winter and spring, and severe drying conditions, resulting in weak resistance to wind and sand erosion. In contrast, the southwestern part of the SNTB had lower topographic relief, but the land use type is dominated by barren land. With a high content of sand particles in the soil, the number and duration of windy days increase, resulting in an increasing effect of wind erosion on the surface soils.
The spatial distribution of cropland and cropland quality scores was obtained by overlaying the TBSN (Figure 3). The average cropland quality score of the TBSN was 71.44. High-grade (1.2.3), medium-grade (4.5.6.7), and low-grade (8.9.10) cropland accounted for 9.8%, 63.03%, and 27.12% of the total cropland area, respectively. We found that the quality of cropland was higher in the eastern part of the SNTB and SJTB. However, the quality of cropland in the southwestern part of the SNTB was low. The soil texture in this region has high sand content, low soil fertility, poor water, fertilizer retention capacity, and poor agricultural production conditions (especially irrigation conditions).
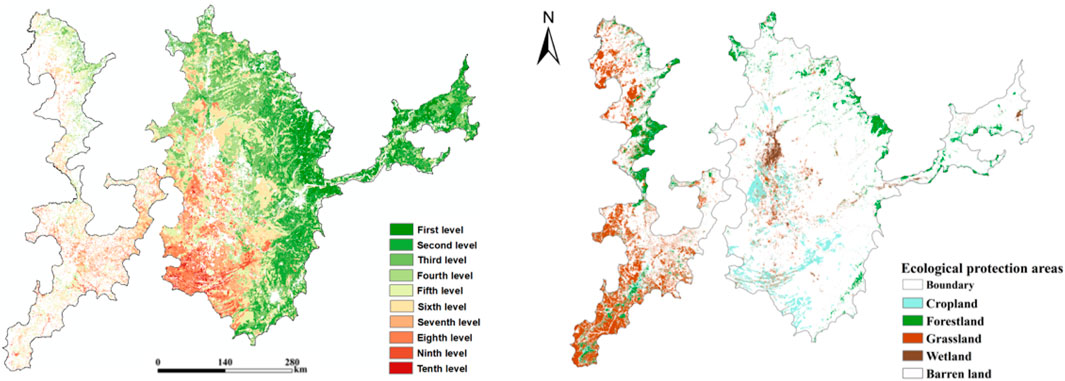
Figure 3. Spatial distribution of cropland quality and ecological protection areas.
Compared with the result of cropland quality grade evaluation, 15% was determined as the key indicator threshold, and the EPR area was determined. The EPR area of the TBSN had a total area of 89,593.63 km2, accounting for 24.82% of the total area (Figure 3). The EPR area was mainly located in the southwestern part of the MDTB and SNTB, with forestland and grassland dominating in the MDTB and cropland and wetland dominating in the SNTB. Within this area, ecological barriers should be established, and on the premise of ensuring that ecological functions are not decreased, ecological restoration should be carried out in sensitive and fragile areas. Specifically, the occupation of cropland should be reduced, large-scale human development and construction activities should be prohibited, and the area of ecological land should be increased.
In this study, taking into account the development trend of the TBSN and the delineation of EPR, 12 driving elements of land use change were selected as predictor variables and inputted into the PLUS model (Figure 4), and the land use patterns under CES, CRS, and ORS were predicted (Figure 5). In general, the land use pattern in each scenario was basically similar, but the trends of the area of cropland, forestland, grassland, and built-up land were different. Different land use types show significant spatial heterogeneity, resulting in spatial heterogeneity in ESs (He et al., 2023; Yu et al., 2023).
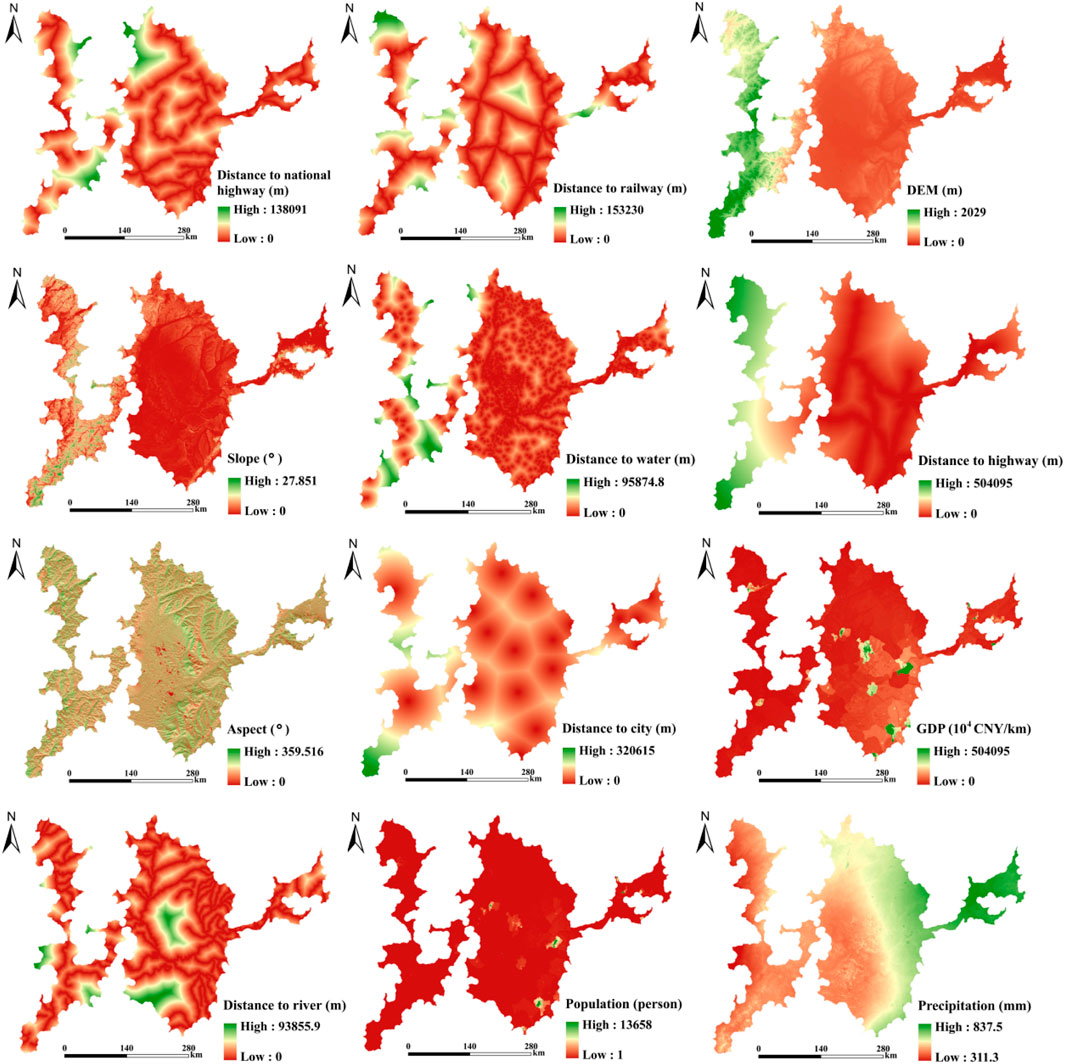
Figure 4. Explanatory variables of location suitability.
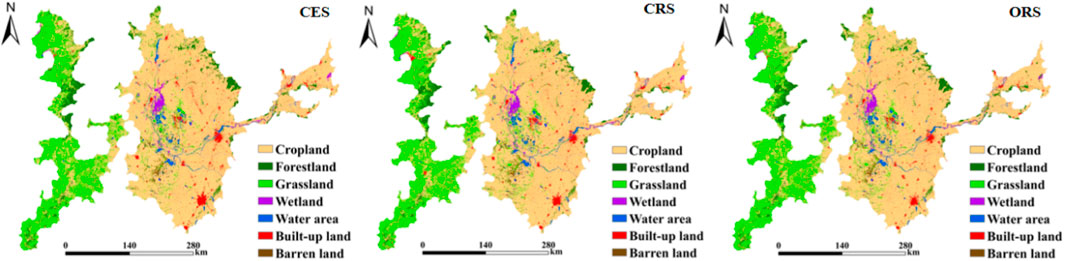
Figure 5. Land use pattern under three scenarios in 2035.
Under the CES, the area of cropland in the TBSN increased by 489.36 km2, the area of built-up land increased by 789.3 km2, the area of grassland decreased by 1,790.53 km2, and the area of forestland increased by 458.92 km2. Under CES, the area of cropland increased by 807.50 km2, and the rest of the land categories increased or decreased by a small margin, and the expansion of built-up land was better-restrained. In the ORS, under the premise of protecting high-quality cropland, the area of cropland decreased by 1,479.03 km2, the area of forestland and grassland increased effectively by 475.92 km2 and 767.12 km2, respectively, and the built-up land increased by 351.09 km2 under certain constraints.
The change in ESs under different scenarios showed obvious spatial heterogeneity, and the ES capacity of some rasters under CES and CRS still showed a decreasing trend (Figure 6). The ORS reduced the impact of land use change on ESs, maximized increased ESs, and minimized trade-offs between ESs.
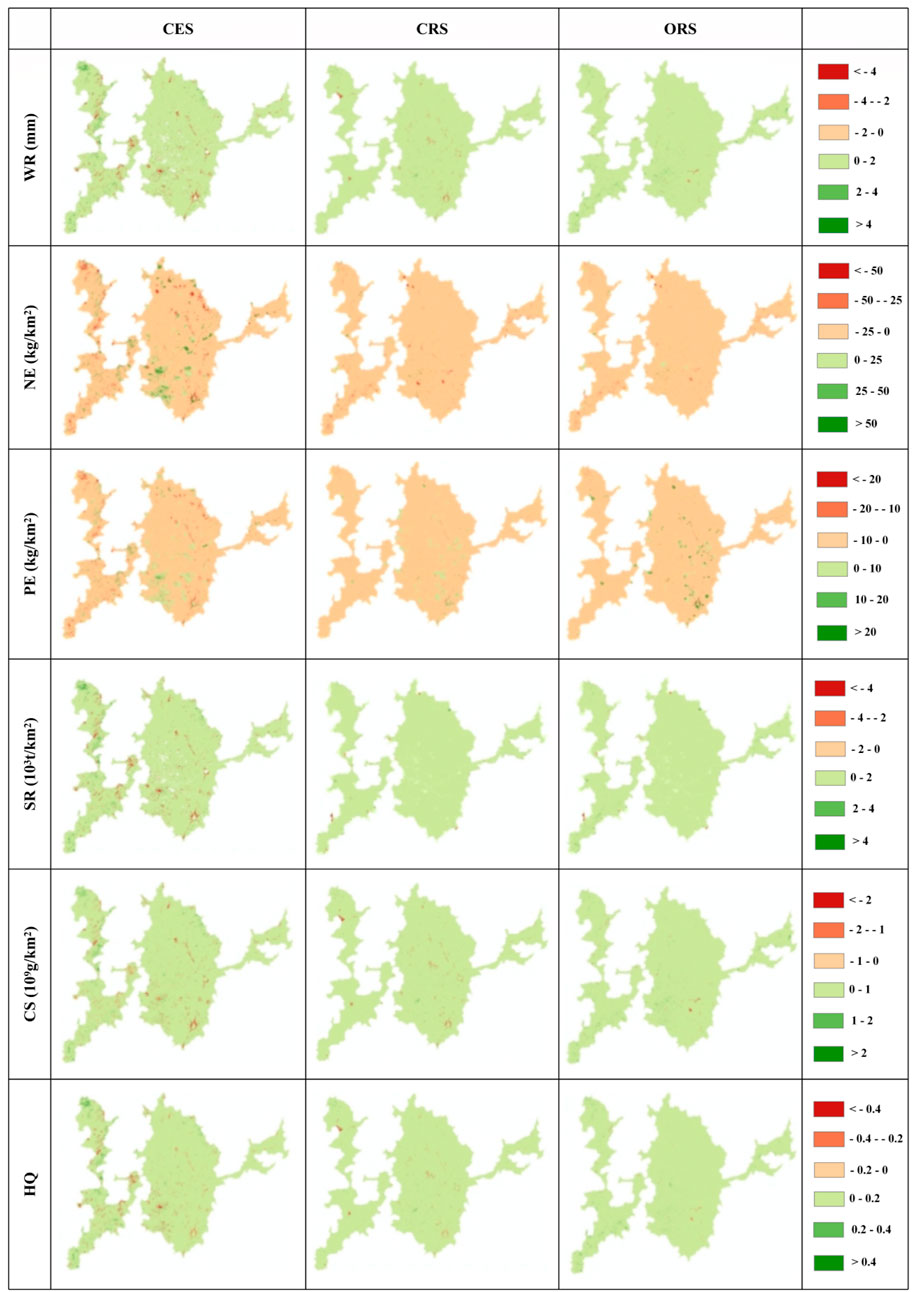
Figure 6. Spatial changes in ESs under three scenarios in 2035.
After optimization, the trade-off and synergistic relationship between ESs under different scenarios did not differ from the base year, while the strength of the relationship changed significantly (Figure 7). Under the ORS, the strength of WR–NE and WR–PE synergies decreased slightly, indicating that the strength of trade-offs between WR and WP weakened. The strength of trade-offs between NE, PE, and other ESs increased, indicating that the strength of synergistic relationship between WP and other ESs increased. Measuring the trade-off relationship at the local scale, the spatial change trend of the trade-off and synergistic relationship under the CES and CRS did not differ much from that of the base year, whereas the number of cities and counties synergistic relationship with each ES under the ORS increased to a high and large extent, especially in the case of the SNTB.
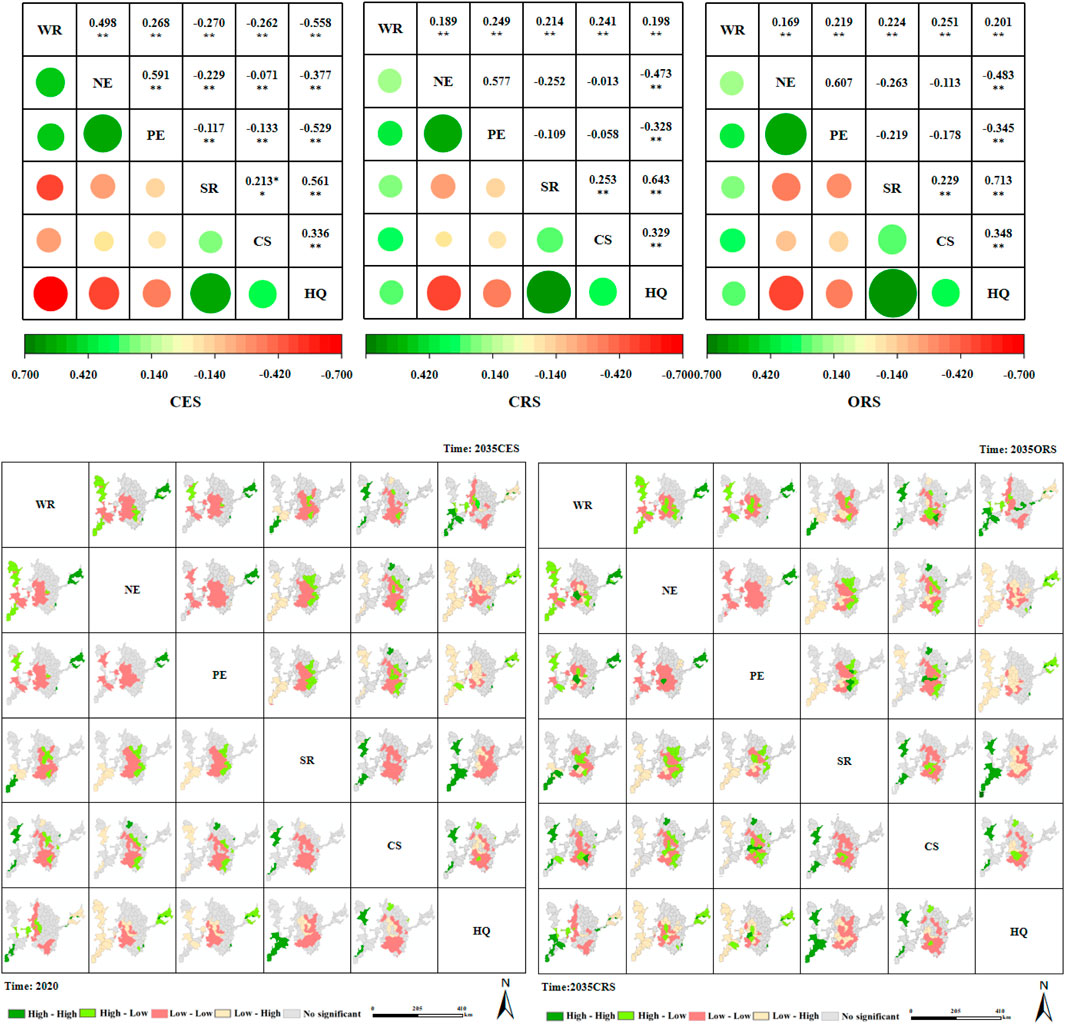
Figure 7. Trade-offs/synergistic relationships under different scenarios in 2035.
In this study, we developed the current EPR delineation framework that relies on traditional rigid delineation and further optimized the selection of an indicator and determination of indicator thresholds. First, we selected and evaluated indicators from the three aspects: ecological function importance, ecological sensitivity, and biodiversity in the TBSN. Due to the large topographic relief, high regional evapotranspiration, and high sand content in the southern part of the MDTB and the southwestern part of the SNTB, soil erosion sensitivity, land desertification sensitivity, and habitat sensitivity were high (Chi, 2015). Due to the high intensity of cropland utilization and irrational cropland occupation, the SR and WP capacity of the SNTB and MDTB were low (Wang et al., 2022a). Second, the EPR area and high-quality cropland cannot coexist due to the conflict of land management objectives in China (Liang et al., 2022). We evaluated the quality of cropland in the TBSN from natural conditions, soil conditions, and soil management and used the level of cropland quality grade as the scientific basis for the indicator threshold of the EPR delineation. The eastern part of the SNTB and SJTB has flat terrain, soil types dominated by black soils, black calcium soils, and meadow soils with a high organic matter content, irrigation conditions that fully meet the demand, and a sound drainage system which results in high-quality cropland (Wang et al., 2022b). In the southwestern part of the SNTB, the soil texture has a high sand content, low soil fertility, poor water and fertilizer retention capacity, and poor agricultural production conditions (especially irrigation conditions), resulting in a low-quality cropland. The results of this study showed that the optimal indictor threshold for EPR delineation in the TBSN was 15% when the high-quality cropland was not destroyed. This approach made the structural conflict between cropland and ecological land use mitigated to a certain extent.
If the area allowed to change is limited, rational land-use pattern optimization will reduce trade-offs between multiple ESs and enhance the synergistic relationship while improving ESs, in order to achieve an overall improvement in ESs and alleviate the pressure on land resource utilization (Zheng et al., 2019). Development planning in TBSN emphasizes the establishment of ecological barriers and the optimization of ES patterns which maintain the stability of multiple ecosystem functions and the synergistic development of multiple ES (Wang et al., 2021). In this study, we compared the levels of each ecosystem service and the trade-off/synergistic relationship under different scenarios to assess whether the optimized EPR can improve ESs and trade-off relationships.
Under the CES, the large areas of wetland and grassland were reclaimed for cropland and built-up land, resulting in reducing nitrogen filtration capacity and water purification capacity. As the vegetation cover decreased, there was a sharp decrease in the aboveground biomass, leading to a decrease in CS and HQ (Tang et al., 2020). A series of policies to benefit agriculture development have been implemented, and the areas of forestland and grassland with high vegetation cover have been reduced so that the surface cover’s ability to retain sediment has been gradually reduced, resulting in weakening the ability of the soil to resist erosion by rainfall and further reducing the ability of soil retention (Mao et al., 2019). The Sanjiang Plain and Songnen Plain had a notable increase in the nitrogen export due to the increased use of fertilizers, pesticides, irrigation sewage, and production and domestic waste. This increase is primarily driven by the demands of agricultural production and human activities in areas with cropland and built-up land (Fang et al., 2021).
We incorporated the optimized EPR into the land-use pattern optimization scenario and further compared ESs and trade-off/synergistic relationships with the land use optimization under the existing EPR. Under the ORS, the high-quality cropland was protected, and the development of built-up land was controlled to a certain extent, which effectively balanced the relationship between urbanization, socio-economic development, and ecological environmental protection. The conversion of cropland to forestland and grassland has led to an increase in vegetation cover, and the large canopy of forestland and grassland vegetation can effectively avoid direct precipitation washing over the ground, and the lush vegetation root system can fix more soil, which has a greater effect on the enhancement of SR (Shi et al., 2019). Forestland and grassland have rich vegetation carbon pools and have high interception and filtration and absorption of N and P, with a subsequent enhancement of WP and CS (Ma et al., 2020). Forestland and grassland are far away from the areas where cropland and built-up land are concentrated, and the influence of roads and other sources of coercion is also relatively limited, with a high degree of habitat suitability. The results of the study showed that the implementation of the EPR was incorporated into the setting of future scenarios, which effectively brought into play the ecological protection of forestland, grassland, and wetland, and achieved a synergistic enhancement of multiple ESs, such as WR, SR, and CS.
Although this study optimized the EPR delineation framework and incorporated it into the optimization of future land use scenarios, there are some limitations. Although we determined the indicator threshold for EPR delineation by considering the non-destruction of high-quality cropland for TBSN, we neglected the ecological security pattern that aims at comprehensive protection of ecological patterns and processes. Therefore, we should construct a guiding framework of EPR delineation, considering the ecological security pattern to achieve stability and ecosystem benefits. In addition, future research should pay attention to the long-term feedback mechanism of the conversion of cropland and ecological land in the TBSN and make reference to the study of ecosystem “pattern–process–function” so as to clarify the relationship between pattern and function and promote the coordinated development of cropland and ecological space.
In this study, ecosystem function, ecological sensitivity, and biodiversity were considered to identify the EPR area (74,397.15 km2), without destroying a high-quality cropland. The EPR area was mainly located in the southwestern part of the MDTB and SNTB, with forestland and grassland dominating in the MDTB and cropland and wetland dominating in the SNTB. At the same time, scenario analysis was used to verify the effectiveness of the optimized EPR. Comparing the ESs and trade-off relationships under different scenarios, the optimized EPR scenario is the best scenario to resolve the conflict between cropland and ecological land and promote the maximization of ecological benefits.
Blindly reclaiming cropland to increase food production does not sustain the provision of ESs. In the future, it is important to focus on coordinating the development of cropland and ecological land in the TBSN to ensure a balance between ecosystem services and food production. Continuous implementation of ecological restoration policies in the ecological redline area is necessary to expand ecological land and enhance ecosystem services synergistically, minimize trade-offs, and achieve sustainable use of black soil. The results of the study provide effective decision-making information for land use and ecosystem management in the TBSN and other black soil areas in the world.
The raw data supporting the conclusions of this article will be made available by the authors, without undue reservation.
YC: conceptualization, methodology, validation, visualization, and writing–original draft. XZ: methodology and writing–review and editing. SW: data curation, methodology, software, and writing–review and editing. ZT: formal analysis, investigation, methodology, and writing–review and editing.
The authors declare that financial support was received for the research, authorship, and/or publication of this article. This study was supported by the National Key Development Project (Grant no. 2021YFD1500804).
The authors declare that the research was conducted in the absence of any commercial or financial relationships that could be construed as a potential conflict of interest.
All claims expressed in this article are solely those of the authors and do not necessarily represent those of their affiliated organizations, or those of the publisher, the editors, and the reviewers. Any product that may be evaluated in this article, or claim that may be made by its manufacturer, is not guaranteed or endorsed by the publisher.
Bai, Y., Jiang, B., Wang, M., Li, H., Alatalo, J. M., and Huang, S. (2016). New ecological redline policy (ERP) to secure ecosystem services in China. Land Use Policy 55, 348–351. doi:10.1016/j.landusepol.2015.09.002
Bai, Y., Wong, C. P., Jiang, B., Hughes, A. C., Wang, M., and Wang, Q. (2018). Developing China’s Ecological Redline Policy using ecosystem services assessments for land use planning. Nat. Commun. 9 (1), 3034. doi:10.1038/s41467-018-05306-1
Barbier, E. B., Koch, E. W., Silliman, B. R., Hacker, S. D., Wolanski, E., Primavera, J., et al. (2008). Coastal ecosystem-based management with nonlinear ecological functions and values. Science 319 (5861), 321–323. doi:10.1126/science.1150349
Cao, C., Tao, S., Cui, Z., and Zhang, Y. (2021). Response of soil properties and microbial communities to increasing salinization in the meadow grassland of Northeast China. Microb. Ecol. 82, 722–735. doi:10.1007/s00248-021-01695-x
Carpenter, S. R., Mooney, H. A., Agard, J., Capistrano, D., DeFries, R. S., Díaz, S., et al. (2009). Science for managing ecosystem services: beyond the Millennium ecosystem assessment. Proc. Natl. Acad. Sci. 106 (5), 1305–1312. doi:10.1073/pnas.0808772106
Chen, D., Pan, Y., Jin, X., Du, H., Li, M., and Jiang, P. (2021). The delineation of ecological redline area for catchment sustainable management from the perspective of ecosystem services and social needs: a case study of the Xiangjiang watershed, China. Ecol. Indic. 121, 107130. doi:10.1016/j.ecolind.2020.107130
Chi, W. (2015). Research on spatial-temporal characteristics of soil wind erosion and ecosystem service of soil conservation in inner Mongolia Plateau. Beijing: University of Chinese Academy of Sciences.
Costanza, R., De Groot, R., Sutton, P., van der Ploeg, S., Anderson, S. J., Kubiszewski, I., et al. (2014). Changes in the global value of ecosystem services. Glob. Environ. Change 26, 152–158. doi:10.1016/j.gloenvcha.2014.04.002
Fang, L., Wang, L., Chen, W., Sun, J., Cao, Q., Wang, S., et al. (2021). Identifying the impacts of natural and human factors on ecosystem service in the Yangtze and Yellow River Basins. J. Clean. Prod. 314, 127995. doi:10.1016/j.jclepro.2021.127995
Feng, B. O., Yue, W. Z., and Xia, H. X. (2022). Evaluation of ecological conservation red line from the perspective of ecological security pattern: taking Zhejiang Province, China as an example. Yingyong Shengtai Xuebao 33 (9), 2466–2474. doi:10.13287/j.1001-9332.202209.022
Fridman, D., and Kissinger, M. (2018). An integrated biophysical and ecosystem approach as a base for ecosystem services analysis across regions. Ecosyst. Serv. 31, 242–254. doi:10.1016/j.ecoser.2018.01.005
Gao, L., Tao, F., Liu, R., Wang, Z., Leng, H., and Zhou, T. (2022). Multi-scenario simulation and ecological risk analysis of land use based on the PLUS model: a case study of Nanjing. Sustain. Cities Soc. 85, 104055. doi:10.1016/j.scs.2022.104055
He, C., Zhang, D., Huang, Q., et al. (2016). Assessing the potential impacts of urban expansion on regional carbon storage by linking the LUSD-urban and InVEST models. Environ. Model. Softw. 75, 44–58.
He, Q., Yan, M., Zheng, L., and Wang, B. (2023). Spatial stratified heterogeneity and driving mechanism of urban development level in China under different urban growth patterns with optimal parameter-based geographic detector model mining. Comput. Environ. Urban Syst. 105, 102023. doi:10.1016/j.compenvurbsys.2023.102023
He, Q. S., and Jiang, X. (2023). Measuring impacts of temporal and spatial changes of cultivated land on carbon storage: a case study of Hubei Province. Acta Ecol. Sin. 43 (24), 10413–10429. doi:10.20103/j.stxb.202306061192
Jiang, B., Bai, Y., Wong, C. P., Xu, X., and Alatalo, J. M. (2019). China’s ecological civilization program–Implementing ecological redline policy. Land Use Policy 81, 111–114. doi:10.1016/j.landusepol.2018.10.031
Li, C., Wu, Y., Gao, B., and Zheng, K. (2021a). Multi-scenario simulation of ecosystem service value for optimization of land use in the Sichuan-Yunnan ecological barrier, China. Ecol. Indic. 132, 108328. doi:10.1016/j.ecolind.2021.108328
Li, D., Yang, Y., Xia, F., Sun, W., Li, X., and Xie, Y. (2022a). Exploring the influences of different processes of habitat fragmentation on ecosystem services. Landsc. Urban Plan. 227, 104544. doi:10.1016/j.landurbplan.2022.104544
Li, H., Wu, Y., Liu, S., Zhao, W., Xiao, J., Winowiecki, L. A., et al. (2022b). The Grain-for-Green project offsets warming-induced soil organic carbon loss and increases soil carbon stock in Chinese Loess Plateau. Sci. Total Environ. 837, 155469. doi:10.1016/j.scitotenv.2022.155469
Li, J., Zhou, K., Xie, B., and Xiao, J. (2021b). Impact of landscape pattern change on water-related ecosystem services: comprehensive analysis based on heterogeneity perspective. Ecol. Indic. 133, 108372. doi:10.1016/j.ecolind.2021.108372
Li, R. Z., Song, Y. X., and Li, Y. T. (2013). The eco-environmental evolution and the character of northeast China in recent 10 years. Sci. Geogr. Sinca 33 (08), 935–941. doi:10.13249/J.CNKI.SGS.2013.08.835
Liang, C., Zeng, J., and Shen, Z. J. (2021a). Spatial pattern analysis and management of urban ecosystem services under rapid urbanization: a case study of Xiamen. Acta Ecol. Sin. 41 (11), 4379–4392. doi:10.5846/stxb202012283297
Liang, X., Guan, Q., Clarke, K. C., Liu, S., Wang, B., and Yao, Y. (2021b). Understanding the drivers of sustainable land expansion using a patch-generating land use simulation (PLUS) model: a case study in Wuhan, China. Comput. Environ. Urban Syst. 85, 101569. doi:10.1016/j.compenvurbsys.2020.101569
Liang, X., Jin, X., He, J., Wang, X., Xu, C., Qiao, G., et al. (2022). Impacts of land management practice strategy on regional ecosystems: enlightenment from ecological redline adjustment in Jiangsu, China. Land Use Policy 119, 106137. doi:10.1016/j.landusepol.2022.106137
Liu, B., Zhang, G. L., Xie, Y., Shen, B., Gu, Z., and Ding, Y. (2021). Delineating the black soil region and typical black soil region of northeastern China. Bull. Chin. Acad. Sci. Chin. Version 66, 96–106. doi:10.1360/TB-2020-0178
Liu, L., Zhou, D., Chang, X., and Lin, Z. (2020). A new grading system for evaluating China's cultivated land quality. Land Degrad. Dev. 31 (12), 1482–1501. doi:10.1002/ldr.3547
Ma, X., Zhu, J., Yan, W., and Zhao, C. (2020). Assessment of soil conservation services of four river basins in Central Asia under global warming scenarios. Geoderma 375, 114533. doi:10.1016/j.geoderma.2020.114533
Mao, D., He, X., Wang, Z., Tian, Y., Xiang, H., Yu, H., et al. (2019). Diverse policies leading to contrasting impacts on land cover and ecosystem services in Northeast China. J. Clean. Prod. 240, 117961. doi:10.1016/j.jclepro.2019.117961
Maron, M., Mitchell, M. G. E., Runting, R. K., Rhodes, J. R., Mace, G. M., Keith, D. A., et al. (2017). Towards a threat assessment framework for ecosystem services. Trends Ecol. Evol. 32 (4), 240–248. doi:10.1016/j.tree.2016.12.011
Millennium ecosystem assessment M E A (2005). Ecosystems and human well-being. Washington, DC: Island press.
OuYang, Z. Y., Wang, X., and Miao, H. (2000). China’s eco-environmental sensitivity and its spatial heterogeneity. Acta Ecol. Sin. 20 (1), 9–12.
Redhead, J. W., Stratford, C., Sharps, K., et al. (2016). Empirical validation of the InVEST water yield ecosystem service model at a national scale. Sci. Total Environ. 569, 1418–1426.
Redhead, J. W., May, L., Oliver, T. H., et al. (2018). National scale evaluation of the InVEST nutrient retention model in the United Kingdom. Sci. Total Environ. 610, 666–677.
Shaikh, S. F. E. A., See, S. C., Richards, D., Belcher, R. N., Grêt-Regamey, A., Galleguillos Torres, M., et al. (2021). Accounting for spatial autocorrelation is needed to avoid misidentifying trade-offs and bundles among ecosystem services. Ecol. Indic. 129, 107992. doi:10.1016/j.ecolind.2021.107992
Shi, P., Zhang, Y., Li, P., Li, Z., Yu, K., Ren, Z., et al. (2019). Distribution of soil organic carbon impacted by land-use changes in a hilly watershed of the Loess Plateau, China. Sci. Total Environ. 652, 505–512. doi:10.1016/j.scitotenv.2018.10.172
Song, G., Li, Z., and Yang, Y. (2015). Assessment of ecological vulnerability and decision-making application for prioritizing roadside ecological restoration: a method combining geographic information system, Delphi survey and Monte Carlo simulation. Ecol. Indic. 52, 57–65.
Song, W., Zhang, H., Zhao, R., Wu, K., Li, X., Niu, B., et al. (2022). Study on cultivated land quality evaluation from the perspective of farmland ecosystems. Ecol. Indic. 139, 108959. doi:10.1016/j.ecolind.2022.108959
Tang, L., Ke, X., Zhou, Q., Wang, L., and Koomen, E. (2020). Projecting future impacts of cropland reclamation policies on carbon storage. Ecol. Indic. 119, 106835. doi:10.1016/j.ecolind.2020.106835
Tian, J., Wang, B., and Cheng, L. (2020). The process and mechanism of regional land use transition guided by policy: a case study of Northeast China. Geogr. Resour. 39, 805–821. doi:10.15957/j.cnki.jjdl.2020.09.020
Wang, H., Yang, S., Wang, Y., Gu, Z., Xiong, S., Huang, X., et al. (2022b). Rates and causes of black soil erosion in Northeast China. Catena 214, 106250. doi:10.1016/j.catena.2022.106250
Wang, H., Zhang, C., Yao, X., Yun, W., Ma, J., Gao, L., et al. (2022a). Scenario simulation of the tradeoff between ecological land and farmland in black soil region of Northeast China. Land Use Policy 114, 105991. doi:10.1016/j.landusepol.2022.105991
Wang, L. J., Ma, S., Zhao, Y. G., and Zhang, J. C. (2021). Ecological restoration projects did not increase the value of all ecosystem services in Northeast China. For. Ecol. Manag. 495, 119340. doi:10.1016/j.foreco.2021.119340
Wang, S. N., and Cui, N. B. (2022). Dynamic change and trend analysis of cropland pressure in typical black soil areas of Northeast China under food security. Trans. Chin. Soc. Agric. Eng. 38 (21), 220–230. doi:10.11975/j.issn.1002-6819.2022.21.026
Wang, X. F., Ma, X., Feng, X. M., Zhou, C. W., and Fu, B. J. (2019). Spatial-temporal characteristics of trade-off and synergy of ecosystem services in key vulnerable ecological areas in China. Acta Ecol. Sin. 39 (20), 7344–7355. doi:10.5846/stxb201908251760
Wang, Y., Atallah, S., and Shao, G. (2017). Spatially explicit return on investment to private forest conservation for water purification in Indiana, United States. Ecosyst. Serv. 26, 45–57.
Wu, Y., Zhang, X., Li, C., Xu, Y., Hao, F., and Yin, G. (2021). Ecosystem service trade-offs and synergies under influence of climate and land cover change in an afforested semiarid basin, China. Ecol. Eng. 159, 106083. doi:10.1016/j.ecoleng.2020.106083
Xiang, H., Zhang, J., Mao, D., Wang, Z., Qiu, Z., and Yan, H. (2022). Identifying spatial similarities and mismatches between supply and demand of ecosystem services for sustainable Northeast China. Ecol. Indic. 134, 108501. doi:10.1016/j.ecolind.2021.108501
Yang, S., Bai, Y., Alatalo, J. M., Wang, H., Jiang, B., Liu, G., et al. (2021). Spatio-temporal changes in water-related ecosystem services provision and trade-offs with food production. J. Clean. Prod. 286, 125316. doi:10.1016/j.jclepro.2020.125316
Yang, Y., Song, G., and Lu, S. (2020a). Study on the ecological protection redline (EPR) demarcation process and the ecosystem service value (ESV) of the EPR zone: a case study on the city of Qiqihaer in China. Ecol. Indic. 109, 105754. doi:10.1016/j.ecolind.2019.105754
Yang, Y., Wang, K., Liu, D., Zhao, X., and Fan, J. (2020b). Effects of land-use conversions on the ecosystem services in the agro-pastoral ecotone of northern China. J. Clean. Prod. 249, 119360. doi:10.1016/j.jclepro.2019.119360
Yao, D. H., Pei, J. B., and Wang, J. K. (2020). Temporal-spatial changes in cropland quality in a black soil region of Northeast China. Chin. J. Eco-Agriculture 28 (01), 104–114. doi:10.13930/j.cnki.cjea.190485
Yu, P., Zhang, S., Yung, E. H. K., Chan, E. H., Luan, B., and Chen, Y. (2023). On the urban compactness to ecosystem services in a rapidly urbanising metropolitan area: highlighting scale effects and spatial non–stationary. Environ. Impact Assess. Rev. 98, 106975. doi:10.1016/j.eiar.2022.106975
Zhang, H., Zhang, C., Hu, T., et al. (2020). Exploration of roadway factors and habitat quality using InVEST. Transp. Res. D: Trans. Environ. 87, 102551.
Zhang, J., Qu, M., Wang, C., Zhao, J., and Cao, Y. (2020). Quantifying landscape pattern and ecosystem service value changes: a case study at the county level in the Chinese Loess Plateau. Glob. Ecol. Conservation 23, e01110. doi:10.1016/j.gecco.2020.e01110
Zhang, J., Sun, B., and Zhu, J. (2021). Black soil protection and utilization based on harmonization of mountain-river-forest-farmland-lake-grassland-sandy land ecosystems and strategic construction of ecological barrier. Bull. Chin. Acad. Sci. Chin. Version 36 (10), 1155–1164. doi:10.16418/j.issn.1000-3045.20211010002
Zhang, K., Zou, C., Lin, N., Qiu, J., Pei, W., Yang, Y., et al. (2022). The Ecological Conservation Redline program: a new model for improving China's protected area network. Environ. Sci. Policy 131, 10–13. doi:10.1016/j.envsci.2022.01.012
Zhang, Z., and Huisingh, D. (2018). Combating desertification in China: monitoring, control, management and revegetation. J. Clean. Prod. 182, 765–775. doi:10.1016/j.jclepro.2018.01.233
Zheng, W., Ke, X., Xiao, B., and Zhou, T. (2019). Optimising land use allocation to balance ecosystem services and economic benefits-A case study in Wuhan, China. J. Environ. Manag. 248, 109306. doi:10.1016/j.jenvman.2019.109306
Keywords: Ecological Protection Redline, ecosystem service, trade-off/synergistic relationship, land use pattern, typical black soil region of Northeastern China
Citation: Chen Y, Zhao X, Wu S and Tong Z (2024) Developing ecological protection redline policy for land use pattern optimization in the typical black soil region of Northeastern China. Front. Environ. Sci. 12:1422077. doi: 10.3389/fenvs.2024.1422077
Received: 30 April 2024; Accepted: 09 July 2024;
Published: 30 July 2024.
Edited by:
Bo Huang, NTNU, NorwayReviewed by:
Peiheng Yu, Hong Kong Polytechnic University, Hong Kong SAR, ChinaCopyright © 2024 Chen, Zhao, Wu and Tong. This is an open-access article distributed under the terms of the Creative Commons Attribution License (CC BY). The use, distribution or reproduction in other forums is permitted, provided the original author(s) and the copyright owner(s) are credited and that the original publication in this journal is cited, in accordance with accepted academic practice. No use, distribution or reproduction is permitted which does not comply with these terms.
*Correspondence: Zhiqiang Tong, YW94dWV4dXh1QDEyNi5jb20=
Disclaimer: All claims expressed in this article are solely those of the authors and do not necessarily represent those of their affiliated organizations, or those of the publisher, the editors and the reviewers. Any product that may be evaluated in this article or claim that may be made by its manufacturer is not guaranteed or endorsed by the publisher.
Research integrity at Frontiers
Learn more about the work of our research integrity team to safeguard the quality of each article we publish.