 Yaqi Wu
 Zhenhao Li
 Yue Cheng
 Po Yun
- 1School of Economics, North Minzu University, Yinchuan, Ningxia, China
- 2Key Research Institute of Humanities and Social Sciences—Common Modernization Research Center, National Ethnic Affairs Commission, Yinchuan, Ningxia, China
- 3School of Economics and Management, Hefei University, Hefei, Anhui, China
In the context of carbon neutrality, the economic policy uncertainty (EPU) in various countries is constantly rising, and the carbon emission trading market (CET market) is constantly changing. This study uses the wavelet analysis to analyze the time-frequency linkages between China’s economic policy uncertainty index (CEPU) and the price-earnings ratios of the Hubei CET market (HCMP), a representative of Chinese CET markets, from short-run, medium-run, and long-run perspectives. Results show that from the perspective of correlation in the time domain, the HCMP is positively correlated with the CEPU in different time periods. From the perspective of causality in the frequency domain, there is a causal relationship between the HCMP and CEPU in the short run, and the CEPU fluctuations are ahead of the HCMP fluctuations in the medium run. In the long run, the HCMP fluctuations are ahead of those of CEPU for the period before 2021, but the two fluctuate synchronously for the period after 2021. This study provides a reference for policymakers to manage the CET markets and for investors to optimize their investment portfolios.
1 Introduction
The global natural environment has continuously deteriorated. To reduce greenhouse gas emissions, the CET markets come into being. The global CET markets vigorously develop, playing an important role in enhancing international influence and promoting green and low-carbon transformation. As of 2022, 25 CET markets have been launched in 40 countries and regions in Europe, the Americas, Asia, and Oceania, and more CET markets are being established in another 13 countries and regions. As the world’s largest developing country and carbon emitter, China not only actively assumes the responsibility of emission reduction, but also emphasizes ecological civilization, energy conservation, and emission reduction. China joined the Paris Agreement in 2016 to jointly tackle climate change. Moreover, the Chinese government put forward long-term carbon emission reduction plans and goals including “peaking carbon dioxide emissions by 2030 and achieving carbon neutrality by 2060” (Gao et al., 2021). This means that China will achieve the carbon emission reduction goal in 30 years, while the West needs 60 years to achieve a similar goal. This is challenging, and there are no precedents in the world. Therefore, China needs to overcome difficulties and finds its own path to achieve the goal. On 16 July 2021, the national CET market was officially launched and operated together with multiple regional pilot CET markets in China. The total carbon emission is determined by the National Development and Reform Commission and allocated free of charge. As of 38 July 2022, the carbon emission allowance trading volume reached 194 million tons, and the turnover reached 8.492 billion yuan, making China’s CET market the world’s largest. Although the trading volume is very large, the main traders are only the enterprises of the power generation industry, and the trading products are only the spot carbon emission allowances. Therefore, hierarchical and diversified CET markets have not been formed in China. The price-earnings ratio in the CET markets is affected by many external factors, such as the macroeconomic situation, energy price fluctuations, natural disasters, epidemics, etc. Especially, the EPU has a great impact.
The world is experiencing great changes, i.e., the COVID-19 epidemic, the Russia-Ukraine conflict, and the Palestinian-Israeli conflict, leading to an increase in the complexity and uncertainty of the external environment. The EPU has upsurged, which greatly impacts the development of China’s economy (Yu et al., 2022). In the face of such complex changes in the world and domestic economic reforms, the EPU has become the focus of attention from all walks of life. The EPU is crucial in the dynamics of the CET markets, influencing various aspects such as prices and trading of carbon emission allowances (Li et al., 2023). Driven by the “dual carbon” goals, continuously adjusting economic policies is necessary to ensure the orderly development of China’s CET markets. Due to the difference in market participants, there are obvious differences in the trading cycles, resulting in different characteristics at different frequencies. In addition, the changes in economic policies have the characteristics of universality, complexity, and timeliness, and the uncertainties brought to the CET market participants also have short-run, medium-run, and long-run characteristics. For example, small-scale policy adjustments may lead to short-run fluctuations, while major events such as China-US trade frictions, the Paris Agreement, and the COVID-19 epidemic increase the medium- and long-run fluctuations of the CET markets. Therefore, it is necessary to explore the time and frequency linkages between the CET markets and CEPU, to provide targeted policy implications for governments, enterprises that are required to reduce carbon emissions, and investors.
At present, China has established eight pilot CET markets in Hubei, Shanghai, Guangdong, Shenzhen, Beijing, Chongqing, Fujian, and Tianjin. As an early established CET market, the Hubei CET market ranks first by the trading volume and turnover among the pilot markets. Therefore, we select the Hubei CET market as a representative, and use wavelet analysis to explore the time-frequency linkages between CEPU and HCMP.
The contributions of this study are as follows: Firstly, existing literature focuses more on the impact of EPU on the financial market, while the impact of EPU on the CET market is still rarely explored. In addition, among the existing studies on the relationship between EPU and the CET market, most studies explore the relationship between EPU and the CET market of the EU. For example, Ye et al. (2022) proved that the cross-correlations really existed, and the cross-correlation behavior structure over different trading phases were not the same. Liu et al. (2021) reported that the EPU had a significant impact on the volatility of EUA futures by constructing a GARCH-MIDAS model. Li et al. (2023) constructed a VAR model and confirmed that EUA futures had a negative impact on EPU. For the relationship between the EPU and China’s CET market, some scholars constructed a MF-DCCA model and proved that there was no correlation between the price fluctuation of China’s CET market and CEPU (An et al., 2023). Wang et al. (2024) confirmed that the conditional correlations between HCMP and CEPU varied from region to region by constructing DCC-GARCH and NARDL models. However, due to differences in the short-run, medium-run, and long-run influencing factors of the economy, the mechanism of determining CET market prices may be different in different time and frequency domains. Besides, due to the time lag of economic policies, the EPU may also have different impacts on the CET market prices in the short, medium, and long run. However, few scholars have taken into account the frequency domain when studying the impact of EPU, which is critical for financial and economic time series. In this study, the time-frequency linkages between EPU and HBETS is analyzed from the perspective of correlation in the time domain and causality in the frequency domain, to more comprehensively discuss the interaction between EPU and HBETS. Secondly, This study introduces the wavelet analysis method. Different from the traditional analysis method, wavelet analysis does not require much on the statistical characteristics of the data, and can directly decompose the non-stationary time series into stationary or relatively stationary time series components. This greatly preserves the valid information contained in the time series and reduces the information loss. At the same time, wavelet analysis is also different from the traditional analysis method in terms of empirical results. For example, Dai et al. (2022) argued that EPU might lead to higher shocks to the CET market in the long run. Dou et al. (2022) argued that in the long run, increased EPU would lead to less energy consumption and carbon demand, which ultimately reduced the prices in the CET market. However, in this study, in the long run, the wavelet analysis results showed that the HBETS first affected the EPU, and the two fluctuated simultaneously after 2021. The reason for the difference in the results is that the traditional time-domain research method can lead to unilateral results, and the above studies cannot obtain the interaction between CEPU and HCMP in the frequency domain. But, frequency domain is crucial for financial and economic time series. The wavelet analysis can better analyze the time-frequency linkages between EPU and HBETS from the perspective of correlation in the time domain and the causality in the frequency domain. Thirdly, the results of this study will facilitate research on the EPU and CET markets, and provide important implications for policymakers and investors, such as making their policies transparent to reduce the time and information cost of policy dissemination, and establishing monitoring systems. Investors should consider short-run, medium-run, and long-run factors when adjusting their investment plans and asset portfolios, and make rational choices in different economic environments.
The rest of the study is structured as follows: Section 2, Literature review; Section 3, Research methods; Section 4, Data descriptions and empirical results; Section 5, Conclusions and policy implications.
2 Literature review
The EPU refers to the difficulty in predicting the future events in the economic field when economic policies change, that is, the degree to which the economic performance is inconsistent with the assessments and expectations of economic participants. In the complex and volatile global environment, China’s economic policies are continuously adjusted for the economic reforms. At the same time, under the influence of the current geopolitical risks and the changing international situation, facing the challenges brought about by the construction of a new development pattern “domestic and international dual circulation,” China’s EPU is inevitably on the rise. Therefore, it is difficult for policymakers and CET market participants to accurately predict future economic developments, which increases the instability of the CET markets. Since few scholars have specifically explored the relationship between EPU and the CET markets, we introduce the EPU and the CET market researches separately.
2.1 Researches on EPU
At present, the researches on EPU mainly focus on two aspects: measurement methods and EPU’ impacts. Factors such as the global economic downturn, trade frictions, COVID-19 epidemic, and geopolitical conflicts have become the focus of close attention from academics and governments. However, because these uncertainties are difficult to observe directly, how to accurately assess the EPU has always been a challenge. Many scholars have used the EPU Index proposed by Baker et al. (2016), which is obtained by selecting articles related to the EPU from large newspapers in various countries for mathematical statistics. It is worth noting that the China EPU Index constructed based on 114 Chinese newspapers by Huang and Luk (2020) is more representative of China’s EPU than the EPU index constructed by Baker et al. Some scholars also construct their own EPU indexes for research. For example, Bhattacharya et al., 2017 studied the impacts of policy uncertainty induced by general election on the technological innovation in 43 countries and regions, and found that the number of patentee decreased with the increase of EPU. Many scholars have analyzed the impact of EPU indicators on financial markets and business operations. Maquieira et al. (2023) found a negative correlation between EPU and stock returns in China. Gong et al. (2023) found that EPU spillovers had a significant positive impact on bond market fluctuations; If spillovers came from developed markets, this positive impact was stronger during financial crises. Gao et al. (2021) reported that the growth and fluctuation spillover of the EPU on the Chinese gold market was higher than that on the equity and oil markets. Zhong et al. (2023) found an inverted U-shaped relationship between EPU and enterprise innovation. He et al. (2020) found that EPU had a stronger positive impact on state-owned enterprises, enterprises with low-level cash flows, and enterprises with few financial constraints, suggesting that EPU mainly affected enterprise innovation through affecting cash holdings and revenue growth rates. Huang and Liu (2021) found that in bear markets, the EPU changes had an asymmetric effect on the stock returns in Japan, Canada, the United Kingdom, and the United States. Fu et al. (2022) found that every 1 percentage increase in EPU led to a 4.28 percentage increase in urban carbon emissions. Liu et al. (2021) found that the EPU index, especially the EPU index for the European Union, had a strong predictive power for EUA futures prices. Li et al. (2023) found that the EPU had significant time-varying and short-run effects on the CMP, i.e., the EPU had a significantly positive impact on the CMP in the short run.
2.2 Researches on carbon emission trading market
Most researches on the CET market focus on price fluctuations, influencing factors, and their correlation. In terms of the characteristics of CMP fluctuations, Zhou and Li (2018) reported that the characteristics of the return series of CMP were consistent with those of financial time series, such as fluctuations, aggregation, peaks, thick tails, and non-normal distribution, and that there was a positive leverage effect for the CMP fluctuations in China. Zhang and Xu (2020) found that China’s regional CMP had the characteristics of agglomeration, peak, heavy tail, memory, and anti-leverage. Zhang et al. (2019) empirically analyzed the average daily price of the EU ETS and obtained the fluctuation characteristics of CMP from the high-price period to the low-price period. Yu et al. (2022) found that the CMP fluctuations had a leverage effect, and negative news had a greater impact on the CET markets than positive news. In terms of the factors affecting the CMP, Li et al. (2021) found that the relationship between oil, natural gas, electricity, stock prices, and CMP had significant temporal variation characteristics in the European Union. Yin et al. (2019) found that the CMP and AQI (air quality index) of the European Union had a direct impact on China’s CMP, and the CSI Energy Index, the Industrial Index, and the HS300 had an indirect positive impact on China’s CMP. In addition, the fluctuations of China’s CMP were mainly driven by internal factors, while the fluctuations of other economic variables were mainly driven by the EU CMP index and the industrial index. Ji et al. (2021) reported that the oversupply of allowances, low auction prices, and the use of Chinese CERs (Certified Emission Reductions) led to a significant reduction in CMP, while the expansion of the CET market and the centralized trading increased the CMP. The oil price was positively correlated with the CMP, the coal price was negatively correlated with the CMP, and the price of carbon-intensive products also affected the CMP. Jiang et al. (2018) reported that the CMP was mainly affected by the historical price; Coal price and stock index had a negative impact on the CMP, and oil price had a positive impact on the CMP.
In terms of the linkage between the prices in different CET markets, Cheng et al. (2023) reported that there was a long-run correlation between the Chinese and European CET markets, with both markets having the ability to self-correct to reduce price deviations, and both markets exhibited pricing inefficiencies. Zhang et al. (2022) found that there was an increase in dependencies between the EU and Chinese ETSs after the outbreak of the COVID-19, and that there was a tail dependency structure before the launch of the national ETS and during the COVID-19 outbreak. Liu et al. (2019) showed that China’s pilot CET markets were generally low in maturity, with small size, low market efficiency and activity, and large price fluctuations; In addition, there were obvious differences in the expiration dates of China’s pilot CET markets due to the differences in trading volume, market liquidity, and market facilities. Yang et al. (2022) analyzed the eight pilot CET markets in China and found that the pilots in Beijing and Hubei were susceptible to short-run external factors, and the internal market mechanism had a great impact on the CMP of the Beijing pilot market. Wang et al. (2024) reported that there was an interaction between the EU ETS fluctuations and the Shanghai/Hubei ETS fluctuations, and that the price changes of the EU and Hubei ETS affected each other.
Previous studies on the CMP fluctuation characteristics and influencing factors provide a rich basis for this study. However, currently, there is a lack of research on the impact of EPU on CMP, especially the time-frequency linkage between the two. In the context of the “dual carbon” goals, the in-depth discussion of the relationship between the two has both theoretical and practical values. The innovations of this study are as follows: Firstly, the study on China’s CMP mainly focuses on the relationship between the eight pilot CET markets or between China’s CET market and the EU’s, and rarely involves the relationship between China’s EPU and the Hubei CET market. This study focuses on the relationship between CEPU and HCMP, which not only enriches the analysis of the influencing factors of the CET market, but also provides strong evidence for CET market management in the current uncertain economic environment. Secondly, in existing studies, scholars mainly use the GARCH model and VAR model to study the correlation between the CET market and EPU from the time perspective (Table 1). These traditional models cannot accurately obtain the time-frequency linkages between variables, and also cannot describe the multi-time-scale relationship characteristics between the CET market and the EPU. Therefore, this study uses the wavelet analysis to analyze the relationship between HCMP and its influencing factors from the time and frequency domains. Besides, we use the partial wavelet analysis to eliminate the influence of other interference factors to obtain accurate study results. This method can not only highlight the time and frequency characteristics of EPU and CMP fluctuations, but also provide a new method for the analysis of linkages between CET markets.
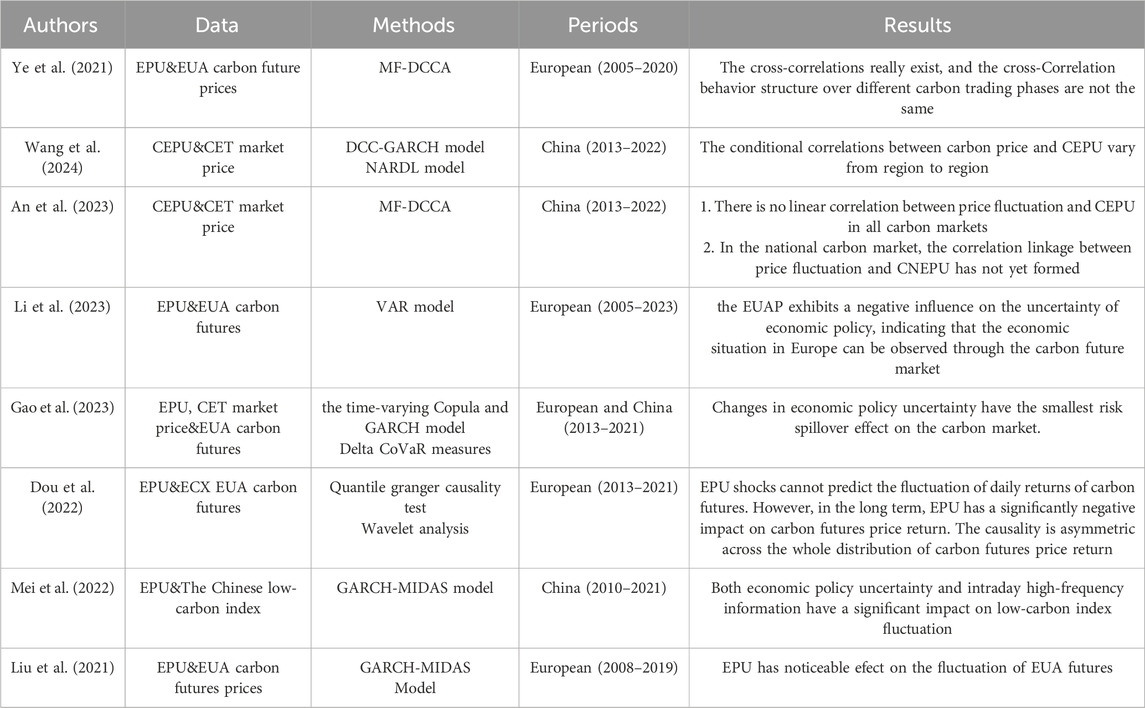
Table 1. Empirical literature review.
3 Research methodology
Economic and financial time series generally have the characteristics of nonlinearity and non-stationarity, and traditional measurement methods such as GARCH model and VAR model require the input time series to have stationary. Therefore, there may be a large amount of information loss after data processing. Wavelet analysis is relaxed in the data characteristic requirements, and can directly decompose the non-stationary time series into stationary or relatively stationary time series components, which greatly preserves the valid information and reduces the information loss. Therefore, this study uses a combination of discrete and continuous wavelet transforms to analyze the time-frequency linkages between HCMP and China EPU index (CEPU).
Firstly, the Granger causality test is carried out after decomposing the HCMP and CEPU into different scales through the discrete wavelet transform, and the correlation between the two at different frequencies is preliminarily discussed. Then, the time series diagram and wavelet energy spectrum of the HCMP and CEPU are obtained by continuous wavelet transform. After that, the leading or lagging relationship between the two and their correlations are analyzed by the wavelet coherency analysis and wavelet phase difference. Finally, after adding control variables to exclude the influence of related factors, the partial wavelet energy spectrum and partial wavelet phase difference plot of HCMP and CEPU are obtained, to accurately analyze their time-frequency linkages.
3.1 Discrete wavelet transform (DWT)
The DWT is a signal analysis technique to analyze non-stationary signals in time and frequency. It calculates the decomposition of the signal at different time periods and frequencies by combining the signal with wavelet functions of different scales and frequencies. For the discrete case, the wavelet sequence is as Equation 1:
where ψ is the wavelet function that satisfies the zero mean condition at both time and frequency domains. The high-frequency information is included in the detail coefficient, and the low-frequency information is included in the approximation coefficient.
3.2 Continuous wavelet transform and wavelet energy spectrum (WES)
The CWT is expressed as a function of the scale parameter a and the time translation parameter b. In this study, the characteristics of CEPU and HCMP in different time periods and frequencies are obtained by adjusting the a and b. For discrete time series x(t) with the same time interval (t = 0, 1, 2, …, N), the equation is as Equation 2:
The WES shows the energy distribution of the CWT results. The WES can analyze the energy distribution of a signal over different frequencies. In the CWT, for each scale parameter and translation parameter, a complex value is calculated to represent the components of the signal at the corresponding time and frequency. In this study, the larger the WES value at a time period/frequency, the more intense the price fluctuations at that time period/frequency.
3.3 Wavelet coherence and partial wavelet coherence
Wavelet coherence is used to analyze the correlation between two signals in the time and frequency domains. It can assess the degree of similarity or correlation of two signals at different frequencies and time periods. Wavelet coherency analysis is the squared of a crossed power spectrum normalized by the power spectrum of a single time series, which can be expressed as Equation 3:
where Wx (γ,s) and Wy (γ,s) represent the continuous wavelet transforms to the raw sequence x(t) and y(t), respectively, S is the smoothing factor, and R2 is the wavelet coherence coefficient, ranging from 0 to 1. The closer the R2 is to 1, the stronger the correlation; When the R2 is equal to 0, the two variables are completely independent (Li et al., 2020).
Considering that other factors may have an impact on the correlation between CEPU and HCMP, control variables are introduced to obtain the partial wavelet coherence coefficient. After controlling for the change of z(t), the partial wavelet coherence coefficient between x(t) and y(t) can be expressed as Equation 4:
where Rxz (γ,s) represents the wavelet coherence coefficient between x(t) and z(t), and Ryz (γ,s) represents the wavelet coherence coefficient between y(t) and z(t).
3.4 Wavelet phase difference and partial wavelet phase difference
The phase difference of wavelet coherency analysis can reflect the leading or lagging relationship between two variables in a specific time or frequency domain, as well as their correlations. The phase difference can be expressed as Equation 5:
where α represents the imaginary part of the smoothed power spectrum, and β represents the real part of the smoothed power spectrum. The value range of Φxy (γ, s) is [−π, π].
In the empirical analysis, if CEPU is ahead of HCMP, it can be considered that the CEPU is the reason for the formation of the HCMP, that is, the CEPU affects the HCMP, and vice versa. If the CEPU is positively correlated with the HCMP, it indicates that the two are in the same phase, that is, the same direction of fluctuation; If the CEPU is negatively correlated with the HCMP, it indicates an inverse fluctuation (Li et al., 2021; Wang and Li, 2021). Table 2 shows the wavelet phase difference analysis of the HCMP and CEPU.
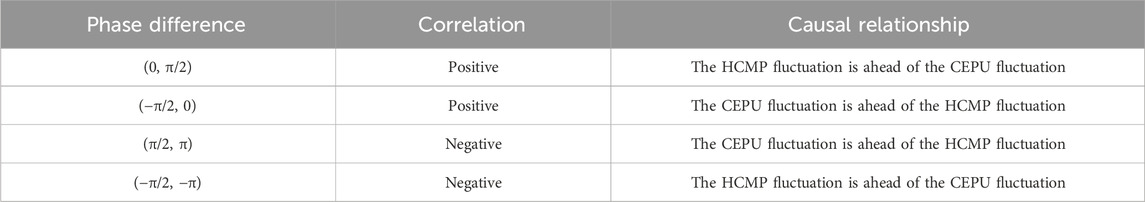
Table 2. Wavelet phase difference analysis.
Control variables are added to the wavelet phase difference to obtain partial wavelet phase difference, which can reveal accurate causal relationships between variables. After controlling for the change of the time series z(t), the partial wavelet phase difference between x(t) and y(t) can be calculated by Equation 6:
where α and β are the imaginary and real parts of the wavelet correlation coefficient Wxy|z (γ,s) of the complex value, respectively.
4 Empirical analysis
4.1 Variable selection
The Hubei CET market has a high activity, stable transaction volume, and stable closing price. However, the CET markets in other regions have problems such as large fluctuation in transaction volume and closing prices as well as low activity. Therefore, the Hubei CET market is selected as the representative of China’s CET markets. This study selects the weekly data of the closing price of the Hubei CET market and the China EPU Index from 4 January 2015 to 17 April 2022 as samples (378 data in total). The data are collected from the Hubei Carbon Emission Exchange (https://www.hbets.cn/). According to the method of Huang and Luk (2020), the news articles related to CEPU are extracted from the news data of large Chinese newspapers selected by Stanford University and the University of Chicago and processed, to calculate the China EPU index. This index is derived from the official website of the Economic Policy Uncertainty Index (http://www.policyuncertainty.com/).
To obtain robust results and avoid errors caused by external factors, control variables are introduced to control the results of experiments and evaluate the time-frequency linkages. With reference to existing researches, we include the following control variables that may affect the time-frequency linkages between HCMP and CEPU for wavelet analysis. The control variables mainly include crude oil prices (OIL), coal prices (COAL), and macroeconomic fluctuations (SZ), and the data come from the Wind database. The OIL is based on the closing price of the active fuel oil futures contract. The COAL is based on the closing price of the active thermal coal futures contract. In terms of SZ, we select the Shanghai Composite Index as an indicator. By observing the trend of the Shanghai Composite Index, we can understand the trend of China’s economic development and judge the overall status of China’s economy.
Table 3 shows the logarithmicization of each variable and the first-order difference. From the perspective of skewness, the HCMP and CEPU are asymmetric; The HCMP has a long left tail, while the CEPU has a right tail. Besides, the kurtosis of the HCMP and CEPU are greater than 3. This indicates that the distribution is steeper than the normal distribution. The Jarque-Bera statistic results further confirm the non-normal distribution of HCMP and CEPU. Then, the augmented Dickey-Fuller unit root test (ADF) is used to test the stationarity of the data. The results show that the values of the HCMP and CEPU are stationary at a significance level of 1%. Therefore, it can be concluded that the HCMP and CEPU have the leptokurtosis and fat-tail characteristics, and do not obey the normal distribution. In addition, the OIL, COAL, and SZ also have the leptokurtosis and fat-tail characteristics, and do not obey the normal distribution. The values of the three variables are stable at the significance level of 1%.
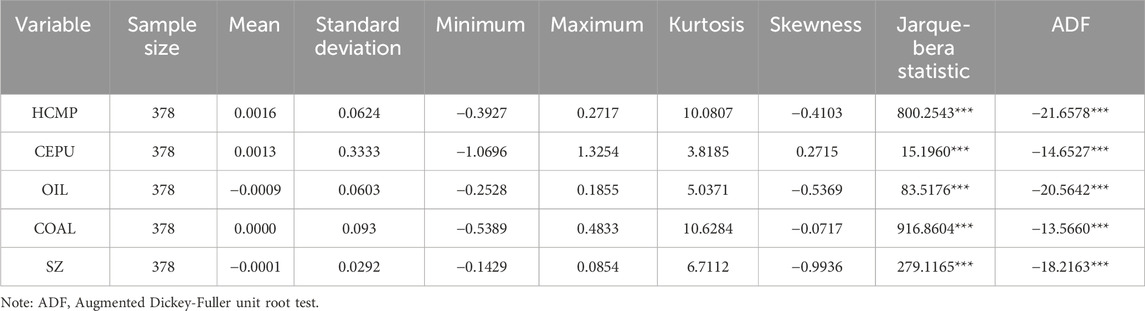
Table 3. Descriptive statistics of variables.
4.2 Discrete wavelet transform of HCMP and CEPU and granger causality test
Before analyzing the time-frequency linkages between CEPU and HCMP, this study first explores whether there is a mutual causal relationship between the two at different scales through discrete wavelet transform and Granger causality test (Figures 1, 2). The raw sequence (S) is decomposed into 7 detail components (D1-D7) and 1 approximate component (A7) by db4 wavelet (the frequencies D1, D2, D3, D4, D5, D6, and D7 represent 2–4 weeks, 4–8 weeks, 8–16 weeks, 16–32 weeks, 32–64 weeks, 64–128 weeks, and 128–256 weeks, respectively). From bottom to top, it can be seen that with the increase of the number of decomposition, the fluctuation frequency at each scale becomes smaller and smaller, and the period of the components becomes longer and longer. It can be seen from A7 that the HCMP has a decreasing trend, indicating that with the “dual carbon” goals, China’s CET market is becoming more and more mature, and the CMP is becoming more and more stable. However, the EPU has an increasing trend, indicating that the EPU is still unstable due to the impact of factors such as the epidemic and external turmoil.
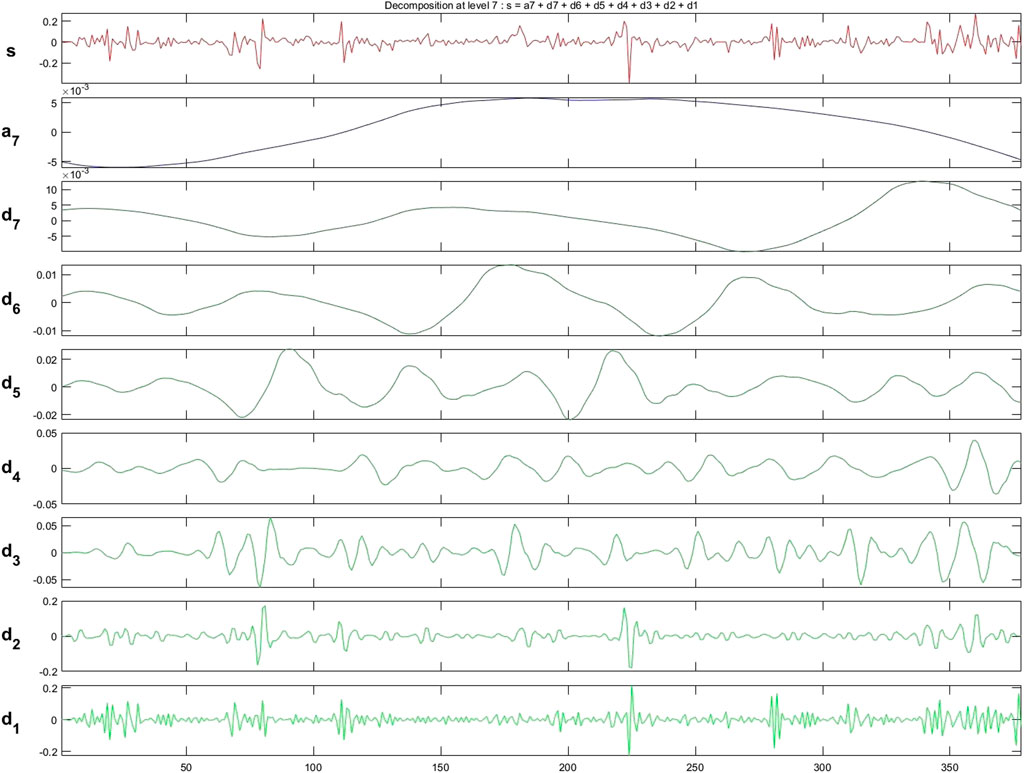
Figure 1. Discrete wavelet transform of the price-earnings ratios of the Hubei CET market (HCMP).
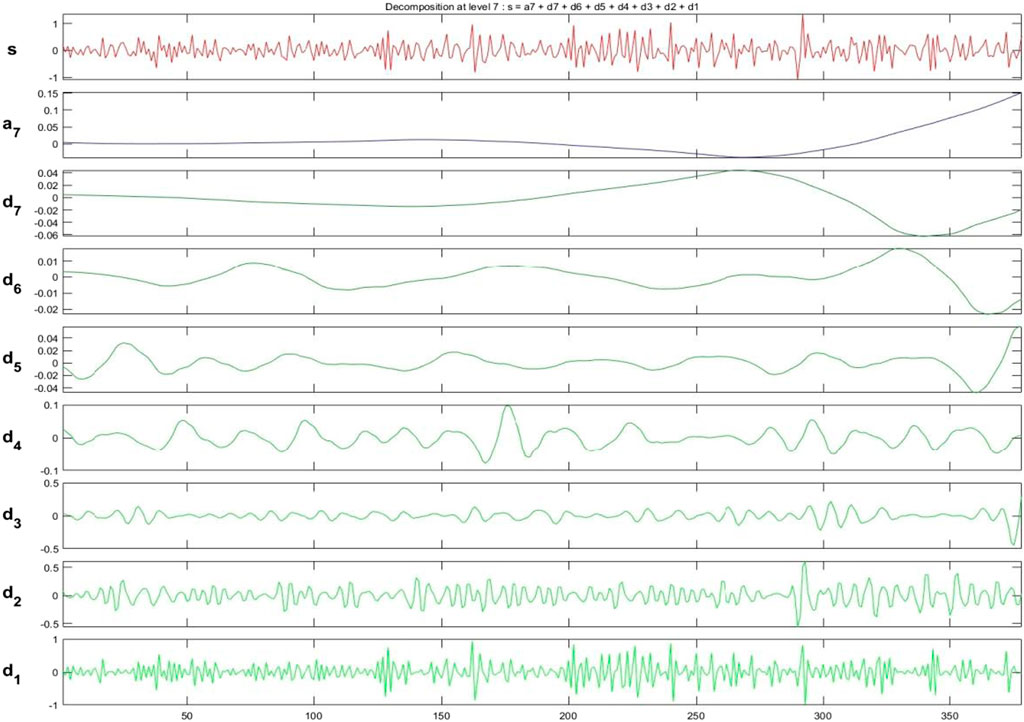
Figure 2. Discrete wavelet transform of China’s economic policy uncertainty (CEPU).
The obtained seven detail components are subjected to the Granger causality test. It can be seen from Table 4 that there is a two-way Granger causal relationship between HCMP and CEPU at D1, D2, D3, and D7, a one-way Granger causal relationship (CEPU → HCMP) at D4 and D5, a one-way Granger causal relationship (HCMP → CEPU) at D6, and a two-way causal relationship in the long run. Through the multi-scale discrete wavelet transform, it can be concluded that HCMP and CEPU have different correlations at different frequencies. However, discrete wavelet transform cannot analyze the correlation between the two at other scales, nor can it give the strength of the causal relationship between the two, especially, it does not consider the interference of external factors. Therefore, we discuss the correlation between HCMP and CEPU in detail and accurately through wavelet coherency analysis.
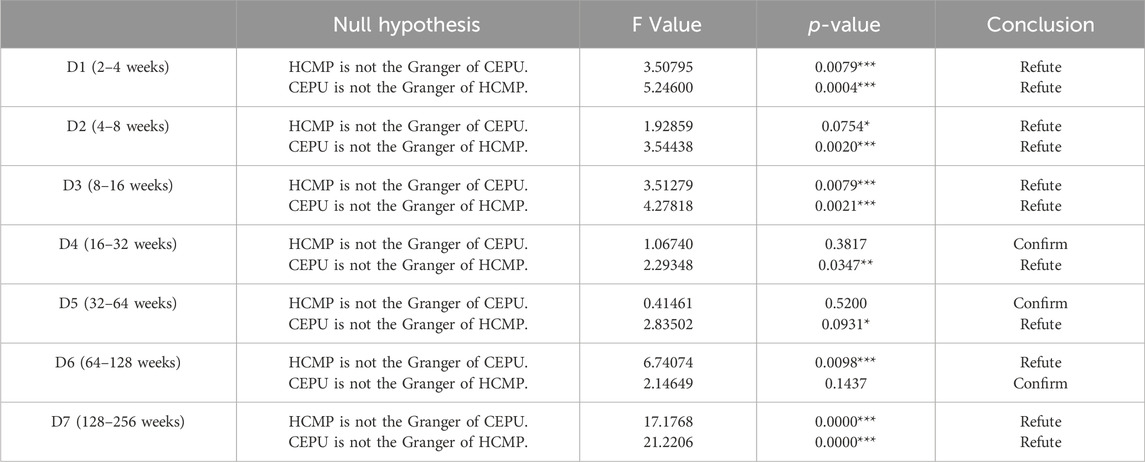
Table 4. Granger causality test results of the HCMP and CEPU based on discrete wavelet transform.
4.3 Wavelet spectrum analysis
In the wavelet energy spectrum diagram, the wavelet power (fluctuation degree) is represented by different color, i.e., red represents high-degree fluctuation, and blue represents low-degree fluctuation. In addition, the bold black line represents the estimate at the 5% significance level obtained by the Monte Carlo method (1,000 simulations). The area below the bold black line represents the cone of influence of the edge effect. The definitions for different frequencies are as follows: short run, 2–12 weeks; medium run, 12–32 weeks; long run, 32–64).
Time series diagram (Figure 3A) and the wavelet energy spectrum diagram of HCMP (Figure 3B) show that at the 5% significance level, most of the significantly recognizable areas are in the frequency of 2–12 weeks. Short-run fluctuations are identified for the periods of June 2015 January 2016 - January 2017 January 2019–June 2019, and January 2021–January 2022, the areas are large, and almost all fluctuation coefficients are 1. This indicates strong short-run fluctuations. In the frequency of 12–32 weeks, fluctuation is identified for the period of January 2021–January 2022 only, and the fluctuation coefficient is 0.3–0.6. This indicates a moderate fluctuation. In the frequency of 32–64 weeks, fluctuation is only identified for the period of June 2017–June 2019, and the fluctuation coefficient is about 0.3. This indicates a weak fluctuation. The reason for this phenomenon may be that in June 2015, the Administration of Foreign Exchange officially approved the participation of qualified foreign investors in the Hubei CET market, and qualified foreign investors could participate in Hubei’s carbon emission allowance trading through foreign exchange or cross-border RMB. In May 2016, the Hubei CET market ranked first by daily trading volume and turnover in China. On 1 November 2016, Hubei Province included more enterprises into the enterprise group that is required to control carbon emissions. The proportion of the covered enterprises was expanded from 50% to about 80% of Hubei’s total enterprises. Therefore, the size of the Hubei CET market was expanded. In March 2019, China’s Ministry of Ecology and Environment (MEE) issued the Interim Regulations on the Administration of Carbon Emission Trading (Draft for Comments), which provided a policy basis and legal guarantee for the construction and operation of the national CET market, and also sent a positive signal to the society. This can also be identified from the wavelet power spectrum. In November 2020, China clarified the enterprises included in the national CET market and the allowance allocation method. On 16 July 2021, the national CET market was officially launched, and the carbon emission allowance registration system was placed in Wuhan, Hubei province. This further promoted the development of the Hubei CET market. From the wavelet power spectrum (Figure 3B), it can be seen that the fluctuation for the period of January 2021–January 2022 is identified not only in the frequency of 2–12 weeks, but also in the frequency of 12–32 weeks, and the fluctuation in the frequency of 2–12 weeks is stronger. It can be seen that various policy uncertainties result in violent fluctuation in the HCMP, and different magnitudes of policy impact lead to different fluctuation characteristics.
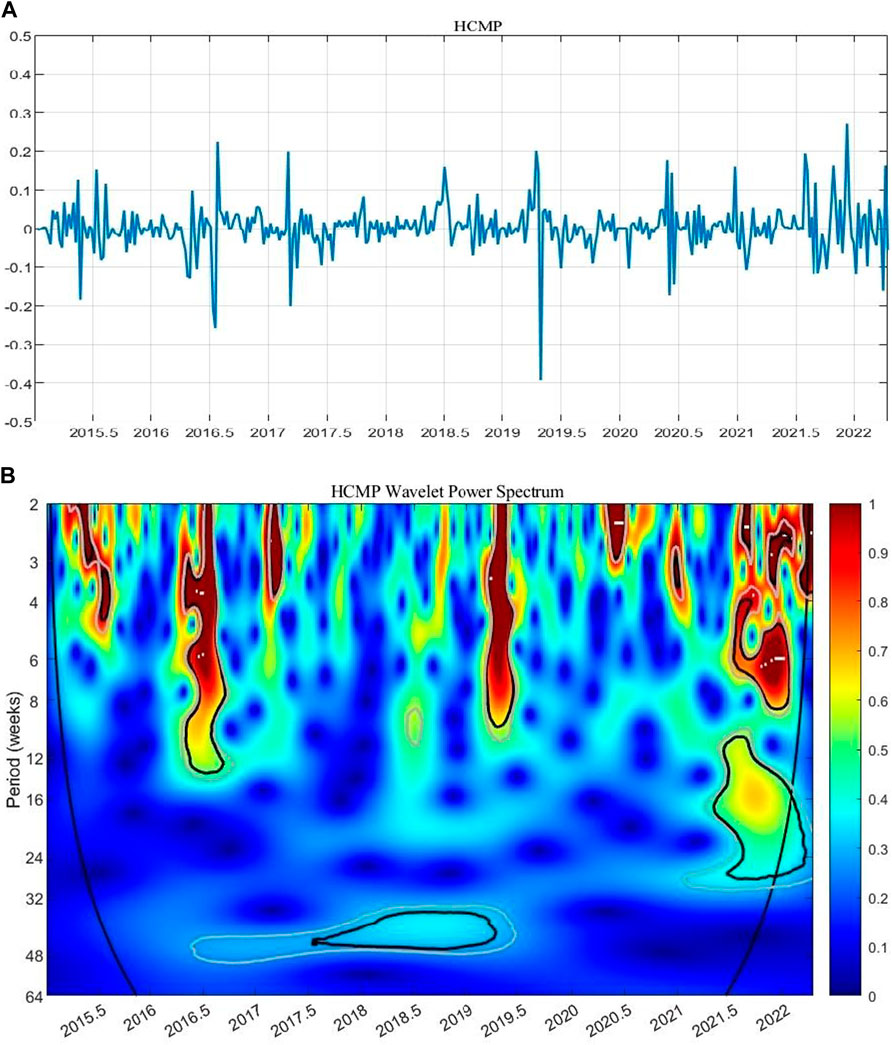
Figure 3. Time series diagram (A) and wavelet energy spectrum (B) diagram of the price-earnings ratios of the Hubei CET market (HCMP).
Time series diagram (Figure 4A) and the wavelet energy spectrum figure of CEPU (Figure 4B) showed that at the 5% significance level, most of the significantly recognizable areas are in the frequency of 2–12 weeks. Short-run fluctuations are identified for the periods of June 2017–June 2018 June 2018 - January 2020, and June 2020–January 2022, the areas are large, and almost all fluctuation coefficients are 1. This indicates strong short-run fluctuations. Fluctuations are identified for the periods of June 2015–January 2016 and January 2018–January 2019 in the frequency of 12–32 weeks, the areas are small, and the fluctuation coefficients are between 0.1 and 0.3. This indicates weak fluctuations. No obvious fluctuations are identified in the frequency of 32–64 weeks. The reasons are as follows: In June, 2015, countries held close consultations to open up a new green and low-carbon development prospect for global sustainable development, which led to a sharp fluctuation in the CET markets and the EPU in various countries. In June 2016, the United Kingdom voted to leave the European Union. On 4 November 2016, the Paris Agreement officially entered into force. In 2017, the changes in the external political environment such as the change of the U.S. government and Trump’s inauguration brought a slight increase in uncertainty to China’s economy. On the home front, the replacing business tax with value-added tax in 2017, the establishment of the Xiong’an New Area, and the deepening of the reform of state-owned enterprises had a certain impact on the CEPU. These can also be identified in the wavelet energy spectrum. In 2018, the United States’ tariffing on Chinese goods, the implementation of China’s new individual income tax law, and the opening of the Science and Technology Innovation Board in July 2019 kept the CEPU at a high level. These events can also be identified from the wavelet energy spectrum. The outbreak of the COVID-19 epidemic in early 2020 greatly impacted China’s economic output, economic growth, and employment. Chinese government quickly made response plans, such as providing credit support for enterprises, providing epidemic prevention subsidies of 10 billion yuan, and implementing counter-cyclical adjustment. Besides, the central bank used monetary tools to support the economic development. All these increased the EPU. Later, the Chinese government implemented favorable tax policies, which further increased the EPU. It can be seen from the wavelet energy spectrum that the fluctuation coefficient of CEPU is high for the period of early stage of the epidemic, and the fluctuation range becomes small for the stable period of the epidemic. At this time, there are short-run fluctuations, and no long-run fluctuations are identified. This indicates that the COVID-19 epidemic causes short-run impact on the CEPU and has little long-run impact. It can be seen that major events in the external environment lead to significant fluctuations in CEPU, and the fluctuations in CEPU are very consistent with those of the HCMP at many time periods. This once again proves the linkage between CEPU and HCMP. Therefore, it is reasonable and necessary to explore the complex relationship between them from the perspectives of time and frequency.
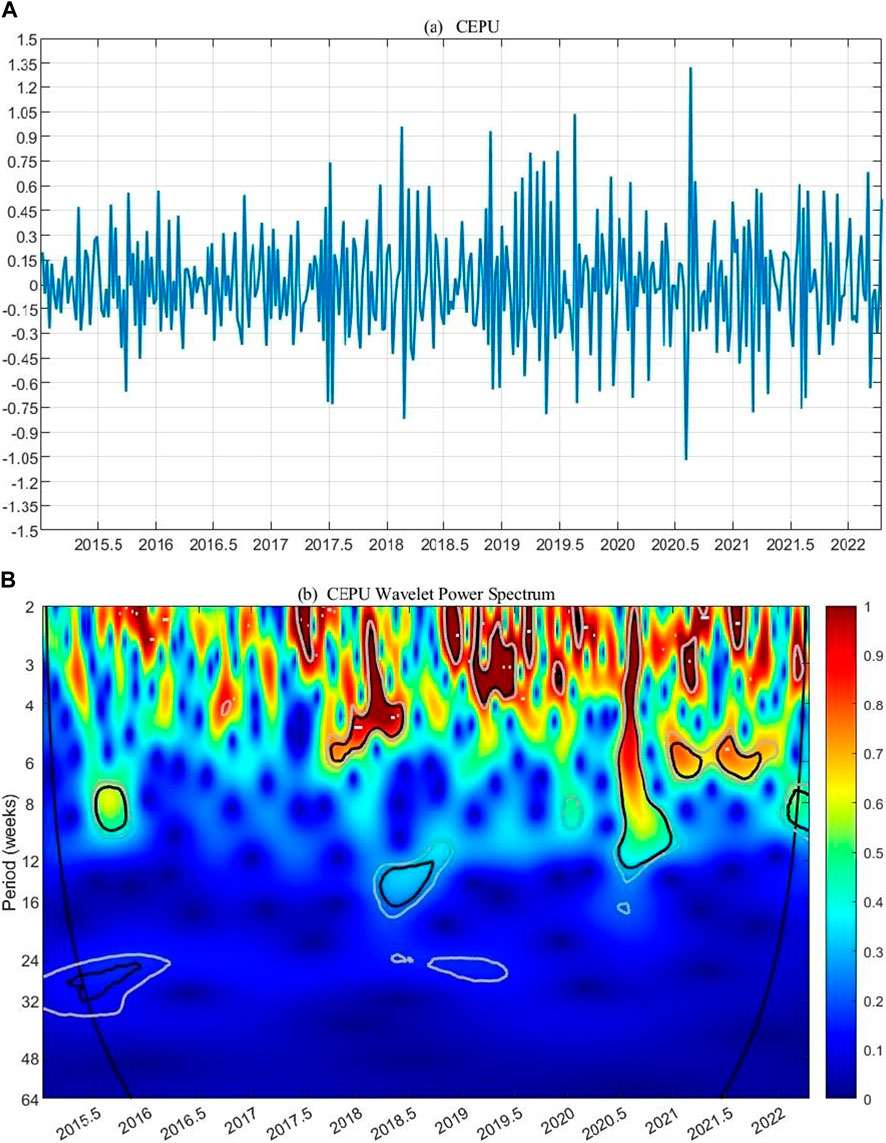
Figure 4. Time series diagram (A) and wavelet energy spectrum (B) diagram of the China economic policy uncertainty index (CEPU).
4.4 Wavelet coherency analysis
The span of the wavelet coherence plot is larger than that of the wavelet energy spectra of the two variables (Figure 5). Therefore, the frequency for the short run, medium run, and long run is set at 12–48, 48–128, and 128–256 weeks, respectively. It can be seen from Figure 5A that the periods when CEPU has a significant correlation with HCMP in the short run are identified, that is, the beginning of 2016, the second half of 2016, January 2017–June 2017, and January 2018–August 2018. The phase difference diagram shows that the φxy is in the range of −π - π/2 in these time periods. This indicates that in the short run, there are both positive and negative correlations between HCMP and CEPU. For example, the φxy for the period of the beginning of 2016 is in the range of -π - 0, and then moves from −π - -π/2 to −π/2–0. From the perspective of the causal relationship, their relationship shifts from being ahead of CEPU by HCMP to CEPU being ahead of HCMP. From the correlation perspective, their relationship shifts from negative correlation to positive correlation. The φxy for the second half of 2016 is in the range of −π/2 - 0. At this time, CEPU fluctuation occurs before HCMP fluctuation, and the two have a positive correlation. The φxy for the period of January 2017 - June 2017 is in the range of 0 - π/2, indicating a positive correlation between HCMP and CEPU, and HCMP fluctuation occurs before CEPU fluctuation. The φxy for the period of January 2018 - August 2018 is in the range of −π/2 - 0, indicating that a positive correlation between HCMP and CEPU, but CEPU fluctuation occurs before HCMP fluctuation. In contrast, the correlation between CEPU and HCMP is more stable in the medium and long run. In the medium run, the main period when CEPU has a significant relationship with HCMP is December 2015 - January 2020, and the φxy is in the range of −π/2 - 0. This indicates a positive correlation between HCMP and CEPU, and CEPU fluctuation occurs before HCMP fluctuation. In the long run, the main period when CEPU has a significant relationship with HCMP is January 2017 - June 2020, and the φxy is in the range of 0 - π/2. This indicates that HCMP has a stable positive correlation with CEPU in the long run, and HCMP fluctuation always precedes CEPU fluctuation.
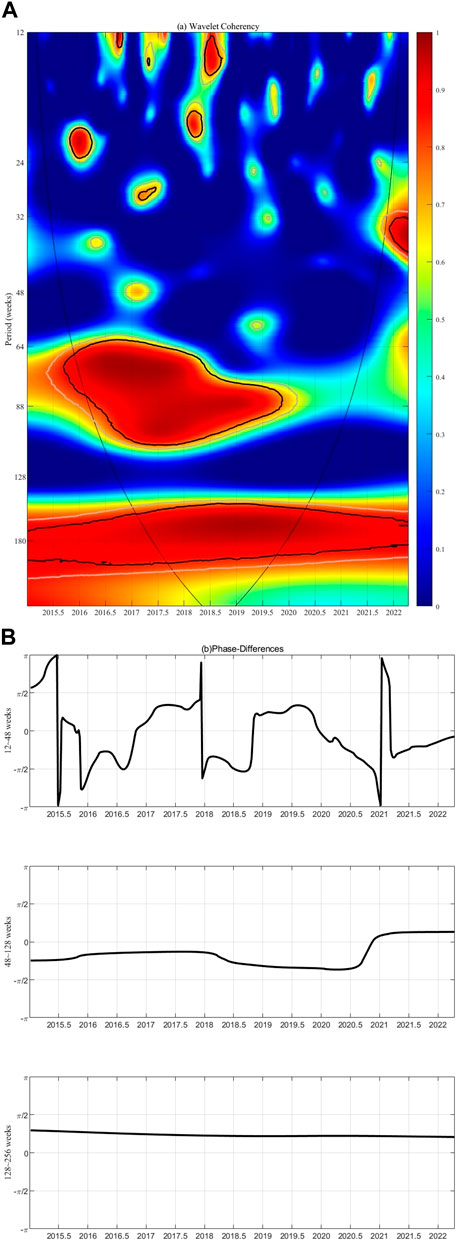
Figure 5. Wavelet coherence diagram (A) and phase difference decomposition diagram (B) of the price-earning ratio in Hubei carbon emission trading market and China’s economic policy uncertainty.
4.5 Partial wavelet coherency analysis
In this study, control variables OIL, COAL, and SZ are added to accurately analyze the linkages between HCMP and CEPU (Figure 6). The medium run (frequency: 48–128 weeks) of the wavelet coherence diagram is divided into the short-medium run (frequency: 48–128 weeks) and medium-long run (frequency: 88–128 weeks), to analyze the partial wavelet energy spectrum and partial wavelet phase difference in detail.
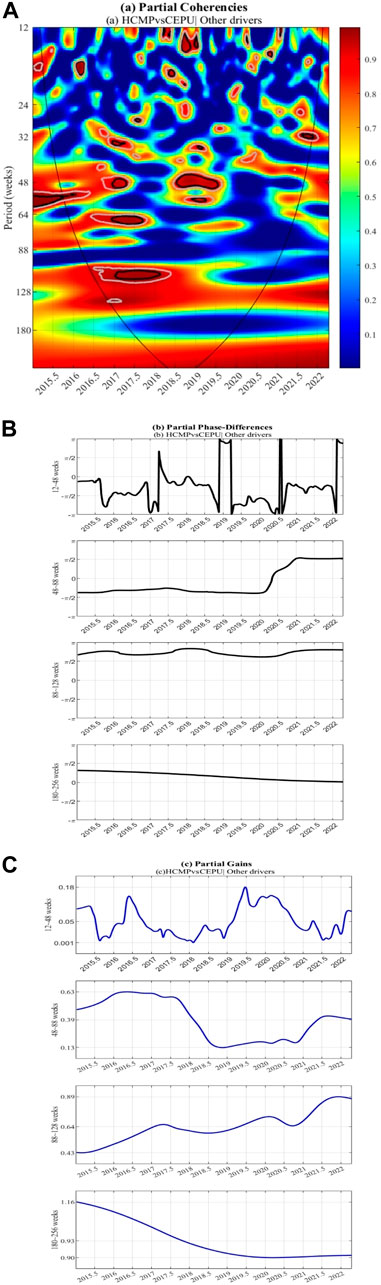
Figure 6. Partial wavelet coherence diagram (A), partial wavelet phase difference decomposition diagram (B), and impact degree diagram (C) of the price-earning ratio in the Hubei carbon emission trading market and China’s economic policy uncertainty.
Comparing with Figure 5, it can be seen that after excluding the control variables, the results obtained are different. Specifically, there are more significantly recognizable areas in the partial wavelet coherence diagram than the wavelet coherence diagram. In the short run, the mixing of positive and negative correlations shifts to positive correlations. By dividing the medium run into short-medium and medium-long run, it is found that CEPU and HCMP are negatively correlated in the medium-long run. In the long run, their relationship goes from leading the fluctuations of CEPU by HCMP to synchronous fluctuations in 2021. It can be seen that wavelet coherence can effectively eliminate the interference of control variables and reduce data redundancy when two variables are associated with other control variables, so that the time-frequency linkages between the two variables can be studied accurately.
In the short run (frequency: 12–48 weeks), the main periods when HCMP and CEPU have a significant correlation are January 2016–June 2016 and June 2018–January 2019, and the φxy is in the range of −π/2 - π/2. This indicates that CEPU is positively correlated with HCMP in the short run. From the perspective of the causal relationship (Figure 6B), the φxy for the period of January 2016–June 2016 is in the range of −π/2–0, indicating that CEPU fluctuation occurs before HCMP fluctuation. The φxy for the period of June 2018 - January 2019 is in the range of 0 - π/2, indicating that HCMP fluctuation occurs before CEPU fluctuation. The impact degree diagram (Figure 6C) shows that for the period of January 2016–June 2016, the impact degree increases from 0.06 (median) to 0.16 (maximum value), indicating a high impact degree. For the period of June 2018–January 2019, the impact degree fluctuates slightly around the median 0.06. This is consistent with the results of the Granger causality test. As for the correlation between the two in the short run, the possible reasons are as follows: The preparatory stage of the Paris Agreement had a certain impact on the CEPU, so that the relationship between the two is leading HCMP by CEPU (CEPU → HCMP). At the beginning of 2018, the Chinese government issued the Ecological Poverty Alleviation Work Plan, and Hubei Province actively responded to the call by using the carbon sink policy to increase income and implementing ecological poverty alleviation. Thus, their relationship shifts to CEPU → HCMP → CEPU.
Due to the financial nature of the CET markets, any information related to the CET markets can be quickly reflected in the market price. In other words, in the short term, market noise, herd effect, and other disruptive factors may cause market price fluctuations, resulting in a complex relationship and irregular interactions between EPU and CMP. In this case, it is difficult for decision-makers to manage the market, and it is also difficult for investors to optimize their portfolios. Some speculators who prefer high risk and high returns can consider short-term carbon emission allowance assets.
In the short-medium run, the two periods June 2016–January 2018 and June 2018–June 2019 are identified, and the φxy is in the range of −π/2–0. This indicates that CEPU is positively correlated with HCMP. From the perspective of causal relationship (Figure 6B), the CEPU fluctuation occurs before HCMP fluctuation. From the impact degree diagram (Figure 6C), it can be seen that the impact degree for the period of June 2016–January 2018 decreases from the highest value of 0.63 to the median of 0.38, while that for the period of June 2018–June 2019 is around the lowest value of 0.13. It can be seen that under the influence of major events, the two are closely and stably correlated. For the relationship between the two in the short-medium run, the possible reasons are as follows: The formal entry into force of the Paris Agreement, the United Kingdom’s “Brexit,” China’s business tax reform and state-owned enterprise reform, Sino-US trade war, and other factors caused by EPU transmit to the CET market. These external influences may increase CEPU, so investors may rely more on carbon emission allowance futures for risk hedging, leading to higher CMP. It is worth noting that the relationship is still close after excluding the factors of OIL, COAL, and SZ for the periods of the Sino-US trade war and United Kingdom’s “Brexit.” This indicates that the Sino-US trade war and United Kingdom’s “Brexit” have a great impact on the relationship between the two in the short-medium run.
In the medium-long run, the main period when HCMP and CEPU have a significant relationship is January 2017–January 2018 (the correlations between the two for other time periods are also close), and the φxy is in the range of π/2 - π. This indicates that CEPU is negatively correlated with HCMP, and CEPU fluctuation occurs before HCMP fluctuation. The impact degree diagram (Figure 6C) shows that for the period of January 2017–January 2018, the impact degree fluctuates slightly around the median of 0.64, and then gradually increases. Unlike the correlations in the short-medium run and before excluding OIL, COAL, and SZ, HCMP, and CEPU are negatively correlated in the medium-long run, that is, an increase in CEPU fluctuation will lead to a decrease in HCMP fluctuation. This may be due to the fact that there are many uncertainties in the medium-long run, which will bring turbulence to the CET market. To avoid risks, investors may shift from the CET market to other energy markets.
After combining the short-medium and medium-long run, it can be seen that in the medium run, external influences such as the Paris Agreement, United Kingdom’s “Brexit,” and the US-China trade war have a significant impact on the correlation between CEPU and HCMP. The CEPU has been in the lead, indicating that in the medium run, CEPU can provide important early warning information for HCMP. However, some major events in the medium-long run may make it difficult for the CET market to obtain accurate information. Therefore, policymakers should fully consider the impact of economic policies and uncertain events on the CET market in the medium run, and investors should pay attention to changes in economic policies and major events to build a reasonable investment portfolio.
In the long-run, HCMP and CEPU have a significant correlation for the period of 2015–2022, and the φxy is in the range of 0 - π/2. This indicates that CEPU is positively correlated with HCMP, and the HCMP fluctuation precedes the CEPU fluctuation. The two fluctuate synchronously for the period after 2021. The impact degree diagram (Figure 6C) shows that for the period of 2015–2022, the impact degree continues to decline from the maximum value of 1.16 (2015) to the minimum value of 0.90 (June 2019), and remains at 0.90 for the rest years. This indicates that the impact degree has gradually stabilized in the long run. It is worth noting that the long-run analysis results in this study may contradict some previous studies under the conditions of different sampling periods, different research objects, and different analysis techniques. For example, Dai et al. (2022) believed that EPU might lead to high shocks to the CET markets in the long run. Dou et al. (2022) believed that in the long run, the increase in EPU would lead to less energy consumption and carbon demand, and ultimately lower carbon emission allowance prices. However, traditional time-domain research methods may lead to unilateral results, and cannot clarify the interaction between CEPU and HCMP in the frequency domain that is crucial for financial and economic time series. This study considers the control variables, and comprehensively analyzes and proves the linkages between CEPU and HCMP from the time and frequency domain.
Therefore, under the guidance of the carbon neutrality goal, the development of the CET markets is particularly important. The market operation significantly affects the formulation of government policies. As the maturation of the CET markets, the financial characteristics become more and more obvious, and the relationship with EPU is more and more close, maintaining a stable synchronous linkage.
5 Conclusion
In the context of carbon neutrality, the development of the CET market and the uncertainty of the global economy coexist. To promote carbon emission reduction and the orderly development of the CET markets in China, this study takes the EPU and the Hubei CET market, a representative CET market of China, as the research objects, to investigate the time-frequency linkage between the two using wavelet analysis.
Firstly, the Granger causality test is performed after the discrete wavelet decomposition of CEPU and HCMP. It is found that there is a two-way Granger causal relationship between the two in the short and long runs, and a one-way causal relationship in the medium run.
Then, the continuous wavelet transform is used to accurately analyze the linkage between CEPU and HCMP in different time periods and frequencies after excluding the interference of OIL, COAL, and SZ. The results show that from the perspective of correlation in the time domain, except for the negative correlation in the medium-long run (88–128 weeks), there is a positive correlation for the other time periods. From the perspective of causality in the frequency domain, there is a leading or lagging relationship between the two in the short run (12–48 weeks). The market microstructure noise, herd effect, and other disruptive factors may cause short-term and rapid fluctuations in the CET market with financial attributes, resulting in a complex relationship between the two and irregular mutual influences. This shows a large randomness and complexity in the relationship between the two in the short run. In the medium run (48–128 weeks), the relationship between CEPU and HCMP is more significant. This is because external influences such as the Paris Agreement, Brexit of the United Kingdom, and Sino-US trade war have a dramatic impact on the relationship between the two in the medium run. It is worth mentioning that CEPU and HCMP are positively and negatively correlated in the short-medium run (48–88 weeks) and medium-long run (88–128 weeks), respectively. This indicates that even if carbon emission allowance assets can be used as a tool for risk hedging in the medium run, there may be a risk of a decrease in HCMP. In the long run (180–256 weeks), CEPU and HCMP become more relevant as the CET market matures.
In summary, CEPU and HCMP have different linkages in different time periods and frequencies. Based on this, we propose the following suggestions:
For policymakers, it is necessary to make the policies transparent and reduce the time and information cost of policy transmission, so as to reduce the losses of the CET market participants caused by the complex and volatile relationship between CEPU and HCMP in the short run. At the same time, it is necessary to clarify defined targets to minimize unexpected policy changes and increase investors’ confidence. Secondly, since medium-run external influences such as international political events and energy market turbulence may lead to varying degrees of changes in the linkage between CEPU and HCMP, it is necessary to establish a monitoring system according to the time-frequency linkages between the two to minimize the impact of external events. At the same time, policymakers should assist the CET markets to adopt diversified strategies, extend the industrial chain related to carbon emission allowance products, promote the progress of low-carbon technologies, and increase the stability and efficiency of the CET markets. In the long run, the synchronous fluctuation of CEPU and HCMP provides good ideas for policymakers. In the process of policy formulation, it is necessary to strengthen communication with the CET markets, cooperate with stakeholders, and encourage enterprises to assume social responsibility, to further promote emission reduction, and to achieve the coordination between economic policies and the CET markets and the orderly development of the CET markets.
For investors, it is necessary to fully consider short-run, medium-run, and long-run factors when adjusting investment plans and asset portfolios, especially in the context of EPU. For example, in the short run, carbon emission allowance assets can be used as speculative financial assets. Because the relationship between EPU and CMP in the short run is very complex, it is necessary to stabilize sentiment and confidence. In the medium run, investors should not only pay attention to the supply and demand factors of the CET markets, but also pay attention to international events and fluctuations in the energy markets. At the same time, investors can adjust the investment plan according to major changes in economic policies, strengthen risk management, and make reasonable choices in different economic environments, to avoid losses caused by economic shocks and policy changes. Finally, investors can develop long-term investment strategies based on the prospects of the CET markets.
This study provides a new perspective for the study of the linkage between EPU and the CET markets, and this perspective can also be applied to the study of the relationship between EPU and other markets. However, this study also has some limitations. This study focuses on the correlation between CEPU and HCMP at different time periods and frequencies. In the future, we will further explore the differences in their relationship between extreme states and normal states by combining the idea of quantiles, to capture the asymmetric relationship between them. This will provide richer references for market participants. Secondly, this study only focuses on the correlation between CEPU and HCMP. There are uncertainties of other policies, such as fiscal policy, monetary policy, trade policy, and exchange rate policy, which will be considered in future studies.
Data availability statement
The original contributions presented in the study are included in the article/supplementary material, further inquiries can be directed to the corresponding author.
Author contributions
YW: Conceptualization, Writing–review and editing. ZL: Methodology, Visualization, Writing–original draft. YC: Investigation, Software, Writing–review and editing. PY: Writing–review and editing.
Funding
The author(s) declare that financial support was received for the research, authorship, and/or publication of this article. This research is supported by the National Natural Science Foundation of China (Grant No. 72101006), the Graduate Innovation project of North Minzu University (Grant No. YCX24017 and YCX24016), and the Youth Fund Project for Philosophy and Social Science Research of Anhui Province of China (Grant No. AHSKQ2022D040).
Conflict of interest
The authors declare that the research was conducted in the absence of any commercial or financial relationships that could be construed as a potential conflict of interest.
Publisher’s note
All claims expressed in this article are solely those of the authors and do not necessarily represent those of their affiliated organizations, or those of the publisher, the editors and the reviewers. Any product that may be evaluated in this article, or claim that may be made by its manufacturer, is not guaranteed or endorsed by the publisher.
References
An, Y., Jiang, K., and Song, J. (2023). Does a cross-correlation of economic policy uncertainty with China’s carbon marke really exist? A perspective on fractal market hypothesis Sustainability 15 (14), 10818. doi:10.3390/su151410818
Baker, S. R., Bloom, N., and Davis, S. J. (2016). Measuring economic policy uncertainty. Q. J. Econ. 131 (4), 1593–1636. doi:10.3386/w21633
Bhattacharya, U., Hsu, P. H., Tian, X., and Xu, Y. (2017). What affects innovation more: policy or policy uncertainty? Journalof Financial Quantitative Analysis 52 (5), 1869–1901. doi:10.1017/S0022109017000540
Cheng, Q., Qiao, H., Gu, Y., and Chen, Z. (2023). Price dynamics and interactions between the Chinese and European carbon emission trading markets. Energies 16 (4), 1624. doi:10.3390/en16041624
Dai, P. F., Xiong, X., Huynh, T. L. D., and Wang, J. (2022). The impact of economic policy uncertainties on the volatility of European carbon market J. Commodi Market. 26, 100–208. doi:10.1016/j.jcomm.2021.100208
Dou, Y., Li, Y., Dong, K., and Ren, X. (2022). Dynamic linkages between economic policy uncertainty and the carbon futures market: does Covid-19 pandemic matter? Resources Policy. 75, 102455. doi:10.1016/j.resourpol.2021.102455
Fu, L., Chen, Y., Xia, Q., and Miao, J. (2022). Impact of economic policy uncertainty on carbon emissions:Evidence at China ’s city level. Front. Energy Res. 10, 866217. doi:10.3389/fenrg.2022.866217
Gao, R., Zhao, Y., and Zhang, B. (2021). The spillover effects of economic policy uncertainty on the oil, gold, and stock markets: evidence from China. Int. J. Finance and Econ. 26 (2), 2134–2141. doi:10.1002/ijfe.1898
Gong, Y., Li, X., and Xue, W. (2023). The impact of EPU spillovers on the bond market volatility: global evidence. Finance Res. Lett. 55, 103931. doi:10.1016/j.frl.2023.103931
He, F., Ma, Y., and Zhang, X. (2020). How does economic policy uncertainty affect corporate Innovation?Evidence from China listed companies. Int. Rev. Econ. and Finance 67, 225–239. doi:10.1016/j.iref.2020.01.006
Huang, W. Q., and Liu, P. (2021). Asymmetric effects of economic policy uncertainty on stock returns under different market conditions:evidence from G7 stock markets. Appl. Econ. Lett. 29 (9), 780–784. doi:10.1080/13504851.2021.1885606
Huang, Y., and Luk, P. (2020). Measuring economic policy uncertainty in China. China Econ. Rev. 59, 101367. doi:10.1016/j.chieco.2019.101367
Ji, C. J., Hu, Y. J., Tang, B. J., and Qu, S. (2021). Price drivers in the carbon emissions trading scheme: evidence from Chinese emissions trading scheme pilots. J. Clean. Prod. 278, 123469. doi:10.1016/j.jclepro.2020.123469
Jiang, Y., Lei, Y. L., Yang, Y. Z., and Wang, F. (2018). Factors affecting the pilot trading market of carbon emissions in China. Petroleum Sci. 15, 412–420. doi:10.1007/s12182-018-0224-3
Li, H., Li, Q., Huang, X., and Guo, L. (2023). Do green bonds and economic policy uncertainty matter for carbon price? New insights from a TVP-VAR framework. Int. Rev. Financial Analysis 86, 102502. doi:10.1016/j.irfa.2023.102502
Li, P., Zhang, H., Yuan, Y., and Hao, A. (2021). Time-varying impacts of carbon price drivers in the EU ETS: a TVP-VAR analysis. Front. Environ. Sci. 9, 651791. doi:10.3389/fenvs.2021.651791
Li, X. L., Li, X., and Liu, Q. N. (2020). Research on the dynamic correlation between insurance cycle and economic cycle in China. Insur. Res. 4, 16–22. doi:10.13497/j.cnki.is.2020.04.002
Liu, J., Zhang, Z., Yan, L., and Wen, F. (2021). Forecasting the volatility of EUA futures with economic policy uncertainty using the GARCH-MIDAS model. Financ. Innov. 7, 76–19. doi:10.1186/s40854-021-00292-8
Liu, X., Zhou, X., Zhu, B., He, K., and Wang, P. (2019). Measuring the maturity of carbon market in China: an entropy-based TOPSIS approach. J. Clean. Prod. 229, 94–103. doi:10.1016/j.jclepro.2019.04.380
Mei, D., Zhao, C., Luo, Q., and Li, Y. (2022). Forecasting the Chinese low-carbon index volatility Resources Policy. 17, 102732. doi:10.1016/j.resourpol.2022.102732
Maquieira, C., Gahona-Flores, O., and Espinosa-Méndez, C. (2023). How does China economic policy uncertainty (EPU) impact copper-firms stock returns and copper prices returns? Acad. Rev. Latinoam. Adm. 36 (2), 245–268. doi:10.1108/arla-11-2022-0203
Wang, R., and Li, L. F. (2021). Macro uncertainty and financial uncertainty: a study on the relationship between measurement and dynamics. Explor. Econ. Issues 42 (3), 27–42.
Wang, D., Sun, Y., and Wang, Y. (2024). Comparing the EU and Chinese carbon trading market operations and their spillover effects. J. Environ. Manag. 351, 119795. doi:10.1016/j.jenvman.2023.119795
Yang, J., Dong, H., Shackman, J. D., and Yuan, J. (2022). Construction of a carbon price benchmark in China—analysis of eight pilot markets. Environ. Sci. Pollut. Res. 29 (27), 41309–41328. doi:10.1007/s11356-021-18137-3
Yin, Y., Jiang, Z., Liu, Y., and Yu, Z. (2019). Factors affecting carbon emission trading price: evidence from China. Emerg. Mark. Finance Trade 55 (15), 3433–3451. doi:10.1080/1540496X.2019.1663166
Ye, S., Dai, P. F., Nguyen, H. T., and Huynh, N. Q. A. (2021). Is the cross-correlation of EU carbon market price with policy uncertainty really being? A multiscale multifractal perspective J. Environmen. Management. 298, 113490. doi:10.1016/j.jenvman.2021.113490
Yu, H., Wang, H., Liang, C., Liu, Z., and Wang, S. (2022). Carbon market volatility analysis based on structural breaks: evidence from EU-ETS and China. Front. Environ. Sci. 10, 973855. doi:10.3389/fenvs.2022.973855
Zhang, J., and Xu, Y. (2020). Research on the price fluctuation and risk formation mechanism of carbon emission rights in China based on a GARCH model. Sustainability 12 (10), 4249. doi:10.3390/su12104249
Zhang, M., Liu, H., Liu, J., Chen, C., Li, Z., Wang, B., et al. (2022). Modelling dependency structures of carbon trading markets between China and European Union: from carbon pilot to COVID-19 pandemic. Axioms 11 (12), 695. doi:10.3390/axioms11120695
Zhang, W., Tian, L., Yao, Y., Tian, Z., Wang, M., and Zhang, G. (2019). Dynamic evolution characteristics of European Union emissions trade system price from high price period to low price period. J. Clean. Prod. 224, 188–197. doi:10.1016/j.jclepro.2019.03.202
Zhong, X., Chen, W., and Ren, G. (2023). Curvilinear effect of economic policy uncertainty on innovation in Chinese manufacturing firms: do managerial pay gaps matter? Chin. Manag. Stud. 17 (4), 701–717. doi:10.1108/cms-06-2021-0244
Keywords: economic policy uncertainty, carbon emission trading market, discrete wavelet transform, continuous wavelet transform, linkage relationship
Citation: Wu Y, Li Z, Cheng Y and Yun P (2024) Study on the time-frequency linkages between China’s economic policy uncertainty and the carbon emission trading market (Central China)—evidence from partial wavelet coherence analysis. Front. Environ. Sci. 12:1421288. doi: 10.3389/fenvs.2024.1421288
Received: 22 April 2024; Accepted: 19 September 2024;
Published: 10 October 2024.
Edited by:
Mobeen Ur Rehman, Keele University, United KingdomReviewed by:
Cüneyt Dumrul, Erciyes University, TürkiyeFahad Ali, Zhejiang University of Finance and Economics, China
Copyright © 2024 Wu, Li, Cheng and Yun. This is an open-access article distributed under the terms of the Creative Commons Attribution License (CC BY). The use, distribution or reproduction in other forums is permitted, provided the original author(s) and the copyright owner(s) are credited and that the original publication in this journal is cited, in accordance with accepted academic practice. No use, distribution or reproduction is permitted which does not comply with these terms.
*Correspondence: Zhenhao Li, MTM4MzkwNTMzMzRAMTYzLmNvbQ==