 A. M. Almegbl
 F. Munshi
 A. Khursheed
94% of researchers rate our articles as excellent or good
Learn more about the work of our research integrity team to safeguard the quality of each article we publish.
Find out more
ORIGINAL RESEARCH article
Front. Environ. Sci., 16 July 2024
Sec. Water and Wastewater Management
Volume 12 - 2024 | https://doi.org/10.3389/fenvs.2024.1419102
This article is part of the Research TopicResource Recovery, Waste Conversion, Pollutants Remediation and Carbon NeutralizationView all 4 articles
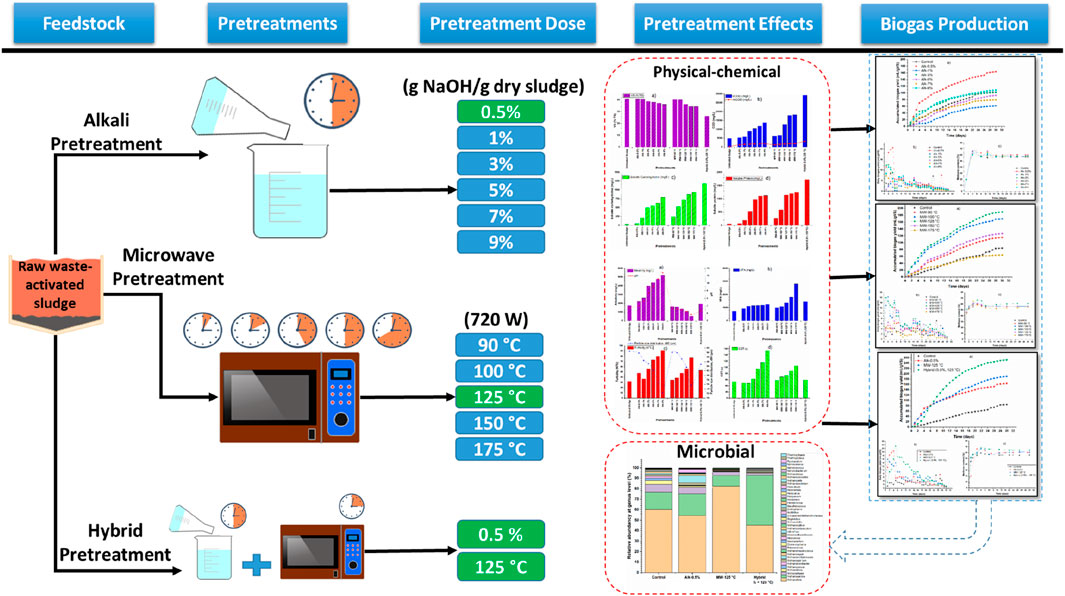
Sustainable and environmentally friendly energy production is feasible via anaerobic digestion (AD) of organic wastes, such as waste-activated sludge (WAS). However, due to its limited degradation, a pretreatment strategy is applied to WAS to enhance its bio-degradation and, thus, biogas yield. Alkaline (0.5%–9% g NaOH/gTS, 30 min), microwave (MW) (90°C–175°C), and hybrid (0.5% g NaOH/gTS +125°C) pretreatments were applied to WAS. The characterization of untreated and pretreated WAS revealed that with higher alkaline and MW pretreatment, the soluble chemical oxygen demand (sCOD), carbohydrate, and protein increased; however, the readily biodegradable COD (rbCOD) rate was unlike the sCOD. The sCOD was 7%–18%, 8%–23%, and 37% for alkaline, MW, and hybrid pretreatments, respectively. Stronger alkaline and MW pretreatment induced higher turbidity, capillary suction time, and lower average particle size. AD of alkaline-, MW-, and hybrid-pretreated WAS produced 94% (0.5% NaOH), 125% (MW at 125°C), and 199% (0.5% NaOH and MW at 125°C) increased biogas, respectively, compared to the AD of untreated sludge. The AD data on the alkaline-, MW-, and hybrid-pretreated BMP assays fitted well with the modified Gompertz model with a coefficient of determination above 0.95. The PCA analysis showed that biogas production is closely correlated with pretreatment temperature, VFA production, rbCOD, sCOD, and soluble carbohydrates and protein. Microbial genome sequencing analysis showed an improvement in microbial abundance and diversity. Acetoclastic methanogen (Methanothrix) growth was improved by 37% (MW pretreatment). Abundances of Methanosarcina, using all three metabolic pathways for methanogenesis, were 17, 21, 11, and 48% in the control, alkaline-, MW-, and hybrid-pretreated digestate, respectively, corresponding to 186% improvement in hybrid pretreatment when compared to the control.
• Higher doses of pretreatments induced higher turbidity and capillary suction time and lower average particle size.
• Pretreatment improved dewaterability, CH4 yield and content, and methanogens.
• Alkaline and microwave pretreatments of 0.5% and 125°C were the optimum doses.
• AD of optimum alkaline-, MW-, and hybrid-pretreated WAS produced 93.8%, 125.2%, and 198.7% increased biogas, respectively, compared to the control.
• Methanosarcina abundances were 16.7, 20.7, 10.5, and 47.8% in the control, alkaline-, MW-, and hybrid-pretreated digestate, respectively.
Energy insecurity due to the exhaustion of fossil fuels and climate change due to anthrophonic activities made the world rummage around for sustainable and renewable energy (Fu et al., 2021). Anaerobic digestion (AD) is one of the promising technologies to bio-convert organic wastes into bio-fuels, bio-fertilizers, and valorized compounds. Waste-activated sludge (WAS) is an abundant organic waste generated by wastewater treatment plants (WWTPs) (Wu et al., 2019). The volume of WAS is dramatically increasing since urbanization is growing at a high pace, and the favorable treatment configuration in WWTPs is the conventional biological-activated sludge treatment.
Anaerobic digestion is a four-step symbiotic process: hydrolysis, acidogenesis, acetogenesis, and methanogenesis (Rahamni et al., 2022). In the hydrolysis step, complex organic wastes are degraded to monomers (fatty acids, amino acids, and free sugars) by hydrolyzing bacteria. In acidogenesis, they are further converted to intermediary products, mainly to short-chain volatile organic acids. The acids are oxidized to H2, CO2, and acetate in the acetogenesis step. In the methanogenesis step, the by-products of the acetogenesis step are reduced to CH4 and CO2 (Gahlot et al., 2020). Acetogenesis and methanogenesis are established by syntrophic relations of oxidizing and reducing bacteria and archaea in an anaerobic environment.
WAS has approximately 60% volatile solid (dry basis) composed of organics, microbial cells, and extracellular polymeric substances (EPS). Microbial cells and EPS are the obstacles to the degradation of organics via AD. Hence, the degradation efficiency for AD of WAS is limited, which is from 20% to 50% (Wang and Li, 2016). The pretreatment of WAS before AD to disintegrate the sludge matrix is required to access the intracellular and extracellular organics (Chang et al., 2011).
Pretreatments can be physical, chemical, biological, and hybrid, a combination of various pretreatments (Chi et al., 2011). However, suitable pretreatments for a specific feedstock are decided based on the disintegration efficiency, cost of reagents, energy consumption, inhibitory compound formation, environmental impacts, processing parameters of AD, final disposal, handling, land application, and rules and regulations (Rahmani et al., 2022). The advantages and drawbacks of different pretreatment methods for organic wastes are listed in Table 1 (Rahmani et al., 2022).
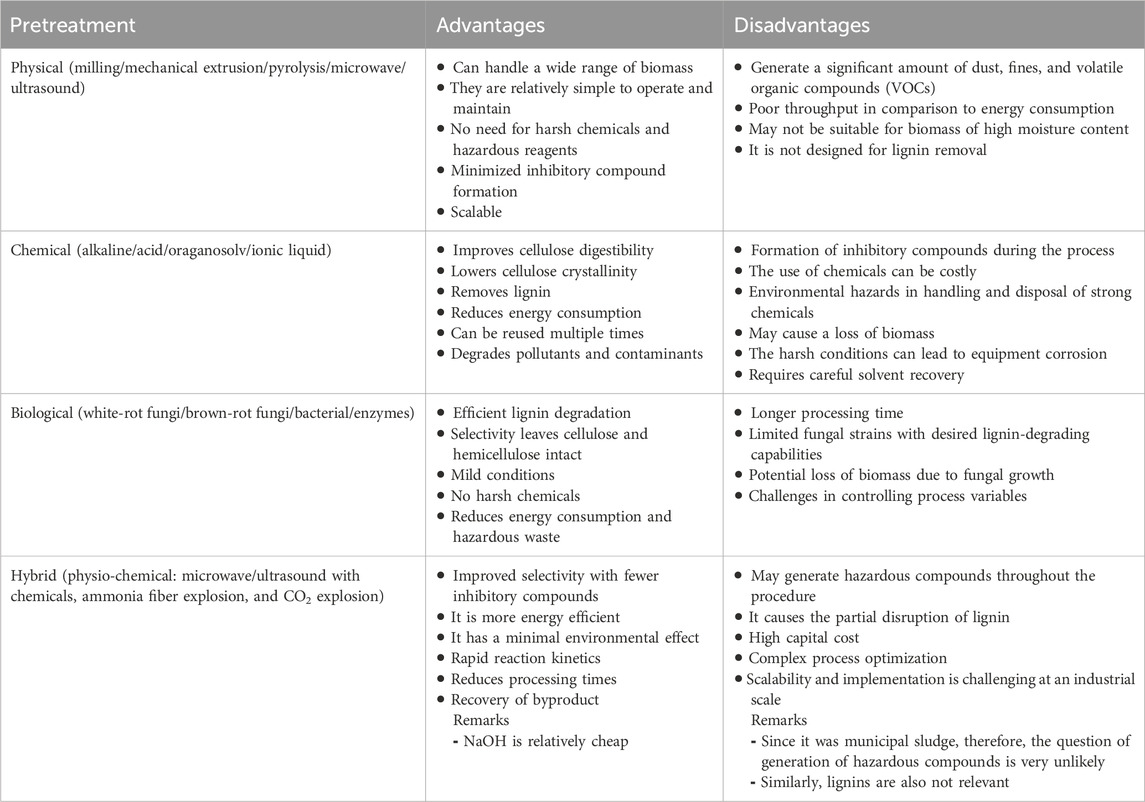
Table 1. Advantages and disadvantages of different pretreatments of organic wastes.
Physical milling is not recommended for WAS since it has high moisture content, while the biological process is time consuming. Alkaline pretreatment of WAS wrecks the cell wall chemically by increasing the cell osmotic pressure, causing the release of solubilized materials. Different alkaline reagents such as NaOH, Ca(OH)2, KOH, CaO, O3, and H2O2 are available. However, reagents with a hydroxyl group are superior for the disintegration of the floc structure (Wonglertarak and Wichitsathian, 2014). Alkaline pretreatment can be supportive in VFA-stressed digesters by increasing the buffering capacity. Moreover, pretreatment does not need sophisticated devices. Solubilization of organics under alkaline pretreatment depends on the sample characteristics, chemical dose, pretreatment time, etc.
Microwave (MW) pretreatment of WAS is more efficient than conventional heating in terms of energy consumption, time requirement, organics solubilization, hazardous emissions, and disinfection due to the thermal and a-thermal effects of microwaving (Yu et al., 2010; Ebenezer et al., 2015). The disintegration degree of organics subjected to MW pretreatment may have different effects due to different feedstock types and sources, moisture content and sample volume, microwave power, temperature, and pretreatment time. Therefore, optimizing each pretreatment parameter is crucial for the efficient disintegration of WAS.
However, mono alkaline and MW pretreatments are less dynamic than their combination (Kim et al., 2013). The synergic effects, owing to the complementary acts of alkaline and MW pretreatments, are more cost-effective due to compensation for high doses of chemicals and energy consumption. The thermal–alkaline pretreatment of WAS under the Saudi Arabian scenario has yet to be investigated for enhanced degradation and biogas production via mesophilic AD. Moreover, many studies on the thermal–chemical pretreatment of WAS are based on conventional heating (Kim et al., 2013), below water-boiling point (Jiang et al., 2021), pH-based (Alqaralleh et al., 2019), high chemical dose (Shi et al., 2015), longer pretreatment time (Jiang et al., 2018), and other non-hydroxyl alkali reagents (Yu et al., 2018). In addition, most of the thermal–chemical pretreatment methods of WAS lack microbial genome sequencing, especially for methanogenic archaea.
Anaerobic digestion (AD) are not unknown but are very rare in Saudi Arabia. Waste biological sludges are mostly subjected to high-dosed chemical conditioning, followed by mechanical dewatering. Therefore, any advanced research on the enhancement of AD on Saudi waste sludges is a new beginning and, therefore, a novelty. Therefore, this study investigates the alkaline, MW, and hybrid pretreatment of WAS in the WWTPs of Saudi Arabia to fill the gaps that the literature needs to include.
The dewatered waste-activated sludge was obtained from WWTP-treating municipal wastewater based on sequencing batch reactor configuration. The inoculum was collected from another WWTP facilitated with an anaerobic digester operating at ambient temperature. Therefore, the inoculum was acclimatized and degassed for a week at 35°C ± 2°C and in an anaerobic environment.
In the literature, alkaline pretreatment has been used in vast ranges of 2%–8% (Maryam et al., 2021), 2%–26% (Wang et al., 2019), and 0%–0.8% (Kim et al., 2013), while MW pretreatment is generally used at boiling temperature (Chang et al., 2011; Jiang et al., 2021) up to 175°C (Alqaralleh et al., 2019). Based on the optimum values of alkaline and MW pretreatments in the literature, alkaline pretreatment of 0.5%–9% and MW pretreatment of 90°C–175°C were selected. Alkaline pretreatment is applied before MW pretreatment so that more alkali will not be required in the subsequent pretreatment (Toutian et al., 2020).
The dewatered waste-activated sludge was diluted almost two times with distilled water. Different pretreatment times of 20, 30, 40, and 50 min were initially applied on 3% (g NaOH/g TS) alkaline pretreatment to optimize the pretreatment time. Based on the higher sCOD, 30 min was the optimum pretreatment time and was applied to the subsequent pretreatments. Later, NaOH pellets were added to 400 mL of the prepared slurry to make the concentrations 0.5, 1, 3, 5, 7, and 9% (g NaOH/g TS), and they were stirred for 30 min.
An amount of 600 mL of the diluted slurry was irradiated in the microwave at 60% power intensity (1,200 W capacity) for 225, 255, 340, 675, and 825 s to increase the temperature of the sample to 90, 100, 125, 150, and 175°C, respectively.
The diluted slurry was first subjected to alkaline pretreatment per the above details for the optimum alkaline pretreatment of 0.5% (g NaOH/g TS). Later, the optimum temperature of MW pretreatment (125°C) was applied for 340 s.
The pretreated waste-activated sludge was mixed with the acclimatized inoculum based on the inoculum to substrate ratio (ISR) of 1 (VS basis). The anaerobic reactors were glass bottles of 300 mL volume made by Oxitop®, Germany. The working volume was set to 200 mL, if needed, by adding distilled water. The reactor had a pressure measuring head (Oxitop®-C) screwed on top of the bottle to record the pressure at regular intervals with the help of a built-in pressure sensor (Figures 1A,C). For measuring CH4 content, an absorber such as potassium hydroxide (KOH 30% v/v) is injected through a septum nozzle into a rubber stopper in the flask (Figure 1C) to absorb CO2. Therefore, the new pressure reading is the pressure for only CH4 production. The reactors were placed on the inductive stirring system with 80 rounds per minute (rpm) and in the Oxitop® incubator at 35°C ± 2°C (Figure 1D). All the batch assays were performed in triplicate. The recorded data by the Oxitop® measuring head can be transferred to a computer for analysis using the Oxitop® OC 110 controller (Figure 1B) (https://www.xylemanalytics.com/en/File%20Library/Resource%20Library/WTW/09%20Application%20Papers/AR_BOD_Anaerob_lab_01_E.pdf).
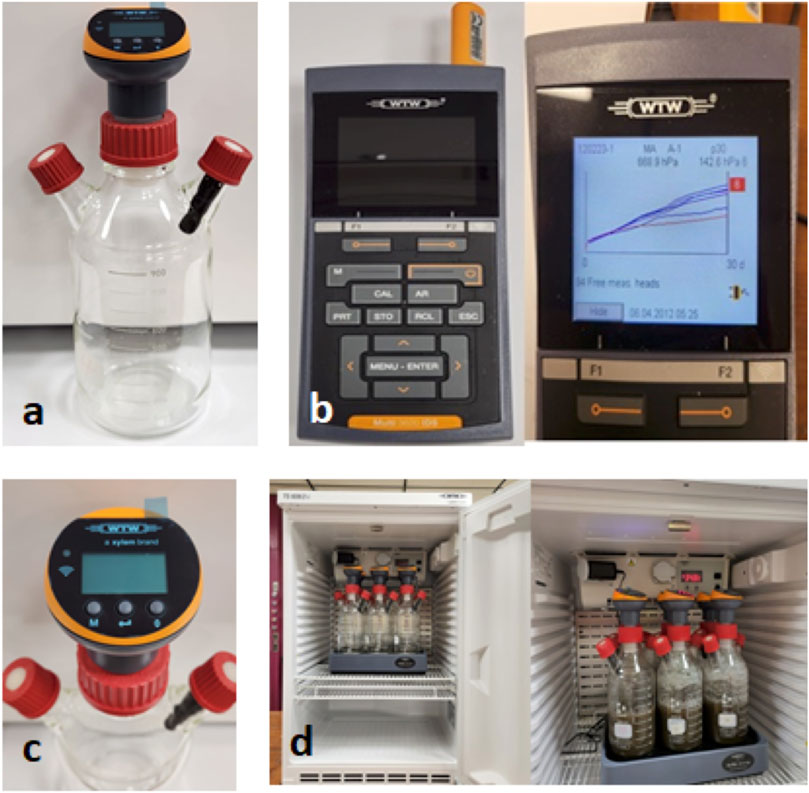
Figure 1. (A) Oxitop® sample bottle with a measuring head, septum nozzle, and the rubber stopper; (B) Oxitop® controller; (C) Oxitop® measuring head; and (D) Oxitop® incubator and shaker.
A control reactor containing untreated WAS and a blank reactor containing only inoculums were set up in each phase of BMP. The control reactor was used to compare the biogas production with the pretreated WAS, and the blank reactor was used to determine the production of background biogas from the inoculum. To establish an anaerobic environment, the reactors were purged with nitrogen gas for 2 min at 150 mL/min at the start-up of BMPs in each phase. The initial pH was adjusted at approximately 7.2 with 1 N NaOH or 1 N H2SO4 if needed.
Moreover, the buffering capacity was enhanced by adding macro- and micro-nutrients and KHCO3. The first BMP was for alkaline pretreatment, followed by MW pretreatment and then hybrid pretreatment. The three phases of BMPs had an HRT of 30 days to compare their biogas production.
The total solids (TSs), pH, alkalinity, volatile fatty acid (VFA), volatile solids (VSs), total chemical oxygen demand (tCOD), soluble COD (sCOD), readily biodegradable COD (rbCOD), supernatant turbidity (NTU), capillary suction time (CST), total carbohydrates (tCHs), protein, particles size distribution, and microbial genome sequencing were performed for raw dewatered sludge and pretreated sludge. The TS%, VS%, COD, and pH were as per the standard methods (APHA, 2017). For tCOD and tCH analysis, dried sludge was digested with concentrated H2SO4 and diluted (Charnier et al., 2017). Later, the standard method was applied for tCOD, and the anthrone method was employed for tCHs (Dreywood, 1946).
sCOD of the supernatant was analyzed following the standard method using a 0.45-µm glass fiber filter paper. sCOD consists of rbCOD and slowly biodegradable COD (sbCOD). For rbCOD analysis, colloidal solids of the filtered sample were removed using coagulation and flocculation methods before analyzing rbCOD using the standard method. The filtered sample was coagulated using the aluminum sulfate [Al(SO4)3·15H2O] solution, followed by rapid–slow mixing, settling, and re-filtration, as suggested by Wentzel et al. (2001) and Khursheed et al. (2018). The WAS sample was centrifuged, and the supernatant was used to analyze the alkalinity and VFA using the titration method (DiLallo and Albertson, 1961).
The sludge’s dewaterability was determined using the capillary suction device (Triton Electronic-304B, UK). Supernatant turbidity was determined using TL2300 (Hach, United States). The protein content was measured following the method suggested by Lowry et al. (1951) using the Folin-phenol reagent and standard BSA (bovine serum albumin). The average particle size distribution of the sludge samples was determined using a laser analyzer, Litesizer 500 (Anton Paar, United States), with a measurement range from 0.3 to 10,000 nm. The respective particle sizes were expressed in terms of its d90.
Digestate samples from the reactors containing the optimum alkaline- (0.5% NaOH, g/g dry sludge), microwave- (125°C), and hybrid (0.5% NaOH +125°C)-pretreated sludge and untreated sludge (control) were analyzed for methanogen abundance and diversity. A measure of 1 mL of the samples was used for DNA extraction using an Xploregen kit, the Soil gDNA Isolation kit (Xploregen Discoveries Pvt. Ltd., Karnataka, India). Polymerase chain reaction (PCR) amplification was accomplished using Taq Master Mix (TaKaRa Bio, Kyoto, Japan) that consisted of high-fidelity DNA polymerase, 0.5 mM dNTPs, 3.2 mM MgCl2, and PCR enzyme buffer. The pair primers of 344F/915R (5′ACGGGGCTGCAGCAGGGGCGA 3’/5′GTGCTCCCCCGCCAATTCCT 3′) were employed. Sequencing was performed using Illumina MiSeq with the 2x300PE sequencing kit. For PCR amplification, 40 ng of extracted DNA along with 10 pM of each primer is used. Initial denaturation was 95°C. Denaturation at 95°C for 15 s, annealing at 60°C for 15 s, and elongation at 72°C for 2 min were performed in 25 cycles. Final extension was carried out at 72°C for 10 min, and the hold was at 4°C. The accuracy of the raw data at the genus level was investigated using MULTIQC and FASTQC. The Chao1 method Chao (1984) was used to analyze alpha-diversity and significance using the statistical method of t-test/ANOVA. Taxonomic profiling at phylum, class, order, family, and genus levels was performed for the metagenome analysis. The database used for the archaeal region is the National Center for Biotechnology Information (NCBI). The top 40 organisms (genus level) were taken for the heat map construction, where unit variance scaling is applied to sequence abundance. Both taxon rows and sample columns were clustered using correlation distance and average linkage.
The correlation between the different parameters of pretreatment and anaerobic digestion was exhibited using principal component analysis (PCA) using Minitab 17. PCA is a statistical procedure used to reduce the dimensions while preserving the essential information. The experimental biogas production was compared with the modified Gompertz (MG) model, as per Equation 1. The MG model is a non-linear model based on the growth of bacteria. It fits steady-state anaerobic digesters well (Paritosh et al., 2018). Moreover, the first-order (FO) model, as per Equation 2, was used to estimate the kinetic constant. The constant describes the biodegradation rate in anaerobic digesters.
Here,
The dewatered WAS had a TS% of approximately 16%. It was diluted two times with distilled water. The physical–chemical analysis of the dilute WAS is shown in Table 2, along with the inoculum used in BMPs. The rbCOD of the raw sludge was low. It could be because the EPS retained organics, and the sludge was dewatered. The protein content was approximately 7,360 mg/L, i.e., 9% of TS, while the carbohydrate concentration was 3,452 mg/L, i.e., 4% of the total solid. The protein and carbohydrate concentrations align with those of the literature (Hui et al., 2022).
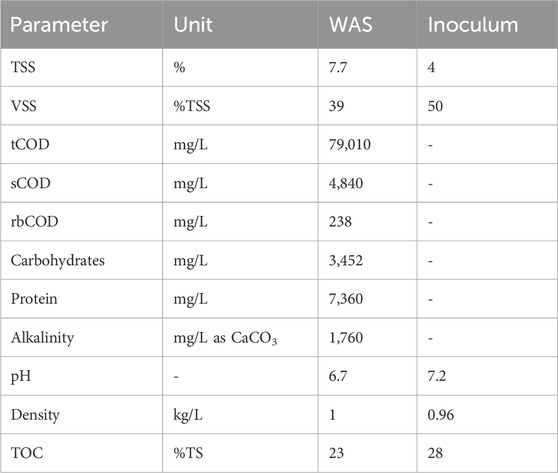
Table 2. Physical–chemical characterization of two times-diluted WAS.
The characterization of alkaline-pretreated WAS is shown in Figure 2 and Table 3. The pH of WAS increased from 6.7 to 11.4 upon increasing the dose of NaOH from 0.5% to 9% (Figure 2E). The pH increase is affected by the addition of NaOH and the production of VFA and acidity. Therefore, some alkalinity is used to neutralize the acidity. Solubilization of COD increased with an increase in the dose of alkaline pretreatment (Figure 2B). The maximum solubilized COD was 14 g/L at 9% NaOH concentration. The rate of rbCOD was slower after 1% NaOH concentration (Figure 2B). The ratios of rbCOD over sCOD were 0.23, 0.26, 0.18, 0.17, 0.15, and 0.13 for 0.5, 1, 3, 5, 7, and 9% alkaline pretreatment, respectively. It implies that the sCOD contained approximately 74%–87% refractory COD. The sCOD was 6.7, 7.4, 11.2, 13.2, 15, and 17.5% of the tCOD for 0.5, 1, 3, 5, 7, and 9% alkaline pretreatment, respectively. Alkaline pretreatment of WAS for 24 h with NaOH to adjust the pH to 8–14 solubilized 2%–33% of the COD (Wonglertarak and Wichitsathian, 2014), while the alkaline pretreatment of WAS for 3 h at 37°C with 2%–8% NaOH (g/gTS) had a maximum of 11% COD solubilization (Maryam et al., 2021). Similarly, COD solubilization was 18% at a pH of 12.5 when WAS from a pulp and paper WWTP was pretreated by NaOH for 30 min (Tyagi et al., 2014).
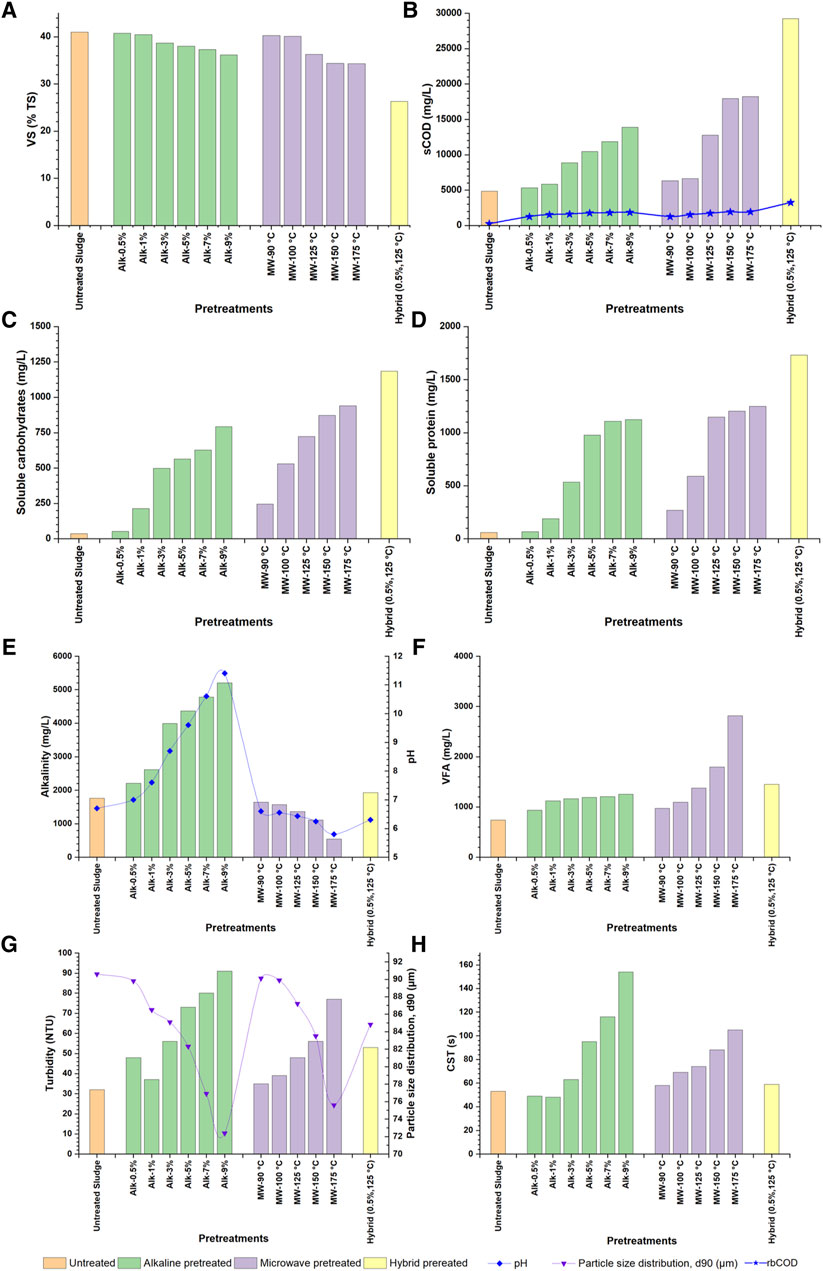
Figure 2. Effects of alkaline, microwave, and hybrid pretreatments on WAS; (A) VS degradation, (B) sCOD and rbCOD concentration, (C) soluble carbohydrate concentration, (D) soluble protein concentration, (E) pH profile and alkalinity concentration, (F) VFA concentrations, (G) particle size distribution and turbidity, and (H) capillary suction time (CST).
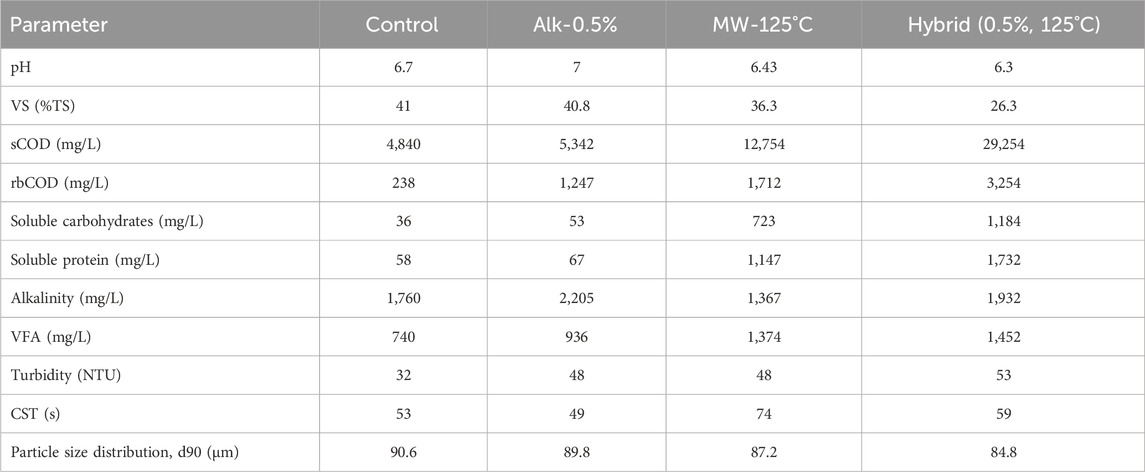
Table 3. Pretreated sludge properties of control, optimum NaOH and MW, and hybrid pretreatment.
The soluble protein of untreated sludge was 58 mg/L, approximately 1.5 times that of soluble carbohydrates (36 mg/L). The low concentration is because it was a dewatered sludge, and the dilution with distilled water could not solubilize the crude carbohydrate or protein of the sludge sample. However, soluble carbohydrates and protein increased with the increase in the dose of alkaline pretreatment, and the maximum soluble carbohydrates and proteins were 793 mg/L and 1,124 mg/L, respectively, at 9% alkaline pretreatment (Figures 2C, D), corresponding to 23% and 15% of the total carbohydrate and protein. The pretreatment of WAS by NaOH at pH 8–12.5 increased soluble carbohydrates and protein by increasing the pretreatment pH (Xiao et al., 2015). Soluble carbohydrates and proteins were approximately 970 and 110 mg/L after 1 h pretreatment at pH 12.5, respectively (Xiao et al., 2015). The solubility of carbohydrates and proteins ranged between 10%–45% and 11%–62%, respectively, when the sludge was pretreated at pH 12 for 30 min with different MW temperatures of 50°C–175°C (Tyagi et al., 2014). Alkalinity and VFA concentrations of untreated samples were 1,760 mg/L and 740 mg/L, respectively. The alkalinity increased with an increased dose of alkaline pretreatment (Figure 2E). However, the increase was higher in the lower dose of alkaline pretreatment than in the higher dose. This is because a part of alkalinity is consumed to naturalize the VFA concentration produced while pretreating sludge. Similarly, the VFA concentration increased rapidly at the lower dose of alkaline pretreatment compared to that at higher doses, owing to the naturalization of VFA by higher doses of alkaline pretreatment (Figure 2F).
The capillary suction time for the untreated sample was 53 s. Alkaline pretreatment of 0.5% and 1% did not change the CST significantly. However, further alkaline pretreatment increased the CST, and it was maximum (154 s) at 9% alkaline pretreatment (Figure 2H). The disintegration of the sludge matrix by alkaline pretreatment reduced the dewaterability (increased CST), owing to an increase in fine particles and, subsequently, an increase in bound water. The trend of CST fluctuation for alkaline pretreatment in this study is similar to that of the MW pretreatment of sludge carried out by Chang et al. (2011) and alkaline pretreatment (<0.2 mol/L) by Li et al. (2008). The improvement in dewaterability by high-dose alkaline pretreatment is due to the release of floc-confined and cell-contained water (Li et al., 2008).
The disintegration of sludge by alkaline pretreatment increases fine particles and turbidity. The turbidity increased from 32 to 154 as the dose of alkaline pretreatment increased (Figure 2G). The maximum turbidity was at 9% alkaline pretreatment. Particle size distribution values are associated with sludge disintegration and are correlated with turbidity and CST. The particle size distribution analysis showed that 90% of the particle size in the untreated sample was below 90.6 µm. On increasing the dose of alkaline pretreatment from 0.5% to 9%, the particle size reduced from 89.8 to 72.4 µm (d90) (Figure 2G). Particle size may decrease further with higher doses until re-flocculation occurs, for example, by an overdosed pretreatment of Ca(OH)2 (Li et al., 2008).
The corresponding energy consumptions were 3,280, 3,720, 4,920, 9,840, and 12,030 MJ/kg TS, respectively, for 90, 100, 125, 150, and 175°C. The MW pretreatment was superior than the alkaline pretreatment in terms of degradation of WAS, i.e., VS degradation, sCH, and sCOD (Figure 2 and Table 3). After MW pretreatment, the pH of the sample decreased below 6, dropping maximally at 175°C (Figure 2E). The pH drop is because of the degradation of organics to organic acids (VFA). The VS was degraded and solubilized into the liquid portion of the pretreated sample. The VS degradation was not much at below boiling temperature, but it increased at 125°C and was almost similar at 150°C and 175°C (Figure 2A). It implies that 150°C was the optimum temperature for VS degradation. However, some inhibitory compounds, such as melanoidin, may have formed due to the Maillard reaction.
sCOD due to MW pretreatment was higher than that of alkaline pretreatment (Figure 2B). The MW pretreatment at 175°C had almost 31% more sCOD than the 9% NaOH alkaline pretreatment. However, the rbCOD of the two pretreatment at the particular dose did not vary much (Figure 2B). The treatment at 175 °C had almost 6% more rbCOD than the 9% NaOH alkaline pretreatment. The sCOD of MW-pretreated sludge was from 6,310 to 18,226 mg/L, corresponding to 8%–23.1% of the tCOD (Figure 2B). The sCOD of the untreated sample was 4,840 mg/L (6.1% of the tCOD); hence, the MW pretreatment enhanced the solubilization of COD by 30.4%–297.8% compared to the sCOD of untreated sludge. MW pretreatment (96°C) of WAS increased COD solubilization by 3.6-fold (Eskicioglu et al., 2007), which is similar to solubilization induced by 175°C (3.8 folds) in this study. WAS pretreated by 14 MJ/kg TS microwave irradiation had a 21% increase in sCOD (Ebenezer et al., 2015), where the maximum increase was 17% (from 6% to 23%) in our study. MW pretreatment at 175°C solubilized 33% of the tCOD (Tyagi et al., 2014), which is approximately 10% higher when compared to the same MW pretreatment in our studies. The low sCOD could be due to the tCOD concentration, the sample’s moisture content, pretreatment time, and the efficiency of the microwaving apparatus.
With increased VS degradation by MW pretreatment, the solubility of carbohydrates and proteins increased. Soluble carbohydrates ranged from 246 to 941 mg/L (Figure 2C), and soluble proteins ranged from 268 to 1,248 mg/L (Figure 2D) when MW pretreatment at 90°C–175°C was applied. The carbohydrate and protein solubility was 27- and 17-fold compared to that of untreated sludge. Carbohydrate and protein solubility increased by 4.2 and 4.5 folds when waste-activated sludge (5% TS) was MW-pretreated at 96°C (Doğan and Sanin, 2009). On the other hand, MW pretreatment of sludge at 150°C had the highest carbohydrate and protein solubilization of 37% and 36%, respectively (Tyagi et al., 2014). The variation in the solubilized content of carbohydrates and proteins is mainly due to the WAS type and process of pretreatment. The carbohydrate solubility of 125°C and 9% NaOH was almost similar, while there was no significant variation in protein solubility for the alkaline and MW pretreatments.
Higher VS degradation contributed to VFA production, which decreased the pH and reduced the alkalinity (Figure 2E). Alkalinity was reduced by 7%–69% at different doses of MW pretreatment (90°C–175°C) compared to that of untreated sludge. On the other hand, the VFA concentration was higher by 32%–280% than that in the untreated sludge sample due to MW pretreatment (Figure 2F). MW pretreatment had higher VS degradation and solubilization by disintegrating the sludge matrix than alkaline pretreatment. However, the turbidity of MW-pretreated samples was still lesser than that of alkaline-pretreated samples (Figure 2G). It indicates that MW pretreatment solubilizes organic matter without reducing the particle size to colloids compared to alkaline pretreatment, where the cell structure swelled and the particle sizes reduced. Therefore, the dewaterability in terms of CST of MW pretreatment is comparatively improved (Figure 2H). The same phenomena affected the particle size distribution of MW-pretreated samples, where the particle size is comparatively coarser than in alkaline-pretreated samples (Figure 2G).
The hybrid pretreatment, i.e., alkaline pretreatment (0.5% NaOH) and MW pretreatment (125°C), was applied on WAS since the two pretreatments had enhanced biogas production in their respective pretreatment category. The analysis of the pretreated sample showed a synergic effect when compared to mono-pretreatments (Figure 2 and Table 3). VS was degraded by 36% in hybrid pretreatment (Figure 2A), while in only alkaline pretreatment (0.5% NaOH), it was 0.5%, and in only MW pretreatment (125°C), it was 12%. The sCOD was 37% (29,254 mg/L) of the tCOD, while in mono alkaline pretreatment and mono MW pretreatment, it was 7% (5,342 mg/L) and 16% (12,754 mg/L), respectively. Thermal alkaline pretreatment of WAS at 600 W and pH 12 (NaOH) had 46% COD solubilization, while in mono alkaline and mono MW pretreatment, sCOD were 18% and 9%, respectively (Chang et al., 2011). Microwave-assisted pretreatment (250 W, 24% alkaline) had a 45% disintegration degree value when the TS% of the sample was 13 (Shi et al., 2015). Pretreatment of WAS with 20 meq NaOH/L and microwave irradiation at 135°C for 10 min increased the sCOD from 3% to 53% (Jang and Ahn, 2013). The higher value of COD solubilization in the literature is due to high alkaline pretreatment, sludge TS%, and the degradable nature of the WAS.
Along with high COD solubilization, carbohydrates and protein were significantly released (1,184 mg/L and 1,732 mg/L, respectively) by the hybrid pretreatment compared to mono pretreatments (Figure 2). The low alkalinity due to MW pretreatment increased from 1,374 to 1,932 mg/L by incorporating alkaline pretreatment (Figure 2E). However, the VFA concentration was increased in hybrid pretreatment (but at a lower rate) since the degradation was higher than in mono pretreatments (Figure 2F). The turbidity of hybrid-pretreated sludge was increased compared to the respective mono pretreatment due to degradation and solubilization (Figure 2G), hence increasing the colloidal portion of the sample. Therefore, the average particle size distribution decreased to 84.8 µm simultaneously (Figure 2G). However, dewaterability improved (59 s) by 20% compared to MW pretreatment (Figure 2H).
The biogas production peaked in the first 4 days of AD due to the availability of rbCOD. The maximum daily biogas production was in Alk-0.5% (0.5% NaOH g/gTS)-pretreated BMP assay, followed by Alk-3% (3% NaOH g/gTS)-pretreated BMP assay (Figure 3B). The maximum daily biogas production was 21 mL/gVS added in Alk-0.5% assay and 9 mL/gVS added in the untreated sample (control) assay, while for the other assays, it was below 12 mL/gVS added (Figure 3B). Although the concentration of rbCOD was higher in the higher alkaline-pretreated sludge, biogas production was higher in the lower dose of alkali. This could be because the higher doses of Na+ restrict the production of typical biogas. Figure 3A shows the accumulative biogas yield for the AD of the alkaline-pretreated WAS. The control BMP assay produced 84 mL/gVS added biogas, while Alk-0.5% produced 163 mL/gVS added, i.e., 94% higher biogas than the control BMP assay. The other BMP assays resulted in lower or equal biogas production than the control BMP assay. The lower biogas production could be due to the unavailability of rbCOD and the high concentration of NaOH, affecting both the microorganisms of the inoculum and compounds in the sludge matrix.
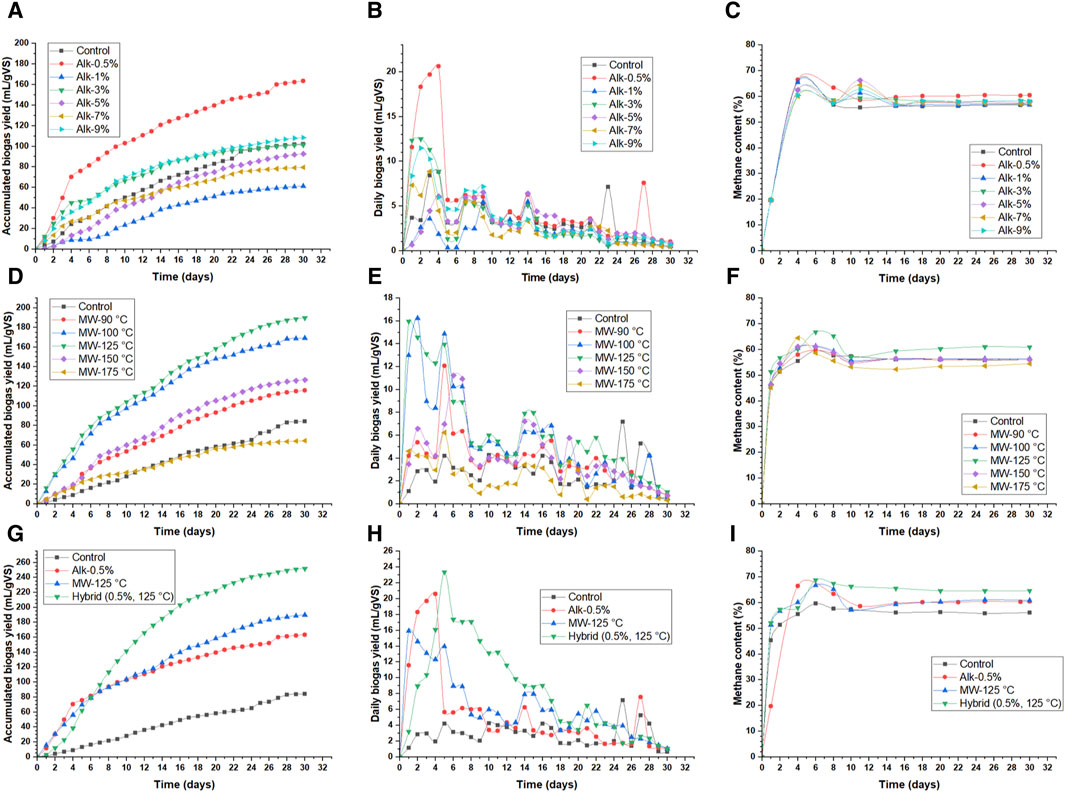
Figure 3. Biogas production: alkaline-pretreated WAS: (A) accumulative biogas yield, (B) daily biogas yield, and (C) methane content; microwave-pretreated WAS: (D) accumulative biogas yield, (E) daily biogas yield, and (F) methane content; control, optimum alkaline (Alk-0.5%) and MW-pretreated (MW-125°C), and hybrid-pretreated WAS: (G) accumulative biogas yield, (H) daily biogas yield, and (I) methane content.
However, the alkaline pretreatment enhanced the methane content of biogas. The highest enhancement was noticed in the Alk-0.5% BMP assay with 66.4% CH4 content, followed by Alk-5% (Figure 3C) with 66% CH4 content on day 10. Among many factors affecting the methane content, one could be the sequestration of CO2, owing to a highly alkaline environment. The methane yield increased by 37% and 50% when waste-activated sludge was pretreated for 3 h at 37°C with 2 and 4% NaOH (g/gTS) concentrations, respectively (Maryam et al., 2021). The methane yield of untreated sludge was 146.3 mL/gVS (Wang et al., 2019). When the sludge was pretreated with 14% CaO (g/gVS) for 48 h, the methane yield increased by 48%–216 mL/gVS (Wang et al., 2019).
Figure 3E shows the daily biogas production of MW-pretreated WAS. The maximum daily biogas production started on day 2 and continued until day 5 due to the availability of readily biodegradable organics. The maximum daily biogas production was for MW-125°C and MW-100°C, i.e., 16 mL/gVS added (Figure 3E). All MW-pretreated BMP assays had higher maximum daily biogas production than the control assay. However, the average daily biogas production of MW-175°C was less than that of the control. The BMP assay was continued for 30 days to compare with the BMP assay of alkaline-pretreated sludge. Figure 3D shows the accumulative biogas production of MW-pretreated WAS. The control assay produced 84 mL/gVS added, while MW-125°C resulted in the highest biogas production of 190 mL/gVS added in the MW-pretreated category, followed by MW-100°C (170 mL/gVS added). The MW pretreatment resulted in 125, 101, 50, 37, and −24% higher biogas, respectively, in MW-125°C, MW-100°C, MW-150°C, MW-90°C, and MW-175°C, when compared to untreated WAS. The reduced biogas production in MW-175°C could be due to the Maillard reaction forming inhibitory compounds, such as melanoidin. The increase in biogas production in the BMP batch assay of MW-pretreated WAS is higher compared to that in alkaline-pretreated WAS, although the rbCOD of the two pretreatments are almost similar. However, the sCOD concentration of the MW-pretreated sludge was higher compared to that of alkaline-pretreated sludge. Higher sCOD facilitated enhanced and increased bio-degradation of the WAS matrix during AD, owing to the swelling effect from MW pretreatment. The maximum methane content of MW-pretreated BMP assays ranged between 59.7% and 66.8%, with MW-125°C having a peak methane content of 66.8% on day 6 (Figure 3F). The AD of MW-pretreated (at 96°C) sludge for 19 days at 33°C under the batch operation mode resulted in 20% higher biogas production than untreated sludge (Eskicioglu et al., 2007). WAS from a dairy WWTP was MW-pretreated with 70% intensity for 12 min in the microwave facility having 1,450 W capacity (Rani et al., 2013). The AD of pretreated sludge in the batch operation mode for 30 days had 35% higher biogas production than untreated sludge, while in the semi-continuous operation mode with HRT of 15 days, the AD resulted in 57% increased biogas yield when compared to that of the control at the same operation mode (Rani et al., 2013). The difference in enhancement of biogas yield is due to the pretreatment temperature, AD temperature, HRT, operation mode, etc.
The maximum daily biogas production of the hybrid-pretreated (Alk-0.5% + MW-125°C) sample was 23.4 mL/gVS added on day 5 (Figure 3H), which was the highest when compared to Alk-0.5% and MW-125°C. The accumulative biogas yield of hybrid-pretreated sludge was 252 mL/gVS added (Figure 3G), i.e., 198% higher biogas production than that of the control, 33% higher than MW-125°C, and 55% higher than Alk-0.5%. The peak methane content of hybrid-pretreated waste-activated sludge was 68.7% on day 6 (Figure 3I), i.e., 3% higher than MW-125°C and Alk-0.5%. WAS pretreated with 12% NaOH (g/gTS) and 240 W irradiation for 10 min resulted in a 4.6-fold increased methane yield under mesophilic AD for 10 days compared to that of untreated sludge (Jiang et al., 2018). The methane yield increased by 27% in batch assay and 13% in the semi-continuous operation mode when waste-activated sludge was pretreated by microwave at 170°C and 5% NaOH (g/gTS) under thermophilic AD (Chi et al., 2011).
Anaerobic digestion encompasses various microorganisms at the hydrolysis, acidogenesis, acetogenesis, and methanogenesis steps to degrade and bio-convert organic wastes to biogas concurrently. Microorganism diversity and abundance are affected by feedstock, AD processing parameters and temperature, pretreatment, and supplementation of accelerants. Archaeal analysis was performed to gain insights into the methanogenic archaea composition and abundance of digestate from the pretreated sludge. The increased methane yield and composition are closely correlated with the methanogenic archaea community structure (Wang and Li, 2016). Taxonomic profiling at different levels of phylum, class, order, family, and genus for the digestate of control and alkali-, microwave-, and hybrid-pretreated sludge are illustrated in Figure 4.
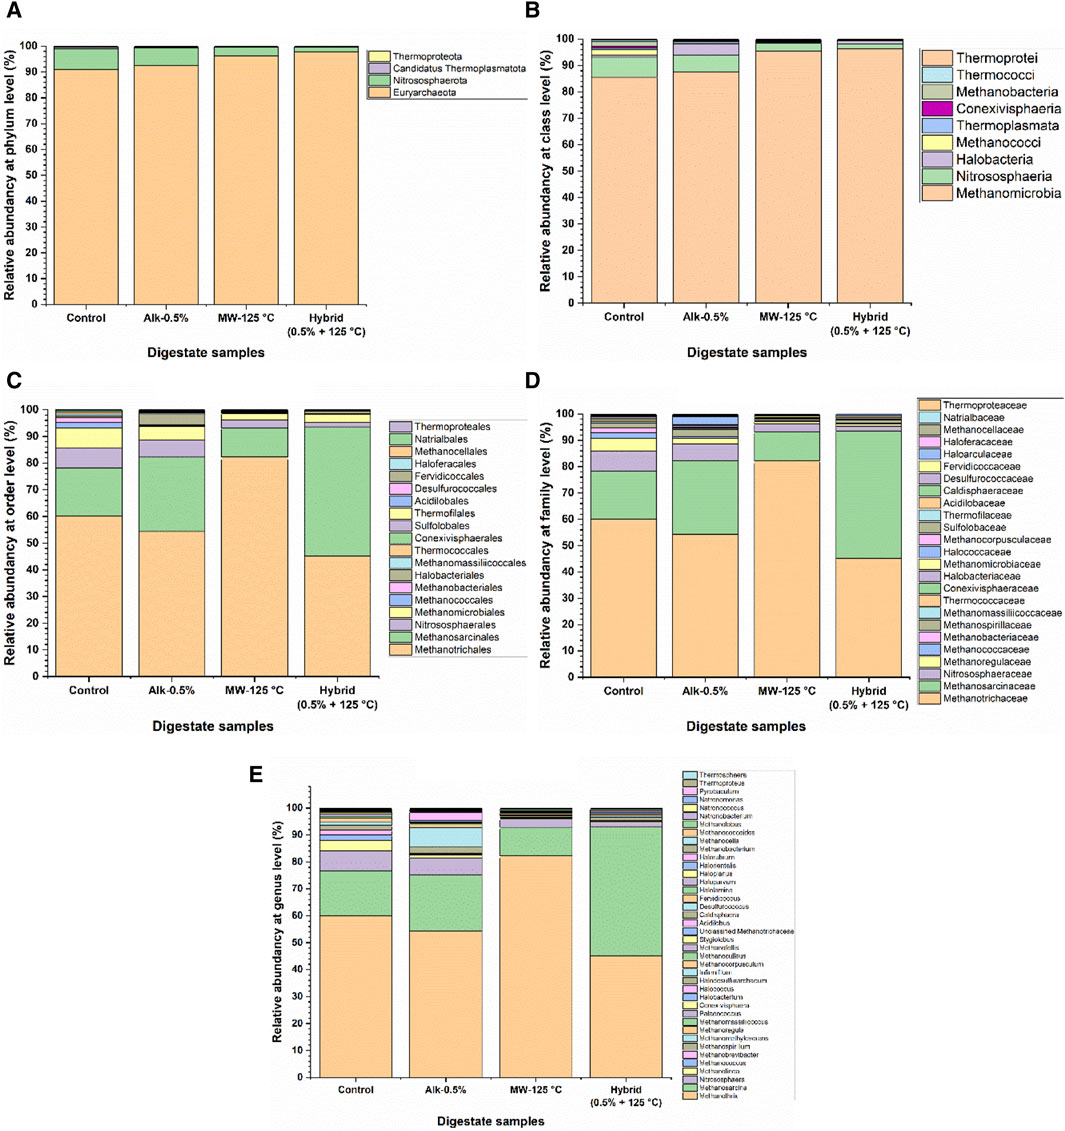
Figure 4. Taxonomic profiling of alkali-, microwave-, and hybrid-pretreated sludge and control at different levels of (A) phylum, (B) class, (C) order, (D) family, and (E) genus.
The archaeal phylum of Euryarchaeota was dominant in all digestate samples (>90%), while Methanomicrobia was dominant (>85.6%) at the class level, followed by Nitrososphaeria (<7.5%), an ammonia-oxidizing Crenarchaeota. At the order level, Methanotrichales was 60% of the microorganism’s community in the control digestate. The abundance of Methanotrichales decreased at alkaline pretreatment (54.3%), increased at MW pretreatment (82.3%), and again decreased at hybrid pretreatment (45.1%). In contrast, the abundance of Methanosarcinales, an acetoclastic methanogen converting acetate into CH4 and CO2, increased from 18% in the control to 48.5% in the hybrid-pretreated digestate, with Methanosarcinaceae as the dominant Archaean at the family level. At the genus level, Methanothrix, an acetoclastic methanogen, and Methanosarcina, a methanogen capable of using all three metabolic pathways for methanogenesis, were 59.9% and 16.7%, respectively, in the control. Methanothrix’s relative abundance altered to 54.3, 52.3, and 45% at the alkaline, MW, and hybrid pretreatments, respectively, while the Methanosarcina abundance transformed to 20.7, 10.5, and 47.8%, respectively. The top 10 microbial community enrichment at the genus level for all digestate samples are shown in Figure 5. Microbial community analysis endorsed improved methane yield and content in alkaline pretreatment due to increased Methanothrix, MW pretreatment due to an upsurge in Methanosarcina, and hybrid pretreatment due to equal contribution of both categories.
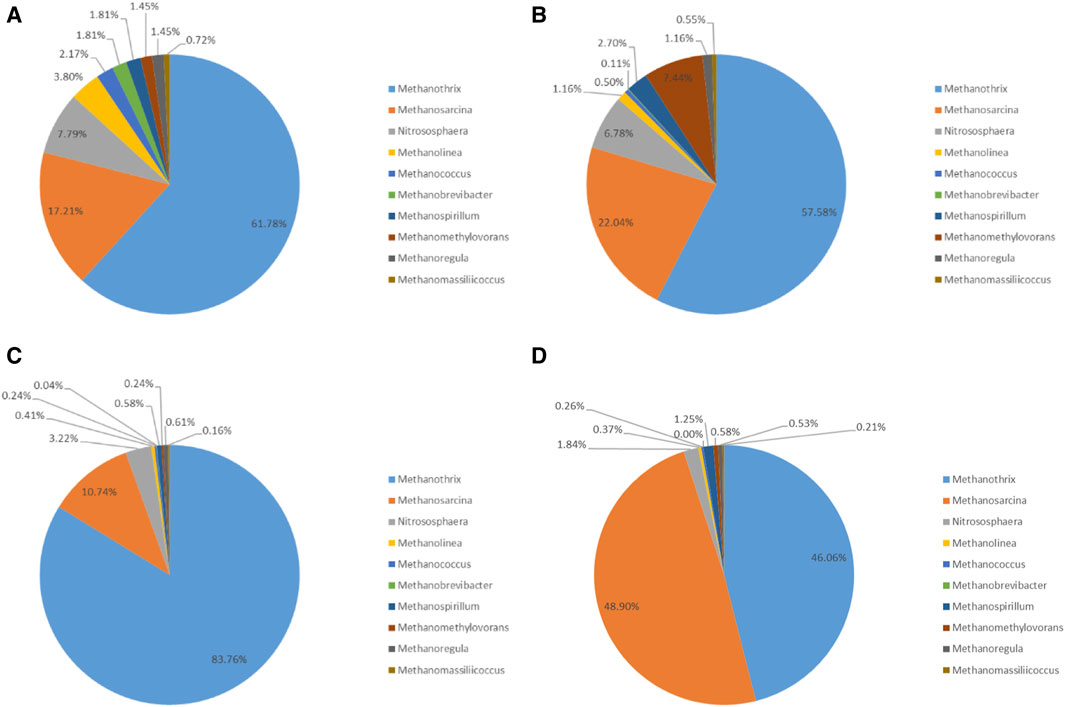
Figure 5. Top 10 microbial community enrichment at the genus level for (A) control, (B) alkaline, (C) microwave, and (D) hybrid pretreatments.
A heat map of the top 40 microorganisms at the genus level was prepared to compare the effect of the pretreatment in the final microbial community of the digestate samples (Figure 6A). Unit variance scaling is applied to sequence abundance. Moreover, the microbial diversity via the Chao1 method Chao (1984) showed less diversity in the control and high diversity in the pretreated samples, especially the MW-pretreated samples (Figures 6B, C). It confirms that pretreatment changed the microbial community, involving different microorganisms to improve the methane yield and content.
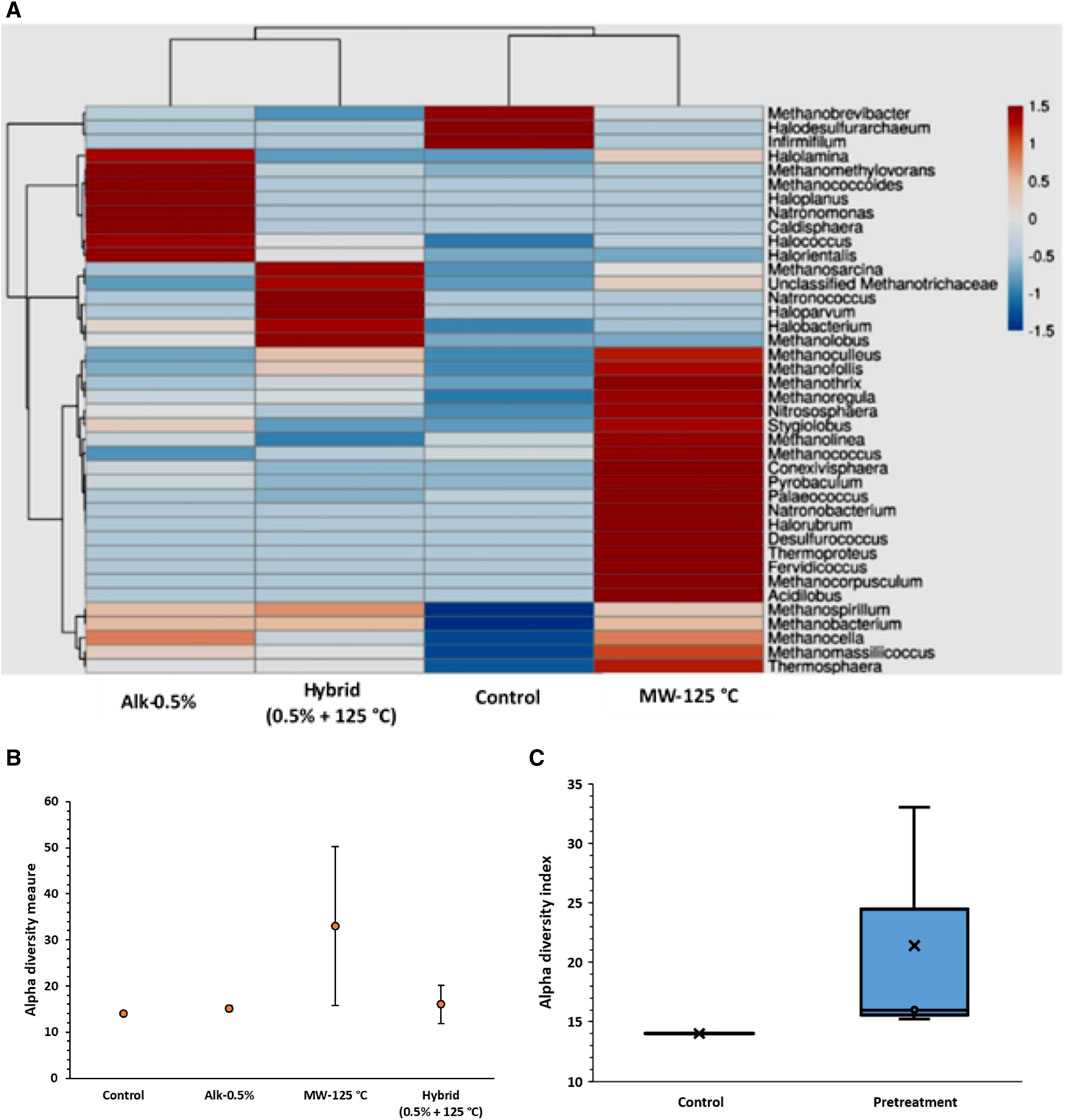
Figure 6. (A) Heatmap of control and pretreated digestate samples (genus level), (B) alpha diversity measure, and (C) alpha diversity index.
The experimental data on the alkaline-pretreated, MW-pretreated, and hybrid-pretreated BMP assays were compared with the modified Gompertz model. MG is a well-established model for steady anaerobic digestion. Based on the experimental data, the model also estimates the lag phase (β) and the maximum daily biogas production (Ym) of the AD process (Table 4). Therefore, their comparison would allow us to know how well the AD process for the pretreated sludge was performed. Moreover, the kinetic constant of the experimental data was estimated using the first-order model.
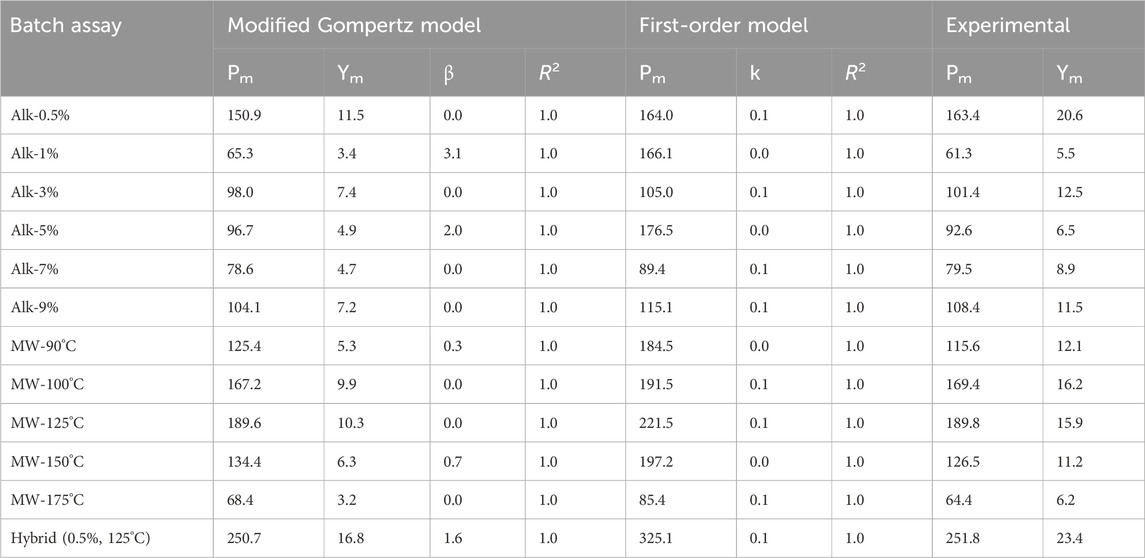
Table 4. Kinetic estimation of alkaline-, microwave-, and hybrid-pretreated BMP assays using modified Gompertz and first-order models.
Pm estimates were very close to the experimental data, especially for MW-125°C and hybrid-pretreated BMP assays (Table 4). However, the maximum daily biogas yield estimation deviated from the experimental data significantly (38%–126%) compared to the accumulated biogas yield (±8.2%). Estimation of the lag phase in the AD process was in parallel with the experimental data, with slightly longer lag phases. A negligible lag phase for the control and alkaline-pretreated BMP assays is estimated by the models. It could be because of the availability of rbCOD and the use of an acclimatized and active inoculum. AD of MW-pretreated sludge reduced the lag phase by 42%, decreasing it from 1.6 to 0.93 days (Rani et al., 2013). The kinetic constant, which indicates the biodegradation of the organics in an anaerobic environment, ranged from 0.02 to 0.1. Alk-0.5% and Alk-3% had the highest kinetic constant of 0.1, while the estimation of the kinetic for MW-125°C and the hybrid was 0.06. The estimation of the biogas production by the first-order model was more than the experimental data and those estimated by the MG model. However, the best estimation was for Alk-0.5%. The coefficient of determination for the two models ranged from 0.95 to 1, which indicates a very well fitting of the experimental data and the estimations of the model. The graph fitting of the alkaline-pretreated and microwave-pretreated BMP assays with the MG model is shown in Figures 7A, B, respectively.
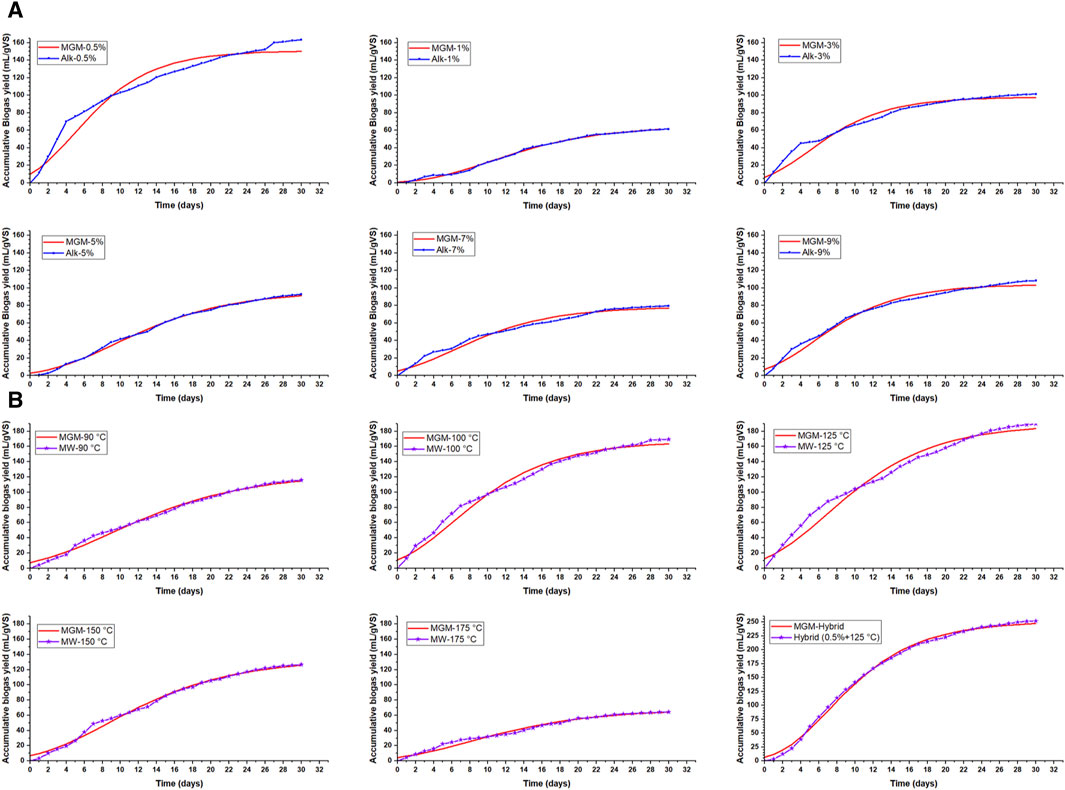
Figure 7. Graph fitting: (A) of alkaline-pretreated BMP assays and (B) microwave- and hybrid-pretreated BMP assays with the modified Gompertz model (MGM).
The parameters associated with the characterization of WAS after alkaline, microwave, and hybrid pretreatment are analyzed via principal component analysis (PCA) to determine their correlation with the pretreatment temperature, alkaline doses, and biogas production. Minitab 17 was used to estimate the correlation and decrease the dimension to two principal components, which collectively explain 83.5% of the variance in the data. The contribution of each parameter to the two major components is shown in Figure 8A. COD, carbohydrate, and protein solubility have extensive positive loading on the first component, while the particle size distribution and biogas production have large negative loading on the second component. The angle between the parameters in the loading plot indicates their correlation (Kim et al., 2022). The smaller angle between the parameters determines a closer correlation than wider angles. For example, the turbidity and CST had a very close correlation (Figure 8A).
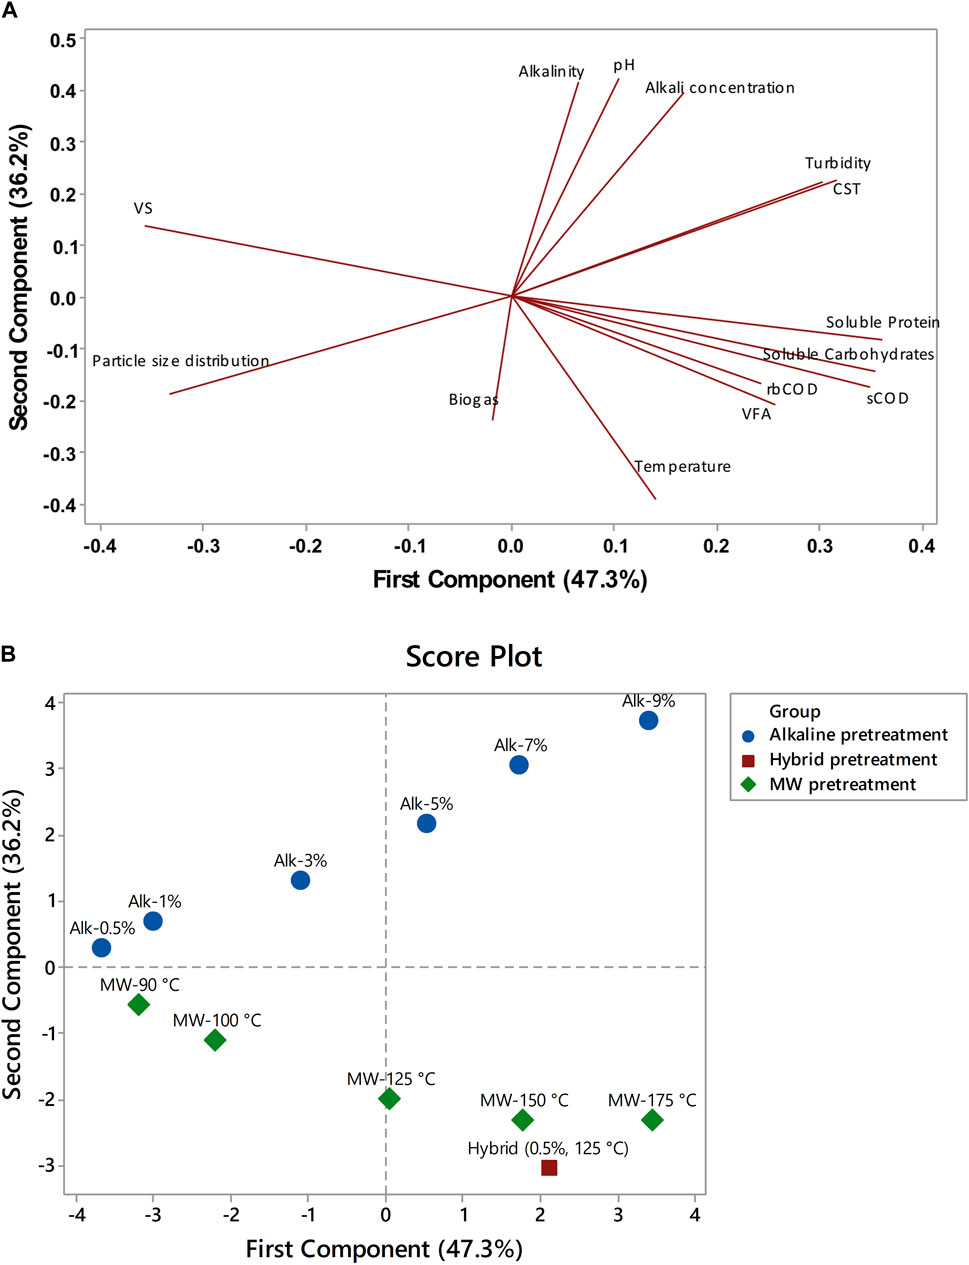
Figure 8. Principle component analysis; (A) loading plot and (B) score plot.
Moreover, biogas production is closely correlated with pretreatment temperature, VFA production, rbCOD, sCOD, and soluble carbohydrates and protein. Figure 8B shows the score plot of different parameters on the first two major components. It shows the pattern of the negative contribution of MW pretreatment on the second component and the positive contribution of alkaline pretreatment on the second component. On the other hand, lower alkali doses (<5% NaOH) and temperature (<125°C) had a negative contribution to the first component. In contrast, the rest of the alkali doses and temperatures positively contributed to the first component. However, the hybrid pretreatment has a negative contribution to the second component and a positive contribution to the first component.
Waste-activated sludge was pretreated by alkali (0.5%–9% NaOH), MW (90°C–175°C), and hybrid (0.5% NaOH and MW at 125°C) to enhance solubilization and biogas production. Overall, the solubilization of COD, carbohydrate, and protein was significant in the order of hybrid (37, 34, and 24%), MW (23, 27, and 17%), and alkaline (18, 23, and 15%) pretreatment, respectively. Turbidity (53 NTU) and particle size (d90, 84.8 µm) were highly deteriorated in hybrid pretreatment compared to that in other pretreatments, while CST (59 s) was comparatively improved than that in MW pretreatment. Here, 0.5% NaOH, 125°C, and 0.5% NaOH+125°C were the optimum alkaline, MW, and hybrid pretreatments, respectively. Their AD resulted in 94, 125, and 199% higher biogas yield than control. Microbial abundance and diversity were improved in AD after pretreatment of WAS, enriching hydrogenotrophic and acetoclastic methanogen growth. Methanosarcina abundances were 17, 21, 11, and 48% in the control, alkaline-, MW-, and hybrid-pretreated digestate, respectively. The modified Gompertz model fitted the BMP assay data with a coefficient of determination beyond 0.95. Biogas yield is closely correlated with pretreatment temperature, VFA production, rbCOD, sCOD, and soluble carbohydrates and protein.
The datasets presented in this study can be found in online repositories. The names of the repository/repositories and accession number(s) can be found in the article/Supplementary Material.
AA: conceptualization, data curation, formal analysis, methodology, validation, writing–original draft, and writing–review and editing. FM: supervision and writing–review and editing. AK: supervision and writing–review and editing.
The author(s) declare that no financial support was received for the research, authorship, and/or publication of this article.
The authors extend their appreciation to the Deanship of the College of Engineering and the Department of Civil Engineering at King Saud University, Riyadh, for facilitating this doctoral thesis work of the first author.
The authors declare that the research was conducted in the absence of any commercial or financial relationships that could be construed as a potential conflict of interest.
The reviewer MM declared a shared affiliation with the author AK to the handling editor at the time of review.
All claims expressed in this article are solely those of the authors and do not necessarily represent those of their affiliated organizations, or those of the publisher, the editors, and the reviewers. Any product that may be evaluated in this article, or claim that may be made by its manufacturer, is not guaranteed or endorsed by the publisher.
Alqaralleh, R. M., Kennedy, K., and Delatolla, R. (2019). Microwave vs. alkaline-microwave pretreatment for enhancing Thickened Waste Activated Sludge and fat, oil, and grease solubilization, degradation and biogas production. J. Environ. Manag. 233, 378–392. doi:10.1016/j.jenvman.2018.12.046
APHA (2017). Standard methods for the examination of water and wastewater. 23ed. Washington, DC: American Public Health Association.
Chang, C. J., Tyagi, V. K., and Lo, S. L. (2011). Effects of microwave and alkali induced pretreatment on sludge solubilization and subsequent aerobic digestion. Bioresour. Technol. 102 (17), 7633–7640. doi:10.1016/j.biortech.2011.05.031
Chao, A. (1984). Non-parametric estimation of the number of classes in a population. Scand. J. Stat. 11, 265–270.
Charnier, C., Latrille, E., Jimenez, J., Lemoine, M., Boulet, J. C., Miroux, J., et al. (2017). Fast characterization of solid organic waste content with near infrared spectroscopy in anaerobic digestion. Waste Manag. 59, 140–148. doi:10.1016/j.wasman.2016.10.029
Chi, Y., Li, Y., Fei, X., Wang, S., and Yuan, H. (2011). Enhancement of thermophilic anaerobic digestion of thickened waste activated sludge by combined microwave and alkaline pretreatment. J. Environ. Sci. 23 (8), 1257–1265. doi:10.1016/s1001-0742(10)60561-x
DiLallo, R., and Albertson, O. E. (1961). Volatile acids by direct titration. J. Water Pollut. Control Fed. 356–365.
Doğan, I., and Sanin, F. D. (2009). Alkaline solubilization and microwave irradiation as a combined sludge disintegration and minimization method. Water Res. 43 (8), 2139–2148. doi:10.1016/j.watres.2009.02.023
Dreywood, R. (1946). Qualitative test for carbohydrate material. Industrial Eng. Chem. Anal. Ed. 18 (8), 499. doi:10.1021/i560156a015
Ebenezer, A. V., Arulazhagan, P., Kumar, S. A., Yeom, I. T., and Banu, J. R. (2015). Effect of deflocculation on the efficiency of low-energy microwave pretreatment and anaerobic biodegradation of waste activated sludge. Appl. Energy 145, 104–110. doi:10.1016/j.apenergy.2015.01.133
Eskicioglu, C., Droste, R. L., and Kennedy, K. J. (2007). Performance of anaerobic waste activated sludge digesters after microwave pretreatment. Water Environ. Res. 79 (11), 2265–2273. doi:10.2175/106143007x176004
Fu, Q., Wang, D., Li, X., Yang, Q., Xu, Q., Ni, B. J., et al. (2021). Towards hydrogen production from waste activated sludge: principles, challenges and perspectives. Renew. Sustain. Energy Rev. 135, 110283. doi:10.1016/j.rser.2020.110283
Gahlot, P., Ahmed, B., Tiwari, S. B., Aryal, N., Khursheed, A., Kazmi, A. A., et al. (2020). Conductive material engineered direct interspecies electron transfer (DIET) in anaerobic digestion: mechanism and application. Environ. Technol. Innovation 20, 101056. doi:10.1016/j.eti.2020.101056
Hui, W., Zhou, J., and Jin, R. (2022). Proteins recovery from waste activated sludge by thermal alkaline treatment. J. Environ. Chem. Eng. 10 (2), 107311. doi:10.1016/j.jece.2022.107311
Jang, J. H., and Ahn, J. H. (2013). Effect of microwave pretreatment in presence of NaOH on mesophilic anaerobic digestion of thickened waste activated sludge. Bioresour. Technol. 131, 437–442. doi:10.1016/j.biortech.2012.09.057
Jiang, H., Liu, T., Ding, J., Nie, H., and Zhou, H. (2018). Optimization and performance of moderate combined alkali and microwave pretreatment for anaerobic digestion of waste-activated sludge. Pol. J. Environ. Stud. 27 (2), 689–697. doi:10.15244/pjoes/76138
Jiang, L., Shen, Q., Zhang, Q., Zeng, Y., Wang, W., Mao, Y., et al. (2021). Microwave-alkali treatment with water elutriation to enhance waste activated sludge solubilization for carbon sources and nutrients recovery. Chem. Eng. J. 421, 129727. doi:10.1016/j.cej.2021.129727
Khursheed, A., Gaur, R. Z., Sharma, M. K., Tyagi, V. K., Khan, A. A., and Kazmi, A. A. (2018). Dependence of enhanced biological nitrogen removal on carbon to nitrogen and rbCOD to sbCOD ratios during sewage treatment in sequencing batch reactor. J. Clean. Prod. 171, 1244–1254. doi:10.1016/j.jclepro.2017.10.055
Kim, J., Yu, Y., and Lee, C. (2013). Thermo-alkaline pretreatment of waste activated sludge at low-temperatures: effects on sludge disintegration, methane production, and methanogen community structure. Bioresour. Technol. 144, 194–201. doi:10.1016/j.biortech.2013.06.115
Kim, M., Chul, P., Kim, W., and Cui, F. (2022). Application of data smoothing and principal component analysis to develop a parameter ranking system for the anaerobic digestion process. Chemosphere 299, 134444. doi:10.1016/j.chemosphere.2022.134444
Li, H., Jin, Y., Mahar, R., Wang, Z., and Nie, Y. (2008). Effects and model of alkaline waste activated sludge treatment. Bioresour. Technol. 99 (11), 5140–5144. doi:10.1016/j.biortech.2007.09.019
Lowry, O. H., Rosebrough, N. J., Farr, A. L., and Randall, R. J. (1951). Protein measurement with the Folin phenol reagent. J. Biol. Chem. 193 (1), 265–275. doi:10.1016/s0021-9258(19)52451-6
Maryam, A., Badshah, M., Sabeeh, M., and Khan, S. J. (2021). Enhancing methane production from dewatered waste activated sludge through alkaline and photocatalytic pretreatment. Bioresour. Technol. 325, 124677. doi:10.1016/j.biortech.2021.124677
Paritosh, K., Mathur, S., Pareek, N., and Vivekanand, V. (2018). Feasibility study of waste (d) potential: co-digestion of organic wastes, synergistic effect and kinetics of biogas production. Int. J. Environ. Sci. Technol. 15, 1009–1018. doi:10.1007/s13762-017-1453-5
Rahmani, A. M., Gahlot, P., Moustakas, K., Kazmi, A. A., Ojha, C. S. P., and Tyagi, V. K. (2022). Pretreatment methods to enhance solubilization and anaerobic biodegradability of lignocellulosic biomass (wheat straw): progress and challenges. Fuel 319, 123726. doi:10.1016/j.fuel.2022.123726
Rani, R. U., Kumar, S. A., Kaliappan, S., Yeom, I., and Banu, J. R. (2013). Impacts of microwave pretreatments on the semi-continuous anaerobic digestion of dairy waste activated sludge. Waste Manag. 33 (5), 1119–1127. doi:10.1016/j.wasman.2013.01.016
Shi, X., Deng, L., Sun, F., Liang, J., and Deng, X. (2015). Key factors governing alkaline pretreatment of waste activated sludge. Chin. J. Chem. Eng. 23 (5), 842–846. doi:10.1016/j.cjche.2014.09.049
Toutian, V., Barjenbruch, M., Loderer, C., and Remy, C. (2020). Pilot study of thermal alkaline pretreatment of waste activated sludge: seasonal effects on anaerobic digestion and impact on dewaterability and refractory COD. Water Res. 182, 115910. doi:10.1016/j.watres.2020.115910
Tyagi, V. K., Lo, S. L., and Rajpal, A. (2014). Chemically coupled microwave and ultrasonic pre-hydrolysis of pulp and paper mill waste-activated sludge: effect on sludge solubilisation and anaerobic digestion. Environ. Sci. Pollut. Res. 21, 6205–6217. doi:10.1007/s11356-013-2426-y
Wang, D., He, D., Liu, X., Xu, Q., Yang, Q., Li, X., et al. (2019). The underlying mechanism of calcium peroxide pretreatment enhancing methane production from anaerobic digestion of waste activated sludge. Water Res. 164, 114934. doi:10.1016/j.watres.2019.114934
Wang, J., and Li, Y. (2016). Synergistic pretreatment of waste activated sludge using CaO2 in combination with microwave irradiation to enhance methane production during anaerobic digestion. Appl. Energy 183, 1123–1132. doi:10.1016/j.apenergy.2016.09.042
Wentzel, M. C., Mbewe, A., Lakay, M. T., and Ekama, G. A. (2001). Evaluation of a modified flocculation filtration method to determine wastewater readily biodegradable COD. Chem. TECHNOLOGY-BEDFORDVIEW-, 21–23.
Wonglertarak, W., and Wichitsathian, B. (2014). Alkaline pretreatment of waste activated sludge in anaerobic digestion. J. Clean Energy Technol. 2 (2), 118–121. doi:10.7763/jocet.2014.v2.104
Wu, D., Sun, F., Chua, F. J. D., Lu, D., Stuckey, D. C., and Zhou, Y. (2019). In-situ power generation and nutrients recovery from waste activated sludge–Long-term performance and system optimization. Chem. Eng. J. 361, 1207–1214. doi:10.1016/j.cej.2019.01.001
Xiao, B., Liu, C., Liu, J., and Guo, X. (2015). Evaluation of the microbial cell structure damages in alkaline pretreatment of waste activated sludge. Bioresour. Technol. 196, 109–115. doi:10.1016/j.biortech.2015.07.056
Yu, L., Zhang, W., Liu, H., Wang, G., and Liu, H. (2018). Evaluation of volatile fatty acids production and dewaterability of waste activated sludge with different thermo-chemical pretreatments. Int. Biodeterior. Biodegrad. 129, 170–178. doi:10.1016/j.ibiod.2018.02.008
Keywords: waste-activated sludge, pretreatment, anaerobic digestion, modified Gompertz model, microbial genome sequencing
Citation: Almegbl AM, Munshi F and Khursheed A (2024) Synergic effect of thermo-chemical pretreatment of waste-activated sludge on bio-methane enhancement. Front. Environ. Sci. 12:1419102. doi: 10.3389/fenvs.2024.1419102
Received: 17 April 2024; Accepted: 25 June 2024;
Published: 16 July 2024.
Edited by:
Kazuya Shimizu, Toyo University, JapanReviewed by:
Mohd Salim Mahtab, AMU, IndiaCopyright © 2024 Almegbl, Munshi and Khursheed. This is an open-access article distributed under the terms of the Creative Commons Attribution License (CC BY). The use, distribution or reproduction in other forums is permitted, provided the original author(s) and the copyright owner(s) are credited and that the original publication in this journal is cited, in accordance with accepted academic practice. No use, distribution or reproduction is permitted which does not comply with these terms.
*Correspondence: A. Khursheed, YWFobWFkNEBrc3UuZWR1LnNh
Disclaimer: All claims expressed in this article are solely those of the authors and do not necessarily represent those of their affiliated organizations, or those of the publisher, the editors and the reviewers. Any product that may be evaluated in this article or claim that may be made by its manufacturer is not guaranteed or endorsed by the publisher.
Research integrity at Frontiers
Learn more about the work of our research integrity team to safeguard the quality of each article we publish.